
94% of researchers rate our articles as excellent or good
Learn more about the work of our research integrity team to safeguard the quality of each article we publish.
Find out more
ORIGINAL RESEARCH article
Front. Immunol., 22 November 2022
Sec. Alloimmunity and Transplantation
Volume 13 - 2022 | https://doi.org/10.3389/fimmu.2022.1039013
This article is part of the Research TopicRole of the Immune System in Renal Transplantation: Importance, Mechanism, and TherapyView all 12 articles
 Qidan Pang1†
 Hong Chen2†Hang Wu1†Yong Wang2Changyong An2Suhe Lai2Jia Xu1Ruiqiong Wang1Juan Zhou1*
 Hanyu Xiao2*
Objective: The role of m6A modification in kidney transplant-associated immunity, especially in alloimmunity, still remains unknown. This study aims to explore the potential value of m6A-related immune genes in predicting graft loss and diagnosing T cell mediated rejection (TCMR), as well as the possible role they play in renal graft dysfunction.
Methods: Renal transplant-related cohorts and transcript expression data were obtained from the GEO database. First, we conducted correlation analysis in the discovery cohort to identify the m6A-related immune genes. Then, lasso regression and random forest were used respectively to build prediction models in the prognosis and diagnosis cohort, to predict graft loss and discriminate TCMR in dysfunctional renal grafts. Connectivity map (CMap) analysis was applied to identify potential therapeutic compounds for TCMR.
Results: The prognostic prediction model effectively predicts the prognosis and survival of renal grafts with clinical indications (P< 0.001) and applies to both rejection and non-rejection situations. The diagnostic prediction model discriminates TCMR in dysfunctional renal grafts with high accuracy (area under curve = 0.891). Meanwhile, the classifier score of the diagnostic model, as a continuity index, is positively correlated with the severity of main pathological injuries of TCMR. Furthermore, it is found that METTL3, FTO, WATP, and RBM15 are likely to play a pivotal part in the regulation of immune response in TCMR. By CMap analysis, several small molecular compounds are found to be able to reverse TCMR including fenoldopam, dextromethorphan, and so on.
Conclusions: Together, our findings explore the value of m6A-related immune genes in predicting the prognosis of renal grafts and diagnosis of TCMR.
As of now, kidney transplantation is still the most effective remedy for end-stage renal disease (1). However, transplant patients are still chronically challenged by graft rejection, infection, and recurrence of primary kidney disease, which may lead to allograft injury and dysfunction (2). Elevated serum creatinine, hematuria, proteinuria, and decreased urine output are the common clinical manifestations of allograft injury and dysfunction. When a kidney transplant recipient develops those indications, a biopsy for cause is usually needed to identify the pathogenesis, which is known to be the gold standard (3). Timely and targeted interventions may reverse active injuries, alleviate chronic lesions, and avoid graft loss. Although the reasons for graft injury and loss are multifactorial and time-dependent, immune factors still dominate (4). Two studies on transplant kidney histology have shown that the alloimmune processes account for 35%-64% of graft loss (5, 6), of which T cell-mediated rejection (TCMR) and antibody-mediated rejection (ABMR) are the most typical subtypes. Persistent alloimmunity can also aggravate interstitial fibrosis and tubular atrophy (IF/TA), which is regarded as an important prognostic factor of grafts and the final pathological outcome of graft injuries (4).
N6-methyladenosine (m6A) modification is one of the most prevalent and reversible modifications of RNA base in eukaryotes (7). Through three functional protease complexes: writers, erasers, and readers, m6A regulates RNA transport, export, splicing, localization, translation and stability at the post-transcriptional level, thus participating in various physiological and pathological processes. Recent studies show that the m6A modification plays an important role in shaping a balanced immune response (8). M6A can affect innate, adaptive and antiviral immune responses by modulating the mRNA of key genes in the immune pathway. For example, m6A-mediated degradation of interferon B (IFNB) transcripts weakens the type I interferon and antiviral innate immune responses (9). The m6A mechanism enhances the interleukin-STAT5 signaling pathway through the attenuation of SOCS mRNA, thereby promoting the proliferation of CD4+ T cells and the immunosuppressive function of Treg cells (10, 11). M6A methylation of the Tcf7 gene mediated by METTL3 stabilizes the transcripts of the Tcf7 gene and increases the expression of TCF-1. TCF-1 promotes the differentiation of T-helper and Tfh cells, thus facilitating B cell differentiation and plasma generation (12). The regulatory role of m6A in the immune system has been demonstrated to play a part in the tumor immune microenvironment (13) and many autoimmune diseases (14), including systemic lupus erythematosus, rheumatoid arthritis, and inflammatory bowel disease. However, there is no research to elucidate its role in the immune responses after kidney transplantation.
The maturity and reduced cost of sequencing technology have improved the accuracy of disease diagnosis and treatment. Genome-wide transcript microarray data can be derived from a morsel of graft tissue, which makes it feasible for us to explore the internal relations of diseases at a molecular level. The combined application of transcript data with machine algorithms has brought about a range of molecular classifiers and risk scoring models that facilitate diagnosis and predict prognosis. Histologic diagnosis is flawed by subjective interpretations among pathologists, nonspecific lesions, and arbitrary rules, making it not as reliable as we expect (15, 16). Given the absence of a reliable gold standard, classification criteria based on objective molecular expression data present an alternative approach and complement the histologic diagnosis. Reeve et al. (17) established the Molecular Microscope Diagnostic System (MMDx) based on microarray gene expression data of renal grafts, whose balanced accuracies for histology diagnoses of TCMR and ABMR reach 73% and 78%, respectively. The molecular risk score established by Einecke et al. (18) is able to reflect active injury and superior to either scarring or function in predicting graft failure.
This study aims to explore the relations between m6A modification and immune factors behind renal graft injury at the molecular level by analyzing the microarray data of kidney transplantation biopsies for cause. By analyzing the gene expression data of discovery cohort, we found that m6A regulators are closely related to a variety of immune characteristics, which are mainly involved in alloimmune processes and T cell subsets, suggesting the unique value of m6A modifications in TCMR. Based on machine learning, we managed to build a risk score and a molecular classifier to predict graft outcomes and distinguish TCMR from other types of graft injury, respectively. In short, our findings suggest that m6A modification is involved in graft dysfunction after transplantation by regulating the immune response and provides a reference for subsequent studies.
The microarray expression data used in this study were derived from research accession published in the Gene Expression Omnibus (GEO, https://www.ncbi.nlm.nih.gov/geo/) database. The inclusion criteria included: (1) consecutive cohort; (2) samples derived from kidney biopsies for clinical indications; and (3) including TCMR and ABMR pathologic diagnosis based on Banff criteria or graft survival data. We managed to screen out 4 datasets, of which GSE360591 (19) was used as the discovery cohort, GSE213742 (18) prognosis cohort, and GSE485813 (20) and GSE983204 (21) diagnosis cohorts. All microarray datasets were subjected to log2 transformation and normalized using the R “limma” package. Two expression matrices in the diagnosis cohort were transformed by z-score to increase the comparability between independent datasets.
We identified 23 m6A regulators from the previous literature (22), including 8 writers (METTL3, METTL14, METTL16, WTAP, VIRMA, ZC3H13, RBM15, RBM15B), 13 readers (YTHDC1, YTHDC2, YTHDF1, YTHDF2, YTHDF3, HNRNPC, FMR1, LRPPRC, HNRNPA2B1, IGFBP1, IGFBP2, IGFBP3, RBMX) and 2 erasers (FTO, ALKBH5). Characteristic gene data of 22 kinds of immune cells were collected from the CIBERSORTS (23) database (https://cibersortx.stanford.edu/), and the immune cell abundance of each sample in the discovery cohort was calculated using the CIBERSORT.R script. Immune gene ontology categories/gene sets were downloaded from the ImmPort (24) database (https://www.immport.org/), and the R “GSVA” package was used to perform the single sample gene set enrichment analysis (ssGSEA) to obtain an enrichment score for each sample based on immune gene sets. 35 key genes of allograft rejection pathway (map05330) were obtained from the Kyoto Encyclopedia of Genes and Genomes (KEGG, https://www.kegg.jp/) database, as well as the expression matrix of key genes in the cohort sample. We conducted the R cor.test () to figure out the correlation coefficient between m6A regulators gene expression and immune cell abundance, immune gene sets enrichment score as well as rejection key genes expression of samples in the cohort and the correlation heat map was plotted using the R “ggplot2” package.
First, we performed the correlation analysis between 1795 (after removing 704 duplicates) immune genes of 17 immune categories and m6A regulators in the discovery cohort. Those immune genes were derived from ImmPort database. 278 m6A-related immune genes (MRIGs) (|correlation coefficients|> 0.6 and P< 0.01) were obtained, on which gene enrichment analysis was conducted via the R “clusterProfiler” package. Then, we performed the univariate cox regression analysis between MRIGs and graft survival data, which was assessed as the time between biopsy and graft failure/censoring, and obtained 108 prognostic m6A-related immune genes (P-MRIGs), taking P<0.001 as the cutoff value. Finally, the R “caret” package was used to randomly divide the prognosis cohort into train cohort and test cohort, with a ratio of 1:1. In the train cohort, we carried out the least absolute shrinkage and selection operator (Lasso) regression with 10-fold cross validation on P-MRIGs using R “glmnet” package and selected the P-MRIGs corresponding to the smallest lambda value for model building. The multivariate Cox regression was conducted to figure out the regression coefficient. The Risk Score was calculated with the following formula: Risk Score = , here exprirepresented the expression level of gene, i and coefi, the regression coefficient of gene i in the signature. The train cohort was divided into high- and low-risk groups, choosing median of risk score as the midpoint. The Kaplan-Meier survival curve was plotted using the R “survminer” package. Log Rank test was used to compare the differences in graft survival between the two risk groups and the ROC curve drew by R “timeROC” package plots evaluated the predictive performance of the signature. Similar proceedings were carried out in the test cohort. In addition, to verify the model’s applicability, we conducted the graft survival analysis of high- and low-risk groups in the rejection group and non-rejection group respectively, ran the GSEA 4.1.0 software (25) to identify the underlying pathophysiology of the risk-group and compared the gene enrichment differences in the KEGG pathway between the high and low-risk groups.
The distribution differences of m6A regulators and immune characteristics, which were obtained from the proceedings above, including gene expression matrix, the abundance of immune cells, and immune gene set enrichment scores, were compared in the TCMR, ABMR, and non-rejection groups of the discovery cohort. The results were visualized using R “pheatmap,” “ggplot2”, and “ggpubr” packages.
We intended to build a diagnostic model of TCMR based on m6A-related immune genes. Firstly, we performed a gene differential analysis between TCMR and non-TCMR groups (including the mixed group) in the discovery cohort using R “limma” package and obtained 120 differentially expressed genes (DEGs, | Log Fc |> 1, P< 0.05), of which 64 DEGs are immune-related genes. Subsequently, we carried out a correlation analysis between 64 differentially expressed immune genes and m6A regulators, and further obtained 58 m6A-related immune genes (DE-MRIGs, |correlation coefficients|> 0.4 and P<0.05) in the diagnosis cohort (train). Cycloscape 3.8.0 software (26) was used to perform protein-protein interaction (PPI) analysis of DE-MRIGs and corresponding m6A regulators. The GlueGO pluglet (27) was used for enrichment analysis and visualization. Finally, we utilized R “randomForest” package to carry out the decision tree analysis of DE-MRIGs to select feature genes in the train cohort. The appropriate variables were selected on the basis of their importance to build the model and logistic regression was conducted to determine the variable regression coefficient. The classifier score was calculated with the following formula: Classifier Score = .,here expri represented the expression level of gene, i and coefi,the regression coefficient of gene i in the classifier. The diagnostic performance of classifier was evaluated by the Area Under Curve (AUC) of the ROC Curve. The Optimal cut-off point was determined based on Youden index. Classifier score was calculated and evaluated in the test cohort. Moreover, a violin plot was drawn based on the histological lesions in the test cohort to compare the distribution of classifier score in TCMR-related injuries of different degrees, in which Wilcoxon Rank Sum was used for comparison between two groups, Kruskal-Wallis test for comparison between multiple groups. We retrieved Connectivity Map (Cmap) Database (https://clue.io/) (28) to identify the potential compounds that could alleviate TCMR lesions. Potential drugs with absolute Cmap score over 95 were selected and visualized using the R ComplexHeatmap package.
A total of 4 consecutive study cohorts, including 2193 renal transplant biopsy samples and 1906 kidney transplant patients, are included in this study. The detailed information is shown in Table 1. 36%-62% of renal graft biopsies are performed due to rapid or slow deterioration of graft function. The median time of biopsy after transplantation ranges from 512 to 751 days, of which 55%-100% of renal allografts biopsies one year after transplantation. Biopsies with a definite pathological diagnosis or lesions associated with alloimmunity, including TCMR, ABMR, mixed ABMR and TCMR, borderline rejection, and transplant glomerulopathy (TG) are most common (24%-48%), among which TCMR and ABMR have similar incidence. 55%-83% of transplant patients are given maintenance immunosuppressive regimens, which include calcineurin inhibitors at the time of biopsy. 12%-29% of recipients undergo graft failure, with mean follow-up time after transplantation ranging from 469 to 1017days.
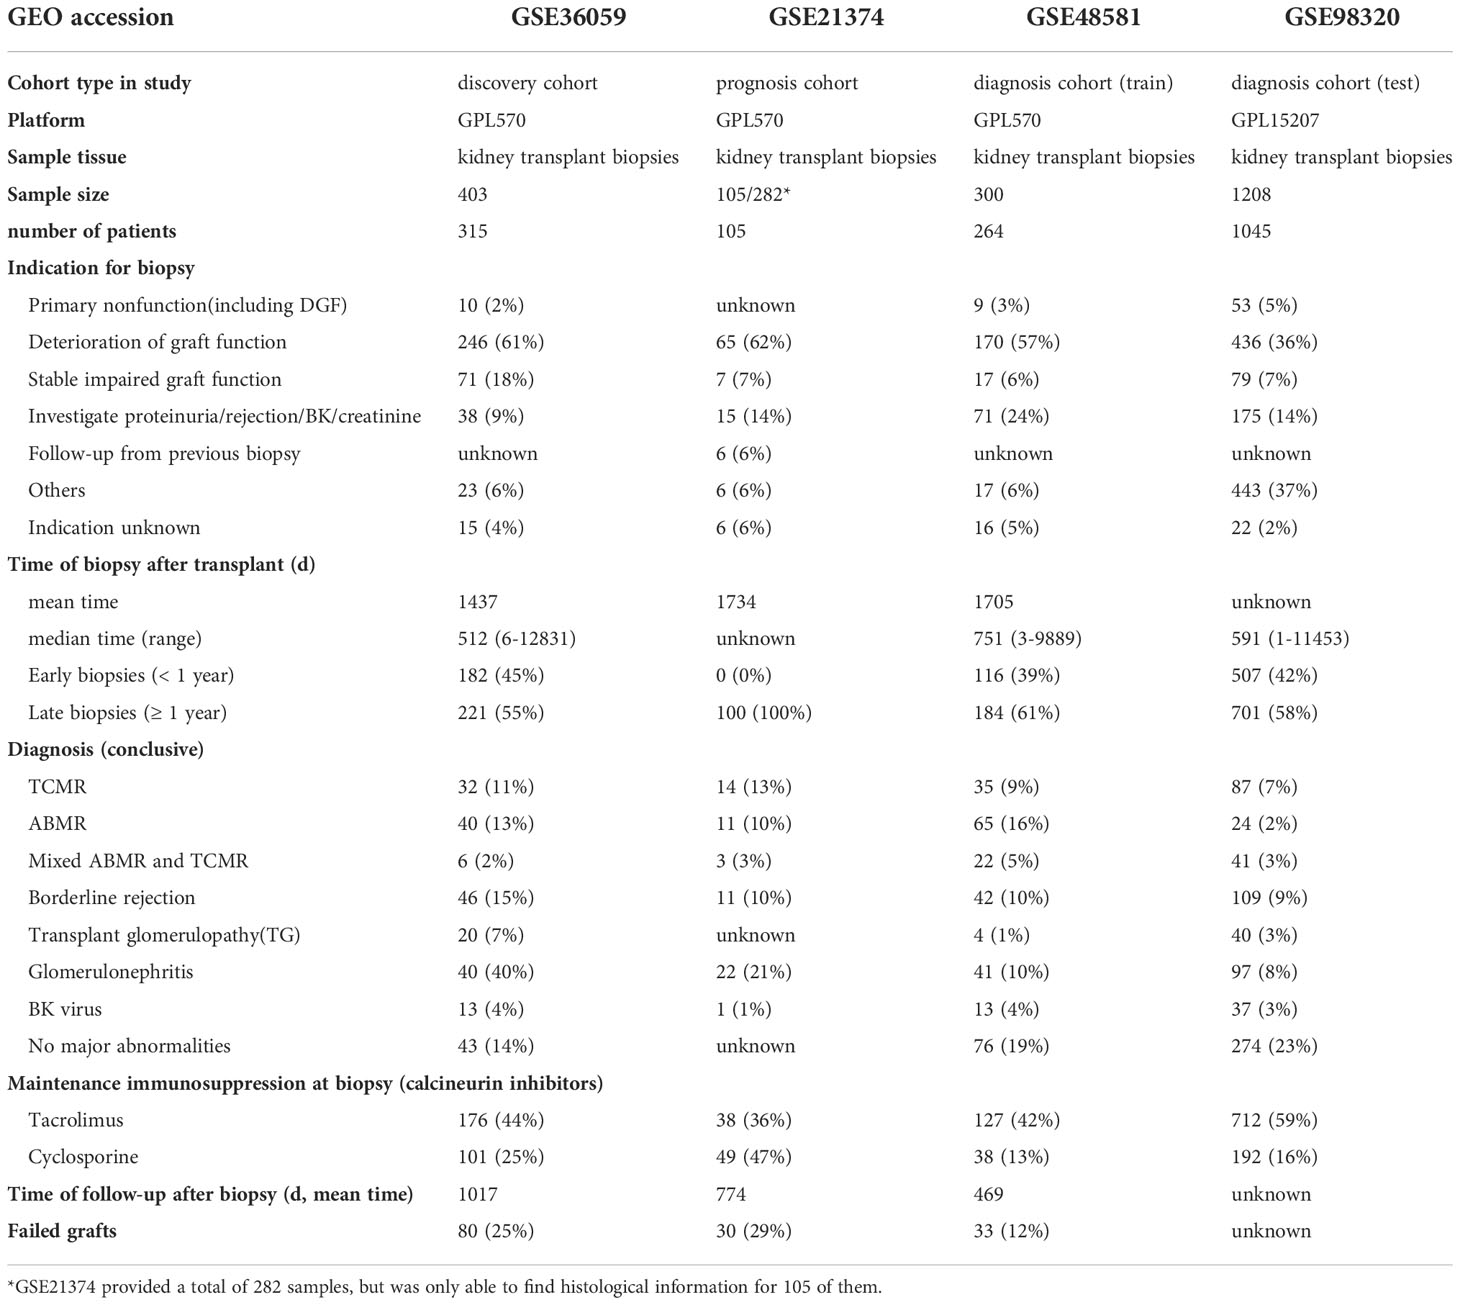
Table 1 Characteristic at cohort and biopsy.
To explore whether m6A is related to immune factors, especially alloimmunity at the molecular level in the process of graft dysfunction, we collected and processed the data with immune characteristics and performed the correlation analysis with m6A regulators. Most m6A regulators are significantly correlated with T cell subtypes, macrophages, dendritic cells, mast cells and eosinophils, but not B cells (Figure 1A). Similar findings are observed in the respective correlation analysis of m6A regulators and immune categories, as well as m6A regulators and rejection key genes, as shown in Figures 1B, C. Erasers are mainly negatively related to the corresponding immune characteristics (shown in blue wireframe) while writers are mainly positively related (shown in red wireframe). For readers, both positive and negative correlations can be found, which may be related to its property of adjustment.
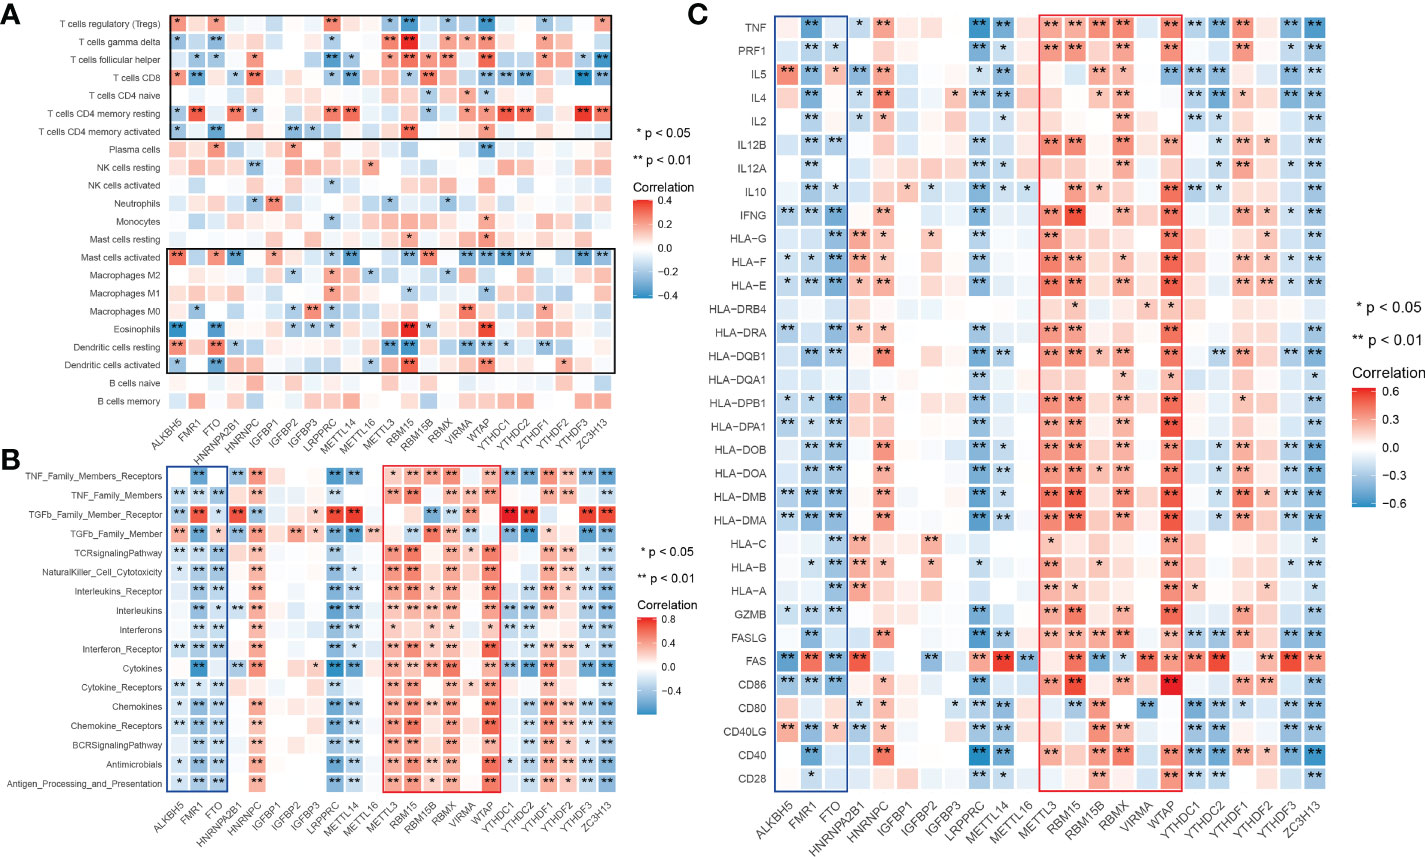
Figure 1 Landscape of correlationship between m6A regulators and immune characteristics. (A) Correlation heatmap of m6A regulators and immune cells. (B) Correlation heatmap of m6A regulators and immune gene categories. (C) Correlation heatmap of m6A regulators and rejection key genes. m6A regulators significantly correlated immune cells clustered in the black wireframe; Immune gene categories or rejection key genes significantly positive correlated m6A regulators clustered in the red wireframe; Immune gene categories or rejection key genes significantly negative correlated m6A regulators clustered in the blue wireframe.
Given what we have discovered above, we assumed that m6A modification-related immune molecules may be able to affect the outcomes of renal grafts, on which we established a prognostic model of grafts. The flow of modeling is shown in Figure 2A. We found that most genes are enriched in T cell activation, regulation of response to biotic stimulus, cytokine receptor interaction, and PI3K-Akt signaling pathway (Supplementary 1) on gene set enrichment analysis of 278 m6A-related immune genes (MRIGs). A list of 108 m6A-related prognostic genes immune genes (P-MRIGs) with hazard ratios (HR) is recorded in Supplementary 2. Based on Lasso regression, 7 P-MRIGs (S100A6, TMSB10, NAMPT, IL15, PSMC6, NDRG1, NRG1) are determined for building the prognostic prediction model (Figure 2D). Each candidate gene is given a corresponding coefficient by multivariate Cox regression, and the risk score of each sample is calculated. Taking the median of risk score as the threshold, we stratified the train cohort into different risk groups, of which the graft survival probability of the high-risk group is significantly lower than that of the low-risk group (P<0.001, Figure 2E). The model shows good predictive performance (Figure 2F), as AUC for predicting graft survival of 3-year, 5 -year, 10- year, and 20-year are 0.91, 0.90, 0.90, and 0.87, respectively. The model was verified in the test cohort. Similarly, the high-risk group has remarkably poor graft survival (P< 0.007, Figure 2G), as AUC for predicting graft survival of 3-year, 5 -year, 10- year, and 20-year are 0.79, 0.83, 0.76, and 0.53, respectively (Figure 2H).
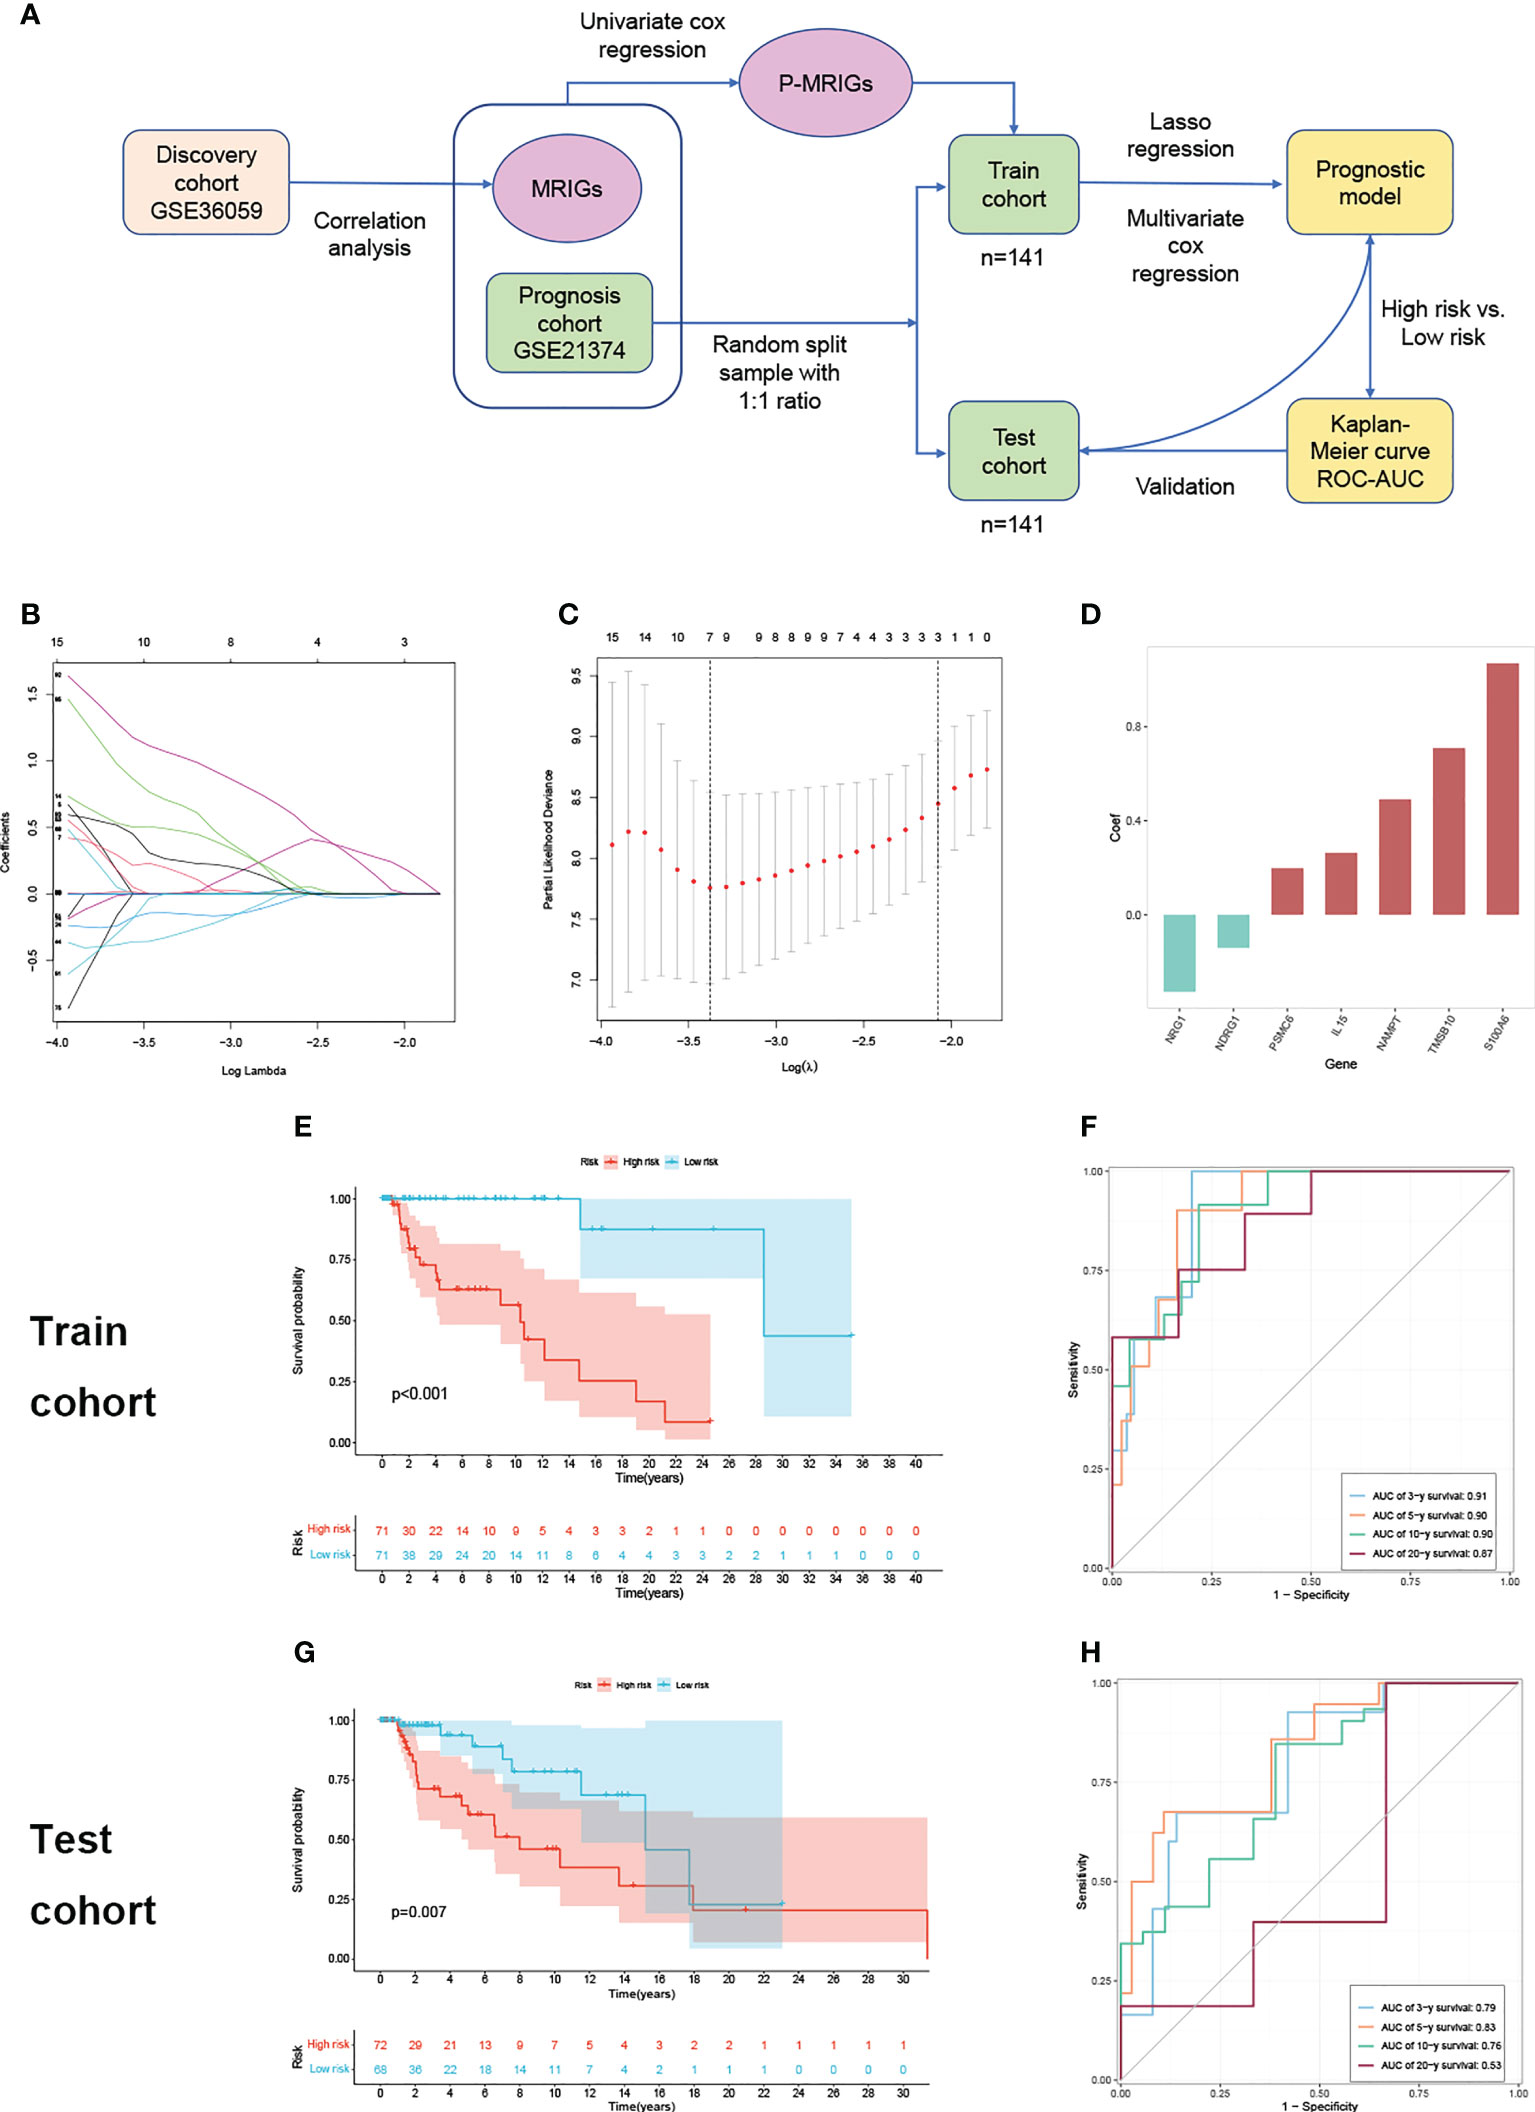
Figure 2 Construction and verification of prognostic prediction model. (A) Flow of constructing the prognostic prediction model. (B) Lasso coefficient profiles. (C) The partial likelihood deviance plot. (D) Coefficient of seven screened P-MRIGs in the prognostic prediction model. (E) The K-M curve showed that the high-risk group had a more inferior graft survival than the low-risk group in train set and (G) test set. (F) ROC curve of the model: the AUCs of 3-, 5-,10- and 20-year graft survival in the train set and (H) test set. Lasso, least absolute shrinkage and selection operator; P-MRIGs, prognostic m6A-related immune genes; K-M, Kaplan–Meier; ROC, receiver operating characteristic; AUC, areas under the curve.
There is a significant difference in the distribution of risk scores between the rejection and non-rejection groups (Figure 3A), and the risk score is higher in the rejection group (p<0.001). Moreover, the KM survival curves show that graft survival of the high-risk group is much worse than that of the low-risk group regardless of with rejection or not (Figures 3B, C), which indicates that the predictive performance of the model is not affected by rejection factors and possesses of strong applicability.
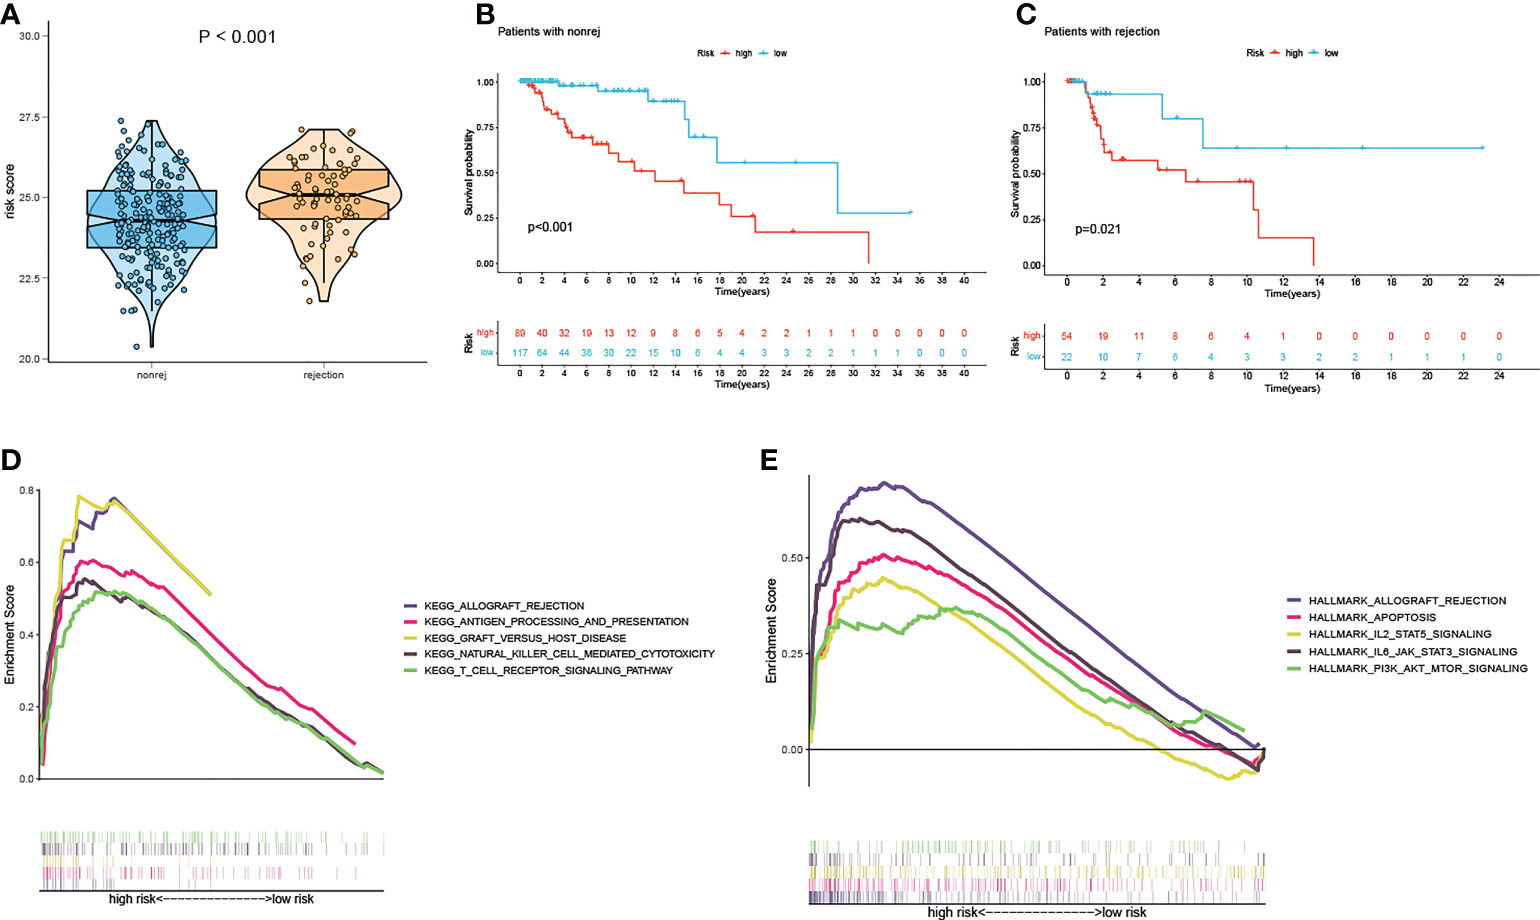
Figure 3 Test of suitability of the prognostic prediction model. (A) Violin plot of risk score in non-rejection and rejection group. (B) The K-M curve showed that the high-risk group had a more inferior graft survival than the low-risk group in non-rejection and (C) rejection group. (D) Gene enrichment analysis of KEGG pathway and (E) hallmark pathway in high-group versus low-group. K-M, Kaplan–Meier.
In order to explore the latent causes behind the poor graft survival of the high-risk group, we compared the gene enrichment of the two risk groups. In high-risk group, more genes are enriched in the pathways related to alloimmunity, such as allograft rejection and graft versus host disease, suggesting alloimmunity is the principal element accounting for graft loss.
The gene expression differences of m6A regulators in the rejection group, including TCMR and ABMR, as well as non-rejection, are shown in Figure 4. For most of m6A regulators, their gene expression levels are significantly different between rejection group and non-rejection group (Figure 4A). Similarly, the expression levels of most of the m6A regulators are remarkably different between TCMR and non-TCMR groups. However, only a few m6A regulators show a significant difference in gene expression levels between ABMR and non-ABMR, as well as ABMR and TCMR (Figures 4B, D). Thus, we speculated that m6A regulators may play an important part in rejection, especially in TCMR, while its role in AMBR is limited.
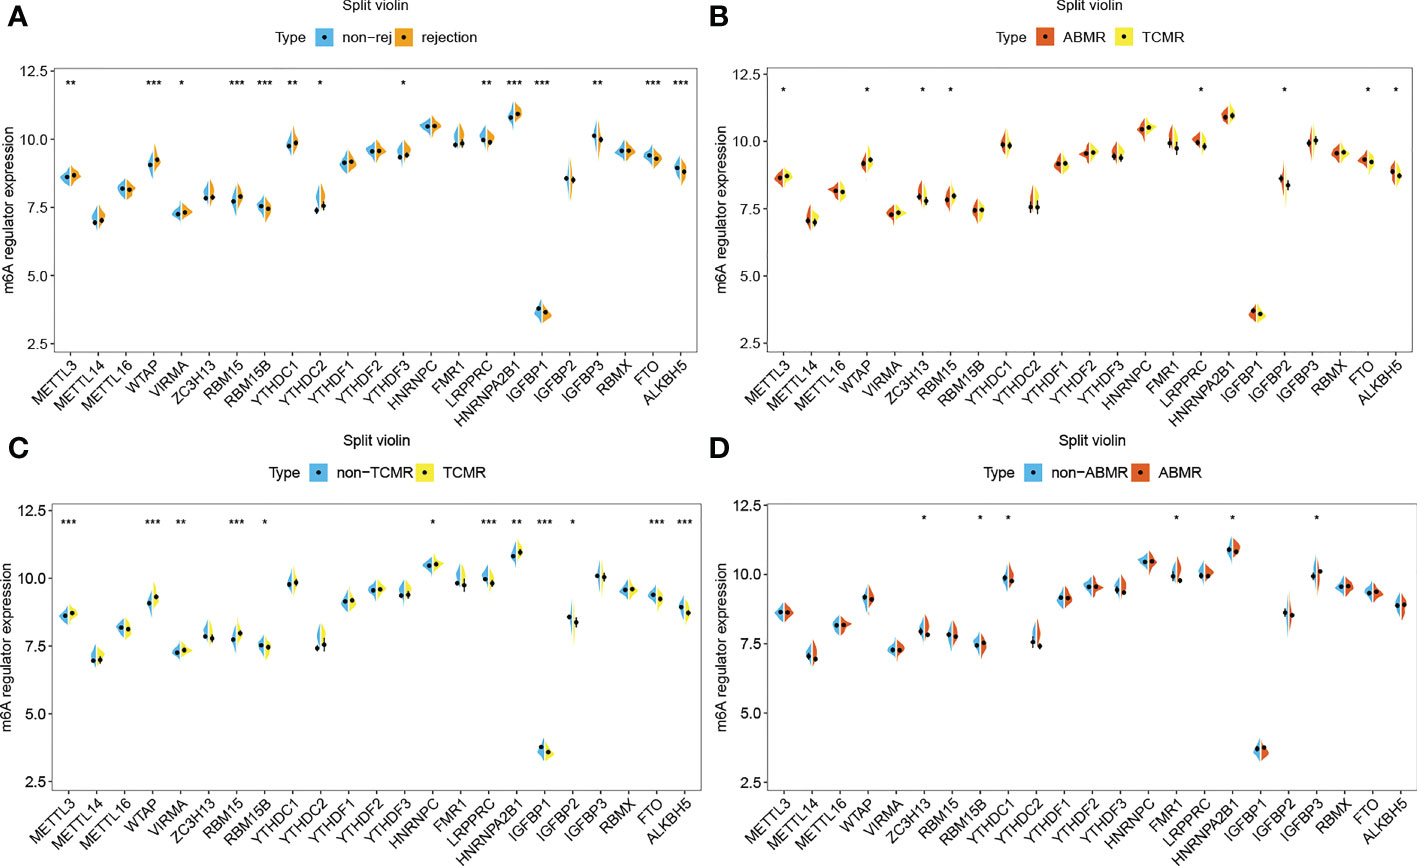
Figure 4 m6A regulators in rejection subtypes. (A) Split violin plot of m6A regulators’ gene expression levels in non-rejection versus rejection group,(B) ABMR versus TCMR group, (C) non-TCMR versus TCMR group, and (D) non-ABMR versus ABMR group. *P< 0.05, **P< 0.01, ***P< 0.001.
The results of immune cell infiltration show that there are more CD4 or CD8 T cells, helper T cells, M1 macrophages, activated dendritic cells, and eosinophilia infiltrated in the TCMR group (Supplementary 3A, B), which are precisely the immune cell types significantly related to m6A regulators. The TCMR group has higher enrichment scores in a number of immune categories (Supplementary 2C, D), which are also significantly related to m6A regulators. Thus, it is justifiable to conclude that m6A-modified immune responses play a specific role in the pathogenesis of TCMR.
The process of establishing the prediction model is shown in Figure 5A. Several genes are enriched in T cells immunity, proliferation, and related pathway (Dark orange circles in Figure 5B) on the enrichment analysis of DE-MRIGs and their counterpart m6A regulators. Figure 5C shows the network of DE-MRIGs and m6A regulators, of which RBM15, WTAP, FTO, and METTL3 may be the hub genes that regulate the immune genes.
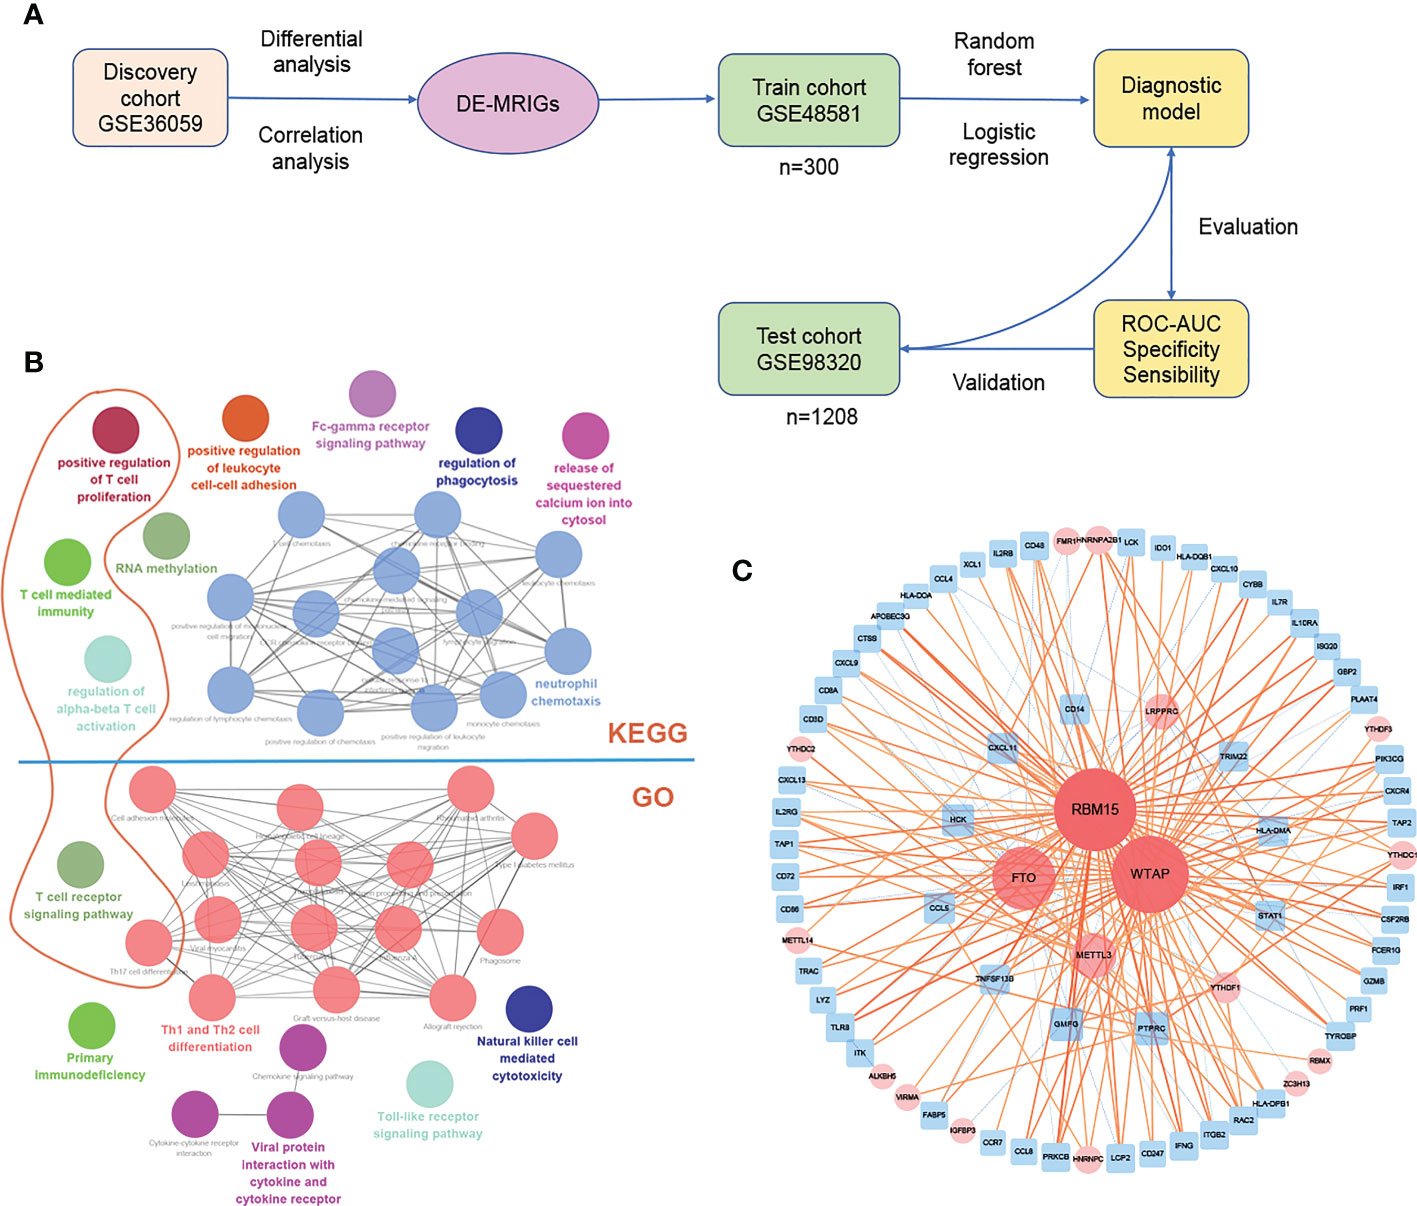
Figure 5 Construction and verification of diagnostic prediction model. (A) Flow of constructing the diagnostic prediction model. (B) Gene enrichment analysis and (C) network of DE-MRIGs and corresponding m6A regulators. DE-MRIGs, different expression m6A-related immune genes.
7 DE-MRIGs with the greatest mean decrease of Gini coefficient are selected for modeling by the Random Forest algorithm (Figure 6B). Figure 6A demonstrates that when the decision trees are accumulated to a certain number, the error of the random forest model falls between 10% and 12%. The regression coefficient of each DE-MRIG was obtained by Logistics regression, and then the classifier score of each sample in the train cohort was calculated. The expression levels of 7 DE-MRIGs in the sample and their corresponding histological and predicted diagnosis types are shown in Figure 6D. The classifier possesses excellent predictive performance for TCMR with an AUC of 0.891. The specificity and sensitivity of the model are 80.2% and 87.5%, respectively, when the optimal cut-off point is 1.070. We also verified the model in the test cohort, and it still shows good performance with an AUC of 0.854 when the optimal cut-off point is 1.657. The model was verified in the test cohort which also delivers good performance with an AUC of 0.854, and the optimal cut-off point is 1.070, affected by sequencing platforms. The specificity and sensitivity in the test cohort are 78.8% and 80.5%, respectively.
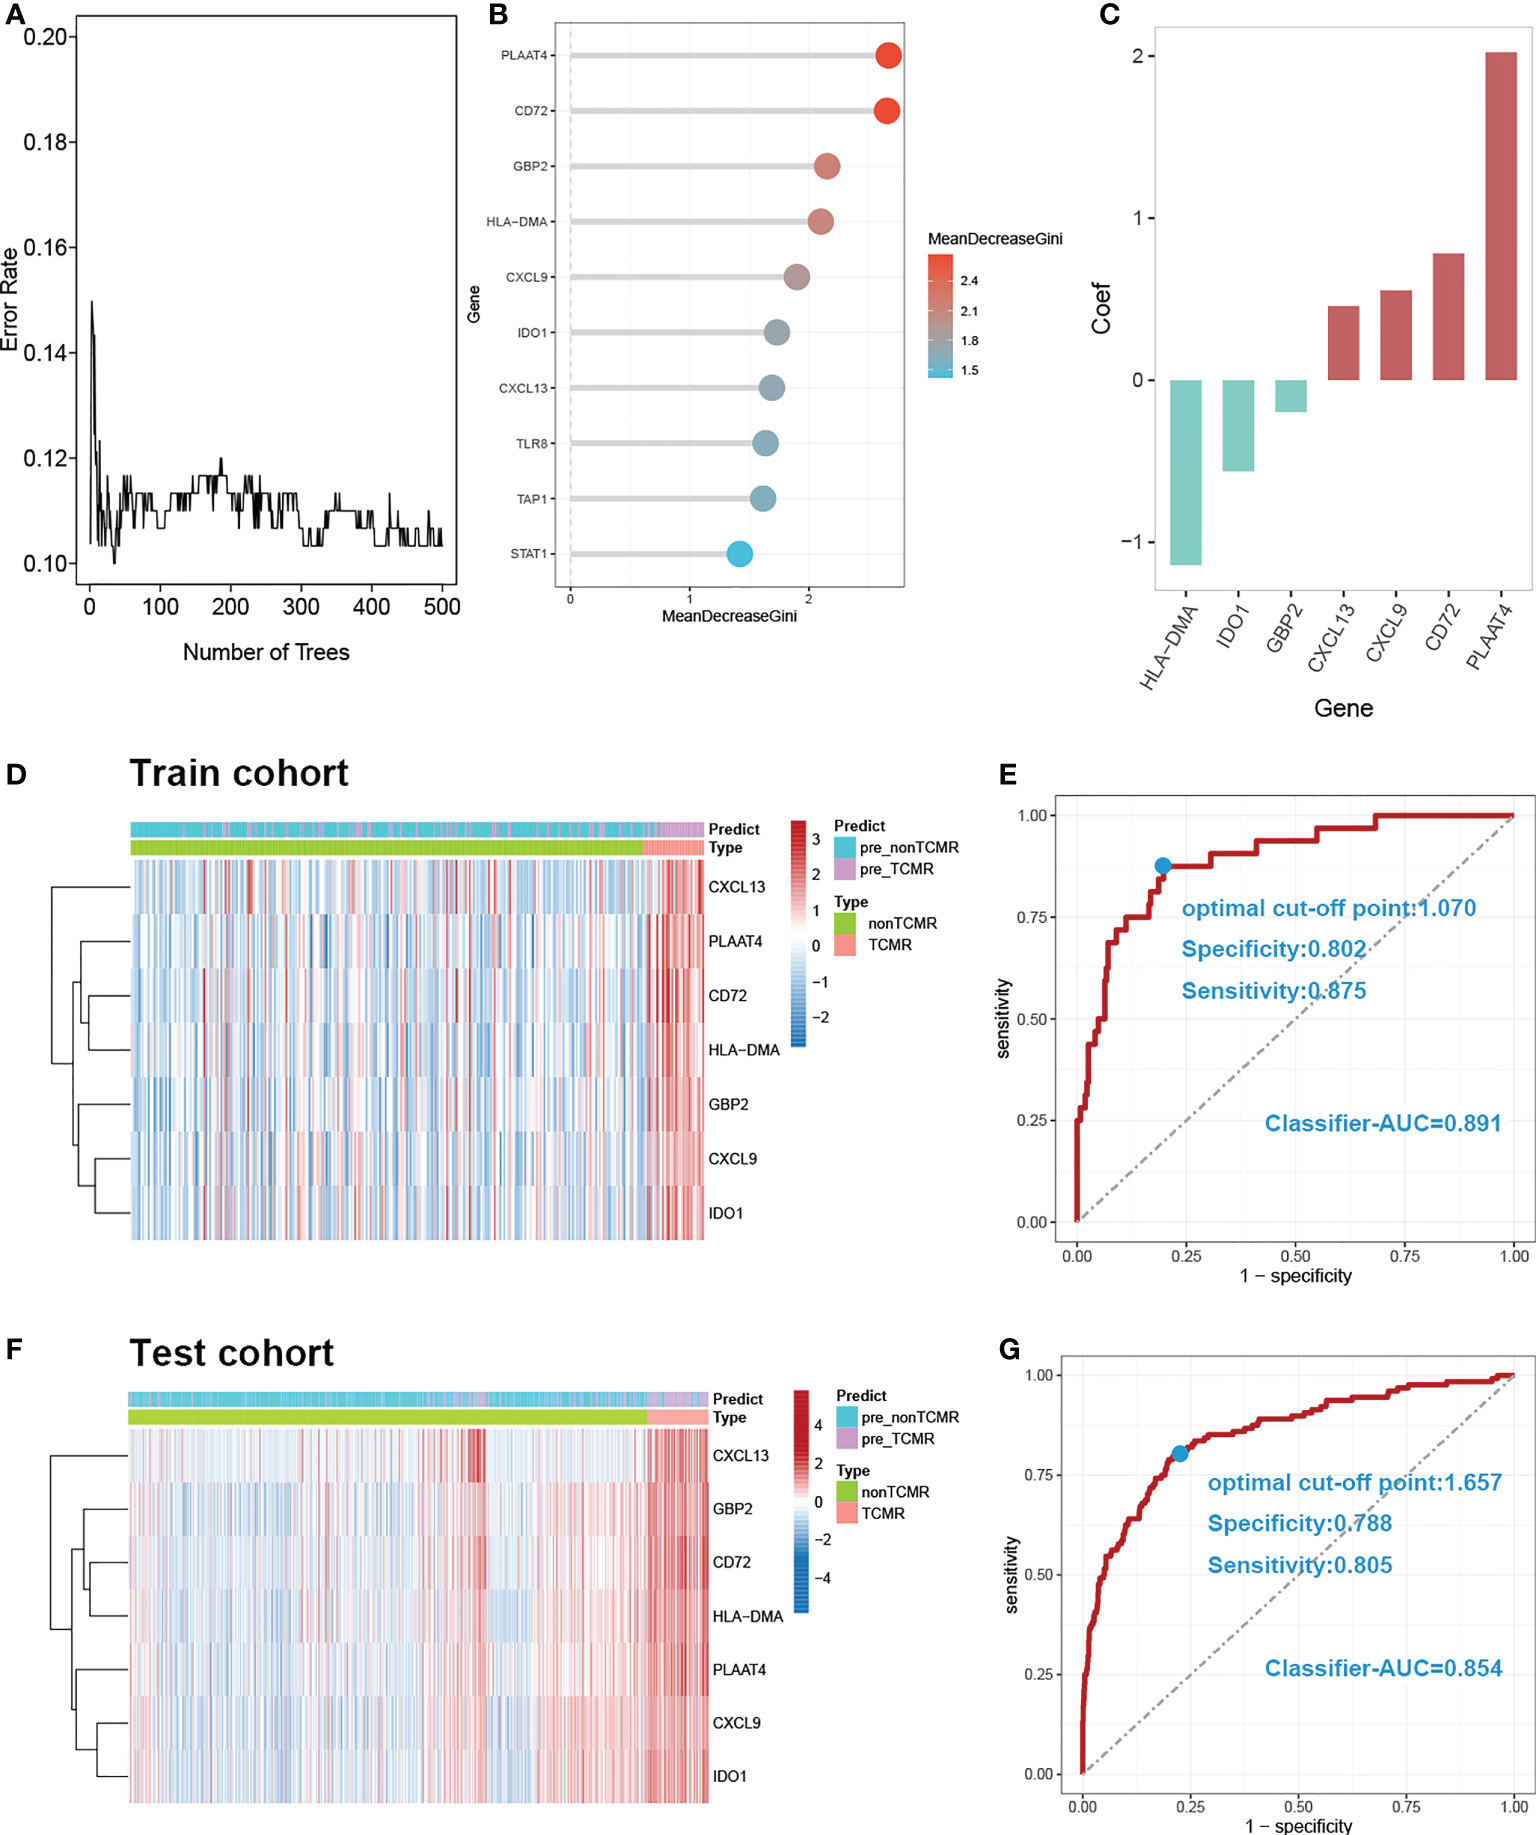
Figure 6 Construction and verification of diagnostic prediction model. (A) Random forest error rate plot. (B) Mean decreased gini of genes profiles. (C) Coefficient of seven screened DE-MRIGs in thedignostic prediction model. (D) Heatmap of identified DE-MRIGs in train cohort and (F) test cohort. (E) ROC curve of the model: the AUC, optimal cut-off point, specificity and sensitivity of classifier for discriminating TCMR in train cohort and (G) test cohort. DE-MRIGs, different expression m6A-related immune genes; ROC, receiver operating characteristic; AUC, areas under the curve.
Banff lesions i, t, v, i-IFTA represent interstitial inflammation, tubulitis, intimal arteritis, and inflammation in areas of fibrosis/interstitial fibrosis and tubular atrophy, respectively. Those are the main pathological lesions of acute and chronic TCMR, and the diagnosis is exactly based on them. The distribution of the classifier score shows a significant gradient difference in injury indicators of TCMR, which means the classifier scores increases with the degree of injury (Figures 7A, C). Therefore, our model can be used to reflect the severity of pathological injury and facilitate in TCMR grading.
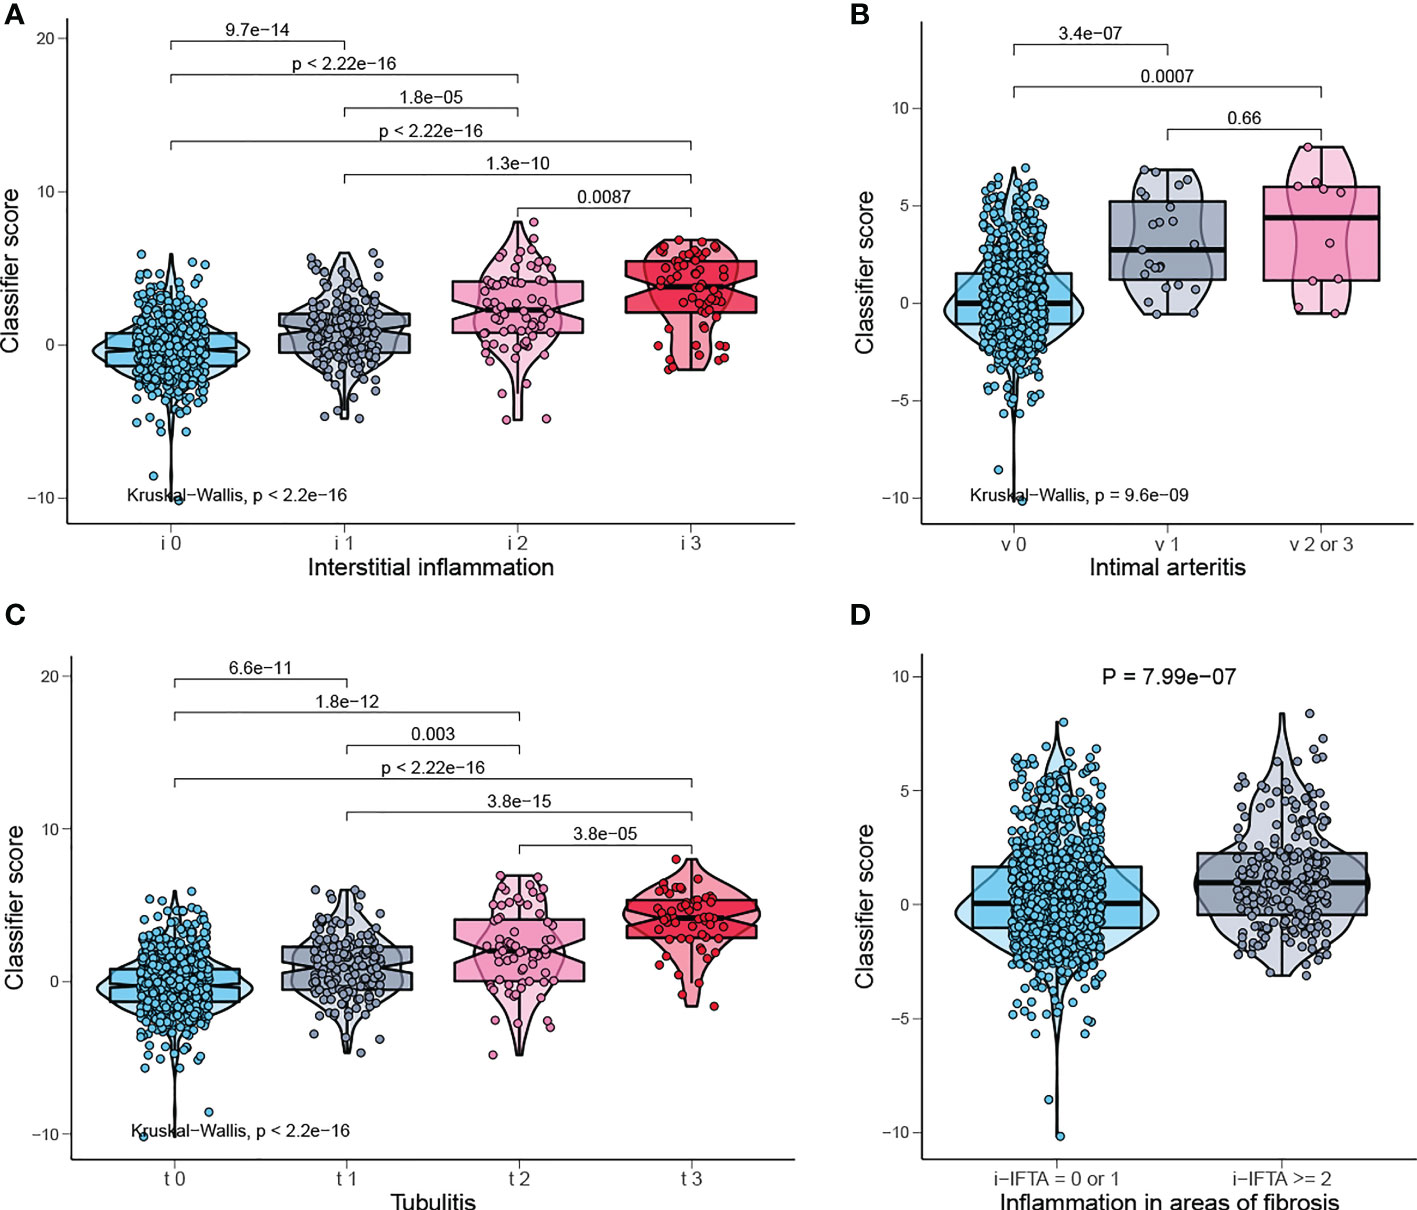
Figure 7 Classifier score in TCMR-related pathological lesion. (A) Classifier score in i0, i1, i2, i3, (B) v0, v1, v2 or 3, (C) t0, t1, t2, t3, and (D) i-IFTA=0 or 1, i-IFTA > =2. i, interstitial inflammation; t, tubulitis; v, intimal arteritis; i-IFTA, inflammation in areas of fibrosis.
The Connectivity Map (CMap) database can explore the potential therapeutic small molecule compounds by comparing the uploaded gene signature with the in-house gene datasets, from which the corresponding correlation score is obtained, namely the CMap score. We screened out the compounds for TCMR in the CMap database based on the signature of the top 10 DE-MRIGs (Supplementary 4) in the diagnostic model. The potential therapeutic drugs with absolute CMap score over 95 are selected, and the most common mechanism of action is antagonizing adenosine receptor (Supplementary 5).
The kidneys are a common target of systemic immune and autoimmune disorders, which is partly related to the size-selective and charge-dependent filtration process (29). In terms of transplanted kidneys, persistent and intense alloimmunity is the main culprit for graft loss. There is accumulating evidence suggesting new functions of m6A in regulating various aspects of immunity, including immune recognition, activation of innate and adaptive immune responses, and cell fate decisions (8). It is justifiable to speculate that m6A may also be involved in regulating alloimmunity and other immune responses in renal transplantation. Thus, we derived microarray expression data from transplanted kidney biopsies for cause and tried to explore the relations between m6A regulators and immune responses in renal transplantation at a molecular level, on which the diagnostic and prognostic models were built.
Einecke et al. (18) first reported a molecular classifier for predicting future graft loss in late kidney transplant biopsies. The transcripts that are associated with graft loss and used as a classifier, can only give us hints about tissue injury and fail to reflect the inflammatory state. Although transcripts in this research are limited to immune genes associated with m6A modifications, with an AUC of 0.9, they have better performance in predicting graft survival of 3-, 5-, and 10- years than the classifier in the previous study, whose AUC is 0.83. Moreover, our model is applicable for patients with or without rejections in predicting graft survival.
The m6A-related immune genes included in the prognostic model may also play a consequential role in the risk stratification of graft loss. S100A6 protein belongs to the S100 protein family of Ca2+- binding proteins (30). Research revealed that interferon beta (INFβ) activity could be modulated via the binding of S100A6 protein (31). Yilmaz et al. (32) found that NAMPT can reflect endothelial dysfunction directly following renal transplantation. In kidney transplantation, IL-15 can stimulate CD4 + CD28 null T cells to generate alloreactivity (33) or acts as a biomarker for the assessment of antibody-mediated kidney allograft rejection (34).
In the wake of new immunosuppressive regimens, TCMR is less common but still remains the dominant early rejection phenotype and serves as the endpoint for clinical trials (35). The latest Banff classification outlines the diagnostic criteria of TCMR based on four histological lesions: interstitial inflammation (i2 or i3), tubulitis (t2 or t3), intimal arteritis (v1, v2 or v3), and inflammation in areas of interstitial fibrosis and tubular atrophy (i-IFTA2 or i-IFTA3) (36). This scoring system is largely opinion-based and inconsecutive with arbitrary cutoffs (37). Moreover, the histological lesions for TCMR are nonspecific. For example, interstitial inflammation and tubulitis are also found in acute kidney injury (AKI), possibly rendering false positives, and difficult to assess in scarred tissue, causing false negatives (20). Advantages of molecular assessment over histological approaches include objectivity, repeatability and quantification, which can emerge as an amelioration to pathological diagnosis (37).
In the pathogenesis of TCMR, effector T cells, dendritic cells and activated macrophages are the main acting cells (37), which are also significantly associated with m6A regulators in the discovery cohort. At the same time, there is a remarkable difference in the expression of most of these m6A regulators between TCMR and non-TCMR, indicating that m6A modification may play a part in TCMR, on which we established a diagnostic prediction model to identify TCMR in grafts dysfunction. The classifier score of our model outperforms the published molecular test - TCMR score in diagnostic performance with an AUC of 0.89 vs 0.8412. In addition, further analysis revealed that the classifier score is positively related to the degree of main pathological lesions of TCMR, enabling it to evaluate pathological injury degree and further grade TCMR.
Through network analysis, we found that METTL3, FTO, WATP and RBM15 may play a pivotal part in the regulation of immune responses in TCMR (Figure 8). It has been proven that METTL3 regulates T cell homeostasis (38), M1 macrophage polarization (39) and dendritic cell maturation (40); FTO enhances M1 and M2 macrophage activation (41); WTAP controls T cell receptor signaling and survival of T cells (42). It is noted that the m6A-related immune genes, which were finally screened out to build our model, namely, CD72 (43), CXCL9 (44) and CXCL13 (45), have also been reported to emerge as biomarkers for TCMR-exclusive.
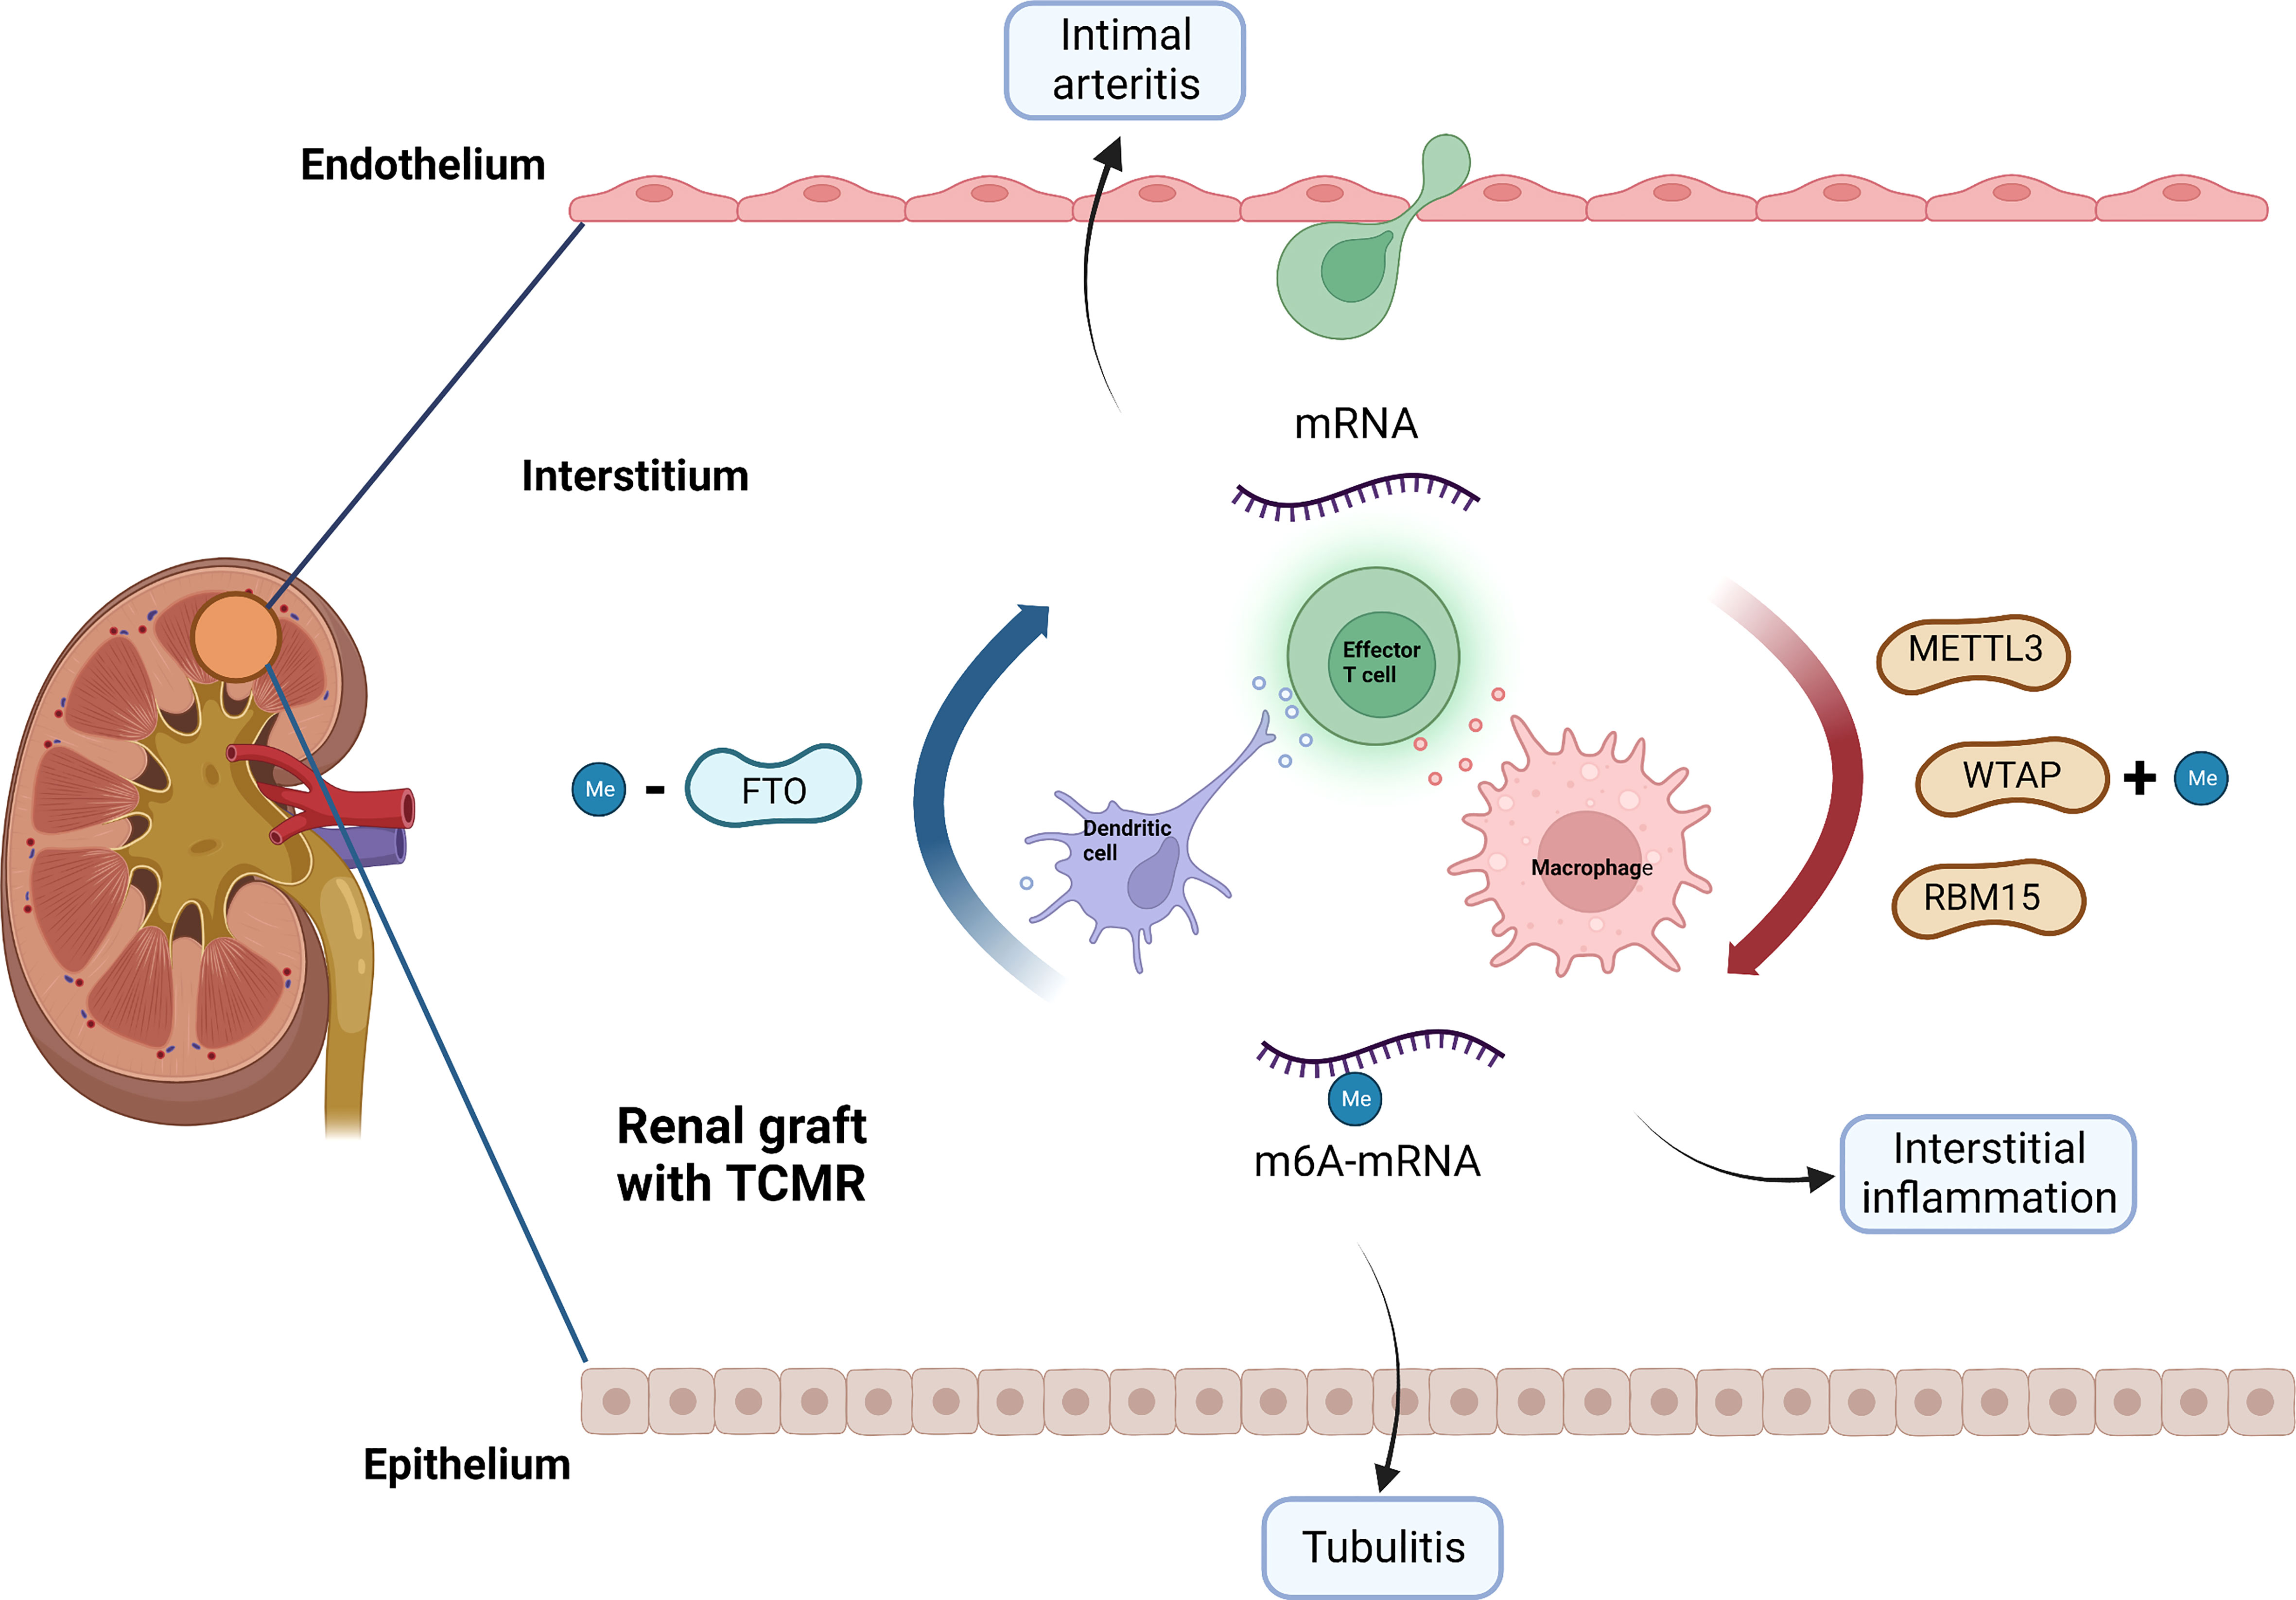
Figure 8 Potential role of m6A modification in TCMR. METTL3, WTAP, RBM15 and FTO may be involved in the pathogenesis of TCMR by regulating immune response, thereby causing interstitial inflammation, tubulitis and intimal arteritis. TCMR, T cell mediated rejection; Me, N6-methyladenosine.
Furthermore, we managed to select some small molecule compounds that may be able to reverse TCMR damage. Among the compounds with highest CMap scores, fenoldopam has been proven to be able to alleviate acute kidney injury (46) and is promising for reversing delayed graft function (DGF) (47);dextromethorphan can reduce renal complications of diabetes (48). We identified the potential therapeutic drugs with absolute CMap score over 95, and the most common mechanism of action is antagonizing adenosine receptor. Debra et al. (49) confirmed in mice experiment that adenosine receptor antagonists could protect against kidney injury.
This study has some limitations: on one hand, there is no clinically relevant population being studied, which is referred to as “limited challenge bias” (36); on the other hand, the hypothesis requires in vivo and vitro experiments to verify. There are also some common problems in the buildup of transcriptome models: firstly, there is inevitable inaccuracy in adopting histology based on Banff classification as the gold standard of diagnosis. Secondly, the deviation can be generated from the transcript data obtained from different experimental platforms. Due to this bias, the optimal cutoff points derived from train and test cohorts in the diagnostic model are quite discrepant in this study. Finally, for-cause biopsies are mainly performed for those patients with clinical indications. The inclusion itself has already resulted in selection bias, which may overestimate the model’s performance. Therefore, it is better to study the relations between m6A and transplant rejection in patients with protocol biopsy and diagnose rejection at an earlier stage. Anyhow, our study is pioneering and enlightening,and provides valuable clues for future studies on the role of m6A modification in renal graft dysfunction.
Collectively, our findings demonstrated that m6A-related immune genes could be used for prediction of graft loss and diagnosis of TCMR, which may be involved in the process of renal graft dysfunction. The results of this study offer novel schemes for molecular assessment of disease states in kidney transplant and provide a ponderable direction for the future research.
Publicly available datasets were analyzed in this study. This loosedata can be found here: GSE360591 GSE213742 GSE485813 GSE983204.
QP and HX conceived and designed the study. HX, HC, HW, YW, and CA performed the data analysis. QP wrote the original draft. JZ, SL, JX, RW, and HX reviewed and revised the manuscript. All authors contributed to the article and approved the submitted version.
We appreciate Professor Philip F. Halloran and researchers of Alberta Transplant Applied Genomics Centre for their contribution to the molecular assessment of disease states in kidney transplant biopsy samples and their data available in the GEO database.
The authors declare that the research was conducted in the absence of any commercial or financial relationships that could be construed as a potential conflict of interest.
All claims expressed in this article are solely those of the authors and do not necessarily represent those of their affiliated organizations, or those of the publisher, the editors and the reviewers. Any product that may be evaluated in this article, or claim that may be made by its manufacturer, is not guaranteed or endorsed by the publisher.
The Supplementary Material for this article can be found online at: https://www.frontiersin.org/articles/10.3389/fimmu.2022.1039013/full#supplementary-material
Supplementary 1 | Gene enrichment analysis of m6A-related immune genes. (A) Bubble plot of GO analysis. (B) Bubble plot of KEGG analysis.
Supplementary 2 | Univariate Cox regression analysis revealed that the selected m6Arelated immune-genes significantly correlated with clinical prognosis.
Supplementary 3 | Immune characteristics in rejection subtypes. (A) Heatmap and (B) boxplot of immune cell infiltration in non-rejection, TCMR and ABMR. (C) Heatmap and (B) boxplot of enrichment score of immune categories in non-rejection, TCMR and ABMR.
Supplementary 4 | Results of CMap analysis with absolute CMap score over 95 of top 10 important m6A-related immune genes.
Supplementary 5 | The mechanisms of action shared by small molecular compounds based on CMap analysis.
1. Wekerle T, Segev D, Lechler R, Oberbauer R. Strategies for long-term preservation of kidney graft function. LANCET (2017) 389:2152–62. doi: 10.1016/S0140-6736(17)31283-7
2. Hariharan S, Israni AK, Danovitch G. Long-term survival after kidney transplantation. N Engl J Med (2021) 385:729–43. doi: 10.1056/NEJMra2014530
3. Williams WW, Taheri D, Tolkoff-Rubin N, Colvin RB. Clinical role of the renal transplant biopsy. Nat Rev Nephrol (2012) 8:110–21. doi: 10.1038/nrneph.2011.213
4. Van Loon E, Bernards J, Van Craenenbroeck AH, Naesens M. The causes of kidney allograft failure: More than alloimmunity. a viewpoint article. TRANSPLANTATION (2020) 104:e46–56. doi: 10.1097/TP.0000000000003012
5. El-Zoghby ZM, Stegall MD, Lager DJ, Kremers WK, Amer H, Gloor JM, et al. Identifying specific causes of kidney allograft loss. Am J Transplant (2009) 9:527–35. doi: 10.1111/j.1600-6143.2008.02519.x
6. Sellares J, de Freitas DG, Mengel M, Reeve J, Einecke G, Sis B, et al. Understanding the causes of kidney transplant failure: the dominant role of antibody-mediated rejection and nonadherence. Am J Transplant (2012) 12:388–99. doi: 10.1111/j.1600-6143.2011.03840.x
7. Jiang X, Liu B, Nie Z, Duan L, Xiong Q, Jin Z, et al. The role of m6A modification in the biological functions and diseases. Signal Transduct Target Ther (2021) 6:74. doi: 10.1038/s41392-020-00450-x
8. Shulman Z, Stern-Ginossar N. The RNA modification N(6)-methyladenosine as a novel regulator of the immune system. Nat Immunol (2020) 21:501–12. doi: 10.1038/s41590-020-0650-4
9. Winkler R, Gillis E, Lasman L, Safra M, Geula S, Soyris C, et al. m(6)A modification controls the innate immune response to infection by targeting type I interferons. Nat Immunol (2019) 20:173–82. doi: 10.1038/s41590-018-0275-z
10. Seki Y, Yang J, Okamoto M, Tanaka S, Goitsuka R, Farrar MA, et al. IL-7/STAT5 cytokine signaling pathway is essential but insufficient for maintenance of naive CD4 T cell survival in peripheral lymphoid organs. J Immunol (2007) 178:262–70. doi: 10.4049/jimmunol.178.1.262
11. Tong J, Cao G, Zhang T, Sefik E, Amezcua VM, Broughton JP, et al. m(6)A mRNA methylation sustains treg suppressive functions. Cell Res (2018) 28:253–6. doi: 10.1038/cr.2018.7
12. Yao Y, Yang Y, Guo W, Xu L, You M, Zhang YC, et al. METTL3-dependent m(6)A modification programs T follicular helper cell differentiation. Nat Commun (2021) 12:1333. doi: 10.1038/s41467-021-21594-6
13. Li X, Ma S, Deng Y, Yi P, Yu J. Targeting the RNA m(6)A modification for cancer immunotherapy. Mol Cancer (2022) 21:76. doi: 10.1186/s12943-022-01558-0
14. Tang L, Wei X, Li T, Chen Y, Dai Z, Lu C, et al. Emerging perspectives of RNA n (6)-methyladenosine (m(6)A) modification on immunity and autoimmune diseases. Front Immunol (2021) 12:630358. doi: 10.3389/fimmu.2021.630358
15. Furness PN, Taub N, Assmann KJ, Banfi G, Cosyns JP, Dorman AM, et al. International variation in histologic grading is large, and persistent feedback does not improve reproducibility. Am J Surg Pathol (2003) 27:805–10. doi: 10.1097/00000478-200306000-00012
16. Schinstock CA, Sapir-Pichhadze R, Naesens M, Batal I, Bagnasco S, Bow L, et al. Banff survey on antibody-mediated rejection clinical practices in kidney transplantation: Diagnostic misinterpretation has potential therapeutic implications. Am J Transplant (2019) 19:123–31. doi: 10.1111/ajt.14979
17. Reeve J, Bohmig GA, Eskandary F, Einecke G, Gupta G, Madill-Thomsen K, et al. Generating automated kidney transplant biopsy reports combining molecular measurements with ensembles of machine learning classifiers. Am J Transplant (2019) 19:2719–31. doi: 10.1111/ajt.15351
18. Einecke G, Reeve J, Sis B, Mengel M, Hidalgo L, Famulski KS, et al. A molecular classifier for predicting future graft loss in late kidney transplant biopsies. J Clin Invest (2010) 120:1862–72. doi: 10.1172/JCI41789
19. Reeve J, Sellares J, Mengel M, Sis B, Skene A, Hidalgo L, et al. Molecular diagnosis of T cell-mediated rejection in human kidney transplant biopsies. Am J Transplant (2013) 13:645–55. doi: 10.1111/ajt.12079
20. Halloran PF, Pereira AB, Chang J, Matas A, Picton M, De Freitas D, et al. Potential impact of microarray diagnosis of T cell-mediated rejection in kidney transplants: The INTERCOM study. Am J Transplant (2013) 13:2352–63. doi: 10.1111/ajt.12387
21. Reeve J, Bohmig GA, Eskandary F, Einecke G, Lefaucheur C, Loupy A, et al. Assessing rejection-related disease in kidney transplant biopsies based on archetypal analysis of molecular phenotypes. JCI Insight (2017) 2(12):e94197. doi: 10.1172/jci.insight.94197
22. Li Y, Gu J, Xu F, Zhu Q, Chen Y, Ge D, et al. Molecular characterization, biological function, tumor microenvironment association and clinical significance of m6A regulators in lung adenocarcinoma. Brief Bioinform (2021) 22(4):bbaa225. doi: 10.1093/bib/bbaa225
23. Newman AM, Liu CL, Green MR, Gentles AJ, Feng W, Xu Y, et al. Robust enumeration of cell subsets from tissue expression profiles. Nat Methods (2015) 12:453–7. doi: 10.1038/nmeth.3337
24. Bhattacharya S, Andorf S, Gomes L, Dunn P, Schaefer H, Pontius J, et al. ImmPort: disseminating data to the public for the future of immunology. Immunol Res (2014) 58:234–9. doi: 10.1007/s12026-014-8516-1
25. Subramanian A, Tamayo P, Mootha VK, Mukherjee S, Ebert BL, Gillette MA, et al. Gene set enrichment analysis: a knowledge-based approach for interpreting genome-wide expression profiles. Proc Natl Acad Sci U.S.A. (2005) 102:15545–50. doi: 10.1073/pnas.0506580102
26. Shannon P, Markiel A, Ozier O, Baliga NS, Wang JT, Ramage D, et al. Cytoscape: a software environment for integrated models of biomolecular interaction networks. Genome Res (2003) 13:2498–504. doi: 10.1101/gr.1239303
27. Bindea G, Mlecnik B, Hackl H, Charoentong P, Tosolini M, Kirilovsky A, et al. ClueGO: a cytoscape plug-in to decipher functionally grouped gene ontology and pathway annotation networks. BIOINFORMATICS (2009) 25:1091–3. doi: 10.1093/bioinformatics/btp101
28. Subramanian A, Narayan R, Corsello SM, Peck DD, Natoli TE, Lu X, et al. A next generation connectivity map: L1000 platform and the first 1,000,000 profiles. CELL (2017) 171:1437–52. doi: 10.1016/j.cell.2017.10.049
29. Kurts C, Panzer U, Anders HJ, Rees AJ. The immune system and kidney disease: basic concepts and clinical implications. Nat Rev Immunol (2013) 13:738–53. doi: 10.1038/nri3523
30. Donato R, Sorci G, Giambanco I. S100A6 protein: functional roles. Cell Mol Life Sci (2017) 74:2749–60. doi: 10.1007/s00018-017-2526-9
31. Kazakov AS, Sofin AD, Avkhacheva NV, Denesyuk AI, Deryusheva EI, Rastrygina VA, et al. Interferon beta activity is modulated via binding of specific S100 proteins. Int J Mol Sci (2020) 21(24):9473. doi: 10.3390/ijms21249473
32. Yilmaz MI, Saglam M, Carrero JJ, Qureshi AR, Caglar K, Eyileten T, et al. Normalization of endothelial dysfunction following renal transplantation is accompanied by a reduction of circulating visfatin/NAMPT. a novel marker of endothelial damage? Clin Transplant (2009) 23:241–8. doi: 10.1111/j.1399-0012.2008.00921.x
33. Dedeoglu B, Litjens N, Klepper M, Kraaijeveld R, Verschoor W, Baan CC, et al. CD4(+) CD28(null) T cells are not alloreactive unless stimulated by interleukin-15. Am J Transplant (2018) 18:341–50. doi: 10.1111/ajt.14480
34. Van Loon E, Gazut S, Yazdani S, Lerut E, de Loor H, Coemans M, et al. Development and validation of a peripheral blood mRNA assay for the assessment of antibody-mediated kidney allograft rejection: A multicentre, prospective study. EBIOMEDICINE (2019) 46:463–72. doi: 10.1016/j.ebiom.2019.07.028
35. Halloran PF. T Cell-mediated rejection of kidney transplants: a personal viewpoint. Am J Transplant (2010) 10:1126–34. doi: 10.1111/j.1600-6143.2010.03053.x
36. Loupy A, Haas M, Roufosse C, Naesens M, Adam B, Afrouzian M, et al. The banff 2019 kidney meeting report (I): Updates on and clarification of criteria for T cell- and antibody-mediated rejection. Am J Transplant (2020) 20:2318–31. doi: 10.1111/ajt.15898
37. Halloran PF, Famulski KS, Reeve J. Molecular assessment of disease states in kidney transplant biopsy samples. Nat Rev Nephrol (2016) 12:534–48. doi: 10.1038/nrneph.2016.85
38. Li HB, Tong J, Zhu S, Batista PJ, Duffy EE, Zhao J, et al. m(6)A mRNA methylation controls T cell homeostasis by targeting the IL-7/STAT5/SOCS pathways. NATURE (2017) 548:338–42. doi: 10.1038/nature23450
39. Lei H, He M, He X, Li G, Wang Y, Gao Y, et al. METTL3 induces bone marrow mesenchymal stem cells osteogenic differentiation and migration through facilitating M1 macrophage differentiation. Am J Transl Res (2021) 13:4376–88.
40. Wang H, Hu X, Huang M, Liu J, Gu Y, Ma L, et al. Mettl3-mediated mRNA m(6)A methylation promotes dendritic cell activation. Nat Commun (2019) 10:1898. doi: 10.1038/s41467-019-09903-6
41. Gu X, Zhang Y, Li D, Cai H, Cai L, Xu Q. N6-methyladenosine demethylase FTO promotes M1 and M2 macrophage activation. Cell Signal (2020) 69:109553. doi: 10.1016/j.cellsig.2020.109553
42. Ito-Kureha T, Leoni C, Borland K, Cantini G, Bataclan M, Metzger RN, et al. The function of wtap in N(6)-adenosine methylation of mRNAs controls T cell receptor signaling and survival of T cells. Nat Immunol (2022) 23:1208–21. doi: 10.1038/s41590-022-01268-1
43. Halloran PF, Venner JM, Madill-Thomsen KS, Einecke G, Parkes MD, Hidalgo LG, et al. Review: The transcripts associated with organ allograft rejection. Am J Transplant (2018) 18:785–95. doi: 10.1111/ajt.14600
44. Rabant M, Amrouche L, Lebreton X, Aulagnon F, Benon A, Sauvaget V, et al. Urinary c-X-C motif chemokine 10 independently improves the noninvasive diagnosis of antibody-mediated kidney allograft rejection. J Am Soc Nephrol (2015) 26:2840–51. doi: 10.1681/ASN.2014080797
45. Schiffer L, Wiehler F, Brasen JH, Gwinner W, Greite R, Kreimann K, et al. Chemokine CXCL13 as a new systemic biomarker for b-cell involvement in acute T cell-mediated kidney allograft rejection. Int J Mol Sci (2019) 20(10):2552. doi: 10.3390/ijms20102552
46. Gillies MA, Kakar V, Parker RJ, Honore PM, Ostermann M. Fenoldopam to prevent acute kidney injury after major surgery-a systematic review and meta-analysis. Crit Care (2015) 19:449. doi: 10.1186/s13054-015-1166-4
47. Ponticelli C. Ischaemia-reperfusion injury: a major protagonist in kidney transplantation. Nephrol Dial Transplant (2014) 29:1134–40. doi: 10.1093/ndt/gft488
48. Roshanravan H, Kim EY, Dryer SE. NMDA receptors as potential therapeutic targets in diabetic nephropathy: Increased renal NMDA receptor subunit expression in akita mice and reduced nephropathy following sustained treatment with memantine or MK-801. DIABETES (2016) 65:3139–50. doi: 10.2337/db16-0209
Keywords: N6-methyladenosine (m6A), kidney transplantation, alloimmunity, graft loss, T-cell mediate rejection, biopsies for cause, prediction model
Citation: Pang Q, Chen H, Wu H, Wang Y, An C, Lai S, Xu J, Wang R, Zhou J and Xiao H (2022) N6-methyladenosine regulators-related immune genes enable predict graft loss and discriminate T-cell mediate rejection in kidney transplantation biopsies for cause. Front. Immunol. 13:1039013. doi: 10.3389/fimmu.2022.1039013
Received: 07 September 2022; Accepted: 01 November 2022;
Published: 22 November 2022.
Edited by:
Long Zheng, The second Affiliated Hospital of Zhejiang University School of Medicine, ChinaReviewed by:
Yingzi Ming, Central South University, ChinaCopyright © 2022 Pang, Chen, Wu, Wang, An, Lai, Xu, Wang, Zhou and Xiao. This is an open-access article distributed under the terms of the Creative Commons Attribution License (CC BY). The use, distribution or reproduction in other forums is permitted, provided the original author(s) and the copyright owner(s) are credited and that the original publication in this journal is cited, in accordance with accepted academic practice. No use, distribution or reproduction is permitted which does not comply with these terms.
*Correspondence: Hanyu Xiao, eGlhb2hhbnl1MzM5OUBmb3htYWlsLmNvbQ==; Juan Zhou, emo2MDQwNTAxMjlAMTYzLmNvbQ==
†These authors have contributed equally to this work and share first authorship
Disclaimer: All claims expressed in this article are solely those of the authors and do not necessarily represent those of their affiliated organizations, or those of the publisher, the editors and the reviewers. Any product that may be evaluated in this article or claim that may be made by its manufacturer is not guaranteed or endorsed by the publisher.
Research integrity at Frontiers
Learn more about the work of our research integrity team to safeguard the quality of each article we publish.