 Haiyan Li
 Menglong Li
 Kun Li
 Xuemei Pu
 Yanzhi Guo
95% of researchers rate our articles as excellent or good
Learn more about the work of our research integrity team to safeguard the quality of each article we publish.
Find out more
ORIGINAL RESEARCH article
Front. Immunol. , 01 December 2022
Sec. Cancer Immunity and Immunotherapy
Volume 13 - 2022 | https://doi.org/10.3389/fimmu.2022.1027631
This article is part of the Research Topic Immune Microenvironment and Immunotherapy in Malignant Brain Tumors View all 23 articles
Introduction: As a malignant brain tumor, glioblastoma (GBM) is characterized by intratumor heterogeneity, a worse prognosis, and highly invasive, lethal, and refractory natures. Immunotherapy has been becoming a promising strategy to treat diverse cancers. It has been known that there are highly heterogeneous immunosuppressive microenvironments among different GBM molecular subtypes that mainly include classical (CL), mesenchymal (MES), and proneural (PN), respectively. Therefore, an in-depth understanding of immune landscapes among them is essential for identifying novel immune markers of GBM.
Methods and results: In the present study, based on collecting the largest number of 109 immune signatures, we aim to achieve a precise diagnosis, prognosis, and immunotherapy prediction for GBM by performing a comprehensive immunogenomic analysis. Firstly, machine-learning (ML) methods were proposed to evaluate the diagnostic values of these immune signatures, and the optimal classifier was constructed for accurate recognition of three GBM subtypes with robust and promising performance. The prognostic values of these signatures were then confirmed, and a risk score was established to divide all GBM patients into high-, medium-, and low-risk groups with a high predictive accuracy for overall survival (OS). Therefore, complete differential analysis across GBM subtypes was performed in terms of the immune characteristics along with clinicopathological and molecular features, which indicates that MES shows much higher immune heterogeneity compared to CL and PN but has significantly better immunotherapy responses, although MES patients may have an immunosuppressive microenvironment and be more proinflammatory and invasive. Finally, the MES subtype is proved to be more sensitive to 17-AAG, docetaxel, and erlotinib using drug sensitivity analysis and three compounds of AS-703026, PD-0325901, and MEK1-2-inhibitor might be potential therapeutic agents.
Conclusion: Overall, the findings of this research could help enhance our understanding of the tumor immune microenvironment and provide new insights for improving the prognosis and immunotherapy of GBM patients.
Glioblastoma (GBM) is the most common malignant primary brain tumor, accounting for 82% of all malignant gliomas (1). Due to its malignant growth and invasion into the brain parenchyma, coupled with resistance to chemotherapy and targeted therapy, GBM is the deadliest cancer among all cancers (2). GBM could be divided into four subtypes based on an unsupervised gene expression analysis by Verhaak et al. in 2010, including classical (CL), mesenchymal (MES), proneural (PN), and neural (NE), each featuring distinct genetic, epigenetic, and transcriptional alterations (3). CL GBM has a high rate of EGFR gene amplification and expresses the markers of neuron precursor cells and stem cells (4, 5). MES reveals the features of cultured astrocytic gliomas with predominant NF1 gene aberrations and PTEN mutations. It is commonly linked to a poor prognostic outcome (4, 6) and also shows the highest inflammatory signature with significant upregulation of genes in the TNF and NF-κB pathways (7). PN is characterized by a lower incidence rate and the best median patient survival. It has PDGFRA alterations and point mutations of IDH1 and develops mainly in younger patients with secondary glioblastoma (5, 7). Clustered in the normal brain samples, NE shows strong expression of neuronal markers including NEEL, GABRA1, SYT1, and SLC12A5 (6). So, we can see that different GBM subtypes exhibit a high degree of inter- and intratumor heterogeneity.
Immunotherapy, represented by immune checkpoint blockage (ICB), has been becoming an appealing treatment for gliomas. Immune checkpoint inhibitors (ICIs) can induce an improved clinical response in patients, and emerging evidence has disclosed that the anticancer efficacy of ICIs is dependent on the tumor microenvironment (TME) (8). As a vital mediator of tumor malignant progression and therapeutic outcome, TME is closely associated with the immune evasion of tumor cells. The GBM microenvironment mainly consists of non-neoplastic cells, infiltrating and resident immune cells, vascular cells, and other glial cells (9). In the TME, through infiltration into tumor tissue to form the tumor immune microenvironment (TIME), immune cells could help tumor cells achieve immune escape and promote tumor malignancy, which is closely associated with the response rate of immunotherapy (10). It is known that there is a highly heterogeneous immunosuppressive microenvironment in GBM (11–13); therefore, it is of great practical significance to explore the differences in immune landscapes among GBM subtypes.
Recently, almost all studies focusing on the GBM immune landscape selected only one of the different immune signatures to divide GBM patients into different immune phenotypes, such as immune-related genes (1, 14), lncRNAs (15), immune cell infiltration-associated genes (16), abundances of immune cells (10, 17), and antigen presentation machinery (APM) signature (18). Moreover, for the immune landscape of GBM subtypes, Doucette et al. have studied the associations of antigen expression, immunosuppression, and effector response genes within GBM subtypes (19). The distribution and the infiltration of the immune components across the commonly described subgroups have been analyzed by Maria et al. using an immunohistochemistry-based approach (6). Until now, there has been no comprehensive analysis of the immune landscape among GBM subtypes that integrates various immune characteristics.
Meanwhile, machine learning (ML)-based methods could detect key features from complex datasets and have been popular applications in clinical cancer research in recent years, such as early diagnosis, subtype identification, prognosis prediction, and so on (20). It has been used to classify various cancer subtypes, for example, breast cancer (21), adult T-cell leukemia/lymphoma (22), kidney cancer (23), and glioma (24). The application of ML for cancer subtype identification will enable accurate diagnosis and regard to the clinical management of patients. By performing a comprehensive immunogenomic analysis, we aim to develop ML-based models to achieve a precise diagnosis, prognosis, and immunotherapy prediction for GBM.
In this study, we integrated the expression profiles of 397 GBM samples from public databases and studies. Single-sample gene-set enrichment analysis (ssGSEA), xCell, ESTIMATE, and other algorithms were employed to collect the largest number of immune signatures, and 109 immune signatures were utilized to comprehensively characterize the immune landscapes of GBM subtypes.
Initially, we focused on constructing an immune signature-based model for the accurate recognition of different GBM subtypes using ML methods. Among 109 features, 61 were proved to yield great contributions to the identification of three GBM subtypes, and the RBF-based support vector machine (SVM) gives the best diagnostic performance. Moreover, the prognostic values of these 61 optimal immune features were determined, and a prognostic risk model was established for the OS prediction of GBM patients based on 13 survival-associated immune signatures using multivariate Cox regression analysis. A complete differential analysis across GBM subtypes was then performed on the optimal immune characteristics. Moreover, clinicopathological and molecular features were also considered for comparisons of the three subtypes. Analyses of exhausted CD8+T cells and anti-PD-1 immunotherapy response were also conducted. Eventually, based on the differential upregulated genes of MES compared to CL and PN samples, gene-set cancer analysis (GSCA) and connectivity map (CMap) analysis were also performed to achieve potential antitumor drugs or small molecules for MES patients.
GBM samples are commonly classified into four subtypes CL, MES, PN, and neutral (NE), respectively. Currently, only a few NE samples are available, so we mainly considered the three classes of CL, MES, and PN. We downloaded three gene expression profiling datasets along with the corresponding clinical information for the three subtypes, including TCGA-GBM from the TCGA data portal (https://portal.gdc.cancer.gov/), the Gravendeel microarray dataset from the GlioVis database (http://gliovis.bioinfo.cnio.es/), and the Wang RNA-seq dataset (25), respectively. After deleting samples without either expression data or clinical information, 397 eligible GBM samples remained, consisting of 131 CL, 140 MES, and 126 PN samples. Firstly, the missing gene expression data in the Wang RNA-seq dataset were complemented by the K-nearest neighbor (KNN) method. These gene expression data were then transformed into transcripts per kilobase million (TPM) format so as to calculate immune characteristics. Finally, the ComBat method from the “SVA” R package was used to remove the batch effects among three different datasets.
Here, we aim to collect the largest number of immune characteristics to construct comprehensive immune landscapes for GBM samples. By performing a deep exploration of the literature, various immune characteristics were acquired, including 28 tumor-infiltrating lymphocytes, 64 immune and stromal cells, the cytolytic score (CYT score), the T-cell infiltration score (TIS score), the immune score, the stromal score, tumor purity, the innate and adaptive immune scores, the immune checkpoint gene score (ICG score), the APM score, the T-cell exhaustion markers, and the corresponding genes of glioma antigens.
Firstly, the ssGSEA algorithm was employed to quantify the relative abundances of 28 tumor-infiltrating lymphocytes, the TIS score, the innate and adaptive immune scores, and the APM score. The gene sets for 28 tumor-infiltrating lymphocytes were obtained from the TISIDB database (http://cis.hku.hk/TISIDB/), and those for calculating the TIS score were from the studies of Şenbabaoğlu et al. (26). From the work of Charoentong et al. (27), a set of genes that mark each infiltrating immune cell type were obtained for innate and adaptive immune scores. These gene sets are shown in Supplementary Tables S1–S3. For the APM score, the following genes were collected for estimation of the APM signature: PSMB5, PSMB6, PSMB7, PSMB8, PSMB9, PSMB10, TAP1, TAP2, ERAP1, ERAP2, CANX, CALR, PDIA3, TAPBP, B2M, HLA-A, HLA-B, and HLA-C (18).
The abundances of 64 various cell types were then achieved using the “xCell” R package (28). The CYT score, representing cytolytic activity, was calculated as the geometric mean of two genes’ expression, including GZMA and PRF1 using the established methodology by Takahashi et al. (8). The ESTIMATE algorithm was used to evaluate the immune score, stromal score, and tumor purity of each GBM sample for determining the immune infiltration level in the tumor. We computed the average expression value of six immune checkpoint genes, including PDCD1, CD274, CTLA4, HAVCR2, LAG3, and TIGIT, as the ICG score of every GBM sample.
Moreover, we also assessed the expressions of T-cell exhaustion markers and corresponding genes of glioma antigens (6). They are composed of 11 genes (PDCD1, CD274, CTLA4, IDO1, IDO2, LAG3, HAVCR2, PDCD1LG2, TIGIT, ADORA2A, and VTCN1) and 17 genes (EGFR, ERBB2, BIRC5, NCL, EPHA2, TERT, CCNB1, SART1, DSE, SART3, AIM2, TYRP1, TYR, MGAT5, PMEL, MLANA, and MAGEA1), respectively.
Finally, after deleting the overlaps between 28 tumor-infiltrating lymphocytes and 64 immune and stromal cells, a total of 109 immune signatures were achieved (Table 1) and then normalized by z-score for further integrative immunogenomic analysis. Details can be seen in Supplementary Table S4.
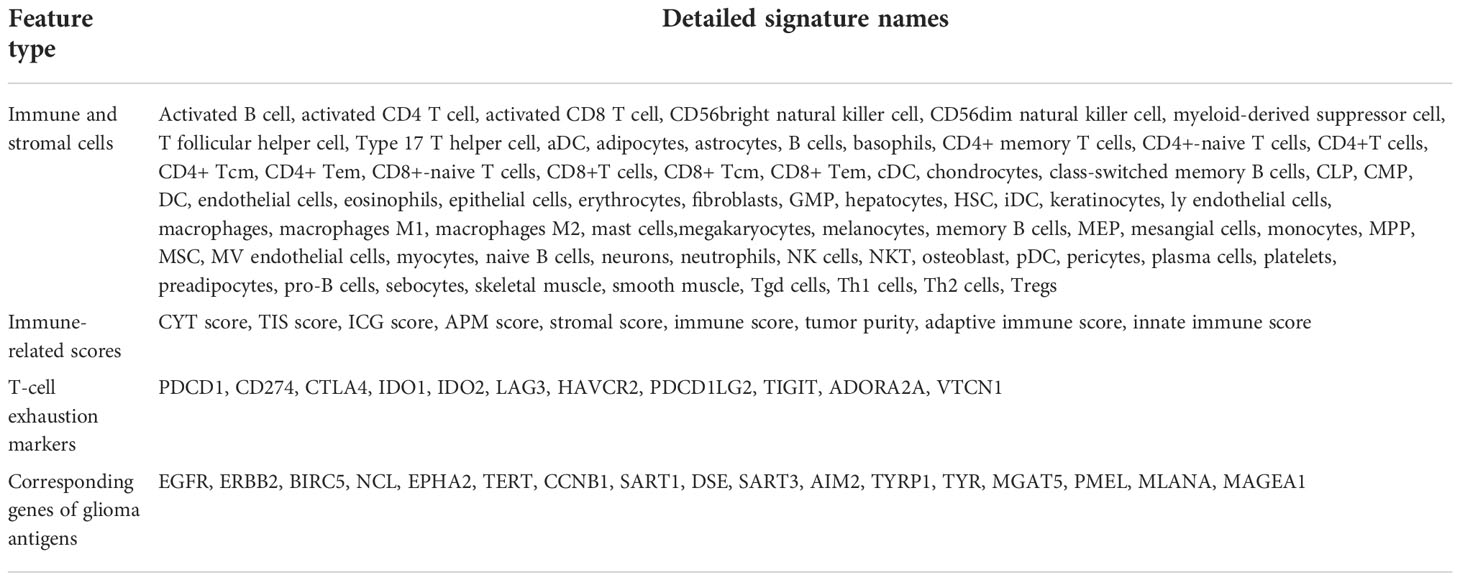
Table 1 List of 109 immune signatures collected in this paper.
In order to select the distinctive immune features for distinguishing three GBM subtypes, support vector machine recursive feature elimination (SVM-RFE) was used to evaluate all 109 signatures. SVM-RFE is a backward feature deletion method based on SVM, and it recursively removes the features with the lowest weights that are computed after the SVM learning model is built (29). On account of its superiority, SVM-RFE has been widely adopted for feature selection of genomics, proteomics, and metabolomics data (30). To perform a reliable and convincing feature evaluation, SVM-RFE was implemented 100 times on 109 immune signatures, and those retained more than 50 times were selected as the distinctive ones.
In order to give an optimal model for diagnostic prediction of GBM subtypes, based on the selected immune signatures by SVM-RFE, the four most widely used ML methods were adopted for model construction, including support vector machine (SVM), random forest (RF), extreme gradient boosting (XGBoost), and artificial neural network (ANN), respectively.
Proposed by Vapnik in 1992 (31), SVM is a widely used ML method in bioinformatics due to its high accuracy and ability to deal with high-dimensional data (32). As a powerful method for building a classifier, the basic idea behind it is creating a decision boundary between two classes that enables the prediction of labels from one or more feature vectors (33). It has been used successfully in various cancer identification and subtyping, including breast cancer (34), lung cancer (35), lymphoma cancer (36), adult soft tissue sarcoma (37), and others. For the SVM method, four currently available kernel functions of “linear,” “polynomial,” “RBF,” and “sigmoid” were all used to construct prediction models, respectively.
Provided by Beriman et al. in 2001 (38), RF is a classification and regression method based on the aggregation of a large number of decision trees. It is an ensemble method that grows trees as base learners and combines their predicting results by averaging; in other words, the ultimate prediction is determined by the votes of all the trees for a binary task (39, 40). RF is known for its great practical performance, particularly in high-dimensional settings, and has become a standard data analysis tool in bioinformatics (41).
As a regression tree that has the decision rules as a decision tree, the XGBoost algorithm was first proposed by Chen et al. (42). It can be used for regression, classification, and ranking problems. It is a ML model that integrates multiple weak learners to achieve a stronger learning effect (43). Compared with other traditional ML algorithms, XGBoost is highly scalable and flexible. It has been shown to perform exceptionally well in a variety of tasks in bioinformatics and medicine (44).
Inspired by the early models of sensory processing by the brain, ANN is created by stimulating a network of model neurons in a computer (45). The elementary building blocks of ANN are artificial neurons, and nodes in the neural network can be mostly divided into three layers: the input layer, the output layer, and one or more hidden layers (46). Due to the high parallelism, robustness, generalization, and noise tolerance of ANN, it has been applied in various domains, and within cancer research alone, ANN can be applied to disease diagnosis, image processing, and treatment-response forecasting (47).
Usually, the ML methods are for binary classification. Here, a multiple-label vector was used to construct the triple-class classifier. For CL samples, the label vector is [1 0 0], MES is [0 1 0], and PN is [0 0 1]. The performance of the models developed by different ML algorithms is closely related to the hyperparameters. In order to optimize the hyperparameters of each classifier, we carried out the grid search approach and fivefold cross-validation. Finally, the model was fitted on the training set with the optimal parameters and then evaluated on the corresponding testing set. For each model, 397 GBM patients were randomly divided into training and testing sets according to the ratio of 8:2. Meanwhile, in order to prove the stability of each model, the data division was repeated 50 times, so 50 different training sets and corresponding testing sets were generated. The performance of each classification model was assessed by averaging the accuracy (ACC), Precision, Recall, and F1 scores from the 50 testing sets. Here, four ML methods could give seven different classifiers, and the optimal one with the best performance would be selected as the final classifier. The following are the equations of four evaluation parameters:
Where TP, FP, TN, and FN are true positive, false positive, true negative, and false negative, respectively.
To explore the differences among the three GBM subtypes, we analyzed the associations between GBM subtypes and immune, molecular, and clinical characteristics, respectively. We investigated the difference in immune signatures among three GBM subtypes using the Kruskal–Wallis test (K-W test), and a two-sided p< 0.05 is considered a significant difference. The Kaplan–Meier curve was calculated to detect if there were survival differences among subtypes. Moreover, the divergence of isocitrate dehydrogenase (IDH) mutation status and methylguanine methyltransferase (MGMT) promoter methylation status among the three subtypes of patients was studied. Gene-set variation analysis (GSVA) was executed by the “GSVA” package to acquire the GSVA scores of biological pathways and GO terms of each GBM patient. The “limma” package was used to investigate significantly differential pathways and GO terms between three GBM subtypes, and those with an adjusted p-value of< 0.05 were considered statistically significant.
A univariate Cox regression analysis was performed to analyze the relationships between immune characteristics and the OS of GBM patients. The immune features that were significantly associated with the GBM OS in the univariate Cox regression analysis were then entered into a step-wise multivariate Cox regression analysis using the “survminer” R package to select the key immune features with great prognostic values. In addition, the immune signatures with p-value of< 0.05 were used to build the prognostic model. The risk score of each GBM patient was calculated by the following formula:
Where βi is the regression coefficient and IFi is the value of the corresponding immune features. According to the cutoff value determined by X-tile, GBM patients were divided into high-, medium-, and low-risk groups. The Kaplan–Meier method and log-rank tests were implemented to estimate the differences in OS among subgroups. Furthermore, receiver operating characteristic (ROC) analysis was performed to investigate the prognosis performance of the model, and area under the ROC curve (AUC) values were calculated. Meanwhile, the stratified analysis was performed to determine whether the prognostic signature is independent of other clinical variables, including gender, age, IDH status, and MGMT status, respectively.
T-cell exhaustion is a hypofunctional state characterized by the accumulation of multiple co-inhibitory checkpoint receptors consisting of PD1, CTLA4, TIM3, and LAG3 (48). We acquired the upregulated PD-1-positive gene list by selecting differentially expressed genes between PD-1-high and PD-1-negative CD8+T cells from the work of Cai et al. (49). The list incorporates 478 genes in our whole dataset (Supplementary Table S5). To define a gene expression signature of exhausted CD8+T cells, Pearson’s correlation analysis was implemented to assess the relationship between these upregulated genes and PDCD1. A list of genes with correlation efficiency of > 0.25 and adjusted p-value of< 0.05 was considered the gene signature for exhausted CD8+T cells, and the gene signature was used to conduct ssGSEA to obtain the ssGSEA score as an exhausted CD8+T cell (GET) score. Here, a higher GET score indicates the better immunotherapy response.
To further investigate the immunotherapy responses of patients with different GBM types, SubMap analysis (50) was used to compare gene expression matrices of different subtypes with those from other cancers treated with immune checkpoint blockade therapy, including transcriptomic data from 65 patients receiving anti-PD1 therapy (51) by implementing the subclass mapping method. This step was implemented on the SubMap module of the GenePattern website (http://genepattern.broadinstitute.org/) with default parameters (num marker genes = 100, num perm = 100, and num perm Fisher = 1,000).
We enforced the Wilcoxon test to screen out the upregulated genes of MES compared to CL and PN patients with log2FC of > 2 and adjusted p-value of< 0.05. Drug sensitivity prediction was carried out using “Drug Sensitivity of Gene Set Cancer Analysis” (GSCALite, http://bioinfo.life.hust.edu.cn/web/GSCALite/) with those upregulated hub genes as input. GSCA integrates drug sensitivity and gene expression profiling data from cancer cell lines in Genomics of Drug Sensitivity in Cancer (GDSC) and Cancer Therapeutics Response Portal (CTRP). It predicts the drug response based on the calculated correlation between mRNA expression and drug with 50% inhibitory concentration (IC50) (52). The negative correlations mean that the predicted drugs have potential activity.
In addition, these upregulated genes were also uploaded to the CMap online tool (https://clue.io) to predict the effect of drugs on particular gene expression patterns in tumors. The result of CMap provides a score from −100 to 100 to estimate the match between the interested genes and chemicals, and bioactive chemicals with a negative score might be candidate drugs for the treatment of patients.
Through performing SVM-RFE 100 times on the 109 immune signatures, those that were retained with more times could probably contribute more to the identification of three GBM subtypes. There are 73 signatures retained more than 50 times in our experiment, so they were selected for comparisons of different ML methods.
In order to give convincing comparisons, the whole dataset was divided into training and testing sets 50 times in an 8:2 ratio. Based on each training set, fivefold cross-validation was used to build the model, and the performance of the model was tested by the testing set. For seven different ML methods, the overall performance was compared by averaging those of 50 different testing sets. The comparison results are summarized in Figure 1A. We can see that compared to RF, XGBoost, and ANN, the SVM algorithm shows better prediction performance. Although the four different kernel function-based SVM models give comparable results, the RBF-based model exhibits slightly higher ACC and F1 values than the other three models. Since RBF has been the most widely used kernel for resolving nonlinear classification problems, RBF-based SVM was selected as the optimal classifying algorithm.
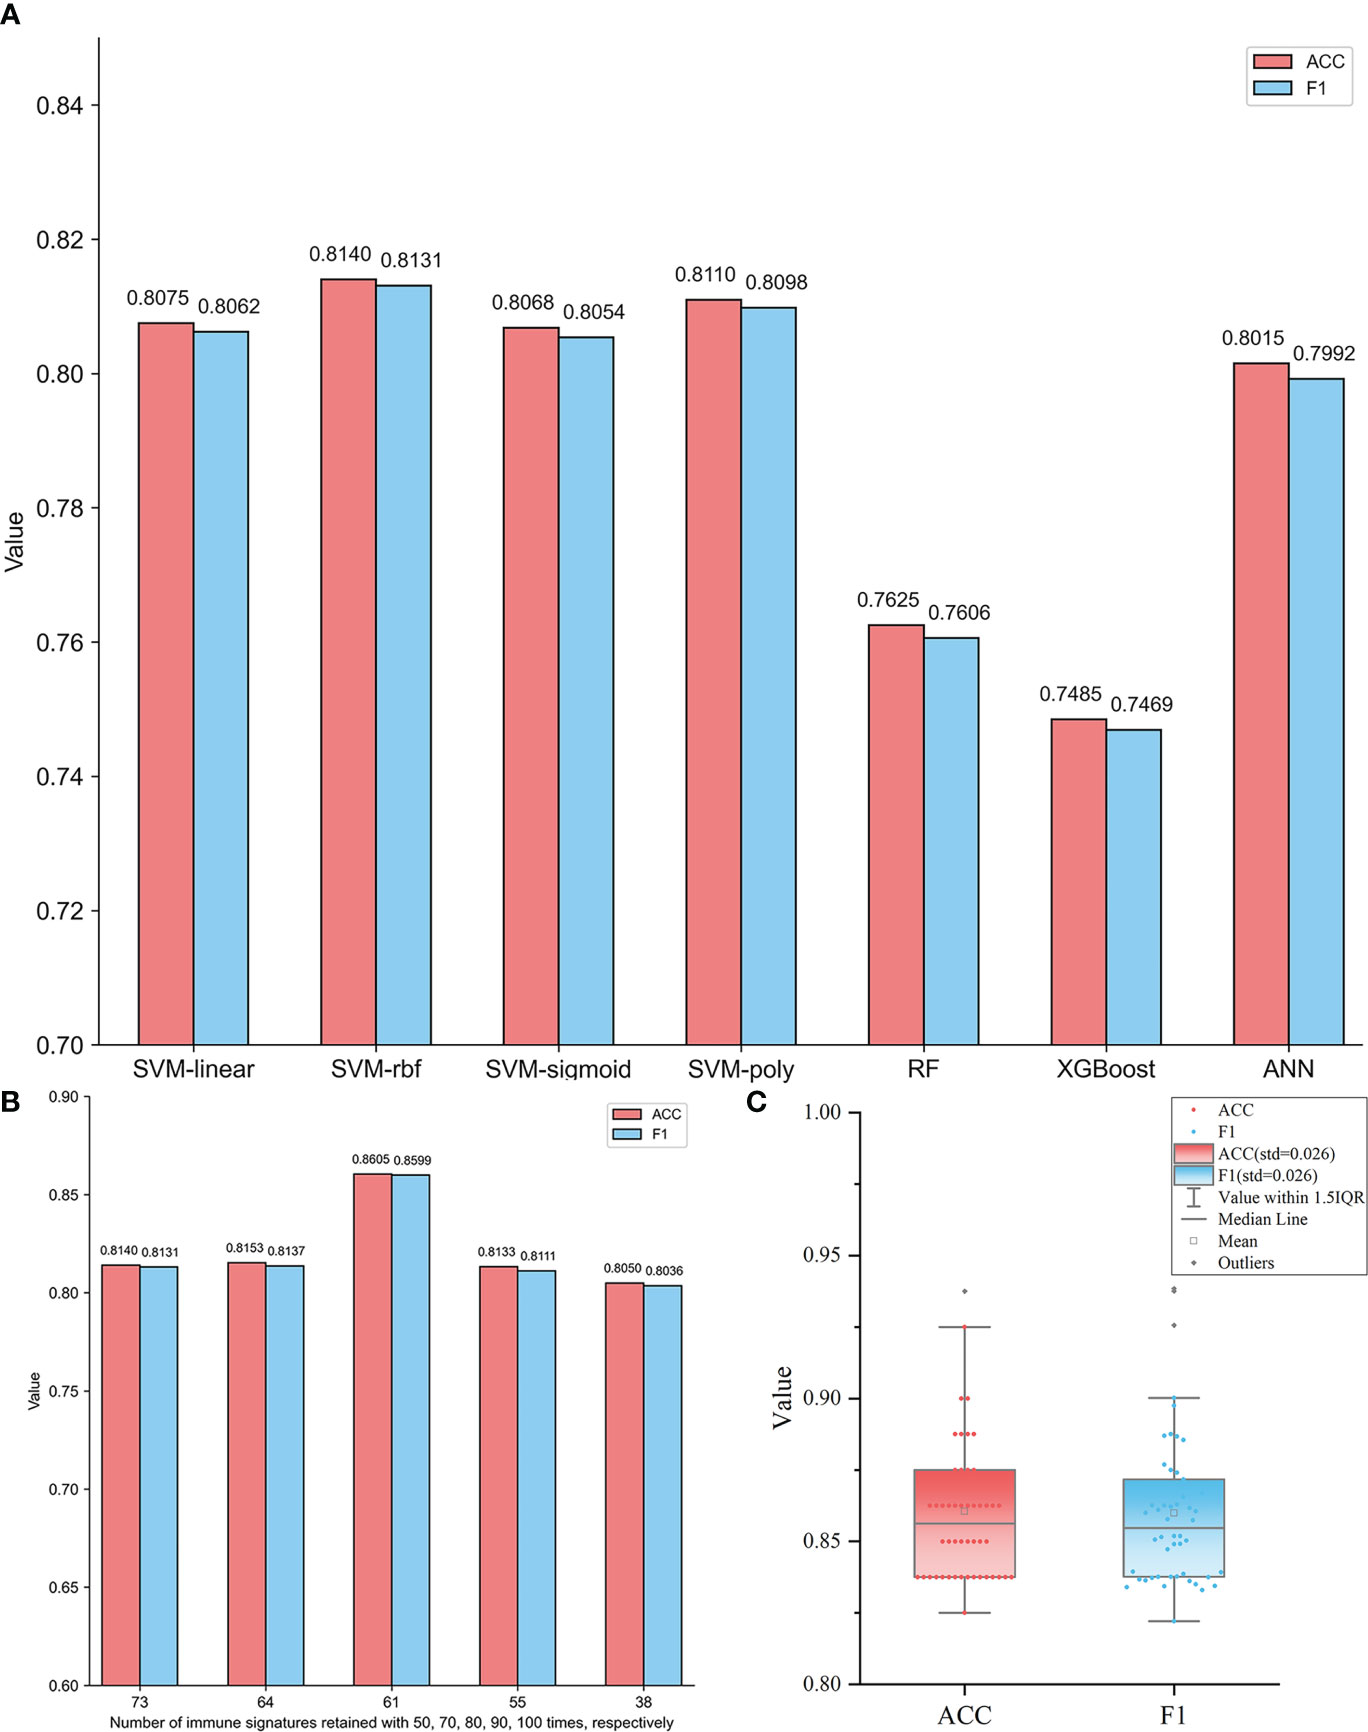
Figure 1 (A) Performance comparisons of different ML models based on 73 immune signatures retained at least 50 times in SVM-RFE 100 times. The ACC and the F1 values of each model are the averages of those for 50 different testing sets generated by randomly dividing each subtype dataset into training and testing sets 50 times. (B) Comparisons of RBF-based SVM models based on five feature subsets containing immune signatures retained at least 50, 70, 80, 90, and 100 times, respectively. The ACC and the F1 values of each model are the averages of those for 50 different testing sets generated by randomly dividing each subtype dataset into training and testing sets 50 times. (C) The distributions of ACC and F1 values of 50 different testing sets based on the RBF-based SVM model with 61 optimal immune signatures retained at least 80 times.
Using the RBF-based SVM model, the diagnostic ability of these 73 signatures was further evaluated. In order to evaluate the performance of different feature subsets for GBM subtypes identification, additional four feature subsets containing 64, 61, 55, and 38 signatures were also extracted to construct classifiers. They were retained at least 70, 80, 90, and 100 times, respectively, by SVM-RFE. Figure 1B shows the performance of RBF-based SVM models based on five feature subsets, respectively. The AAC and F1 values of each model are the averages of 50 testing sets. It is observed that in Figure 1B, the model based on 61 immune signatures retained at least 80 times showed significantly superior performance than others. It yields the highest ACC and F1 values of 0.8605 and 0.8599, respectively. So, the optimal model of RBF-based SVM with 61 signatures (Supplementary Table S6) was obtained. Moreover, the robustness of this model was also confirmed by the prediction results of 50 individual testing sets, which is shown in Figure 1C. The distributions of ACC and F1 values indicate that the 50 models all give a slightly varying performance, although they were constructed based on different training sets. The standard deviation (std) values are both only 0.026. So, the selected optimal model is robust.
Since the best ML method of RBF-based SVM and the optimal feature subset with 61 immune signatures were selected, the final classifier was constructed using 10-fold cross-validation on the whole dataset, including 397 GBM samples. The prediction results of the final classifier are shown in Table 2, indicating a promising prediction performance. The ACC, Precision, Recall, and F1 scores in 10-fold cross-validation are 0.8538, 0.8519, 0.8621, and 0.8525, respectively. Especially, the Precision and Recall values for the MES subtype are 0.9071 and 0.8841, respectively, indicating the high recognition success rate for MES by the final classifier, so the final classifier gives satisfactory performance for resolving the triple-class problem.
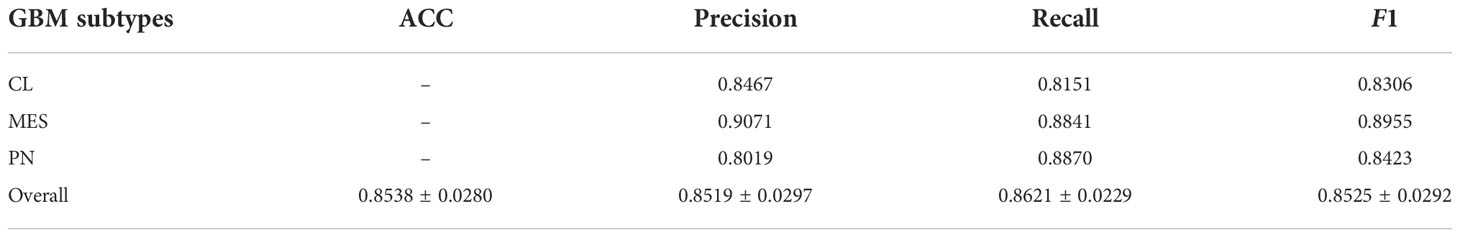
Table 2 The prediction results of the final classifier constructed by RBF-based SVM using a 10-fold cross-validation test on the whole dataset (397 samples).
We explored the potential prognostic values of 61 immune characteristics employed in the diagnostic classifier. The prognostic value determination was performed on all GBM samples by univariate Cox regression analysis. The forest plot in Figure 2A demonstrates that there are 26 immune signatures that are significantly associated with the OS of GBM. Stepwise multivariate Cox regression analysis was then implemented to further select an optimal combination from these 26 immune signatures. Thus, 13 were identified and used to construct the risk score classifier model. Based on the risk score model, we divided patients into high-, medium-, and low-risk groups using cutoff risk scores determined by X-tile. From the Kaplan–Meier curve analysis in Figure 2B, it can be seen that high-risk patients have a shorter survival rate compared to those in the medium- and low-risk groups (p< 0.0001). The ROC curves in Figures 2C–E indicate that an immune signature-based risk score could sensitively predict OS with AUC values of 0.663, 0.781, and 0.903 for 1-, 3-, and 5-year OS, respectively. In addition, as shown in Figures 2F, G, univariate and multivariate Cox regression analyses revealed that the risk score developed by us is independent of MGMT status and age. So these immune signatures could be the prognostic indicators for GBM patients’ OS.
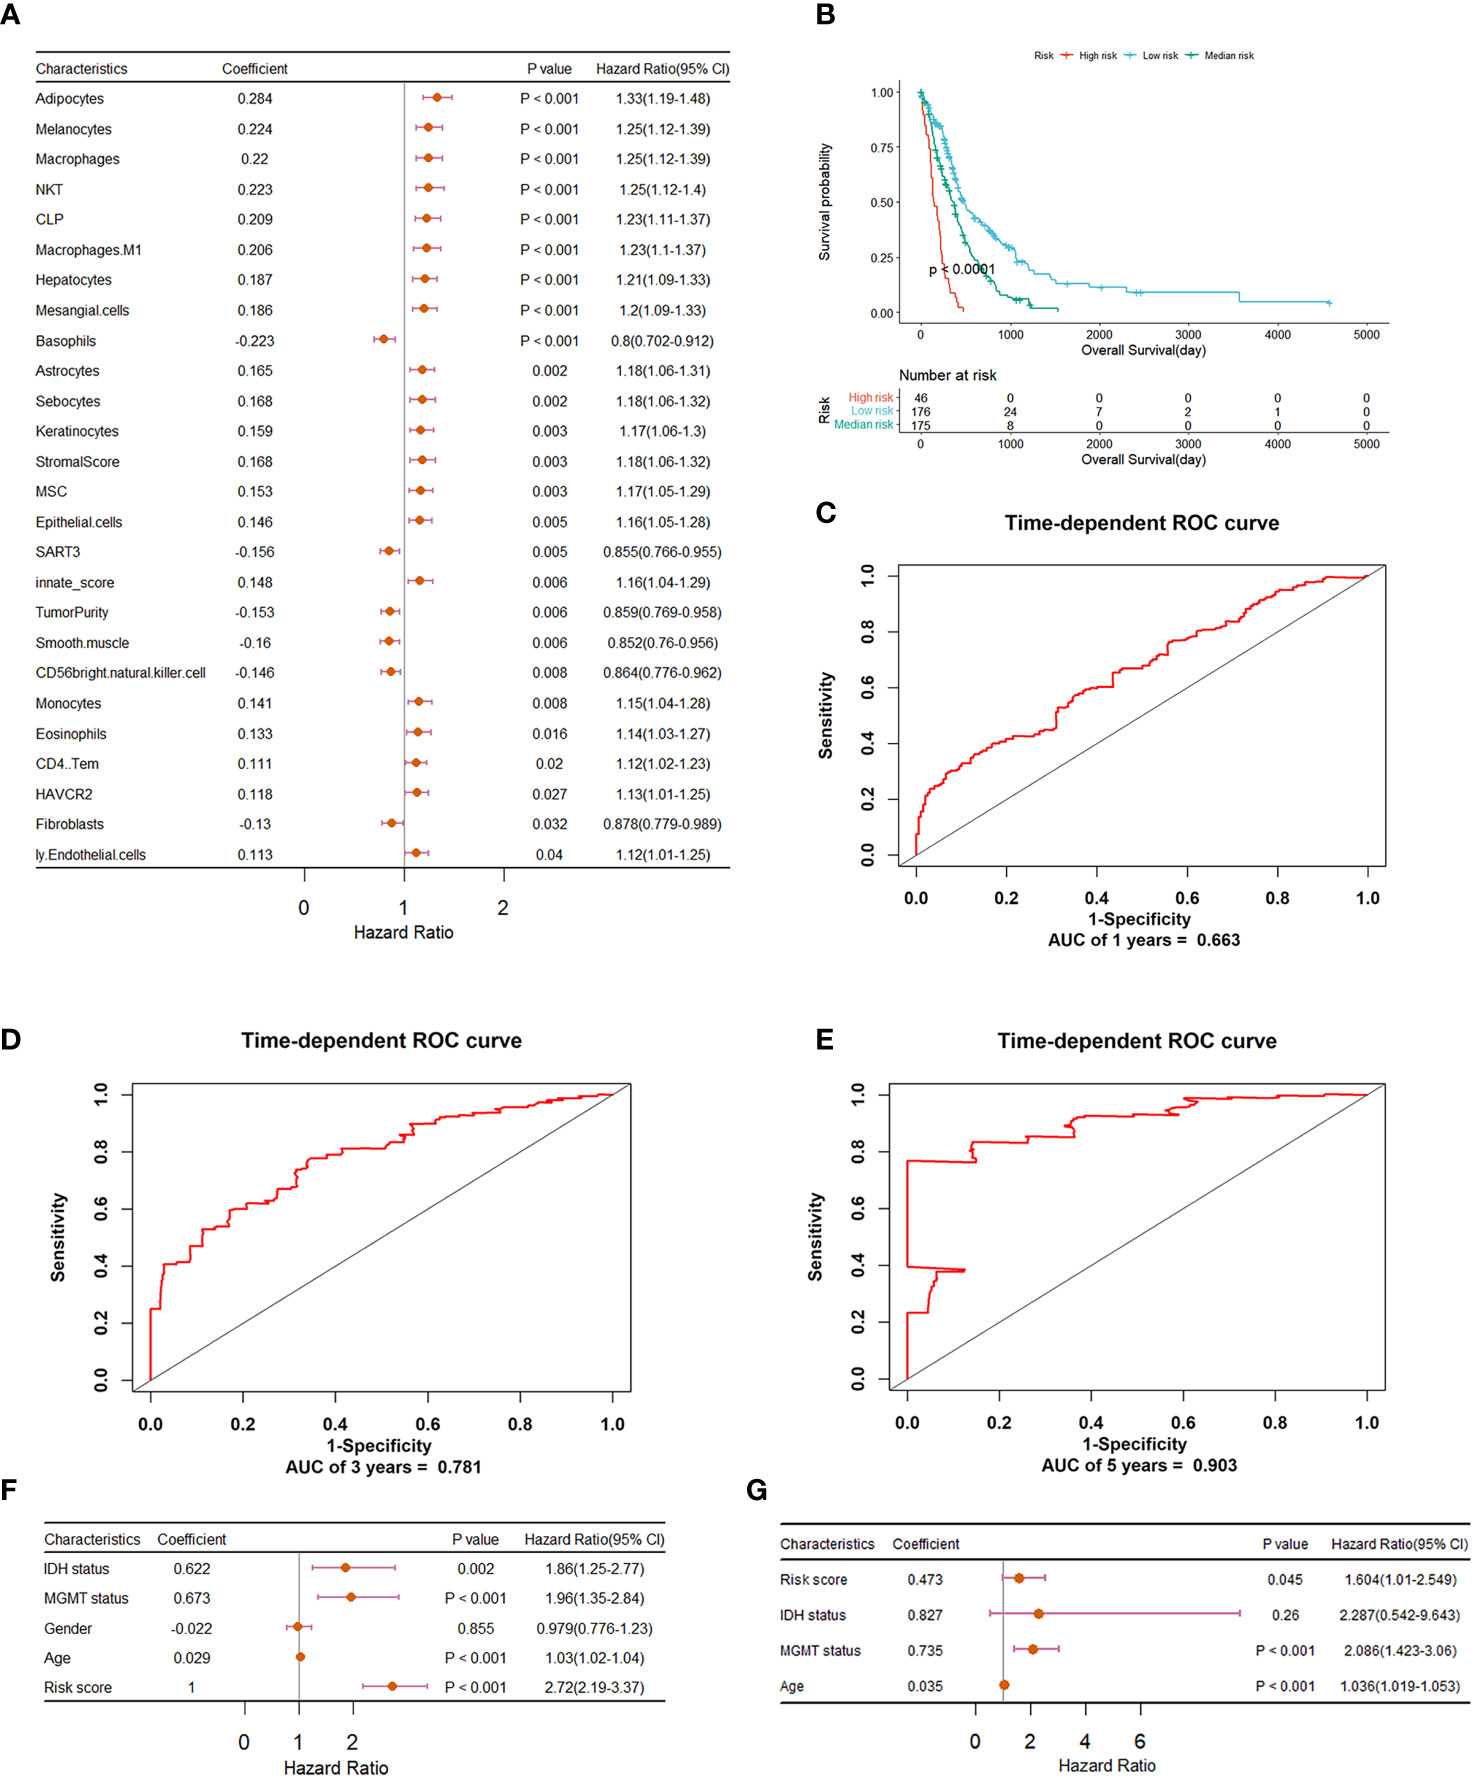
Figure 2 Construction and evaluation of the risk prognostic model based on immune features for GBM patients. (A) Forest plot summary of univariate Cox regression analysis of immune features significantly associated with overall survival. (B) Kaplan–Meier survival analysis of GBM patients that were divided into high-, medium-, and low-risk groups using a cutoff determined by X-tile. (C–E) ROC validation of the prognostic value of the predictive signature for predicting 1-, 3-, and 5-year survival of GBM patients, respectively. (F) Forest plot summary of the univariable analysis of IDH status, MGMT status, gender, age, and risk score. (G) Forest plot summary of the multivariable analysis of risk score, IDH status, MGMT status, and age. Here, the wildtype and mutant status of IDH and the unmethylated and methylated status of MGMT promoter were both converted to 1 and 0 respectively.
Since the immune signatures have been proven to give diagnostic and prognostic values, a differential analysis was performed on them among the three subtypes. Moreover, the clinicopathological characteristics and molecular functions of three subtypes were also proposed. Figure 3A displays the heatmap of clinical and immune-related features across three subgroups. It is clear that the proportion of MES patients with IDH mutations is much lower than that of IDH-mutant PN patients. Exactly, there are seven of 131 CL patients, nine of 140 MES patients, and 25 of 126 PN patients with IDH mutations. The previous study has shown that IDH-mutant GBM patients are enriched in the PN subgroup, and those with IDH mutations show a better prognosis than IDH-wildtype cases (53). Moreover, 30 of 131 CL patients, 29 of 140 MES patients, and 29 of 126 PN patients have methylated MGMT promoter, so the percentage of PN patients with methylated MGMT promoter is higher than those of CL and MES; to be more exact, MGMT promoter methylation status has been indicated to be associated with better survival in GBM (54). As shown in Figure 3B, the Kaplan–Meier curve analysis reveals that PN patients have a favorable prognosis of OS, which was consistent with previous studies. So, based on the clinical difference between the three subtypes, we can conclude that PN samples exhibit better prognosis than the other two subtypes.
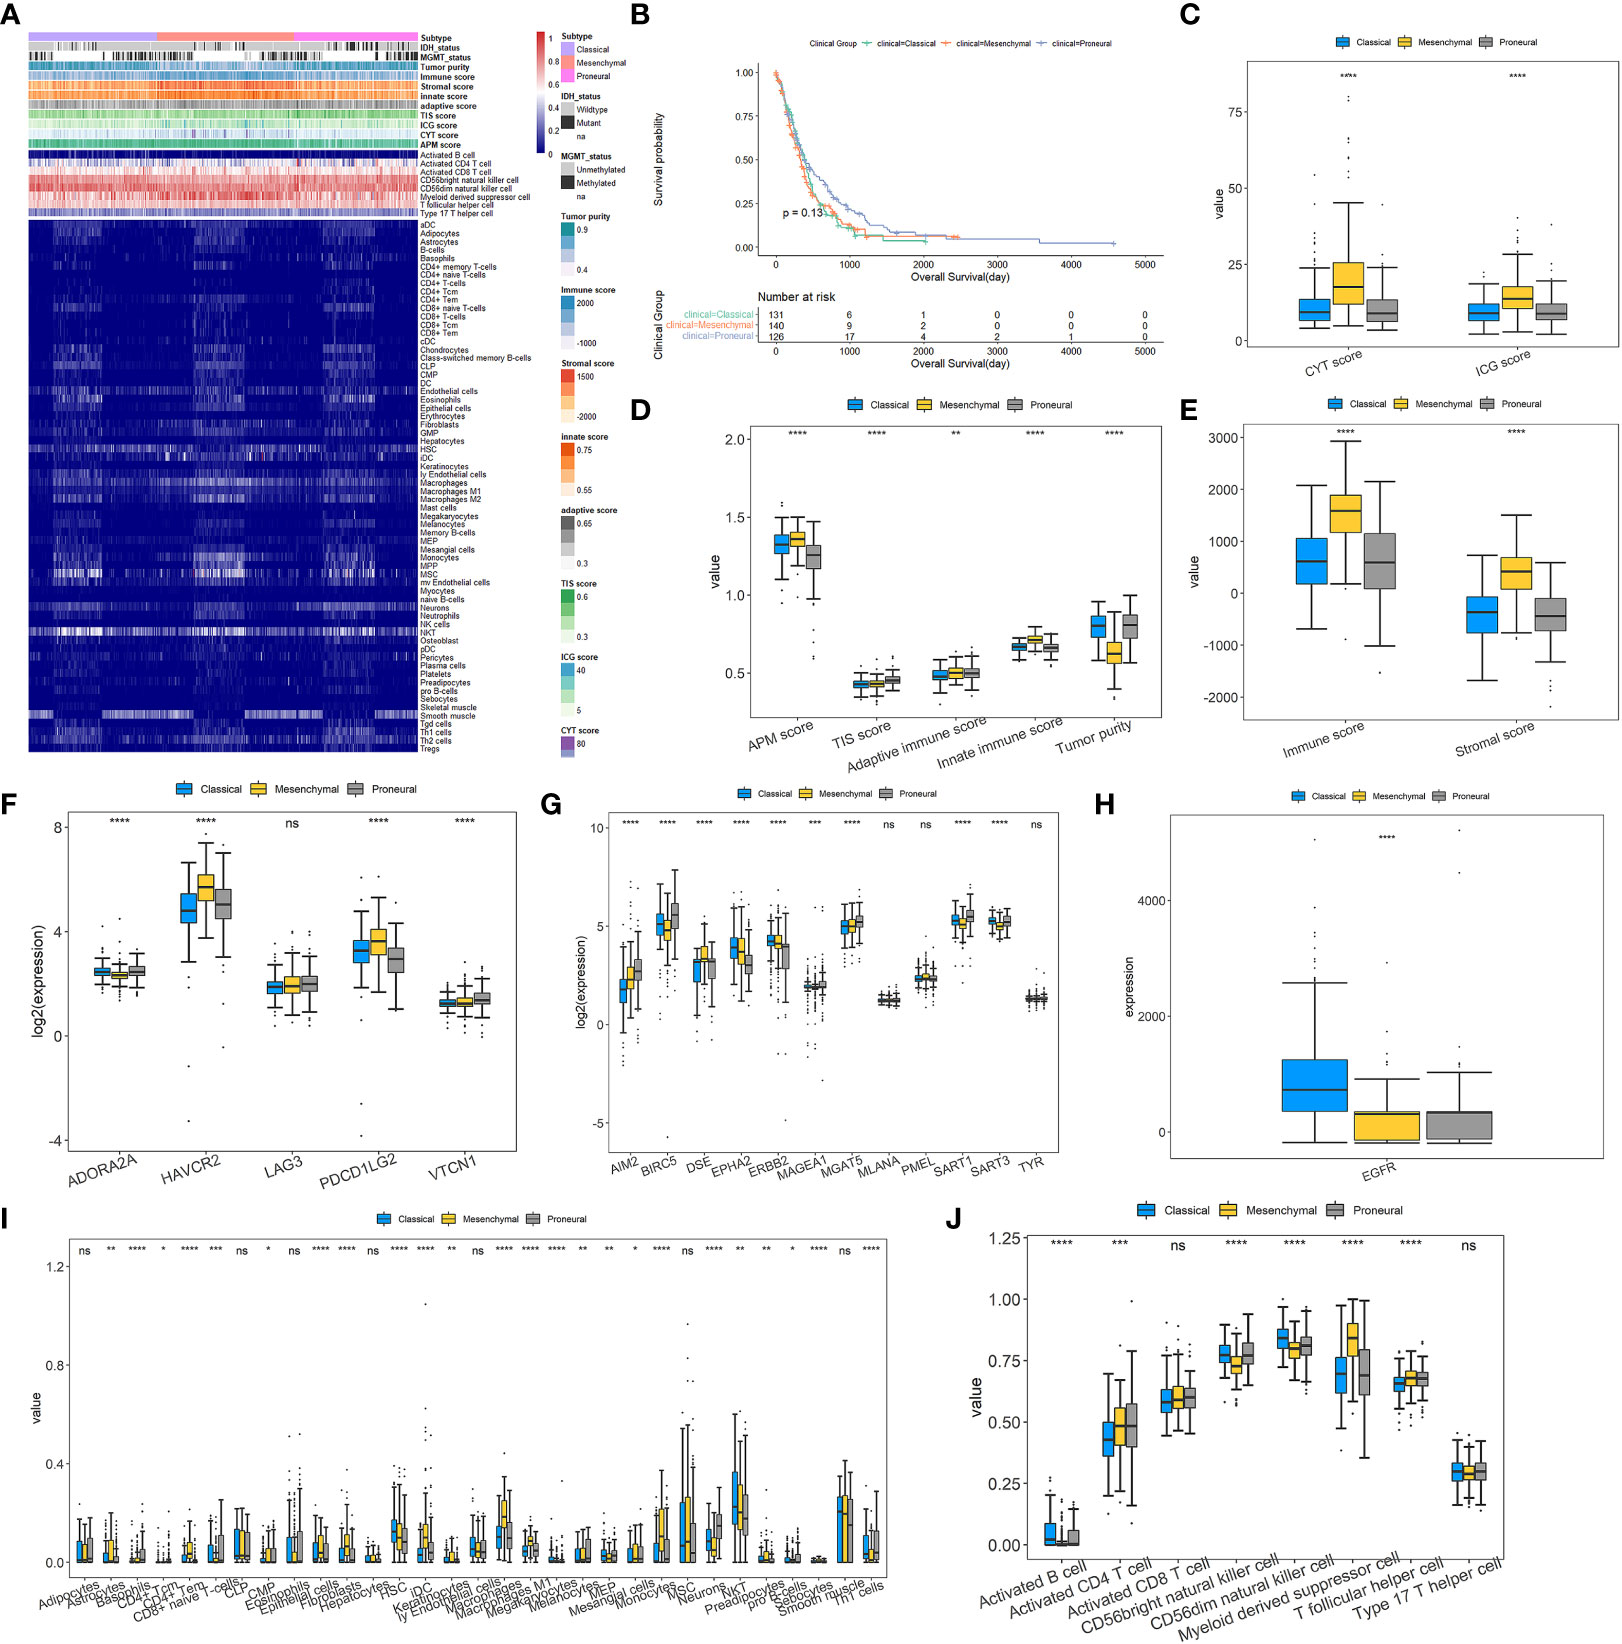
Figure 3 Landscapes of tumor immune microenvironment and clinicopathological characteristics of three GBM subtypes. (A) Heatmap depicting the association between GBM subtypes and immune cell infiltration. (B) The Kaplan–Meier curve for the OS of 397 GBM patients in three GBM subgroups. (C–E) Box plots for exploring the differences of CYT, ICG, APM, TIS, adaptive immune, innate immune, immune and stromal scores, and tumor purity among GBM subtypes. (F) Differences in the expressions of T-cell exhaustion markers between the three GBM subtypes. (G, H) Differences in the expressions of glioma antigens across the three GBM subtypes. (I, J) Different proportions of various immune and stromal cells in the GBM subgroups. For all box plots, the Kruskal–Wallis test was used to determine the significance of differences among GBM subtypes, and p-values are shown on the top of each box plot. *p< 0.05; **p< 0.01; ***p< 0.001; ****p< 0.0001; ns, no significant difference.
For the nine major immune-associated scores shown in Figures 3C–E, compared to CL and PN, MES has been revealed to have higher CYT, ICG, APM, adaptive immune, innate immune, immune, and stromal scores. As seen in Figure 3F, except for LAG3, the other four T-cell exhaustion markers are all differentially expressed among three types with p-values of<0.0001, although FC values did not exceed 2. Among them, HAVCR2 and PDCD1LG2 are significantly upregulated, while ADORA2A is downregulated in the MES subtype. The differences in antigens are displayed in Figures 3G, H which indicate that there is only one antigen, DSE, that is overexpressed within the MES subset. Inversely, several antigens are significantly overexpressed in CL and PN subsets, containing AIM2, BIRC5, MAGEA1, MGAT5, and SART1 in the PN subset and EPHA2, ERBB2, and EGFR in the CL subset.
Given the vital role of TIME, the associations between GBM subtypes and immune infiltration were explored. Figures 3I, J illustrate that most immune cells and stromal cells used for constructing the final classification model have remarkable differences in proportions across three GBM subtypes. Compared with CL and PN, MES has a significant higher percentage of myeloid-derived suppressor cells (MDSC), T follicular helper cells, astrocytes, fibroblasts, and macrophages but a much lower proportion of CD56bright natural killer cells and CD56dim natural killer cells. It is consistent with the research by Maria et al. (6) that GBM gives high levels of intratumor heterogeneity in immune infiltration and MES has the highest proportion of macrophage and lymphocyte infiltration. Furthermore, it has been reported that MDSCs can inhibit the immune response by inhibiting the antitumor activity of cytotoxic T cells, NK cells, macrophages, and dendritic cells while inducing Tregs and Bregs, and increased circulating MDSCs are relevant with poor prognosis and survival in GBM patients (55, 56). The accumulation of MDSCs may induce immunosuppressive mechanisms and lead to GBM progression (57). Astrocytes, the main component of the GBM microenvironment, actively participate in the development of this disease through modulation of, for example, migration, invasion, angiogenesis, and therapeutic resistance (58, 59). As the major components of the cancer stroma in solid organ tumors, fibroblasts are called cancer-associated fibroblasts (CAFs), and a variety of biologically active substances, including proteins of the extracellular matrix and growth factors produced by them, may promote glioma cell growth (60). Moreover, CAFs may have a significant role in the invasiveness of GBM and may cause resistance to traditional therapy (9). The findings of Di Ianni et al. reveal that macrophages play a vital role in GBM relapse in a significantly immunosuppressive context (61). The previous study has shown that tumor-associated macrophages comprise 36.39% of the tumor tissue cells and have a subtype-specific role in GBM (62). According to the above findings, we can speculate that MES may be more immunosuppressive than CL and PN subtypes.
Lastly, the dysregulated biological functions and signaling pathways were investigated by GSVA analysis. Overall, there is no obvious difference between CL and PN, but MES gives a significant difference from CL and PN, respectively, as shown in Figures 4A, B. For KEGG pathways, the immune-associated pathways are highly enriched in MES, such as complement and coagulation cascades, the NOD-like receptor signaling pathway, leukocyte transendothelial migration, and Toll-like receptor signaling pathway. Moreover, interleukin 10 signaling, signaling by interleukin, interleukin 4, and interleukin 13 signaling are also enriched in MES, suggesting a significant association with immune and inflammation responses in MES patients. Except for immune-related Reactome terms, MES is also involved in cancer-associated Reactome terms, such as regulated necrosis, integrin cell surface interactions, regulation by c-FLIP, and extracellular matrix organization, which indicates that patients within MES may be inclined to apoptosis and migration. In addition, immune-related biological processes, such as T helper 2 cell differentiation, regulation of T helper 1 cell differentiation, regulation of T helper 1 type immune response, and regulation of macrophage activation, and cancer-associated biological processes of I-kappaB kinase/NF-kappaB signaling, as well as cell–cell adhesion mediated by integrin, are also enriched in the MES subset. For molecular function, MES is correlated with those that are associated with cancer cell migration and immune response, such as fibronectin binding, cytokine binding, integrin binding, and cytokine receptor binding. Based on the above results, the MES subtype is probably more proinflammatory and invasive than others.
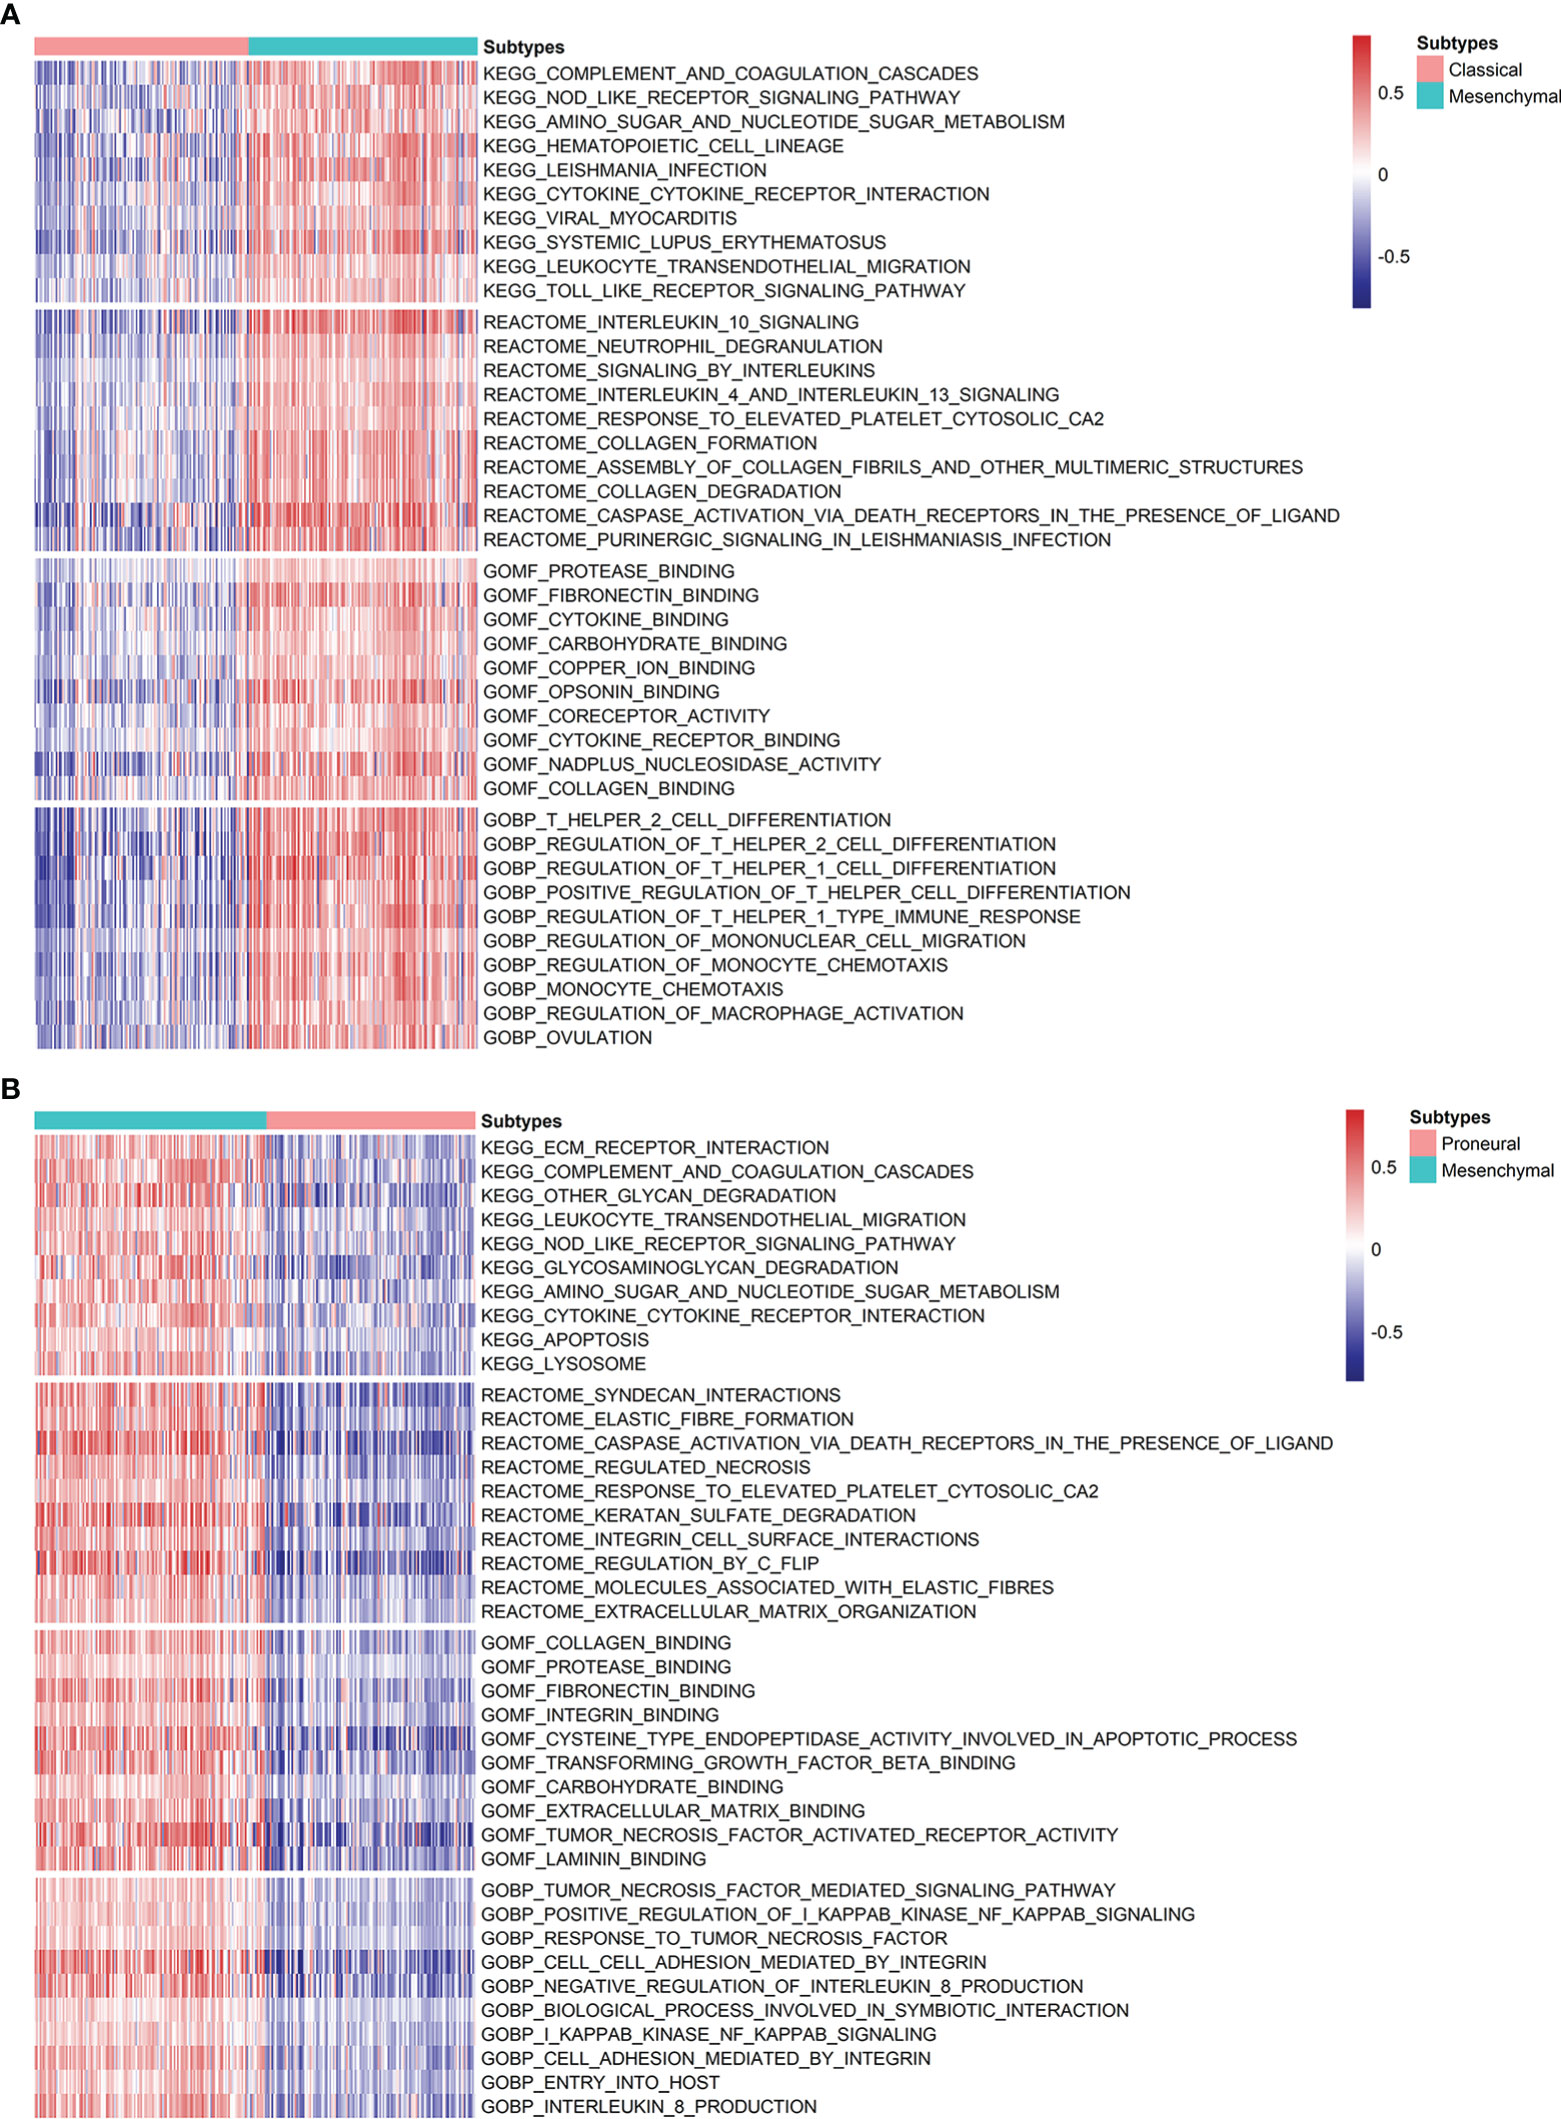
Figure 4 Analysis of the differences in the enrichment scores of KEGG pathways, Reactome categories, and GO terms demonstrated by GSVA among GBM subtypes. (A) Heatmap describing the top 10 significantly differential signatures, including KEGG pathways, Reactome, and GO terms between MES and CL. (B) Variants in KEGG pathways, Reactome categories, and GO terms between MES and PN.
Exhausted CD8+T cells are uniquely marked by distinct PD-1 upregulation. A GET signature was constructed, including 21 genes showing significantly positive correlations with PD-1 levels. They are CD27, SIRPG, CXCR6, ICOS, RUNX2, TNFRSF9, CD70, CD200R1, CD80, TNS3, KIR2DL4, ZBED2, TNIP3, SEMA4A, BATF, TIGIT, VDR, CTLA4, LAG3, KLRB1, and TNFRSF18, respectively. Among them, some are closely correlated to T-cell dysfunction and coregulation, such as CD27, ICOS, RUNX2, CTLA4, etc. Thus, the GET score of each patient was established using the ssGSEA method. We compared the GET score distributions of samples in three subtypes to quantitatively illustrate the status of exhausted CD8+T cells in each subtype. Figure 5A shows that there are significant differences in average GET scores across CL, MES, and PN. In particular, GET scores of patients within the MES subtype are remarkably higher than others, suggesting that patients with the MES subtype may have a positive effect on the immunotherapy response. Thus, relationships between the GET scores of MES samples and APM score, CYT score, innate immune score, stromal score, TIS score, and tumor purity were further estimated (Figures 5B–G). We can see that the GET score yields positive correlations with the APM score, CYT score, innate immune score, and stromal score, but negative correlations with the TIS score and tumor purity. It has been pointed out that the APM score is associated with inflammatory activities, whereas cytolytic activity represented by the CYT score is relevant to T-cell exhaustion to make the inflamed TME (18, 49). Therefore, we could draw the conclusion that there are probable coordinate interactions among T-cell exhaustion, antigen presentation, and cytolytic activity that could shape the high inflammation in the TME of MES.
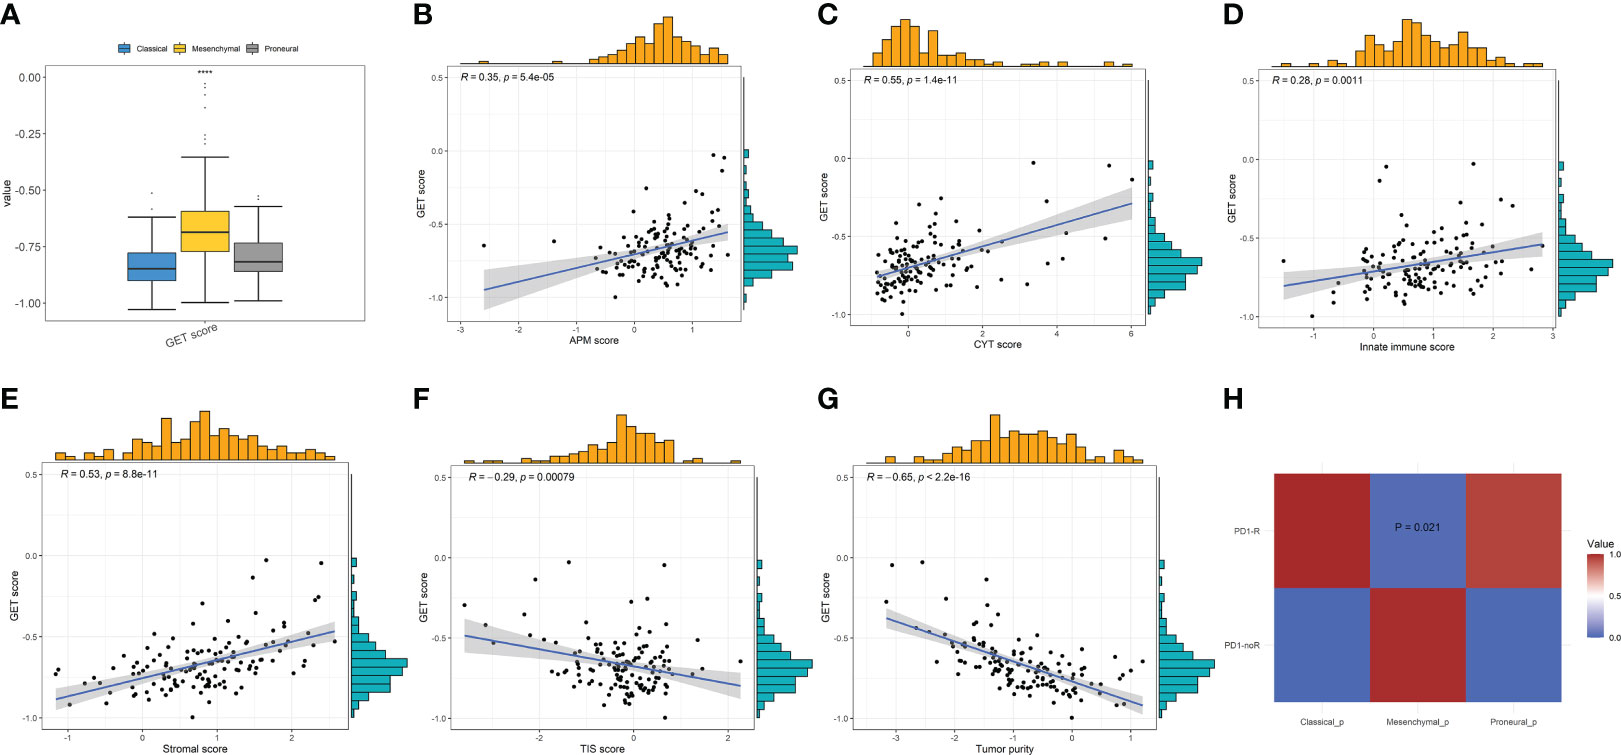
Figure 5 (A) Comparisons of GET scores among the three GBM subtypes. (B–G) The correlations between GET score and the APM, CYT, innate immune, stromal, TIS scores, and tumor purity, respectively, in MES patients by Pearson’s correlation analysis. (H) Immunotherapy response prediction by SubMap analysis indicates a significant difference in anti-PD1 therapy response across the GBM subtypes.
The anti-PD-1 immunotherapy response prediction was then conducted. Based on the SubMap analysis, MES patients share a higher similarity with the expression profile of patients that are responsive to PD-1 inhibitor treatment (p = 0.021) in Figure 5H, so patients belonging to the MES subtype may have significantly better anti-PD-1 responses than others of CL and PN. In fact, previous studies have indicated that patients with high CYT/ICG/APM scores may respond particularly well to immunotherapy, such as immune checkpoint blockade (18, 63). These findings further demonstrate that MES patients with higher CYT/ICG/APM scores may have a better potential response to anti-PD-1/L1 immunotherapy.
Genes with expressions influencing clinical response to drug treatments may be potential biomarkers for drug screening expressions. Since patients within the MES subtype show high immune heterogeneity compared to CL and PN, the potential drugs for MES were finally explored. Firstly, we screened the upregulated genes of MES and calculated the correlations between upregulated gene expressions and drug sensitivity-associated expression profiles from the GSCA database. The results in Figure 6A indicate that the overexpression of most genes is negatively correlated with the IC50 values of most drugs in GDSC. Among them, 17-AAG, docetaxel, and erlotinib are the top three most negatively related drugs, and all of them are already used in clinical treatments. It has been confirmed that 17-AAG is able to inhibit the growth of both human glioma cell lines and glioma stem cells in vitro and could cross the BBB because of its highly lipophilic nature, suggesting that GBM patients may benefit from 17-AAG either as a single agent or in combination with other drugs (64–66). As a semisynthetic taxane, docetaxel is a class of anticancer agents that bind to and stabilize mocrotubules, thereby causing cell-cycle arrest and apoptosis (67). For GBM, although docetaxel could inhibit brain tumor growth following local injection in a mouse brain tumor model, it is unable to accumulate in the brain at adequate concentrations required for tumor regression due to the blood–brain barrier (BBB) and consequently has not been applied to treat brain tumor (68). However, the work by Gajbhiye et al. has revealed that docetaxel-loaded polysorbate 80-anchored dendritic nanoconjugate has the potential to cross BBB significantly and can deliver a higher amount of drug to the brain for a higher therapeutic outcome (69). Erlotinib is an inhibitor of EGFR and has been approved to treat non-small cell lung and pancreatic cancers and was shown to exert multifarious antineoplastic effects in glioblastoma in preclinical studies (70, 71). Erlotinib could be co-delivered with curcumin via nanomicelles and show anti-GBM activity in the U87 cell line (72).
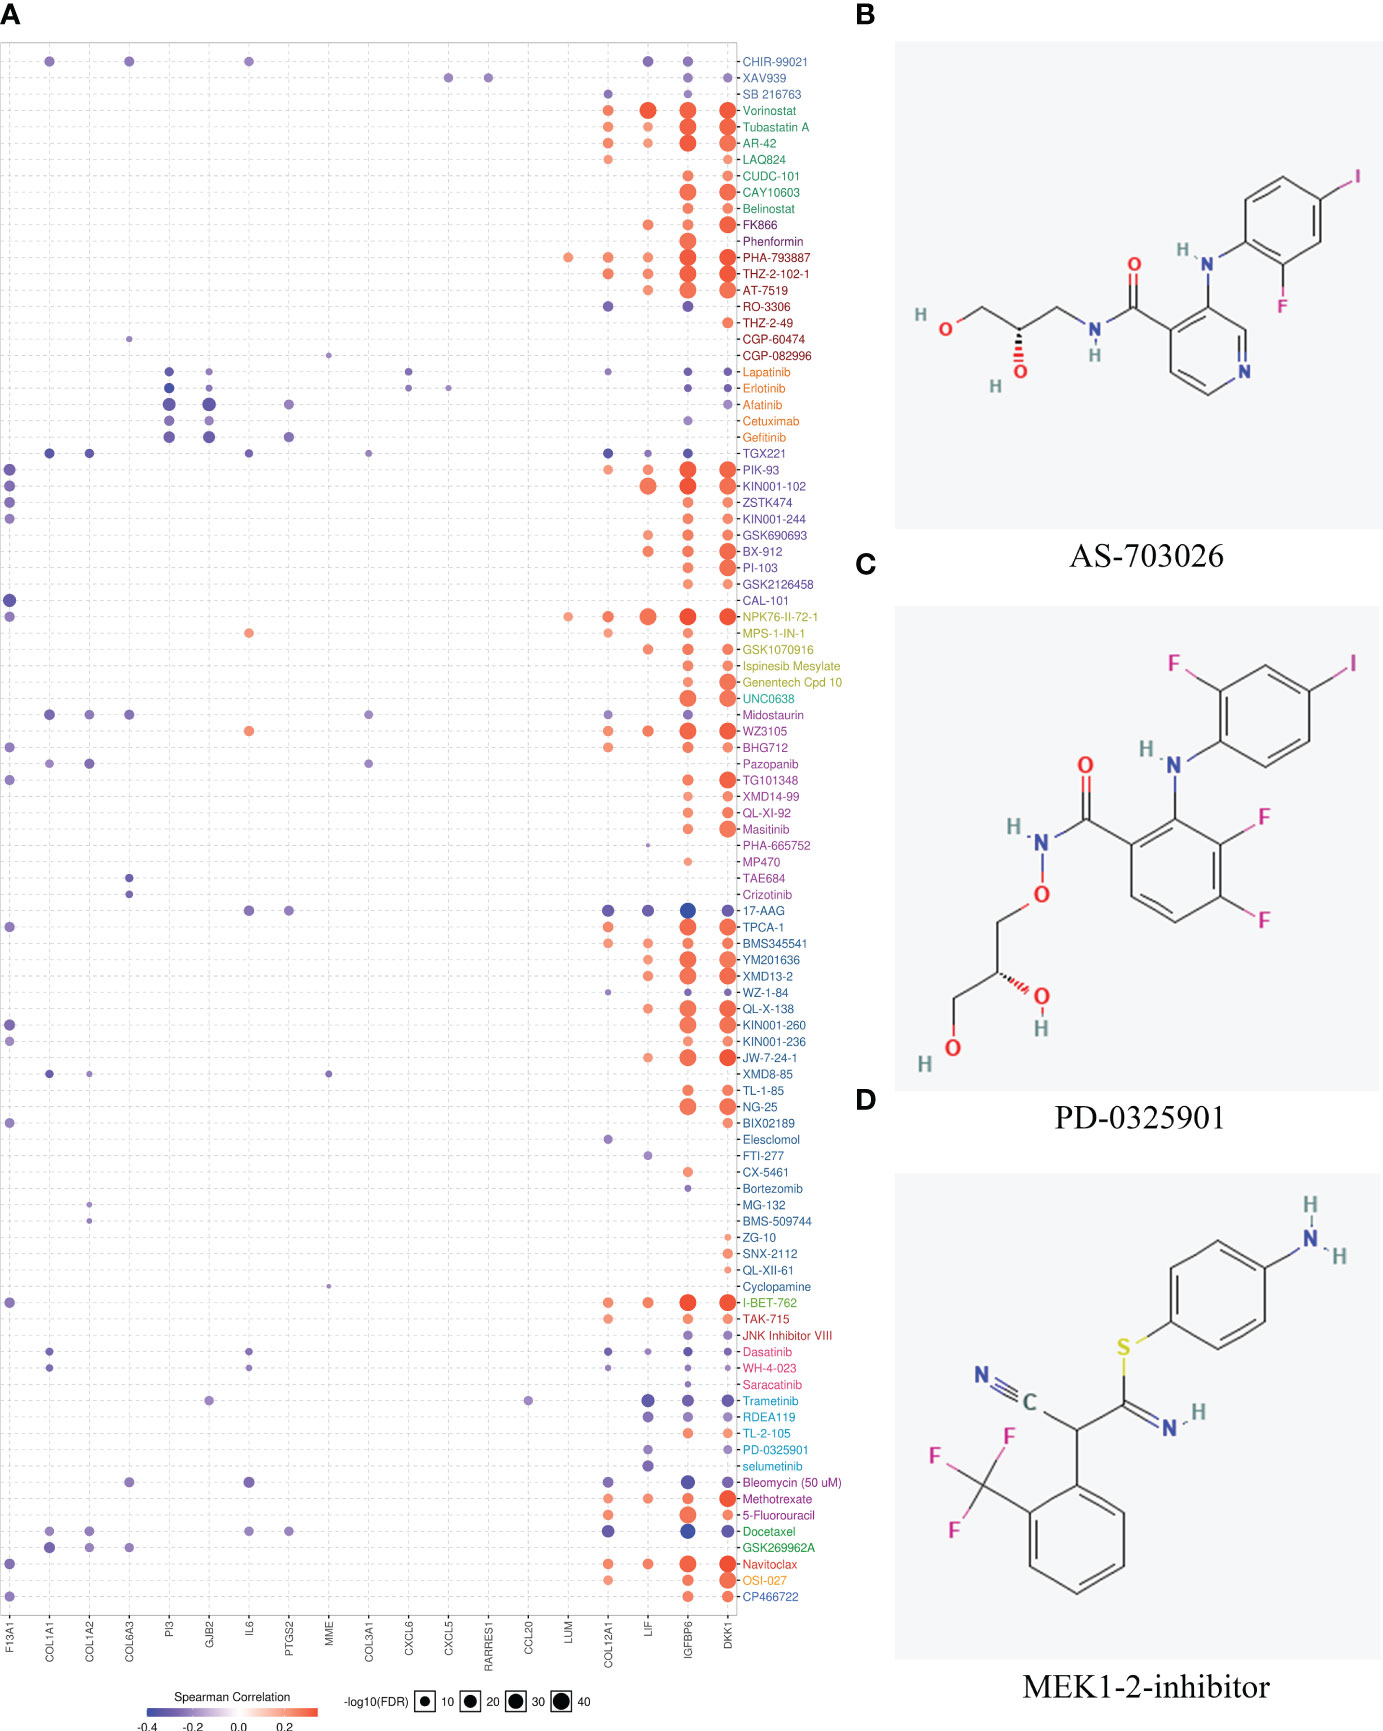
Figure 6 Drug sensitivity evaluation based on hub genes and potential drug prediction for patients within the MES subtype. (A) The bubble plot showed the correlation between the mRNA expression of genes that were upregulated in the mesenchymal subtype and GDSC drug sensitives. (B–D) Structures of the three most significant bioactive chemicals sharing common MOA of MEK inhibitor by CMap analysis.
Moreover, the CMap database was used to predict potential drugs for patients belonging to the MES subtype. CMap mode of action (MoA) analysis disclosed a total of 43 mechanisms of action in the top 50 compounds. It is noted that three compounds including AS-703026, PD-0325901, and MEK1-2-inhibitor share MEK inhibitors and target two common genes of MAP2K1 and MAP2K2. The chemical structures of the three compounds are shown in Figures 6B–D, and the detailed information about them derived by CMap analysis is listed in Table 3. AS703206 is a novel, selective, and orally bioactive MEK1/2 inhibitor that has potent cytotoxicity on tumor cells for the majority of patients with relapsed and refractory multiple myeloma (73). Moreover, AS703026 could also effectively inhibit the growth of colorectal tumor cell lines in vitro and in vivo (74). As an ATP noncompetitive selective inhibitor of MEK1/2, PD-0325901 displays significant antitumor effects in melanoma, head and neck, and BRAF-mutated papillary thyroid cancer (75, 76). It has been reported that PD-0325901 could block the dispersal of GBM by inhibiting the MAPK/EPK pathway, so it is a promising candidate drug as a treatment for intracranial malignancies (77, 78).
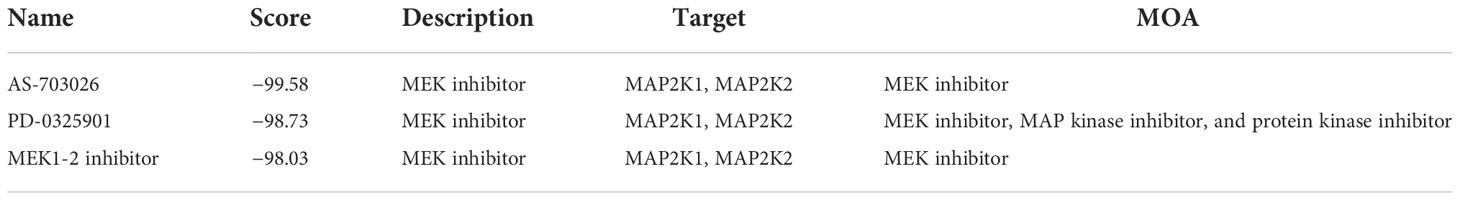
Table 3 Three bioactive compounds with one common action mode by CMap analysis.
GBM is a common intracranial tumor with a high degree of malignancy, fast growth, a high frequency of recurrence, and few long-term survivors (79). At present, the standard of care (SOC) management of GBM is based on the maximum safe surgical removal, radiotherapy, and chemotherapy with temozolomide. However, patients with GBM still have a poor prognosis, and SOC will lead to irreversible toxicity, such as neurological deficits due to surgery, neurocognitive impairments with radiotherapy, and systemic toxicity (80, 81). It has been confirmed that immunotherapy is highly effective in inhibiting cancer regression and improving patient quality of life (16). However, GBMs exhibit a high degree of inter- and intratumor heterogeneity. Different GBM subtypes exhibit different characteristics of immune landscapes. Hence, a complete understanding of the immune landscape of patients within different GBM subgroups may be beneficial for personalized therapeutic strategies. However, no comprehensive analysis of the immune landscapes of GBM subtypes by integrating various immune characteristics has been reported.
In the present study, we tried to collect a variety of immune signatures to describe the immune landscape of GBM. The comprehensive immune landscape, including 109 immune characteristics, was established for 397 GBM samples compiled from different datasets. Among the 109 immune signatures, 64 immune and stromal cell infiltrations can systematically represent the TME of GBM. The various immune-related scores were calculated. For example, the CYT score assesses the cytotoxic T-cell infiltration, the TIS score quantifies T-cell infiltration levels, the APM score estimates the immunogenicity of tumor cells, the ICG score figures immune checkpoint genes expression, the innate and adaptive immune scores evaluate the levels of innate and adaptive immune activity, and the immune and stromal score represents the overall level of immune and stromal cells. Moreover, T-cell exhaustion markers (11 genes) and 17 genes of glioma antigens were also achieved for the integrative immunogenomic analysis.
The accurate recognition of GBM subtypes is essential for the precise diagnosis and correct treatments of GBM. Here, ML methods were proposed to construct an optimal immune feature-based classification model for simultaneously distinguishing three GBM subtypes of CL, MES, and PN, respectively. Usually, when there are too many features in an ML model, there may be some that are redundant or irrelevant, which probably reduces the classification performance of the ML model. Feature selection could obtain a high-quality feature subset by removing irrelevant and redundant data (82). A high-quality feature subset could improve learning accuracy, reduce computational overload, and simplify learning results (83); hence, feature selection is the key step in model construction. The diagnostic values of these collected immune signatures were investigated using SVM-RFE, and 61 optimal immune signatures were selected. Seven different ML methods were compared, and the RBF-based SVM model gives the best performance, with an overall prediction accuracy of 85.38% in the final model by 10-fold cross-validation. For the MES subtype, the recognition precision is as high as 0.9071, indicating the high diagnostic value of these immune signatures. In addition, there have been existing ML models for GBM subtype classification based on different data; for example, Munquad et al. (84) utilized transcriptome and methylome data to construct classifiers through several ML algorithms, and the best model presents an accuracy of 87.5% on the testing data and 94.48% on external data. Macyszyn et al. (85) employed magnetic resonance imaging and the ML method to identify molecular subtypes in GBM with a prediction accuracy of 76%. Zhang et al. (86) constructed an SVM classifier for dividing GBM into seven subtypes based on DNA methylation status with an overall accuracy of 85.2% on the independent test dataset. It can be observed that our classifier based on immune signatures yields comparable performance with the existing ML models based on other feature information. However, so far, no other research has been reported combining immune features and ML algorithms for GBM subtypes classification. The model constructed by us could be a promising supplementary tool for the accurate recognition of GBM subtypes.
The clinical relevance of the 61 immune features in GBM was assessed by survival analysis, and 26 of them were found to be correlated with the OS of GBM patients. Therefore, a prognostic signature was constructed for predicting GBM’s OS. The Kaplan–Meier analysis suggests significant differences in survival times among high-, medium-, and low-risk patients. Furthermore, the ROC analysis proved that the prognostic signature could precisely predict long-term survival than short-term survival of GBM patients, with an AUC of 0.903 for a 5-year OS of GBM. In addition, the risk score could be an independent, applicable prognostic indicator of GBM after adjusting for clinical factors including gender, age, IDH, and MGMT status. The 26 immune signatures may be potential prognostic indicators for GBM patients’ OS.
TME of cancers has been known as a crucial aspect for understanding antitumor response and sensitivity to immunotherapy (15). Through analyzing the difference in immune and stromal cell infiltration across three GBM subgroups, it has been found that patients within MES have much higher percentages of MDSC, T follicular helper cell, astrocytes, fibroblasts, and macrophages, which could inhibit immune response and promote invasion, migration, and cancer development. Moreover, the comparisons of enriched pathways among GBM subgroups show that a number of oncogenic and immune-associated pathways are significantly upregulated in MES, such as I-kappaB kinase/NF-kappaB signaling, regulation by c-FLIP, extracellular matrix organization, NOD-like receptor signaling pathway, Toll-like receptor signaling pathway, and leukocyte transendothelial migration. The activation of the I-kappaB kinase/NF-kappaB signaling pathway could not only lead to the induction of target genes associated with apoptosis, cell cycle regulation, cell invasion, and metastatic growth but also regulate cancer-related inflammation, hyperplasia, and neoplasia (87, 88). As a master regulator of death receptor networks, c-FLIP plays a key role in apoptosis, necroptosis, NF-κB activation, and tumorigenesis, and high c-FLIP levels are correlated with a more progressive tumor and critical for inflammation (89, 90). It has been indicated that NOD-like and Toll-like receptors are essential players in the innate immune response to invading pathogens and are linked with human diseases, including infections, cancer, and autoimmune and inflammatory diseases (91). In cancer, NOD-like receptors are initiators of the inflammasome pathway and directly facilitate tumor cell growth and metastasis, then help prevent any antitumor immune response (92). Toll-like receptors can activate NF-κB and promote tumorigenesis and proliferation (93). To sum up, these findings indicate that there is a more immunosuppressive and inflammatory TME in the MES subtype than in CL and PN. Fan et al. (94) have proven that patients with a high risk of glioma are observed to retain a more activated inflammatory state but more suppressive TME, which is consistent with our conclusion that patients within the MES have a poorer prognosis than those within the CL and PN.
As for the differences in immune-associated scores among GBM subgroups, MES is revealed to have higher APM, CYT, and ICG scores but a lower tumor purity. Chen et al. (25) show that the APM signature score could predict an immunosuppressive and onco-inflammatory microenvironment supporting tumor growth and progression. In contrast to other cancers like hepatocellular carcinoma, a high CYT score is associated with higher expressions of immunosuppressive PD1/PDL1 axis in GBM and also relates to worse OS. However, it has been indicated that patients with a high CYT/ICG score may respond particularly well to immunotherapies because GBM patients have a complex microenvironment with increased ICG expression and protumoral immune cell infiltration (63). Additionally, tumor purity is observed to significantly correlate with the reduced survival time in GBM (95). Thus, MES patients might have a poor prognosis and be more sensitive to checkpoint-related immunotherapy.
Meanwhile, we established a GET score to investigate the dysfunctional immune state among GBM subtypes. MES yields a higher GET score and gives more significant correlations between the GET score and the APM score, CYT score, innate immune score, stromal score, TIS score, and tumor purity, respectively, which proves that T-cell exhaustion, antigen presentation, and cytolytic activity may corporately shape the complex and inflamed TME in MES. Since the GET score is correlated with better clinical benefit for ICI agents (50), MES may have a positive effect on the immunotherapy response, which is further confirmed by SubMap analysis, which shows that MES patients are more likely to benefit from anti-PD1 treatment.
Considering the high immune heterogeneity of MES, disclosing the potential drugs may improve the medical therapy and prognosis of MES patients. We finally examined the drug sensitivity of several anticancer drugs based on upregulated genes in the MES subgroup. The GSCA analysis demonstrates that drugs such as 17-AAG, docetaxel, and erlotinib exert antitumor activity with corresponding genes. These drugs have been approved to treat various cancers after extensive research. As an analog of geldanamycin, 17-AAG has been widely investigated in the preclinical and clinical research as a single agent or in combination/noncombination with other anticancer agents for various cancers, such as breast cancer, ovarian cancer, prostate cancer, glioblastoma, etc. (96). Docetaxel has shown profound benefits in the treatment of diverse cancers (breast, head, neck, lung, and prostate cancer), and erlotinib have been approved to treat non-small cell lung and pancreatic cancers (70). Moreover, used CMap was used to disclose potential drugs for MES patients. Three compounds (AS-703026, PD-0325901, and MEK1-2-inhibitor) were identified that share MEK inhibitors and target two common genes (MAP2K1, MAP2K2). However, the practical applicability of those drugs would be experimentally confirmed in future studies.
In summary, this study comprehensively analyzed the immune landscape in GBM and found that the MES subtype could be considered an immunosuppressive, proinflammatory, and invasive subtype. However, MES has better responses to anti-PD-1/L1 immunotherapy. This research could provide a theoretical basis for identifying GBM subtypes by the immune signatures, followed by the development of more effective, targeted clinical treatment strategies, and finally, achieving precision medicine.
The original contributions presented in the study are included in the article/Supplementary Material. Further inquiries can be directed to the corresponding author.
HL proposed the methodology, collected and processed all data, conducted the statistical analysis, and wrote the original draft. JH performed a formal analysis. ML, KL, and XP completed validation, writing reviews, and editing. YG conceived and designed the project, supervised the project, and wrote and edited the manuscript. All authors discussed the results and contributed to the final manuscript.
This research was financially supported by the Foundation from the Science and Technology Department of Sichuan Province (2020JDJQ0017, 2022YFG0185) and the Sichuan International Science and Technology Innovation Cooperation Project (2021YFH0140).
The authors declare that the research was conducted in the absence of any commercial or financial relationships that could be construed as a potential conflict of interest.
The handling editor LZ declared a shared parent affiliation with the authors HL, JH, ML, KL, XP, YG at the time of the review
All claims expressed in this article are solely those of the authors and do not necessarily represent those of their affiliated organizations, or those of the publisher, the editors and the reviewers. Any product that may be evaluated in this article, or claim that may be made by its manufacturer, is not guaranteed or endorsed by the publisher.
The Supplementary Material for this article can be found online at: https://www.frontiersin.org/articles/10.3389/fimmu.2022.1027631/full#supplementary-material
1. Lin H, Wang K, Xiong Y, Zhou L, Yang Y, Chen S, et al. Identification of tumor antigens and immune subtypes of glioblastoma for mrna vaccine development. Front Immunol (2022) 13:773264. doi: 10.3389/fimmu.2022.773264
2. Chen Z, Hambardzumyan D. Immune microenvironment in glioblastoma subtypes. Front Immunol (2018) 9:1004. doi: 10.3389/fimmu.2018.01004
3. Verhaak RGW, Hoadley KA, Purdom E, Wang V, Qi Y, Wilkerson MD, et al. Integrated genomic analysis identifies clinically relevant subtypes of glioblastoma characterized by abnormalities in pdgfra, Idh1, egfr, and Nf1. Cancer Cell (2010) 17(1):98–110. doi: 10.1016/j.ccr.2009.12.020
4. Parker NR, Khong P, Parkinson JF, Howell VM, Wheeler HR. Molecular heterogeneity in glioblastoma: Potential clinical implications. Front Oncol (2015) 5:55. doi: 10.3389/fonc.2015.00055
5. Soomro SH, Ting LR, Qing YY, Ren M. Molecular biology of glioblastoma: Classification and mutational locations. J Pak Med Assoc (2017) 67(9):1410–4.
6. Martinez-Lage M, Lynch TM, Bi Y, Cocito C, Way GP, Pal S, et al. Immune landscapes associated with different glioblastoma molecular subtypes. Acta Neuropathol Commun (2019) 7(1):203. doi: 10.1186/s40478-019-0803-6
7. Daubon T, Hemadou A, Romero Garmendia I, Saleh M. Glioblastoma immune landscape and the potential of new immunotherapies. Front Immunol (2020) 11:585616. doi: 10.3389/fimmu.2020.585616
8. Takahashi H, Kawaguchi T, Yan L, Peng X, Qi Q, Morris LGT, et al. Immune cytolytic activity for comprehensive understanding of immune landscape in hepatocellular carcinoma. Cancers (Basel) (2020) 12(5):1221. doi: 10.3390/cancers12051221
9. Butler M, Prasad S, Srivastava SK. Targeting glioblastoma tumor microenvironment. In: Birbrair A, editor. Tumor microenvironments in organs: From the brain to the skin – part b. Cham: Springer International Publishing (2020). p. 1–9.
10. Zhao R, Pan Z, Li B, Zhao S, Zhang S, Qi Y, et al. Comprehensive analysis of the tumor immune microenvironment landscape in glioblastoma reveals tumor heterogeneity and implications for prognosis and immunotherapy. Front Immunol (2022) 13:820673. doi: 10.3389/fimmu.2022.820673
11. Lim M, Xia Y, Bettegowda C, Weller M. Current state of immunotherapy for glioblastoma. Nat Rev Clin Oncol (2018) 15(7):422–42. doi: 10.1038/s41571-018-0003-5
12. Ghouzlani A, Kandoussi S, Tall M, Reddy KP, Rafii S, Badou A. Immune checkpoint inhibitors in human glioma microenvironment. Front Immunol (2021) 12:679425. doi: 10.3389/fimmu.2021.679425
13. Franson A, McClellan BL, Varela ML, Comba A, Syed MF, Banerjee K, et al. Development of immunotherapy for high-grade gliomas: Overcoming the immunosuppressive tumor microenvironment. Front Med (2022) 9:966458. doi: 10.3389/fmed.2022.966458
14. Wu C, Qin C, Long W, Wang X, Xiao K, Liu Q. Tumor antigens and immune subtypes of glioblastoma: The fundamentals of mrna vaccine and individualized immunotherapy development. J Big Data (2022) 9(1):92. doi: 10.1186/s40537-022-00643-x
15. Liu D, Wan Y, Qu N, Fu Q, Liang C, Zeng L, et al. Lncrna-Fam66c was identified as a key regulator for modulating tumor microenvironment and hypoxia-related pathways in glioblastoma. Front Public Health (2022) 10:898270. doi: 10.3389/fpubh.2022.898270
16. Feng P, Li Z, Li Y, Zhang Y, Miao X. Characterization of different subtypes of immune cell infiltration in glioblastoma to aid immunotherapy. Front Immunol (2022) 13:799509. doi: 10.3389/fimmu.2022.799509
17. Feng Q, Li L, Li M, Wang X. Immunological classification of gliomas based on immunogenomic profiling. J Neuroinflamm (2020) 17(1):360. doi: 10.1186/s12974-020-02030-w
18. Chen R, Zhang H, Wu W, Li S, Wang Z, Dai Z, et al. Antigen presentation machinery signature-derived calr mediates migration, polarization of macrophages in glioma and predicts immunotherapy response. Front Immunol (2022) 13:833792. doi: 10.3389/fimmu.2022.833792
19. Doucette T, Rao G, Rao A, Shen L, Aldape K, Wei J, et al. Immune heterogeneity of glioblastoma subtypes: Extrapolation from the cancer genome atlas. Cancer Immunol Res (2013) 1(2):112–22. doi: 10.1158/2326-6066.cir-13-0028
20. Huang S, Yang J, Fong S, Zhao Q. Artificial intelligence in cancer diagnosis and prognosis: Opportunities and challenges. Cancer Lett (2020) 471:61–71. doi: 10.1016/j.canlet.2019.12.007
21. Ma M, Liu R, Wen C, Xu W, Xu Z, Wang S, et al. Predicting the molecular subtype of breast cancer and identifying interpretable imaging features using machine learning algorithms. Eur Radiol (2022) 32(3):1652–62. doi: 10.1007/s00330-021-08271-4
22. Ghobadi MZ, Emamzadeh R, Afsaneh E. Exploration of mrnas and mirna classifiers for various atll cancer subtypes using machine learning. BMC Cancer (2022) 22(1):433. doi: 10.1186/s12885-022-09540-1
23. Pirmoradi S, Teshnehlab M, Zarghami N, Sharifi A. A self-organizing deep neuro-fuzzy system approach for classification of kidney cancer subtypes using mirna genomics data. Comput Methods Programs BioMed (2021) 206:106132. doi: 10.1016/j.cmpb.2021.106132
24. Munquad S, Si T, Mallik S. Subtyping and grading of lower-grade gliomas using integrated feature selection and support vector machine. Brief Funct Genomics (2021) 206:106132. doi: 10.1093/bfgp/elac025
25. Wang L-B, Karpova A, Gritsenko MA, Kyle JE, Cao S, Li Y, et al. Proteogenomic and metabolomic characterization of human glioblastoma. Cancer Cell (2021) 39(4):509–28.e20. doi: 10.1016/j.ccell.2021.01.006
26. Şenbabaoğlu Y, Gejman RS, Winer AG, Liu M, Van Allen EM, de Velasco G, et al. Tumor immune microenvironment characterization in clear cell renal cell carcinoma identifies prognostic and immunotherapeutically relevant messenger rna signatures. Genome Biol (2016) 17(1):231. doi: 10.1186/s13059-016-1092-z
27. Charoentong P, Finotello F, Angelova M, Mayer C, Efremova M, Rieder D, et al. Pan-cancer immunogenomic analyses reveal genotype-immunophenotype relationships and predictors of response to checkpoint blockade. Cell Rep (2017) 18(1):248–62. doi: 10.1016/j.celrep.2016.12.019
28. Aran D, Hu Z, Butte AJ. Xcell: Digitally portraying the tissue cellular heterogeneity landscape. Genome Biol (2017) 18(1):220. doi: 10.1186/s13059-017-1349-1
29. Guyon I, Weston J, Barnhill S, Vapnik V. Gene selection for cancer classification using support vector machines. Mach Learn (2002) 46(1):389–422. doi: 10.1023/A:1012487302797
30. Lin X, Li C, Zhang Y, Su B, Fan M, Wei H. Selecting feature subsets based on svm-rfe and the overlapping ratio with applications in bioinformatics. Molecules (2018) 23(1):52. doi: 10.3390/molecules23010052
31. Cortes C, Vapnik V. Support-vector networks. Mach Learn (1995) 20(3):273–97. doi: 10.1007/BF00994018
32. Ben-Hur A, Weston J. A user’s guide to support vector machines. In: Carugo O, Eisenhaber F, editors. Data mining techniques for the life sciences. Totowa, NJ: Humana Press (2010). p. 223–39.
33. Huang S, Cai N, Pacheco PP, Narrandes S, Wang Y, Xu W. Applications of support vector machine (Svm) learning in cancer genomics. Cancer Genomics - Proteomics (2018) 15(1):41. doi: 10.21873/cgp.20063
34. Alshutbi M, Li Z, Alrifaey M, Ahmadipour M, Othman MM. A hybrid classifier based on support vector machine and jaya algorithm for breast cancer classification. Neural Comput Appl (2022) 34(19):16669–81. doi: 10.1007/s00521-022-07290-6
35. Sujitha R, Seenivasagam V. Retracted article: Classification of lung cancer stages with machine learning over big data healthcare framework. J Ambient Intell Humaniz Comput (2021) 12(5):5639–49. doi: 10.1007/s12652-020-02071-2
36. Kristina BC, Hadi AF, Riski A, Kamsyakawuni A, Anggraeni D. The visualization and classification method of support vector machine in lymphoma cancer. J Phys Conf Ser (2020) 1613(1):12065. doi: 10.1088/1742-6596/1613/1/012065
37. Segal NH, Pavlidis P, Antonescu CR, Maki RG, Noble WS, DeSantis D, et al. Classification and subtype prediction of adult soft tissue sarcoma by functional genomics. Am J Pathol (2003) 163(2):691–700. doi: 10.1016/S0002-9440(10)63696-6
39. Huang Z, Chen D. A breast cancer diagnosis method based on vim feature selection and hierarchical clustering random forest algorithm. IEEE Access (2022) 10:3284–93. doi: 10.1109/ACCESS.2021.3139595
40. Scornet E. Random forests and kernel methods. IEEE T Inform Theory (2016) 62(3):1485–500. doi: 10.1109/TIT.2016.2514489
41. Boulesteix A-L, Janitza S, Kruppa J, König IR. Overview of random forest methodology and practical guidance with emphasis on computational biology and bioinformatics. WIRES Data Min Knowl (2012) 2(6):493–507. doi: 10.1002/widm.1072
42. Chen T, Guestrin C. (2016). Xgboost: A Scalable Tree Boosting System. Proceedings of the 22nd ACM SIGKDD International Conference on Knowledge Discovery and Data Mining (2016) 785–944. San Francisco, California.
43. Zhao Z, Yang W, Zhai Y, Liang Y, Zhao Y. Identify DNA-binding proteins through the extreme gradient boosting algorithm. Front Genet (2022) 12:821996. doi: 10.3389/fgene.2021.821996
44. Ma B, Meng F, Yan G, Yan H, Chai B, Song F. Diagnostic classification of cancers using extreme gradient boosting algorithm and multi-omics data. Comput Biol Med (2020) 121:103761. doi: 10.1016/j.compbiomed.2020.103761
45. Krogh A. What are artificial neural networks? Nat Biotechnol (2008) 26(2):195–7. doi: 10.1038/nbt1386
46. Chou S-M, Lee T-S, Shao YE, Chen IF. Mining the breast cancer pattern using artificial neural networks and multivariate adaptive regression splines. Expert Syst Appl (2004) 27(1):133–42. doi: 10.1016/j.eswa.2003.12.013
47. Ahmed FE. Artificial neural networks for diagnosis and survival prediction in colon cancer. Mol Cancer (2005) 4(1):29. doi: 10.1186/1476-4598-4-29
48. Zhao B, Wang Y, Wang Y, Dai C, Wang Y, Ma W. Investigation of genetic determinants of glioma immune phenotype by integrative immunogenomic scale analysis. Front Immunol (2021) 12:557994. doi: 10.3389/fimmu.2021.557994
49. Cai M-C, Zhao X, Cao M, Ma P, Chen M, Wu J, et al. T-Cell exhaustion interrelates with immune cytolytic activity to shape the inflamed tumor microenvironment. J Pathol (2020) 251(2):147–59. doi: 10.1002/path.5435
50. Hoshida Y, Brunet J-P, Tamayo P, Golub TR, Mesirov JP. Subclass mapping: Identifying common subtypes in independent disease data sets. PloS One (2007) 2(11):e1195. doi: 10.1371/journal.pone.0001195
51. Prat A, Navarro A, Paré L, Reguart N, Galván P, Pascual T, et al. Immune-related gene expression profiling after pd-1 blockade in non–small cell lung carcinoma, head and neck squamous cell carcinoma, and melanoma. Cancer Res (2017) 77(13):3540–50. doi: 10.1158/0008-5472.can-16-3556
52. Liu C-J, Hu F-F, Xia M-X, Han L, Zhang Q, Guo A-Y. Gscalite: A web server for gene set cancer analysis. Bioinformatics (2018) 34(21):3771–2. doi: 10.1093/bioinformatics/bty411
53. Korshunov A, Casalini B, Chavez L, Hielscher T, Sill M, Ryzhova M, et al. Integrated molecular characterization of idh-mutant glioblastomas. Neuropathol Appl Neurobiol (2019) 45(2):108–18. doi: 10.1111/nan.12523
54. Carrillo JA, Lai A, Nghiemphu PL, Kim HJ, Phillips HS, Kharbanda S, et al. Relationship between tumor enhancement, edema, IDH1 mutational status, MGMT promoter methylation, and survival in glioblastoma. Am J Neuroradiol (2012) 33(7):1349. doi: 10.3174/ajnr.A2950
55. De Leo A, Ugolini A, Veglia F. Myeloid cells in glioblastoma microenvironment. Cells (2021) 10(1):18. doi: 10.3390/cells10010018
56. Khan S, Mittal S, McGee K, Alfaro-Munoz KD, Majd N, Balasubramaniyan V, et al. Role of neutrophils and myeloid-derived suppressor cells in glioma progression and treatment resistance. Int J Mol Sci (2020) 21(6):1954. doi: 10.3390/ijms21061954
57. Yeo AT, Rawal S, Delcuze B, Christofides A, Atayde A, Strauss L, et al. Single-cell rna sequencing reveals evolution of immune landscape during glioblastoma progression. Nat Immunol (2022) 23(6):971–84. doi: 10.1038/s41590-022-01215-0
58. Mega A, Hartmark Nilsen M, Leiss LW, Tobin NP, Miletic H, Sleire L, et al. Astrocytes enhance glioblastoma growth. Glia (2020) 68(2):316–27. doi: 10.1002/glia.23718
59. Zhang H, Zhou Y, Cui B, Liu Z, Shen H. Novel insights into astrocyte-mediated signaling of proliferation, invasion and tumor immune microenvironment in glioblastoma. BioMed Pharmacother (2020) 126:110086. doi: 10.1016/j.biopha.2020.110086
60. Trylcova J, Busek P, Smetana K, Balaziova E, Dvorankova B, Mifkova A, et al. Effect of cancer-associated fibroblasts on the migration of glioma cells in vitro. Tumor Biol (2015) 36(8):5873–9. doi: 10.1007/s13277-015-3259-8
61. Di Ianni N, Maffezzini M, Eoli M, Pellegatta S. Revisiting the immunological aspects of temozolomide considering the genetic landscape and the immune microenvironment composition of glioblastoma. Front Oncol (2021) 11:747690. doi: 10.3389/fonc.2021.747690
62. Cui X, Wang Q, Zhou J, Wang Y, Xu C, Tong F, et al. Single-cell transcriptomics of glioblastoma reveals a unique tumor microenvironment and potential immunotherapeutic target against tumor-associated macrophage. Front Oncol (2021) 11:710695. doi: 10.3389/fonc.2021.710695
63. Haddad AF, Chen J-S, Oh T, Pereira MP, Joshi RS, Aghi MK. Higher cytolytic score correlates with an immunosuppressive tumor microenvironment and reduced survival in glioblastoma. Sci Rep (2020) 10(1):17580. doi: 10.1038/s41598-020-73793-8
64. Sauvageot CM-E, Weatherbee JL, Kesari S, Winters SE, Barnes J, Dellagatta J, et al. Efficacy of the Hsp90 inhibitor 17-aag in human glioma cell lines and tumorigenic glioma stem cells. Neuro Oncol (2009) 11(2):109–21. doi: 10.1215/15228517-2008-060
65. Pastvova N, Dolezel P, Mlejnek P. Heat shock protein inhibitor 17-Allyamino-17-Demethoxygeldanamycin, a potent inductor of apoptosis in human glioma tumor cell lines, is a weak substrate for Abcb1 and Abcg2 transporters. Pharmaceuticals (2021) 14(2):107. doi: 10.3390/ph14020107
66. Saxena V, Hussain MD. Formulation and in vitro evaluation of 17-Allyamino-17-Demethoxygeldanamycin (17-aag) loaded polymeric mixed micelles for glioblastoma multiforme. Colloids Surf B Biointerfaces (2013) 112:350–5. doi: 10.1016/j.colsurfb.2013.07.031
67. Montero A, Fossella F, Hortobagyi G, Valero V. Docetaxel for treatment of solid tumours: A systematic review of clinical data. Lancet Oncol (2005) 6(4):229–39. doi: 10.1016/S1470-2045(05)70094-2
68. Zwain T, Alder JE, Sabagh B, Shaw A, Burrow AJ, Singh KK. Tailoring functional nanostructured lipid carriers for glioblastoma treatment with enhanced permeability through in-vitro 3d Bbb/Bbtb models. Mater Sci Eng C Mater Biol Appl (2021) 121:111774. doi: 10.1016/j.msec.2020.111774
69. Gajbhiye V, Jain NK. The treatment of glioblastoma xenografts by surfactant conjugated dendritic nanoconjugates. Biomaterials (2011) 32(26):6213–25. doi: 10.1016/j.biomaterials.2011.04.057
70. Wu W, Klockow JL, Zhang M, Lafortune F, Chang E, Jin L, et al. Glioblastoma multiforme (Gbm): An overview of current therapies and mechanisms of resistance. Pharmacol Res (2021) 171:105780. doi: 10.1016/j.phrs.2021.105780
71. Karpel-Massler G, Andrew Westhoff M E, Kast R, Rainer Wirtz C, Halatsch M-E. Erlotinib in glioblastoma - lost in translation? Anticancer Agents Med Chem (2011) 11(8):748–55. doi: 10.2174/187152011797378788
72. Bagherian A, Roudi B, Masoudian N, Mirzaei H. Anti-glioblastoma effects of nanomicelle-curcumin plus erlotinib. Food Funct (2021) 12(21):10926–37. doi: 10.1039/D1FO01611C
73. Kim K, Kong S-Y, Fulciniti M, Li X, Song W, Nahar S, et al. Blockade of the Mek/Erk signalling cascade by As703026, a novel selective Mek1/2 inhibitor, induces pleiotropic anti-myeloma activity in vitro and in vivo. Br J Haematol (2010) 149(4):537–49. doi: 10.1111/j.1365-2141.2010.08127.x
74. Yoon J, Koo K-H, Choi K-Y. Mek1/2 inhibitors As703026 and Azd6244 may be potential therapies for kras mutated colorectal cancer that is resistant to egfr monoclonal antibody therapy. Cancer Res (2011) 71(2):445–53. doi: 10.1158/0008-5472.can-10-3058
75. Miller CR, Oliver KE, Farley JH. Mek1/2 inhibitors in the treatment of gynecologic malignancies. Gynecol Oncol (2014) 133(1):128–37. doi: 10.1016/j.ygyno.2014.01.008
76. Bian Y, Han J, Kannabiran V, Mohan S, Cheng H, Friedman J, et al. Mek inhibitor pd-0325901 overcomes resistance to Ck2 inhibitor cx-4945 and exhibits anti-tumor activity in head and neck cancer. Int J Biol Sci (2015) 11(4):411–22. doi: 10.7150/ijbs.10745
77. de Gooijer MC, Zhang P, Weijer R, Buil LCM, Beijnen JH, van Tellingen O. The impact of p-glycoprotein and breast cancer resistance protein on the brain pharmacokinetics and pharmacodynamics of a panel of mek inhibitors. Int J Cancer (2018) 142(2):381–91. doi: 10.1002/ijc.31052
78. Shannon S, Jia D, Entersz I, Beelen P, Yu M, Carcione C, et al. Inhibition of glioblastoma dispersal by the mek inhibitor Pd0325901. BMC Cancer (2017) 17(1):121. doi: 10.1186/s12885-017-3107-x
79. Nduom EK, Weller M, Heimberger AB. Immunosuppressive mechanisms in glioblastoma. Neuro Oncol (2015) 17(suppl_7):vii9–vii14. doi: 10.1093/neuonc/nov151
80. Genoud V, Migliorini D. Challenging hurdles of current targeting in glioblastoma: A focus on immunotherapeutic strategies. Int J Mol Sci (2021) 22(7):3493. doi: 10.3390/ijms22073493
81. Rodríguez-Camacho A, Flores-Vázquez JG, Moscardini-Martelli J, Torres-Ríos JA, Olmos-Guzmán A, Ortiz-Arce CS, et al. Glioblastoma treatment: State-of-the-Art and future perspectives. Int J Mol Sci (2022) 23(13):7207. doi: 10.3390/ijms23137207
82. Cai J, Luo J, Wang S, Yang S. Feature selection in machine learning: A new perspective. Neurocomputing (2018) 300:70–9. doi: 10.1016/j.neucom.2017.11.077
83. Khaire UM, Dhanalakshmi R. Stability of feature selection algorithm: A review. J King Saud Univ - Comput Inf Sci (2022) 34(4):1060–73. doi: 10.1016/j.jksuci.2019.06.012
84. Munquad S, Si T, Mallik S, Das AB, Zhao Z. A deep learning–based framework for supporting clinical diagnosis of glioblastoma subtypes. Front Genet (2022) 13:855420. doi: 10.3389/fgene.2022.855420
85. Macyszyn L, Akbari H, Pisapia JM, Da X, Attiah M, Pigrish V, et al. Imaging patterns predict patient survival and molecular subtype in glioblastoma Via machine learning techniques. Neuro Oncol (2015) 18(3):417–25. doi: 10.1093/neuonc/nov127
86. Zhang Y-H, Li Z, Zeng T, Pan X, Chen L, Liu D, et al. Distinguishing glioblastoma subtypes by methylation signatures. Front Genet (2020) 11:604336. doi: 10.3389/fgene.2020.604336
87. Greten FR, Karin M. The Ikk/Nf-Kb activation pathway–a target for prevention and treatment of cancer. Cancer Lett (2004) 206(2):193–9. doi: 10.1016/j.canlet.2003.08.029
88. Chauhan A, Islam AU, Prakash H, Singh S. Phytochemicals targeting nf-Kb signaling: Potential anti-cancer interventions. J Pharm Anal (2022) 12(3):394–405. doi: 10.1016/j.jpha.2021.07.002
89. Ivanisenko NV, Seyrek K, Hillert-Richter LK, König C, Espe J, Bose K, et al. Regulation of extrinsic apoptotic signaling by c-flip: Towards targeting cancer networks. Trends Cancer (2022) 8(3):190–209. doi: 10.1016/j.trecan.2021.12.002
90. Öztürk S, Schleich K, Lavrik IN. Cellular flice-like inhibitory proteins (C-flips): Fine-tuners of life and death decisions. Exp Cell Res (2012) 318(11):1324–31. doi: 10.1016/j.yexcr.2012.01.019
91. Saxena M, Yeretssian G. Nod-like receptors: Master regulators of inflammation and cancer. Front Immunol (2014) 5:327. doi: 10.3389/fimmu.2014.00327
92. Ostuni R, Zanoni I, Granucci F. Deciphering the complexity of toll-like receptor signaling. Cell Mol Life Sci (2010) 67(24):4109–34. doi: 10.1007/s00018-010-0464-x
93. Chen R, Alvero AB, Silasi D-A, Mor G. Inflammation, cancer and chemoresistance: Taking advantage of the toll-like receptor signaling pathway. Am J Reprod Immunol (2007) 57(2):93–107. doi: 10.1111/j.1600-0897.2006.00441.x
94. Fan W, Wang D, Li G, Xu J, Ren C, Sun Z, et al. A novel chemokine-based signature for prediction of prognosis and therapeutic response in glioma. CNS Neurosci Ther (2022) 28(12):2090–103. doi: 10.1111/cns.13944
95. Xiong Y, Xiong Z, Cao H, Li C, Wanggou S, Li X. Multi-dimensional omics characterization in glioblastoma identifies the purity-associated pattern and prognostic gene signatures. Cancer Cell Int (2020) 20(1):37. doi: 10.1186/s12935-020-1116-3
Keywords: glioblastoma (GBM), immune landscape, machine-learning (ML), subclassification, prognosis, immunotherapy
Citation: Li H, He J, Li M, Li K, Pu X and Guo Y (2022) Immune landscape-based machine-learning–assisted subclassification, prognosis, and immunotherapy prediction for glioblastoma. Front. Immunol. 13:1027631. doi: 10.3389/fimmu.2022.1027631
Received: 25 August 2022; Accepted: 15 November 2022;
Published: 01 December 2022.
Edited by:
Liangxue Zhou, Sichuan University, ChinaReviewed by:
Alfeu Zanotto-filho, Federal University of Santa Catarina, BrazilCopyright © 2022 Li, He, Li, Li, Pu and Guo. This is an open-access article distributed under the terms of the Creative Commons Attribution License (CC BY). The use, distribution or reproduction in other forums is permitted, provided the original author(s) and the copyright owner(s) are credited and that the original publication in this journal is cited, in accordance with accepted academic practice. No use, distribution or reproduction is permitted which does not comply with these terms.
*Correspondence: Yanzhi Guo, eXpndW9Ac2N1LmVkdS5jbg==
Disclaimer: All claims expressed in this article are solely those of the authors and do not necessarily represent those of their affiliated organizations, or those of the publisher, the editors and the reviewers. Any product that may be evaluated in this article or claim that may be made by its manufacturer is not guaranteed or endorsed by the publisher.
Research integrity at Frontiers
Learn more about the work of our research integrity team to safeguard the quality of each article we publish.