 Liying Yang
 Wei Zhang1
 Guanqun Yang
 Ligang Xing
94% of researchers rate our articles as excellent or good
Learn more about the work of our research integrity team to safeguard the quality of each article we publish.
Find out more
ORIGINAL RESEARCH article
Front. Immunol. , 04 January 2023
Sec. Cancer Immunity and Immunotherapy
Volume 13 - 2022 | https://doi.org/10.3389/fimmu.2022.1022638
Background: The anti-tumoral or pro-tumoral roles of CD4+ and CD8+ T cells typify the complexity of T cell subsets function in cancer. In the non-small cell lung cancer (NSCLC), the density and topology of distinct T cell phenotypes at the tumor center (TC) versus the invasive margin (IM) are largely unknown. Here, we investigated T cell subsets density and distribution within TC and IM regions in NSCLC and its impact on the prognosis.
Methods: We performed multiplex immunofluorescence using a tissue microarray of samples from 99 patients with locally advanced NSCLC to elucidate the distributions of tumor cell, T cell subpopulations (CD4/conventional CD4/regulatory CD4/CD8/cytotoxic CD8/pre-dysfunctional CD8/dysfunctional CD8), microvessel density (MVD), cancer-associated fibroblasts (CAFs) and hypoxia-inducible factor-1α (HIF-1α) in TC and IM tissues. Cell-to-cell nearest neighbor distances and interactions were analyzed using the phenoptrreports R package. Cox regression was used to evaluate the associations between T cell subsets density and proximity to tumor cells and recurrence-free survival (RFS). Correlations between different cell subsets were examined by Spearman’s or Kruskal-Wallis tests.
Results: In the locally advanced NSCLC, the proportion of tumor cells and CAFs in IM is lower than in the TC, while MVD, CD4+, and CD8+ T lymphocytes were increased, and tumor cells were closer to T lymphocytes and their subsets. The density and proximity of CD4+ and CD8+ T cells in the TC and IM regions were not associated with RFS, but in the IM area, increased density of dysfunctional CD8 and closer regulatory CD4 to tumor cells were independent risk factors for recurrence (HR were 3.536 and 2.884, respectively), and were positively correlated with HIF-1α+CD8 (r = 0.41, P = 0.000) and CAFs (P = 0.017), respectively.s
Conclusions: In locally advanced NSCLC, the functional status of T cells in the IM region is closely related to recurrence. The density of dysfunctional CD8 and the proximity of regulatory CD4 to tumor cells were independent risk factors for recurrence, and are positively correlated with the hypoxia response of CD8+ T cells and CAFs. Targeting hypoxia or CAFs is expected to further sensitize therapy.
The tumor microenvironment (TME), consisting of tumor cells, immune cells, blood vessels, stroma cells, and other components, is closely associated with the development of NSCLC (1–3). T cells and their role in prognosis have been extensively studied, and their increased infiltration is considered to result in a better prognosis (4–9). Traditionally, T cells are classified as CD4+ and CD8+ T cells by a single protein marker, but their association with the prognosis of NSCLC is controversial (6, 9–14).
Single-cell sequencing had shown that CD4+ and CD8+ T cells had different functional statuses in NSCLC (15–17). The conventional (CD4+ Tcon) and regulatory CD4 (CD4+ Treg) had their functions; however, their impact on prognosis remains controversial (4, 6, 9, 12, 18–20). CD8 could gradually change from a pre-dysfunctional (CD8+ Tpre) to a dysfunctional state (CD8+ Tdys) in response to continuous stimulation by tumor antigens (15, 17). Results from TCGA database found that high CD8+ Tpre combined with low CD8+ Tdys significantly prolonged OS in lung adenocarcinoma patients (17), but the detailed histological analysis was not available because of the lack of single protein markers.
Recent advances in multiplex immunofluorescence (mIF) have enabled simultaneous detection of multiple protein targets in a single tissue section, providing unique insights for accurately identifying and quantifying the functional status of T cell subsets (21–23). At the same time, mIF-based spatial proteomic analysis can quantify cell-to-cell nearest neighbor distances (NND) and interactions. Quantifying the functional macrophage cell populations and their proximity to tumor cells could provide better prognostic information for NSCLC (24). However, the functional T cells and their proximity to tumor cells in NSCLC remain unclear.
Moreover, recent literatures suggested topologically distinct distribution of T cells within the TME (7, 25, 26). The CD8+ T cells density with survival was highly significant at IM in contrast with TC of lung cancer (27). However, distribution patterns of functional T cell subsets between TC and IM in NSCLC remain unexplored. Therefore, we used mIF to analyze locally advanced NSCLC relapse-associated TME and explore its relationship with hypoxia-inducible factor-1α (HIF-1α), microvascular density (MVD), and cancer-associated fibroblasts (CAFs) in order to guide individualized therapy.
A total of 139 patients with primary NSCLC underwent radical surgery between January 1, 2014, and August 31, 2018, at Shandong Cancer Hospital. Clinicopathological information was obtained from the medical records. None of the patients were treated with neoadjuvant therapy. Recurrence-free survival was defined as the interval between radical surgery and the first relapse or death or between surgery and the last observation for patients without relapse. The actual number of patients analyzed in the study was 99, and the detail of the inclusion and exclusion criteria was shown in Supplementary Figure S1.
Formalin-fixed paraffin-embedded (FFPE) histological sections were collected for TMA construction. TMA was performed using standard procedures (27, 28), representative areas were carefully selected and marked on a hematoxylin and eosin stain slide, and 1 mm cores were obtained from the FFPE blocks using a needle and inserted into a recipient paraffin block. All slides were examined by at least one experienced pathologist and four representative areas were selected: two TC regions and two IM regions. IM was defined as the region centered on the border separating the host tissue from the malignant nests, with an extent of 1 mm (25, 27, 29). Furthermore, we selected lymphoid tissue as a positive control (the core of lymphoid tissue was prepared for each tissue microarray), and the autofluorescence of the tissue was used as a negative control.
Two mIF panels were developed to characterize the locally advanced NSCLC immune microenvironment. CD4 panel including Pan-CK, CD4, FoxP3, CD8, CD31, α-SMA, HIF-1α and DAPI. CD8 panel including Pan-CK, CD8, CD103, PD-1, TIM-3 and DAPI.
The procedure for mIF has been previously described (21, 30–33). In summary, 3 μm serial sections obtained from TMA blocks were deparaffinized and rehydrated using a decreasing ethanol series. Antigen dretrieval was performed by using microwaves. A blocking buffer was then used to initiate protein stabilization and background reduction for 30-60 minutes at room temperature. Primary antibodies were applied and washed in 1×Tris-buffered saline containing 0.5% Tween 20. Isotype-specific HRP-conjugated antibodies and an Opal fluorophore (Akoya Biosciences). Finally, the nuclei were stained with DAPI (Akoya Biosciences) for 10 min. Antibodies and fluorophores used in the mIF procedures were detailed in Supplementary Table 1.
To obtain multispectral images, the stained slides were scanned at 200x magnification using Vectra Polaris (Akoya Biosciences). A spectral library was used to separate each multispectral image cube into its individual components (spectral unmixing) (InForm 2.4.8, Akoya Biosciences). The InFrom software then automatically recognizes and removes autofluorescence. MIF composited images were shown in Figures 1A, B.
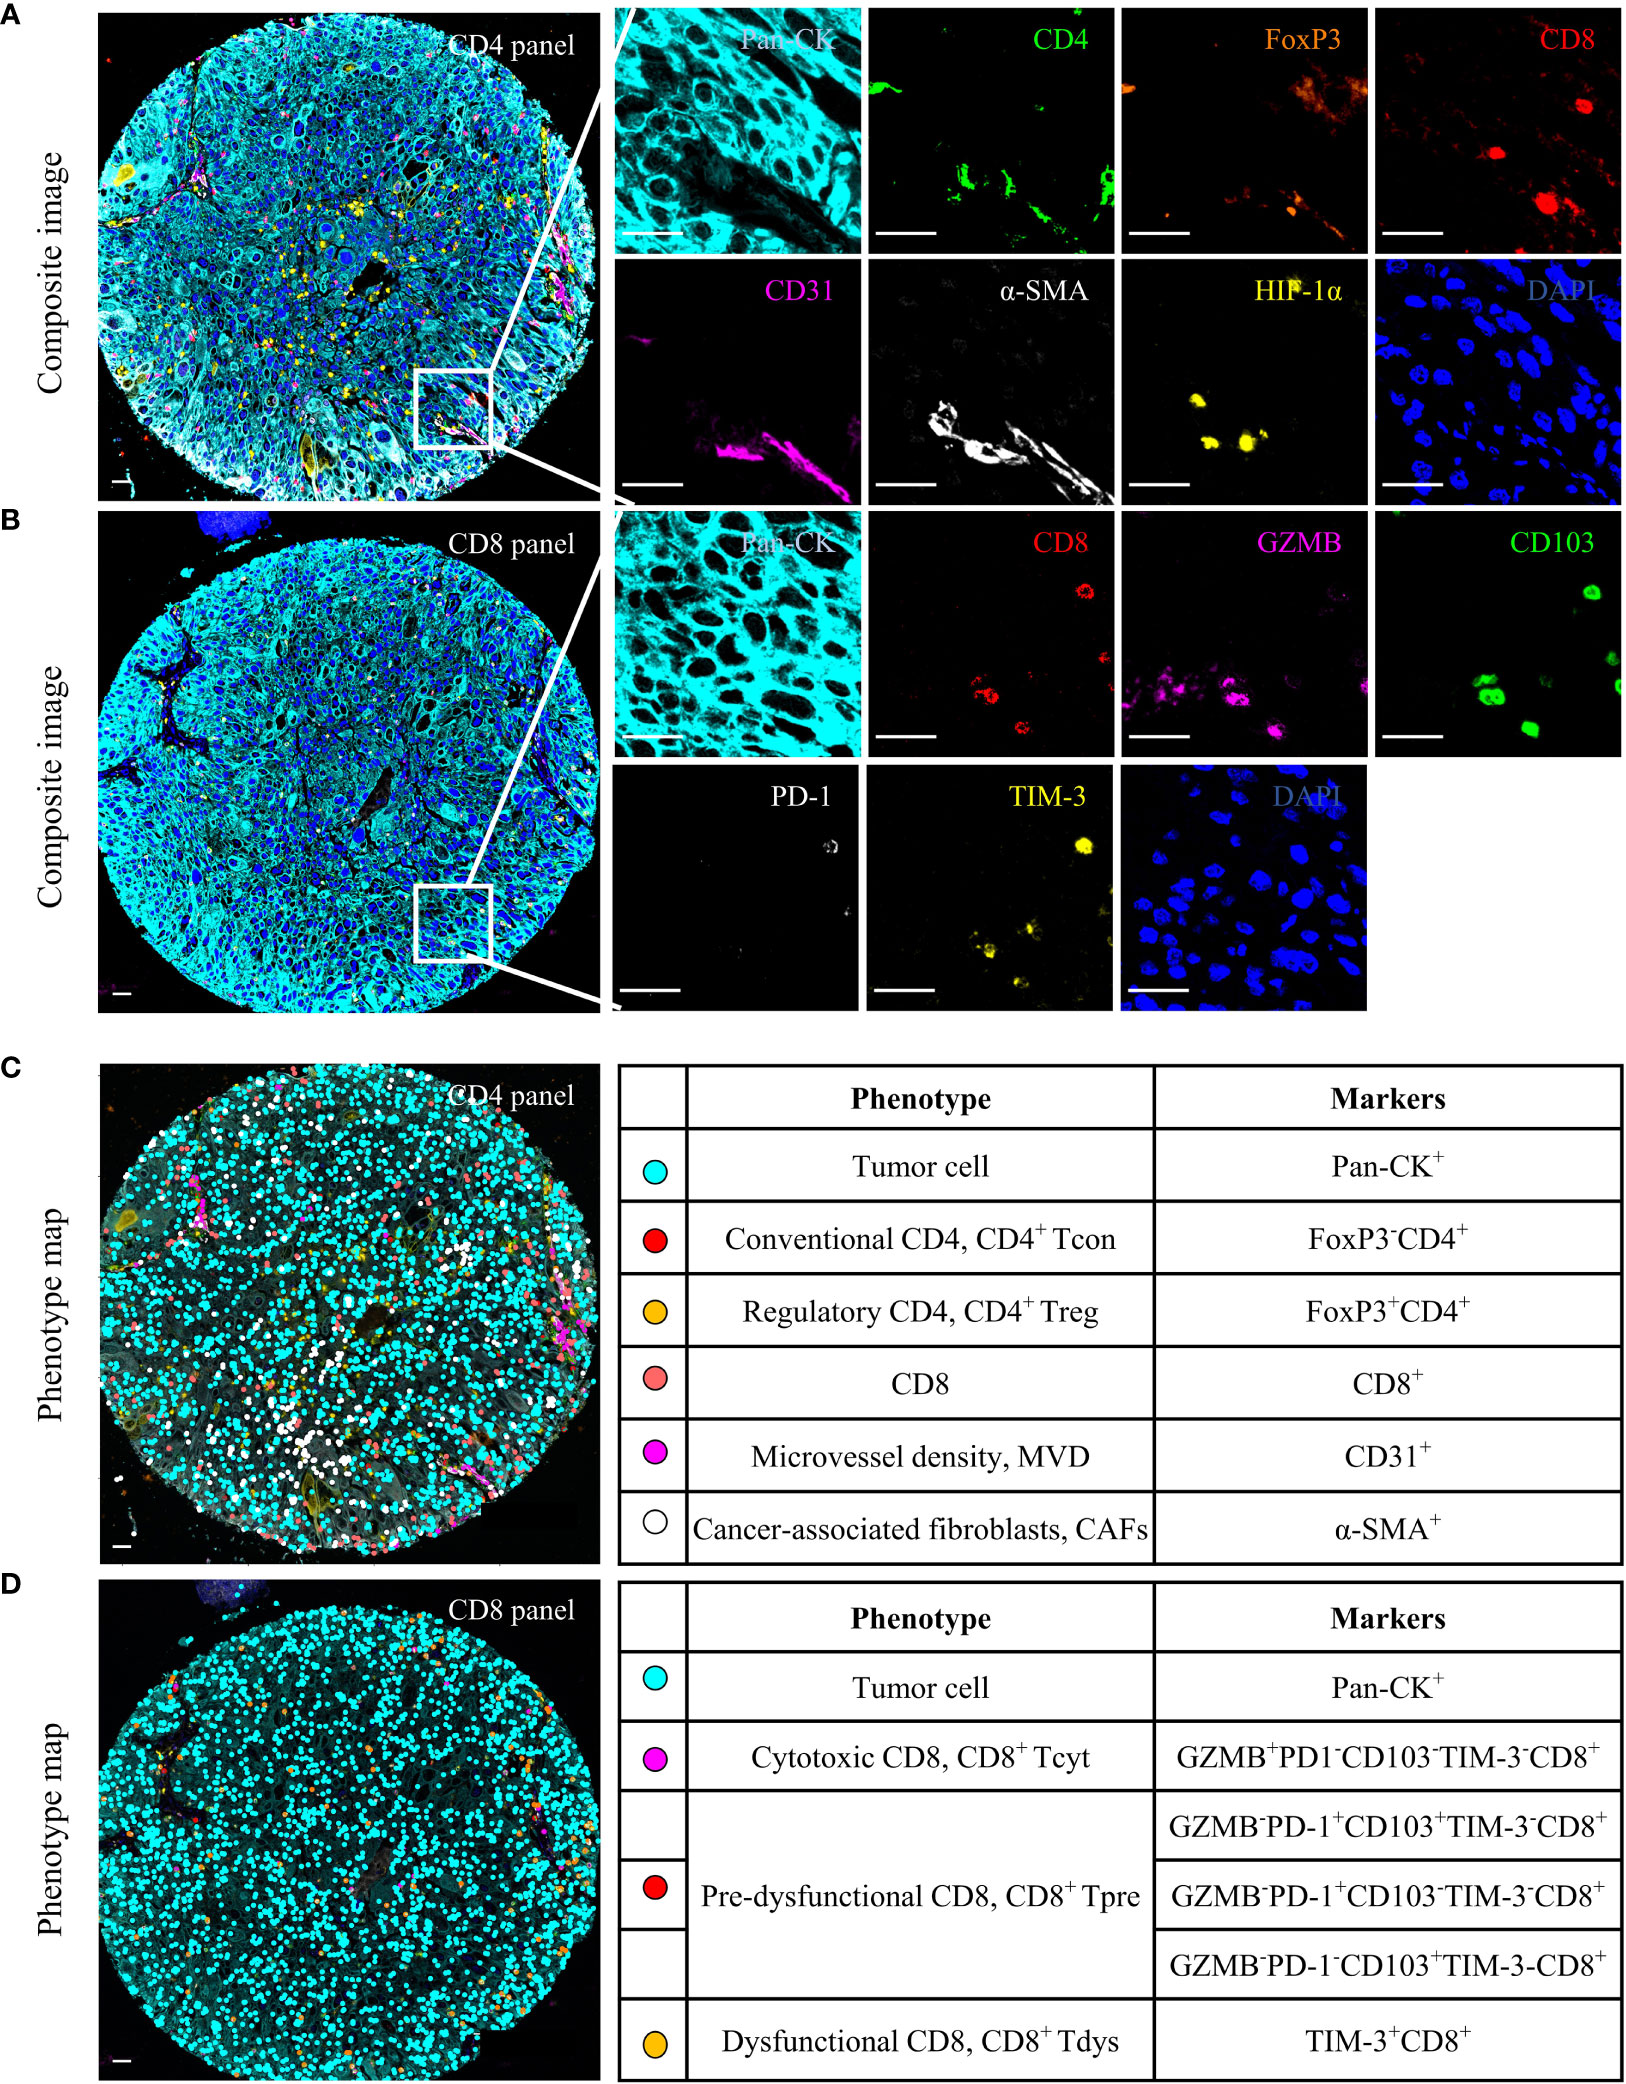
Figure 1 Multiplex immunofluorescence (mIF) analysis of human locally advanced NSCLC. Examples of mIF images (A, B) and summary of each defined cell phenotype (C, D) and associated markers from the CD4 and CD8 panel. Scale bar, 25 μm.
All spectrally unmixed images were subsequently subjected to a proprietary inForm active learning phenotyping algorithm. This allowed for individual identification of each DAPI-stained cell according to their pattern of fluorophore expression and nuclear/cell morphological features. The data exported from the inForm software were further processed using R statistical programming language (version 3.6.3). As shown in Figures 1C, D, each functional T cell and tumor cell can associate with specific x and y spatial coordinates. Only tumor cores containing tumor cells in at least 5% of the total tissue area free of artifacts were selected for further analysis.
Both panels included 2-(4-amidinophenyl)-1H-indole-6-carboxamidine (DAPI) as a nuclei marker and Pan-CK to identify tumor cells. CD4 panel aimed to identify the functional status of CD4+ T cells, stromal components, and HIF-1α. (i) FoxP3- and FoxP3+ were defined as CD4+ Tcon and CD4+ Treg, respectively, (ii) Two stroma components: CD31 for MVD (22), α-SMA for CAFs (34), and (iii) HIF-1α, a hypoxia marker expressed on tumor cells, CD4 or CD8. CD8 panel was designed to identify three functional states of CD8+ T cells. (i) Granzyme B (GZMB) is defined as a cytotoxic CD8 (CD8+ Tcyt) (15). (ii) CD103 and PD-1 as pre-dysfunctional markers, and cells expressing one or both of these markers were defined as CD8+ Tpre because each exhibited insufficient sensitivity as a single marker (15, 17). (iii) TIM-3 is a marker of CD8+ Tdys (15, 17). The counts of phenotypes were normalized to the total cell counts for the total area to generate the density of phenotypes per 1,000 cells.
To evaluate the spatial interaction between T cells and tumor cells, we conducted spatial proteomic analyses using the NND and proximity. NND analysis was conducted by calculating the distance (μm) from each tumor cell to its nearest T cell, and proximity analysis was defined as the number of tumor cells with at least one T cell within a 30 μm radius. We selected a 30 μm radius for this study, as it has been previously suggested that these distances represent physiologically plausible distances for direct cell-cell interactions (24, 31, 33, 35, 36).
All statistical calculations were performed using IBM SPSS Statistics (version 23.0), GraphPad Prism (version 9.0.0), and R software (version 3.6.3).
The chi-square test or Fisher’s exact test was used to examine differences in categorical variables. The RFS distributions for the patients were estimated using the Kaplan-Meier method. For survival analysis of continuous data, we grouped the patients into high (> cutoff value) or low (≤ cutoff value) groups using survivalROC packages (version 3.6.3), followed by a log-rank test. Regression analysis of the RFS data was performed using the Cox proportional hazards model. Correlations between two parameters were examined using Spearman’s r values and the Kruskal-Wallis test. Statistical significance was set at P < 0.05.
Table 1 list the baseline clinicopathologic characteristics of 99 patients with locally advanced NSCLC that were enrolled in this study. The median age at diagnosis was 59 (range 53-66) years and 68 (69%) patients were men. Smoking index, tumor location, visceral pleural invasion and histology subtype were balanced. The majority of patients had stage IIB/IIIA disease (96%) and underwent adjuvant chemotherapy (88%). The median follow-up time was 37 months (range 3–65). The median RFS time was 28 months (range 1-65). At the time of follow-up, 52 (53%) patients relapsed, and the baseline of relapsed and non-relapsed patients was balanced.
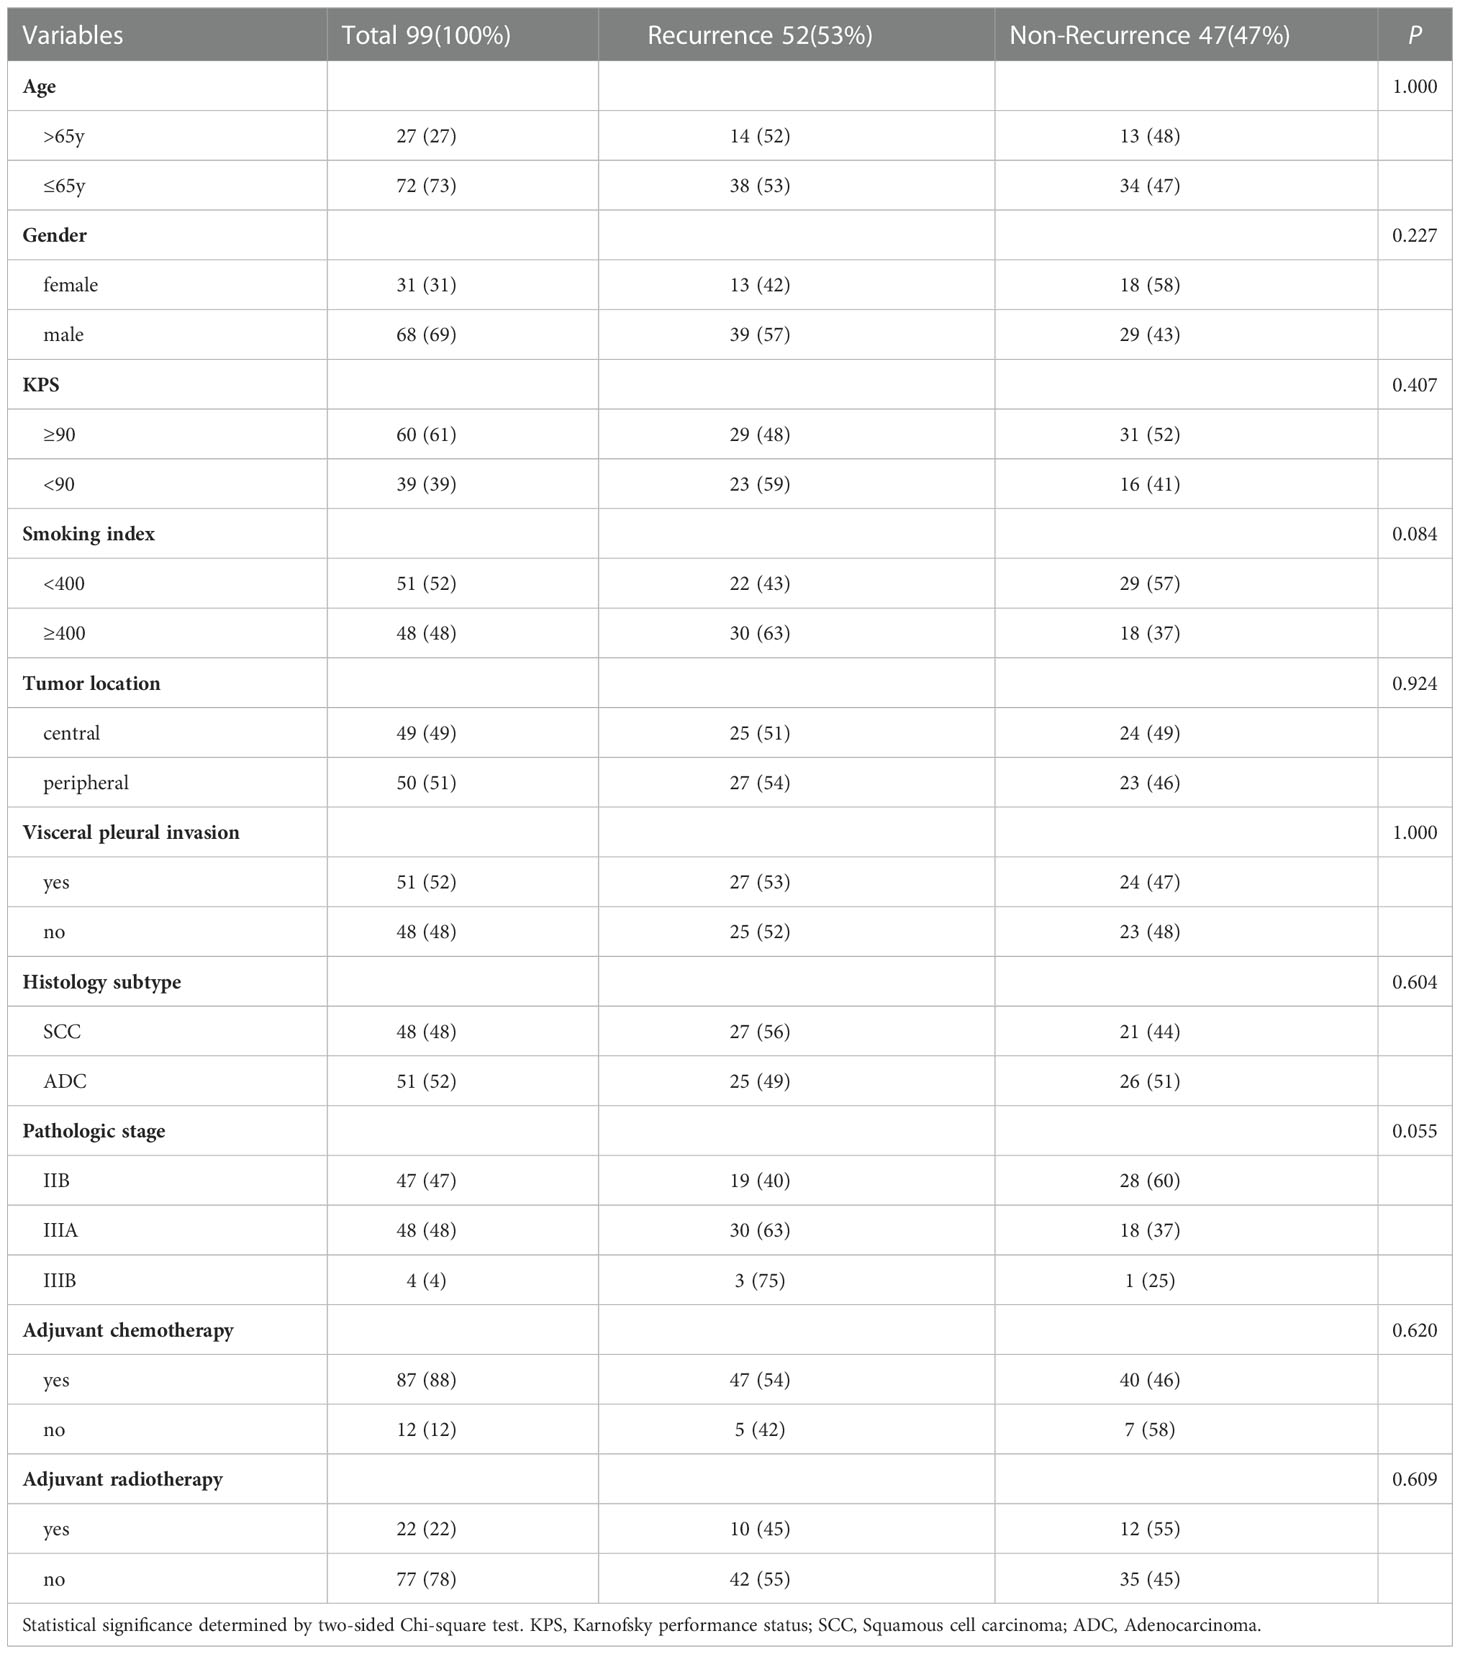
Table 1 Patient characteristic.
The heterogeneity of the immune microenvironment between the TC and IM regions was shown in Figure 2A. We observed that TC presented with significantly more tumor cells and CAFs than IM, but lower densities of CD4+ T cells, CD8+ T cells, MVD, and others (Figure 2B). CD4+ T cells were mainly CD4+ Tcon, and compared to TC, the relative proportion of CD4+ Tcon in CD4 increased in IM, while CD4+ Treg decreased (Figure 2C). CD8+ T cells were dominated by CD8+ Tpre and CD8+ Tdys, and the relative proportions of CD8+ Tpre and CD8+ Tdys within the total CD8+ T cells were greater in the TC than in the IM (Figure 2D).
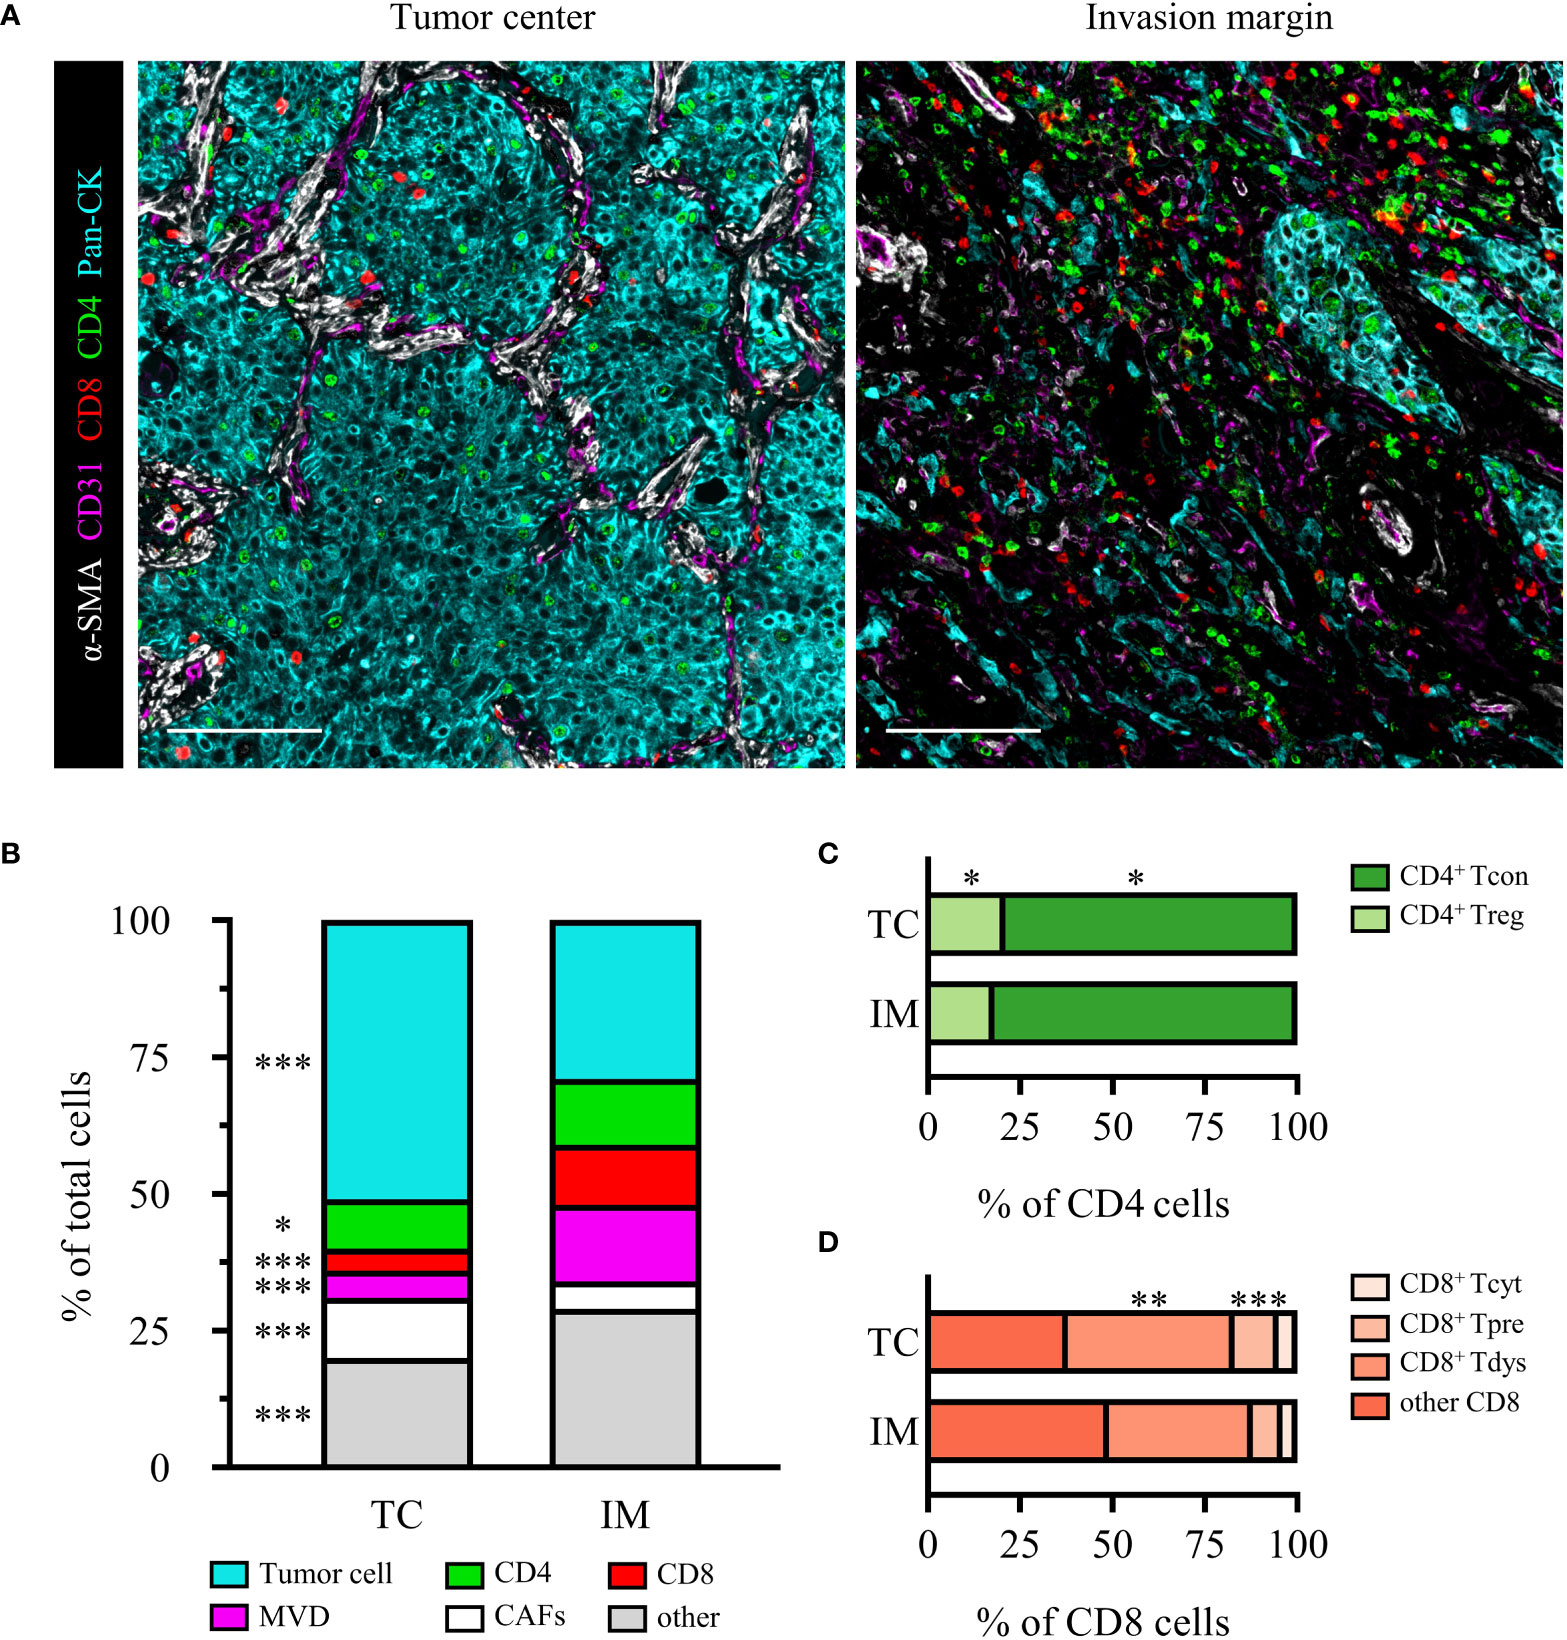
Figure 2 The heterogeneity of TC and IM microenvironment in locally advanced NSCLC. (A) Representative composite images of TC and IM from an SCC patient. Scale bar, 100 μm. (B) Relative distribution of cell phenotypes in TC and IM. Relative distribution analysis of CD4 (C) or CD8 (D) subpopulations. Scale bar, 100 μm. Data is presented as the median. P values were computed by the Kruskal-Wallis test. *P < 0.05, **P < 0.01, ***P < 0.001.
We sought to determine whether the counts of functional T cell subsets were independently correlated with RFS of locally advanced NSCLC. Survival curve analysis showed that CD4+ and CD8+ T cells infiltration in TC and IM was not linked with RFS (Supplementary Figures S2A–D). For their subsets, we observed that only high levels of TC-CD4+ Tcon, IM-CD4+ Treg, and IM-CD8+ Tdys infiltration were associated with shorter RFS (Supplementary Figures S2E, J and Figure 3A). The Cox proportional hazard regression model was used to evaluate the associations between clinicopathological factors (age, gender, histology subtype, pathologic stage), cell densities (TC-CD4+ Tcon, IM-CD4+ Treg, IM-CD8+ Tdys), and clinical outcome. Only high infiltration of IM-CD8+ Tdys was an independent risk factor associated with relapse (P = 0.025, HR = 3.536, 95%CI = 1.170-10.690; median RFS, 15.4 vs 45.0 months, P = 0.006) (Table 2 and Figure 3B).
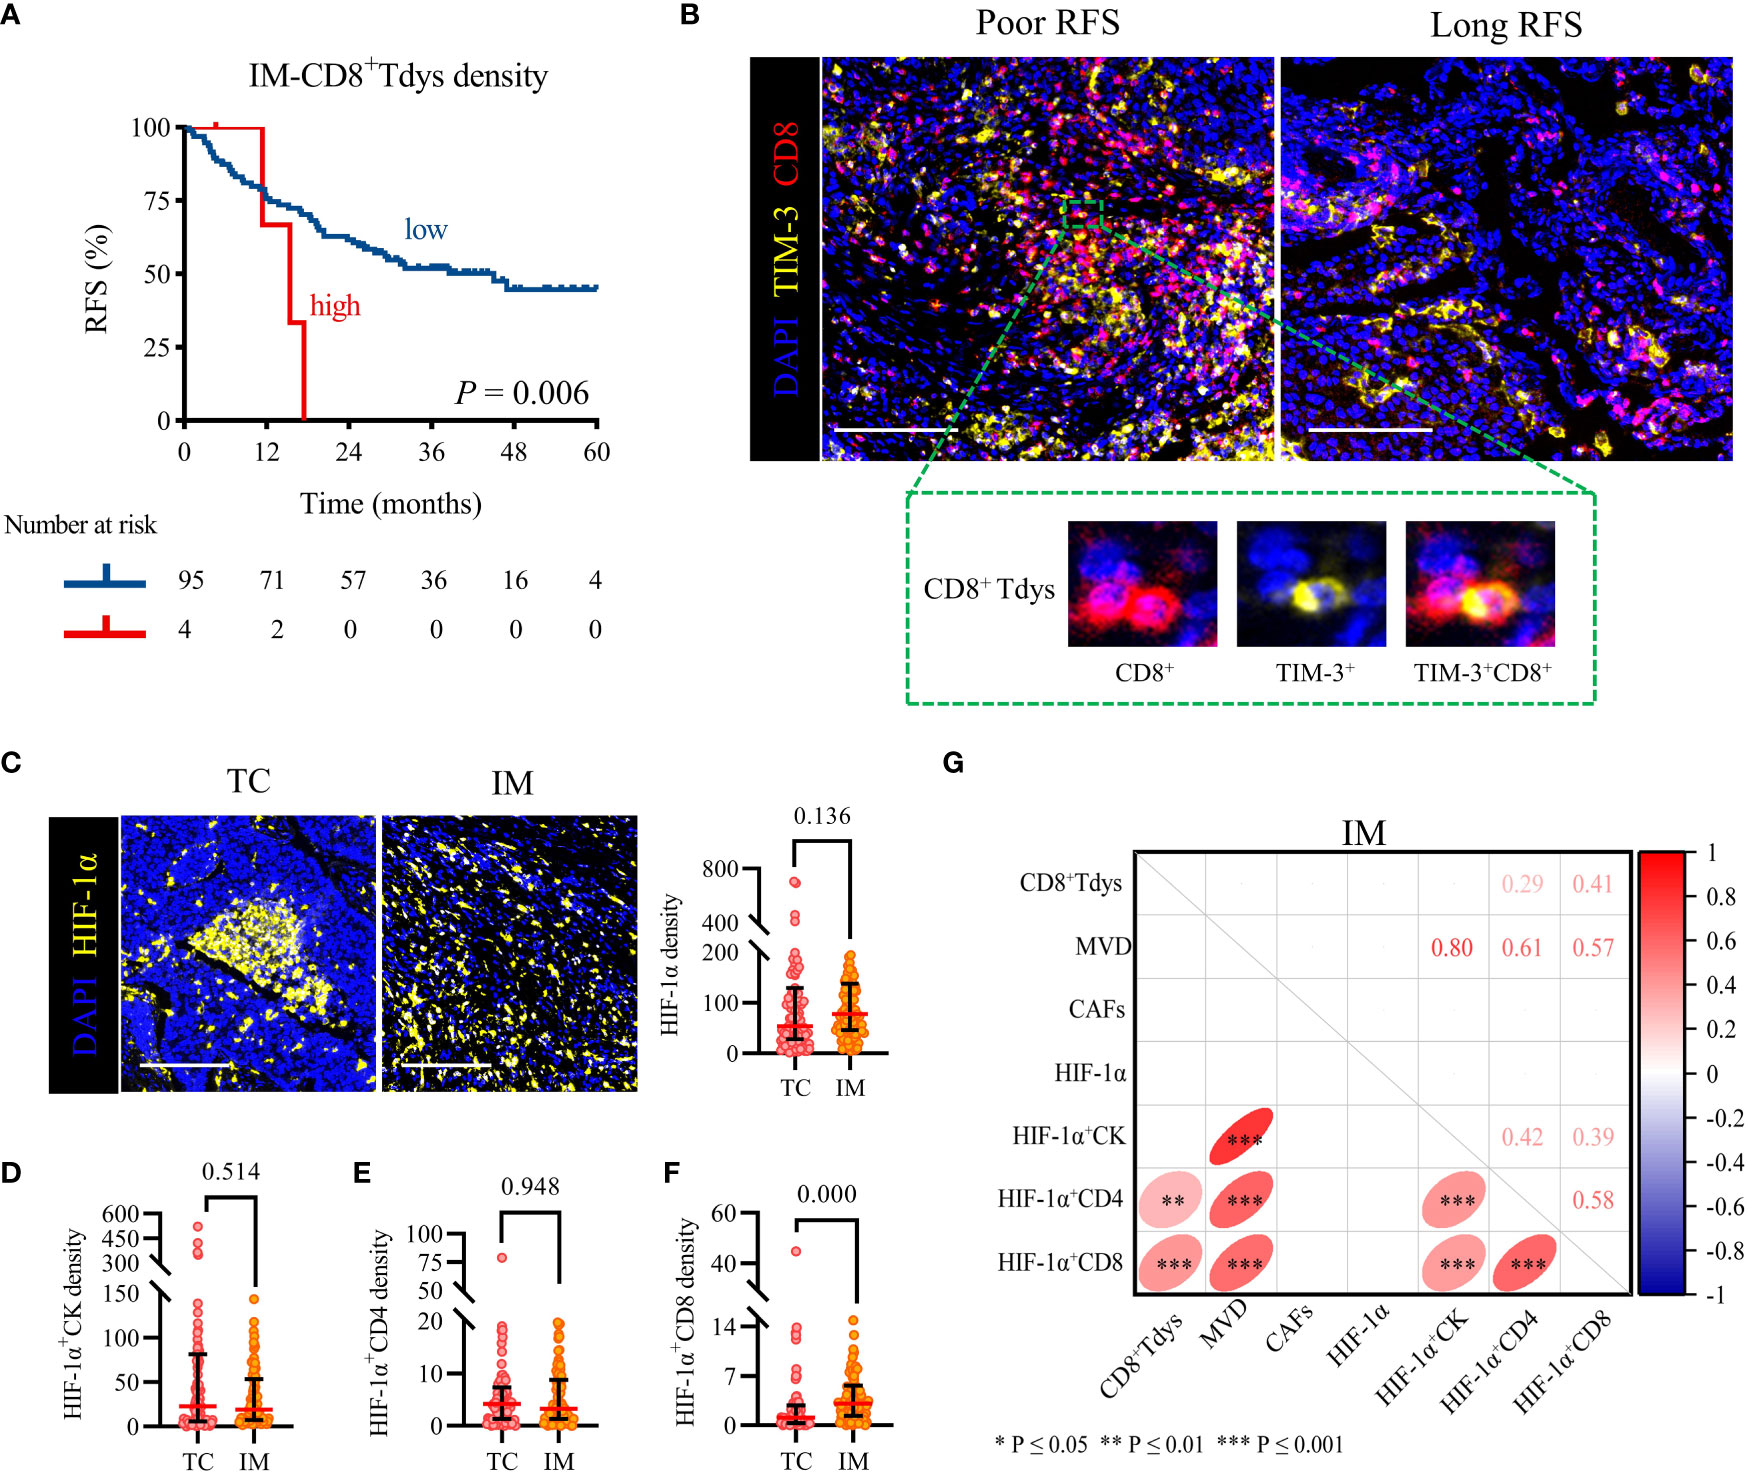
Figure 3 High IM-CD8+ Tdys density was associated with the recurrence of the locally advanced NSCLC, and HIF-1α+CD8 may contribute to the accumulation of CD8+ Tdys. (A) Kaplan–Meier curves illustrate the associations between the expression levels of IM-CD8+ Tdys (high vs low) and the RFS of locally advanced NSCLC. P-values reflect comparisons of two groups by univariate analysis, using the log-rank test. (B) Representative image for poor RFS (left) and long RFS (right). Scale bar, 100 μm. (C–F) The heterogeneity of HIF-1α (C), HIF-1α+CK (D), HIF-1α+CD4 (E), and HIF-1α+CD8 (F) density between TC and IM regions. Scale bar, 100 μm. Significance was determined using the Mann-Whitney test, all data are presented as the median and interquartile ranges. (G) Spearman correlation between CD8+ Tdys and HIF-1α, MVD, CAFs density in the IM region.
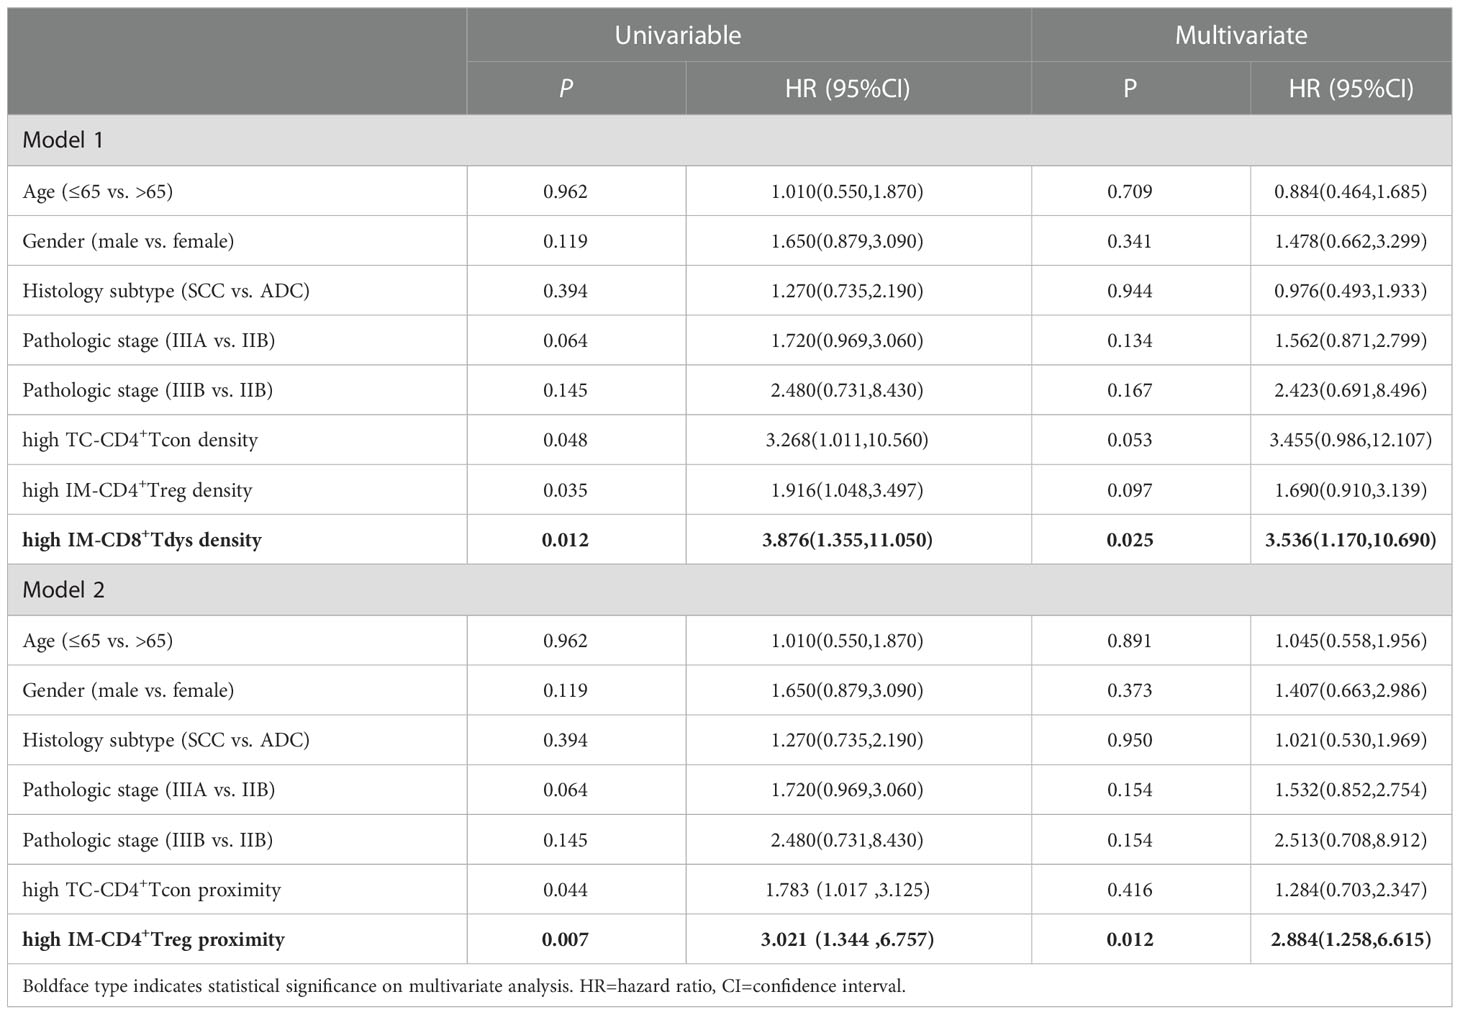
Table 2 Univariable and Multivariate Cox regression analysis for RFS.
Next, we investigated the correlation between CD8+ Tdys and MVD, CAFs, and HIF-1α in the IM region. HIF-1α is not only expressed in tumor cells but also in some immune cells and may affect the infiltration and function of immune cells (37). As shown in Figures 3C–E, there was no statistically significant difference in HIF-1α, HIF-1α+CK and HIF-1α+CD4 density between TC and IM (median, TC vs IM; HIF-1α, 54 vs 78, P = 0.136; HIF-1α+CK, 23 vs 19, P = 0.514; HIF-1α+CD4, 4 vs 1, P = 0.948), but the density of HIF-1α+CD8 in TC was significantly lower than that in IM (1.1 vs 3.1, P = 0.000) (Figure 3F). Interestingly, the IM-HIF-1α+CD8 density was positively correlated with the density of IM-CD8+ Tdys (r = 0.41, P = 0.000) (Figure 3G). Our results suggested that hypoxia may influence the recurrence of locally advanced NSCLC by recruiting CD8+ Tdys or promoting CD8+ T cells exhaustion.
We analyzed the average nearest neighbor distance between T cells and tumor cells. As shown in Figures 4A, B, CD8+ T cells were closer to tumor cells than CD4+ T cells, both in the TC and IM, and CD4+ T cells and CD8+ T cells in TC were farther from tumor cells than in the IM. In addition, CD4+ Tcon were closer to tumor cells than CD4+ Treg, both in the TC and IM; CD4+ Tcon and CD4+ Treg in TC were farther from tumor cells than in IM (Figures 4C, D). Notably, there was no difference in the distance of CD8+ Tpre and CD8+ Tdys cells from tumor cells, either in TC or IM, CD8+ Tpre and CD8+ Tdys in TC were farther from tumor cells than in IM (Figures 4E, F). These findings led us to hypothesize that the spatial interaction of T cells with tumor cells may represent differences in their biological functions with prognostic significance.
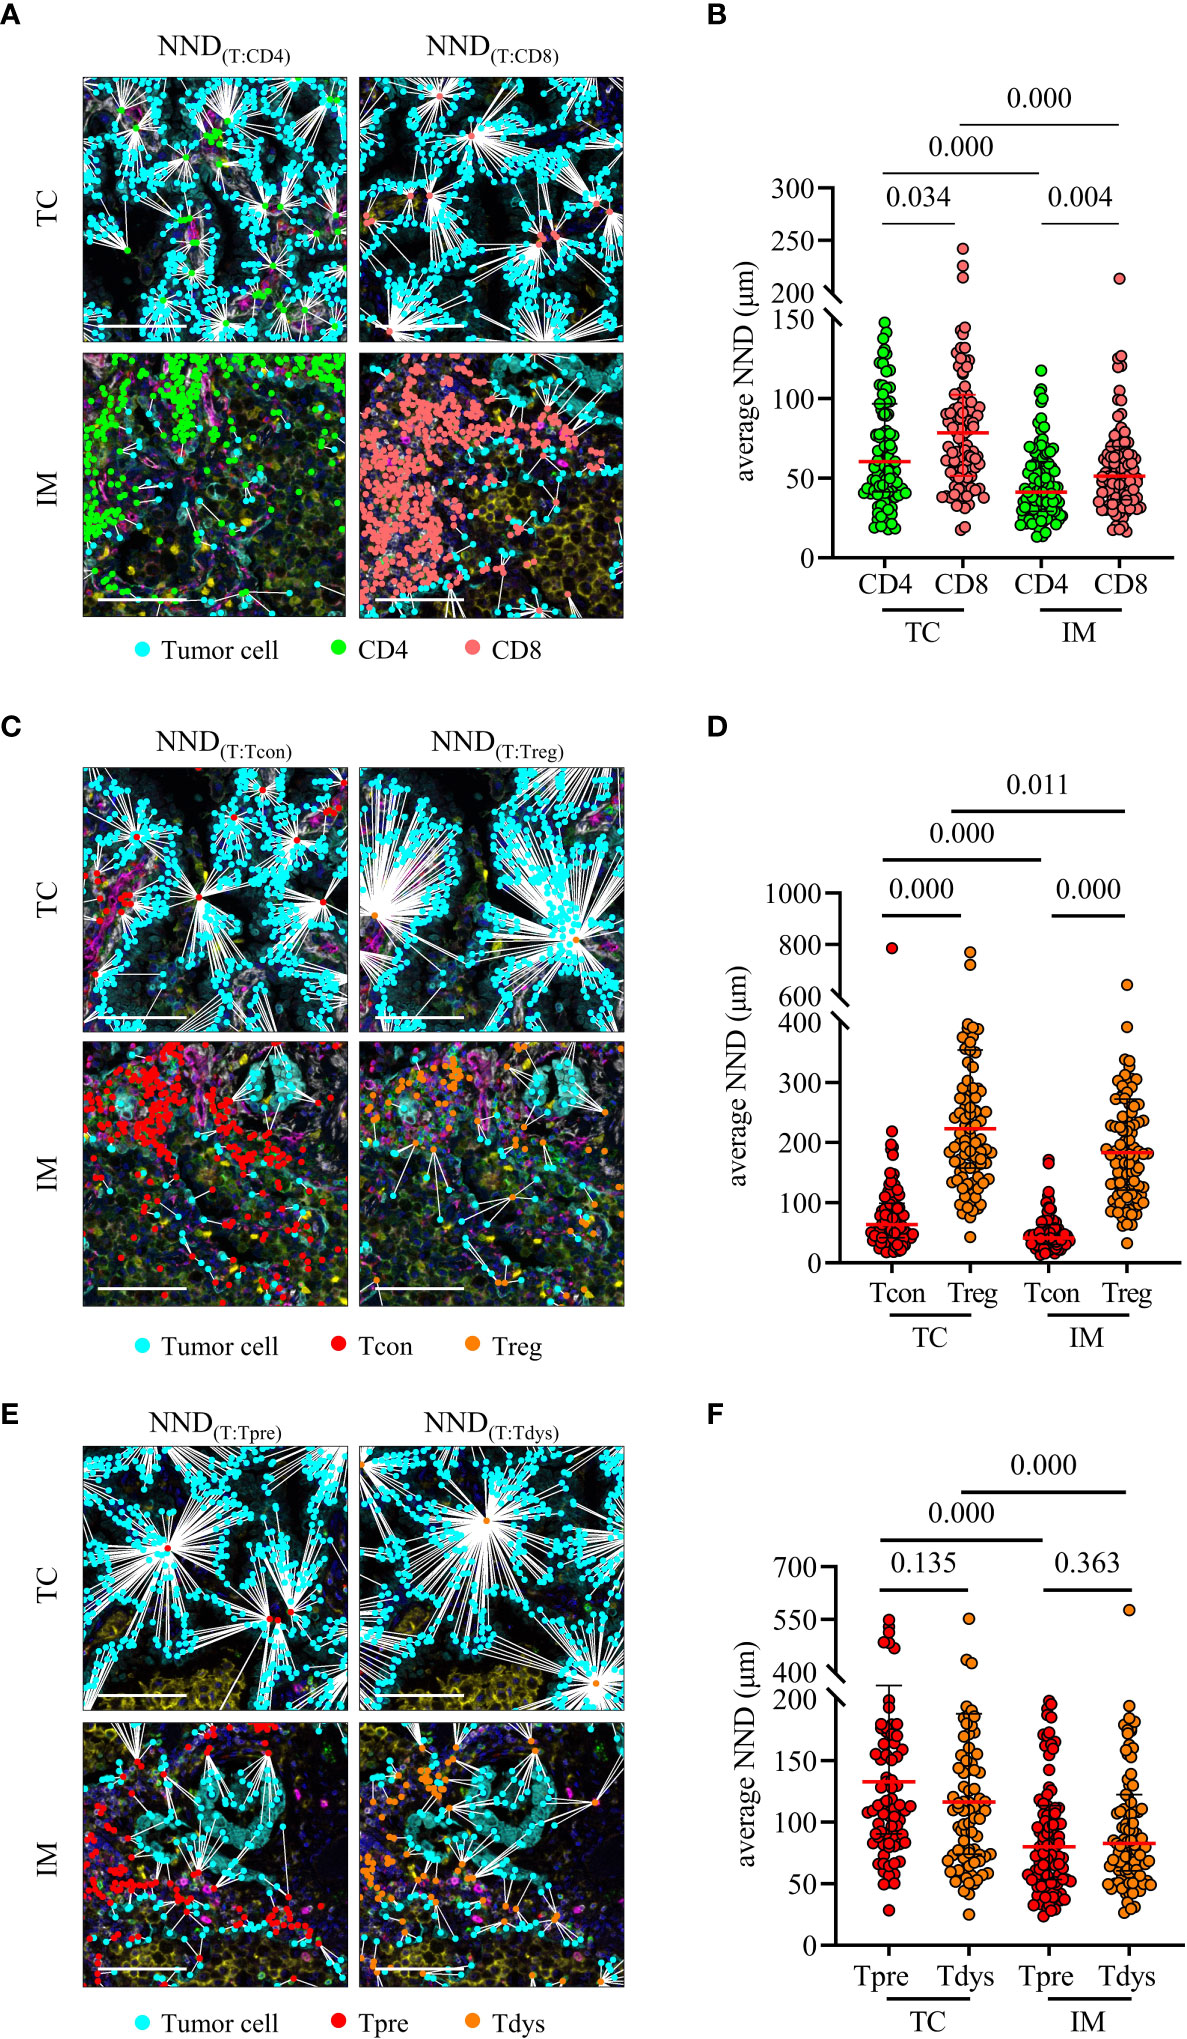
Figure 4 Nearest neighbor distance (NND) analysis of T cells to tumor cells. (A, B) NND was calculated from each tumor cell to their nearest CD4 or CD8 (left) and individual value plot of the average NND (right). (C, D) NND was calculated from each tumor cell to their nearest CD4+ Tcon or CD4+ Treg (left) and individual value plot of the average NND (right). (E, F) NND was calculated from each tumor cell to their nearest CD8+ Tpre or CD8+ Tdys (left) and individual value plot of the average NND (right). Scale bar, 50 μm. P values were calculated with the Mann-Whitney test, and all data are presented as the median and interquartile ranges.
Proximity was defined as the number of tumor cells with at least one T cell within a 30 μm radius (Figure 5A). High proximity means that frequent interactions are likely to occur. The log-rank test showed that the distance between CD4+/CD8+ T cells and tumor cells were not related to RFS (Supplementary Figures S3A–D). Interestingly, the proximity of TC-CD4+ Tcon or IM-CD4+ Treg to tumor cells increased and RFS was significantly shortened (Supplementary Figure S3E and Figure 5B). Multivariate Cox regression analysis showed that only high IM-CD4+ Treg proximity was associated with worse RFS (P = 0.012, HR = 2.884, 95%CI = 1.258-6.615; median RFS, 14.6 vs 45.0 months, P = 0.005) (Table 2 and Figure 5C). In brief, in IM, frequent proximity of CD4+ Treg to tumor cells promoted the recurrence of locally advanced NSCLC patients.
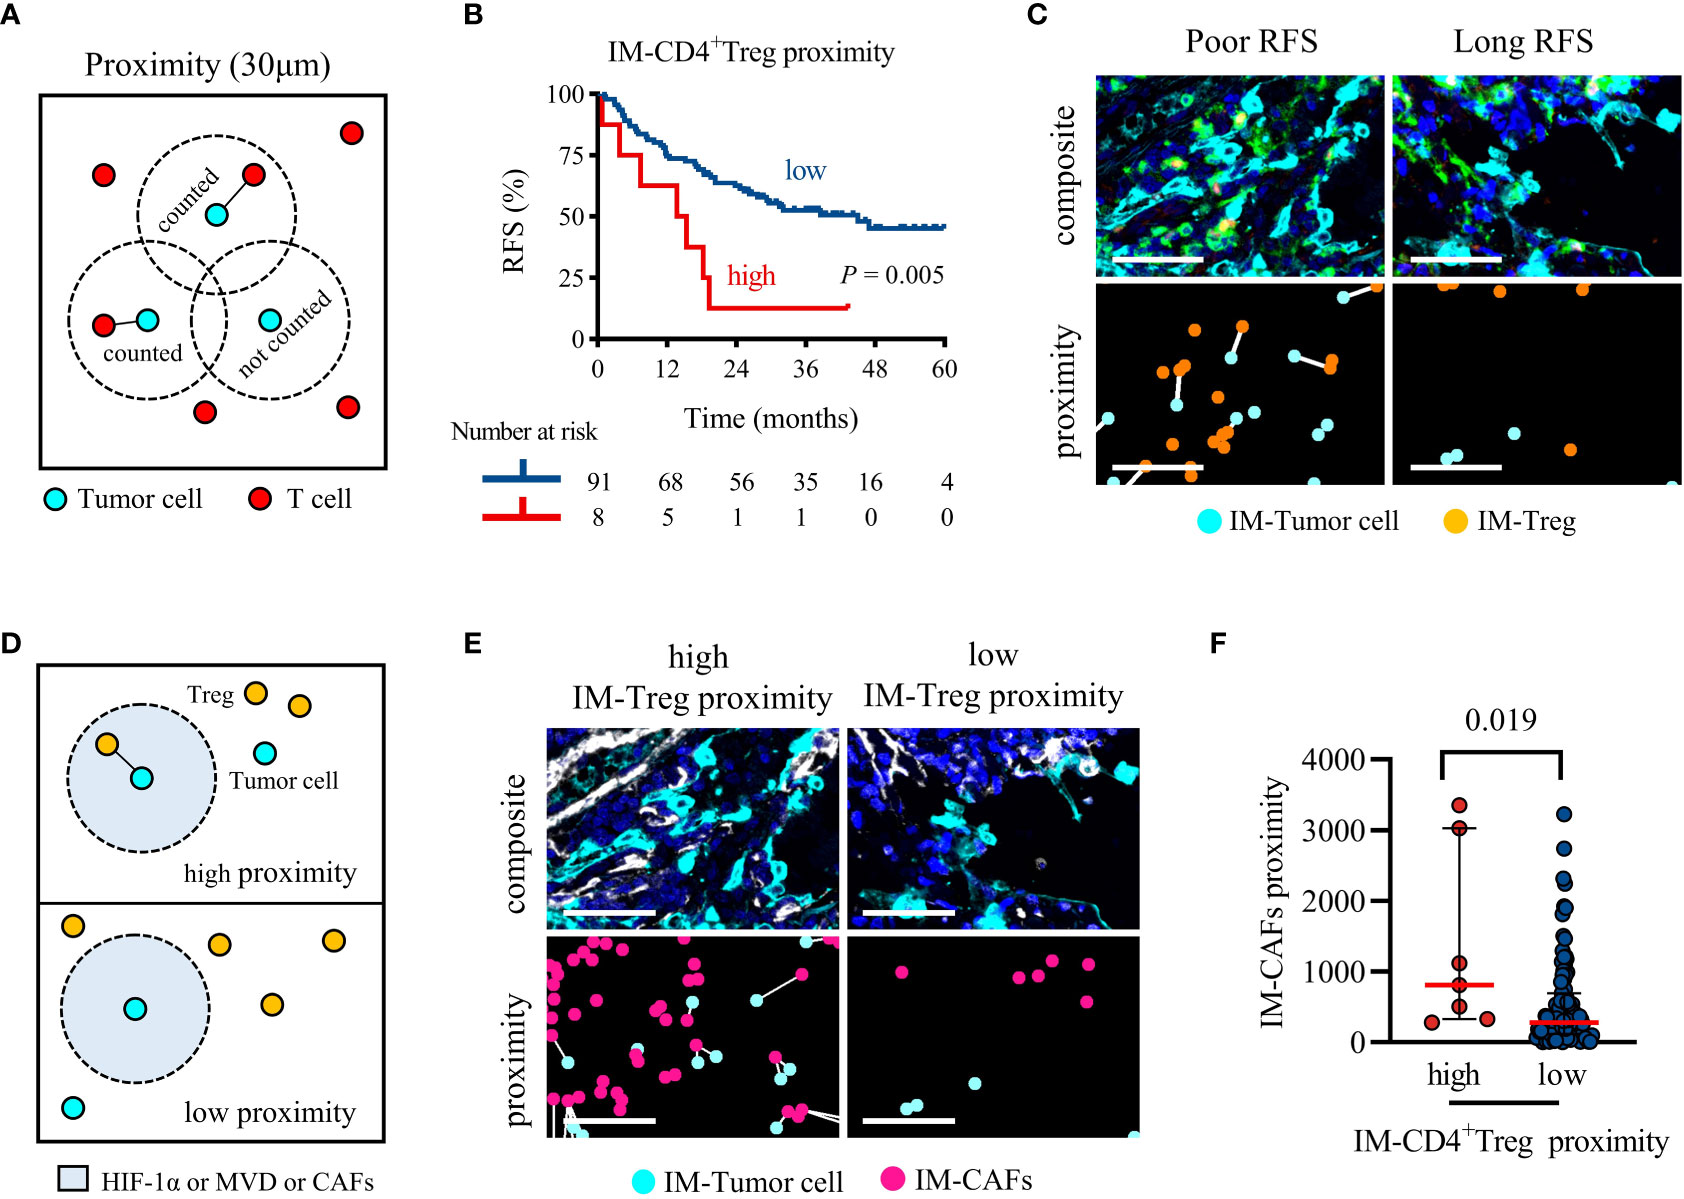
Figure 5 Higher IM-CD4+ Treg proximity to tumor cells was associated with significantly shorter RFS, and CAFs recruit CD4+ Treg infiltration. (A) Schematic diagram of proximity, the black line represents the interaction between tumor cells and T cells. (B) Kaplan-Meier survival analyses of the IM-CD4+Treg proximity. P-values reflect comparisons of two groups by univariate analysis, using the log-rank test. (C) Representative image for poor RFS (left) and long RFS (right). Pseudocolor illustrating Pan-CK (cyan), CD4 (green), FoxP3 (orange), and DAPI (blue) staining (composite image). The white line indicates that tumor cells and Treg are within 30 μm of each other (proximity image). Scale bar, 50 μm. (D) Schematic representing the parameters analyzed in (E, F). (E, F) The proximity of CAFs within 30 μm of cancer cells for each patient separated by cancer cells high or low adjacent CD4+ Treg. Pseudocolor illustrating Pan-CK (cyan), α-SMA (white), and DAPI (blue) staining (composite image). The white line indicates that tumor cells and CAFs are within 30 μm of each other (proximity image). Scale bar, 50 μm. P values were calculated with the Mann-Whitney test, and all data are presented as the median and interquartile ranges.
As shown in Figure 5D, we analyzed the differences in the infiltration of HIF-1α, MVD, and CAFs between high and low IM-CD4+ Treg proximity patients. HIF-1α and MVD were not increased in the high IM-CD4+ Treg proximity patients (median, high vs low; MVD, 758 vs 574, P = 0.071; HIF-1α, 711 vs 346, P = 0.071). However, CAFs infiltration was increased (810 vs 277, P = 0.019) (Figures 5E, F). These results suggested that CAFs may bring CD4+ Treg closer to tumor cells in the IM region.
In this study, we comprehensively analyzed the tumor immune microenvironment of TC and IM using TMA and mIF. Our results showed that the distribution of T cells was heterogeneous in the locally advanced TME and the IM region was more immunosuppressed and has a poorer antitumor immune response than the TC region.
T lymphocytes were distributed differently in the TME (7, 25, 26). Therefore, we constructed TC and IM tissue microarrays. To provide satisfactory specimens, two regions of TC and IM of each patient sample were selected to construct the TMA, and the maximum value was used for analysis (28). Our results validated that the density of T cells in IM is higher than that in TC, and we also found that T cells were closer to tumor cells in the IM (7).
Previous studies have shown that the relationship between CD4+ and CD8+ T cells and RFS was controversial in NSCLC (7, 9, 18, 38). However, when we distinguished the functional status of CD4+ and CD8+ T cells, only the increased IM-CD8+ Tdys density was associated with relapse, further demonstrating the important prognostic value of functional T cell subsets in the IM region. Interestingly, we also found that HIF-1α+ CD8 were positively correlated with CD8+ Tdys. It has been suggested that hypoxia may promote the exhaustion of CD8 (39). In this study, although we did not find a direct correlation between HIF-1α and CD8+ Tdys, our results suggested that HIF-1α+ CD8 may promote the exhaustion of CD8. Targeting hypoxia may reduce the presence of CD8+ Tdys, thereby sensitizing clinical therapy, the future is worth exploring.
The distance between tumor cells and immune cells might directly reflect the lethality of immune cells toward tumors or, in contrast, the editing of immune cells by tumor cells (35, 40). To the best of our knowledge, no similar studies have been conducted. Our results showed that CD4+ and CD8+ T cells and their respective subsets were closer to the tumor cells in the IM region. Although the density of IM-CD8+ Tdys promoted relapse, the proximity of IM-CD8+ Tdys to tumor cells was not associated with recurrence. These results suggested that IM-CD8+ Tdys may not interact directly with tumor cells. Notably, we found that the high proximity of IM-CD4+ Treg to tumor cells increased the risk of recurrence. A previous study showed that the high proximity of TC-CD4+ Treg to tumor cells significantly reduced the OS of lung cancer patients (19). Our study found that it remains important at the invasive margin. Interestingly, CAFs significantly increased in high proximity IM-CD4+ Treg patients. A preclinical study on esophageal cancer showed that CAFs may block the infiltration of CD8+ T cells and increase the infiltration of CD4+ Treg through IL-6, and targeting CAFs can improve the existing tumor immunity and enhance the efficacy of conventional immunotherapy (41). Although no relevant preclinical studies have confirmed the effect of CAFs on the proximity of CD4+ Treg to tumor cells in locally advanced NSCLC, our study provided a new direction for targeting CAFs to improve the immunosuppressive microenvironment.
Our study has the following limitations. First, the effective markers of CD8 subsets were not fixed. Future studies in combination with other emerging markers may further reveal the importance of CD8 functional states in NSCLC. Second, our study focused only on CD4+ and CD8+ T cells, excluding myeloid and other immune cell types. It is necessary to evaluate the importance of other cell types in the NSCLC microenvironment in future studies. In addition, we only found a correlation between HIF-1α, CAFs, and T cells infiltration at the tissue level, which requires further exploration.
In summary, our study highlights the importance of functional status and spatial interaction of T cell subsets, especially in the IM region. Assessment of the density of CD8+ Tdys and the proximity of CD4+ Treg to tumor cells helped to stratify patients. Targeting HIF-1α and CAFs may provide new treatment strategies for locally advanced NSCLC.
The raw data supporting the conclusions of this article will be made available by the authors, without undue reservation.
This study was approved by the Ethics Review Committee of Shandong Cancer Hospital and complied with the provisions of the Declaration of Helsinki. This study was a retrospective analysis and informed consent was not required.
LY, LX and XS contributed to conception and design of the study. LY, WZ, JS, GY, SC and FS organized the database. LY, WZ, JS, GY and SC performed the statistical analysis. LY wrote the first draft of the manuscript. LX and XS wrote sections of the manuscript. All authors contributed to the article and approved the submitted version.
This work was supported by grants from the National Natural Science Foundation of China (Grant NO. 82172866), the Shandong Provincial Natural Science Foundation (Grant NO. ZR2021LZL005), the Shandong Provincial Natural Science Foundation (Grant NO. ZR2019LZL019) and the Department of Science and Technology of Shandong Province (Grant NO. 2021CXGC011102).
The authors declare that the research was conducted in the absence of any commercial or financial relationships that could be construed as a potential conflict of interest.
All claims expressed in this article are solely those of the authors and do not necessarily represent those of their affiliated organizations, or those of the publisher, the editors and the reviewers. Any product that may be evaluated in this article, or claim that may be made by its manufacturer, is not guaranteed or endorsed by the publisher.
The Supplementary Material for this article can be found online at: https://www.frontiersin.org/articles/10.3389/fimmu.2022.1022638/full#supplementary-material
1. Miller BC, Sen DR, Al Abosy R, Bi K, Virkud YV, LaFleur MW, et al. Subsets of exhausted CD8+ T cells differentially mediate tumor control and respond to checkpoint blockade. Nat Immunol (2019) 20:326–36. doi: 10.1038/s41590-019-0312-6
2. Murciano-Goroff YR, Warner AB, Wolchok JD. The future of cancer immunotherapy: Microenvironment-targeting combinations. Cell Res (2020) 30:507–19. doi: 10.1038/s41422-020-0337-2
3. O’Donnell JS, Teng MWL, Smyth MJ. Cancer immunoediting and resistance to T cell-based immunotherapy. Nat Rev Clin Oncol (2019) 16:151–67. doi: 10.1038/s41571-018-0142-8
4. Yan X, Jiao S-C, Zhang G-Q, Guan Y, Wang J-L. Tumor-associated immune factors are associated with recurrence and metastasis in non-small cell lung cancer. Cancer Gene Ther (2017) 24:57–63. doi: 10.1038/cgt.2016.40
5. Chen L, Cao M, Zhang X, Dang W, Xiao J, Liu Q, et al. The landscape of immune microenvironment in lung adenocarcinoma and squamous cell carcinoma based on PD-L1 expression and tumor-infiltrating lymphocytes. Cancer Med (2019) 8:7207–18. doi: 10.1002/cam4.2580
6. Edlund K, Madjar K, Mattsson JSM, Djureinovic D, Lindskog C, Brunnström H, et al. Prognostic impact of tumor cell programmed death ligand 1 expression and immune cell infiltration in NSCLC. J Thorac Oncol (2019) 14:628–40. doi: 10.1016/j.jtho.2018.12.022
7. Bocchialini G, Lagrasta C, Madeddu D, Mazzaschi G, Marturano D, Sogni F, et al. Spatial architecture of tumour-infiltrating lymphocytes as a prognostic parameter in resected non-small-cell lung cancer. Eur J Cardiothorac Surg (2020) 58:619–28. doi: 10.1093/ejcts/ezaa098
8. Munari E, Marconi M, Querzoli G, Lunardi G, Bertoglio P, Ciompi F, et al. Impact of PD-L1 and PD-1 expression on the prognostic significance of CD8+ tumor-infiltrating lymphocytes in non-small cell lung cancer. Front Immunol (2021) 12:680973. doi: 10.3389/fimmu.2021.680973
9. Schulze AB, Evers G, Görlich D, Mohr M, Marra A, Hillejan L, et al. Tumor infiltrating T cells influence prognosis in stage I–III non-small cell lung cancer. J Thorac Dis (2020) 12:1824–42. doi: 10.21037/jtd-19-3414a
10. Jackute J, Zemaitis M, Pranys D, Sitkauskiene B, Miliauskas S, Bajoriunas V, et al. The prognostic influence of tumor infiltrating Foxp3+CD4+, CD4+ and CD8+ T cells in resected non-small cell lung cancer. J Inflammation (2015) 12:63. doi: 10.1186/s12950-015-0108-x
11. Parra ER, Behrens C, Rodriguez-Canales J, Lin H, Mino B, Blando J, et al. Image analysis-based assessment of PD-L1 and tumor-associated immune cells density supports distinct intratumoral microenvironment groups in non-small cell lung carcinoma patients. Clin Cancer Res (2016) 22:6278–89. doi: 10.1158/1078-0432.CCR-15-2443
12. Frafjord A, Buer L, Hammarström C, Aamodt H, Woldbæk PR, Brustugun OT, et al. The immune landscape of human primary lung tumors is Th2 skewed. Front Immunol (2021) 12:764596. doi: 10.3389/fimmu.2021.764596
13. Su D, Wu G, Xiong R, Sun X, Xu M, Mei Y, et al. Tumor immune microenvironment characteristics and their prognostic value in non-Small-Cell lung cancer. Front Oncol (2021) 11:634059. doi: 10.3389/fonc.2021.634059
14. Peng H, Wu X, Zhong R, Yu T, Cai X, Liu J, et al. Profiling tumor immune microenvironment of non-small cell lung cancer using multiplex immunofluorescence. Front Immunol (2021) 12:750046. doi: 10.3389/fimmu.2021.750046
15. van der Leun AM, Thommen DS, Schumacher TN. CD8+ T cell states in human cancer: Insights from single-cell analysis. Nat Rev Cancer (2020) 20:218–32. doi: 10.1038/s41568-019-0235-4
16. Clarke J, Panwar B, Madrigal A, Singh D, Gujar R, Wood O, et al. Single-cell transcriptomic analysis of tissue-resident memory T cells in human lung cancer. J Exp Med (2019) 216:2128–49. doi: 10.1084/jem.20190249
17. Guo X, Zhang Y, Zheng L, Zheng C, Song J, Zhang Q, et al. Global characterization of T cells in non-small-cell lung cancer by single-cell sequencing. Nat Med (2018) 24:978–85. doi: 10.1038/s41591-018-0045-3
18. Kinoshita T, Muramatsu R, Fujita T, Nagumo H, Sakurai T, Noji S, et al. Prognostic value of tumor-infiltrating lymphocytes differs depending on histological type and smoking habit in completely resected non-small-cell lung cancer. Ann Oncol (2016) 27:2117–23. doi: 10.1093/annonc/mdw319
19. Barua S, Fang P, Sharma A, Fujimoto J, Wistuba I, Rao AUK, et al. Spatial interaction of tumor cells and regulatory T cells correlates with survival in non-small cell lung cancer. Lung Cancer (2018) 117:73–9. doi: 10.1016/j.lungcan.2018.01.022
20. Wang Q, Zhou D, Wu F, Liang Q, He Q, Peng M, et al. Immune microenvironment signatures as biomarkers to predict early recurrence of stage ia-b lung cancer. Front Oncol (2021) 11:680287. doi: 10.3389/fonc.2021.680287
21. Parra ER, Uraoka N, Jiang M, Cook P, Gibbons D, Forget M-A, et al. Validation of multiplex immunofluorescence panels using multispectral microscopy for immune-profiling of formalin-fixed and paraffin-embedded human tumor tissues. Sci Rep (2017) 7:1–11. doi: 10.1038/s41598-017-13942-8
22. Tan WCC, Nerurkar SN, Cai HY, Ng HHM, Wu D, Wee YTF, et al. Overview of multiplex immunohistochemistry/immunofluorescence techniques in the era of cancer immunotherapy. Cancer Commun (2020) 40:135–53. doi: 10.1002/cac2.12023
23. Ye C-H, Peng G-R, Hu SY, Yu W-C, Theng P, Yi YK, et al. Establishment of multiplex IHC staining panel and immune subpopulation quantificationsystem for cancer prognosis. J Clin Oncol (2022) 40:e20525–5. doi: 10.1200/JCO.2022.40.16_suppl.e20525
24. Zheng X, Weigert A, Reu S, Guenther S, Mansouri S, Bassaly B, et al. Spatial density and distribution of tumor-associated macrophages predict survival in non–small cell lung carcinoma. Cancer Res (2020) 80:4414–25. doi: 10.1158/0008-5472.CAN-20-0069
25. Pøhl M, Olsen KE, Holst R, Ditzel HJ, Hansen O. Tissue microarrays in non–Small-Cell lung cancer: Reliability of immunohistochemically-determined biomarkers. Clin Lung Cancer (2014) 15:222–230.e3. doi: 10.1016/j.cllc.2013.09.004
26. Fridman WH, Pagès F, Sautès-Fridman C, Galon J. The immune contexture in human tumours: impact on clinical outcome. Nat Rev Cancer (2012) 12:298–306. doi: 10.1038/nrc3245
27. Donnem T, Hald SM, Paulsen E-E, Richardsen E, Al-Saad S, Kilvaer TK, et al. Stromal CD8+ T-cell density–a promising supplement to TNM staging in non–small cell lung cancer. Clin Cancer Res (2015) 21:2635–43. doi: 10.1158/1078-0432.CCR-14-1905
28. Schalper KA, Brown J, Carvajal-Hausdorf D, McLaughlin J, Velcheti V, Syrigos KN, et al. Objective measurement and clinical significance of TILs in non–small cell lung cancer. J Natl Cancer Inst (2015) 107:dju435. doi: 10.1093/jnci/dju435
29. Mlecnik B, Bindea G, Kirilovsky A, Angell HK, Obenauf AC, Tosolini M, et al. The tumor microenvironment and immunoscore are critical determinants of dissemination to distant metastasis. Sci Transl Med (2016) 8:327ra26. doi: 10.1126/scitranslmed.aad6352
30. Forde PM, Chaft JE, Smith KN, Anagnostou V, Cottrell TR, Hellmann MD, et al. Neoadjuvant PD-1 blockade in resectable lung cancer. N Engl J Med (2018) 378:1976–86. doi: 10.1056/NEJMoa1716078
31. Väyrynen SA, Zhang J, Yuan C, Väyrynen JP, Dias Costa A, Williams H, et al. Composition, spatial characteristics, and prognostic significance of myeloid cell infiltration in pancreatic cancer. Clin Cancer Res (2021) 27:1069–81. doi: 10.1158/1078-0432.CCR-20-3141
32. Roussel H, De Guillebon E, Biard L, Mandavit M, Gibault L, Fabre E, et al. Composite biomarkers defined by multiparametric immunofluorescence analysis identify ALK-positive adenocarcinoma as a potential target for immunotherapy. OncoImmunology (2017) 6:e1286437. doi: 10.1080/2162402X.2017.1286437
33. Taube JM, Roman K, Engle EL, Wang C, Ballesteros-Merino C, Jensen SM, et al. Multi-institutional TSA-amplified multiplexed immunofluorescence reproducibility evaluation (MITRE) study. J Immunother Cancer (2021) 9:e002197. doi: 10.1136/jitc-2020-002197
34. Inoue C, Miki Y, Saito R, Hata S, Abe J, Sato I, et al. PD-L1 induction by cancer-associated fibroblast-derived factors in lung adenocarcinoma cells. Cancers (2019) 11:1257. doi: 10.3390/cancers11091257
35. Tsakiroglou AM, Fergie M, Oguejiofor K, Linton K, Thomson D, Stern PL, et al. Spatial proximity between T and PD-L1 expressing cells as a prognostic biomarker for oropharyngeal squamous cell carcinoma. Br J Cancer (2020) 122:539–44. doi: 10.1038/s41416-019-0634-z
36. Carstens JL, Correa de Sampaio P, Yang D, Barua S, Wang H, Rao A, et al. Spatial computation of intratumoral T cells correlates with survival of patients with pancreatic cancer. Nat Commun (2017) 8:15095. doi: 10.1038/ncomms15095
37. Liikanen I, Lauhan C, Quon S, Omilusik K, Phan AT, Bartrolí LB, et al. Hypoxia-inducible factor activity promotes antitumor effector function and tissue residency by CD8+ T cells. J Clin Invest (2021) 131:e143729. doi: 10.1172/JCI143729
38. Sun D, Zhao M, Xia M, Li L, Jiang Y. The correlation between tumor-infiltrating Foxp3+ regulatory T cells and cyclooxygenase-2 expression and their association with recurrence in resected head and neck cancers. Med Oncol (2012) 29:707–13. doi: 10.1007/s12032-011-9903-2
39. Bannoud N, Dalotto-Moreno T, Kindgard L, García PA, Blidner AG, Mariño KV, et al. Hypoxia supports differentiation of terminally exhausted CD8 T cells. Front Immunol (2021) 12:660944. doi: 10.3389/fimmu.2021.660944
40. Gide TN, Silva IP, Quek C, Ahmed T, Menzies AM, Carlino MS, et al. Close proximity of immune and tumor cells underlies response to anti-PD-1 based therapies in metastatic melanoma patients. OncoImmunology (2020) 9:1659093. doi: 10.1080/2162402X.2019.1659093
Keywords: CD4, CD8, functional status, spatial interaction, prognostic, lung cancer
Citation: Yang L, Zhang W, Sun J, Yang G, Cai S, Sun F, Xing L and Sun X (2023) Functional status and spatial interaction of T cell subsets driven by specific tumor microenvironment correlate with recurrence of non-small cell lung cancer. Front. Immunol. 13:1022638. doi: 10.3389/fimmu.2022.1022638
Received: 18 August 2022; Accepted: 09 December 2022;
Published: 04 January 2023.
Edited by:
Simona Kranjc Brezar, Institute of Oncology Ljubljana, SloveniaReviewed by:
Bálint Tamaskovics, Heinrich Heine University of Düsseldorf, GermanyCopyright © 2023 Yang, Zhang, Sun, Yang, Cai, Sun, Xing and Sun. This is an open-access article distributed under the terms of the Creative Commons Attribution License (CC BY). The use, distribution or reproduction in other forums is permitted, provided the original author(s) and the copyright owner(s) are credited and that the original publication in this journal is cited, in accordance with accepted academic practice. No use, distribution or reproduction is permitted which does not comply with these terms.
*Correspondence: Xiaorong Sun, MjUxNDAwMDY3QHFxLmNvbQ==
Disclaimer: All claims expressed in this article are solely those of the authors and do not necessarily represent those of their affiliated organizations, or those of the publisher, the editors and the reviewers. Any product that may be evaluated in this article or claim that may be made by its manufacturer is not guaranteed or endorsed by the publisher.
Research integrity at Frontiers
Learn more about the work of our research integrity team to safeguard the quality of each article we publish.