
95% of researchers rate our articles as excellent or good
Learn more about the work of our research integrity team to safeguard the quality of each article we publish.
Find out more
ORIGINAL RESEARCH article
Front. Immunol. , 15 September 2022
Sec. Cancer Immunity and Immunotherapy
Volume 13 - 2022 | https://doi.org/10.3389/fimmu.2022.1014861
This article is part of the Research Topic Novel Biomarkers for Predicting Response to Cancer Immunotherapy View all 69 articles
 Jianqiu Kong1†
 Sihong Lu1†Long Zhang2Yuhui Yao1Jie Zhang1
 Zefeng Shen1
 Mingli Luo1
 Bin Liu3*
 Junjiong Zheng1*
 Tianxin Lin1,4,5*
Purpose: Immune checkpoint blockade agents were shown to provide a survival advantage in urothelial carcinoma, while some patients got minimal benefit or side effects. Therefore, we aimed to investigate the prognostic value of m6A methylation regulators, and developed a nomogram for predicting the response to atezolizumab in urothelial carcinoma patients.
Methods: A total of 298 advanced urothelial carcinoma patients with response data in the IMvigor210 cohort were included. Differential expressions of 23 m6A methylation regulators in different treatment outcomes were conducted. Subsequently, a gene signature was developed in the training set using the least absolute shrinkage and selection operator (LASSO) regression. Based on the multivariable logistic regression, a nomogram was constructed by incorporating the gene signature and independent clinicopathological predictors. The performance of the nomogram was assessed by its discrimination, calibration, and clinical utility with internal validation.
Results: Six m6A methylation regulators, including IGF2BP1, IGF2BP3, YTHDF2, HNRNPA2B1, FMR1, and FTO, were significantly differentially expressed between the responders and non-responders. These six regulators were also significantly correlated with the treatment outcomes. Based on the LASSO regression analysis, the gene signature consisting of two selected m6A methylation regulators (FMR1 and HNRNPA2B1) was constructed and showed favorable discrimination. The nomogram integrating the gene signature, TMB, and PD-L1 expression on immune cells, showed favorable calibration and discrimination in the training set (AUC 0.768), which was confirmed in the validation set (AUC 0.755). Decision curve analysis confirmed the potential clinical usefulness of the nomogram.
Conclusions: This study confirmed the prognostic value of FMR1 and HNRNPA2B1, and constructed a nomogram for individualized prediction of the response to atezolizumab in patients with urothelial carcinoma, which may aid in making treatment strategies.
Urothelial carcinoma is one of the most common cancers worldwide (1), and the bladder is the usual site of occurrence (2). Due to the high recurrence rate and complicated therapeutic strategies, bladder cancer (BCa) is considered the most expensive tumor, which has brought a heavy economic burden to patients and society (3). Notably, a considerable proportion of urothelial carcinoma patients develop metastases during follow-up after radical therapies. The prognosis for advanced urothelial carcinoma remains poor (4). Emerging immunotherapy heralds a new era for the treatment of urothelial carcinoma. For the past few years, immunotherapy for malignant tumors has achieved many encouraging breakthroughs, making it the fourth treatment technique for cancer therapy after the operation, radiation therapy, and chemotherapy (5).
Currently, blockade of immune checkpoint molecule, programmed cell death 1 (PD1), or its ligand, PD ligand 1 (PDL1), was shown to provide a survival advantage in numbers of different advanced malignancies (6, 7). Effective as it is, only a subset of patients experienced durable responses and long-term survival after anti-PD1/PDL1 therapy, and the majority of patients achieved minimal or no clinical benefit (8). For example, the effective response rate for BCa is approximately 20% (9). Meanwhile, immunotherapy may cause adverse effects, and some may even lead to serious or life-threatening consequences (10, 11). Therefore, the optimization of individualized treatment has been listed as one of the top ten challenges of immunotherapy for tumors (12). How to identify the patients who are prone to have a good response to anti-PD1/PDL1 therapy is the current focus of intense research efforts. Many biomarkers have been reported to be predictive of cancer response to immunotherapy. The immunity system extends from systems-level principles of immune cell connectivity down to mechanistic characterization of individual receptors, which could provide potential opportunities for therapeutic intervention (13). Of these, tumor mutational burden (TMB) quantifying the number of somatic mutations in the tumor, CD8+ T-cell abundance, and PDL1 expression are commonly used predictors (9, 14, 15). However, their predictive efficacy may vary in specific cancer types (9, 12).
N6-methyladenosine (m6A) modification represents one of the most common chemical modifications in eukaryotic mRNA, which is a reversible process regulated by the balanced activities of methyltransferases, binding proteins, and demethylases, also known as “writers”, “readers” and “erasers” (16). Studies have demonstrated that m6A plays an important role in mRNA splicing, localization, translation, export, degradation, and stability (17–19). In addition, substantial evidence showed that dysregulated expression and genetic changes of m6A methylation regulators were associated with multiple biological disorders including dysregulated cell proliferation, differentiation and death, developmental defects, cancer progression, damaged self-renewal capacity, and aberrant immune regulation (20–22). Moreover, m6A methylation regulators also played critical roles in the development and progression of BCa by promoting cancer cell proliferation, self-renewal of cancer stem cells and so on (23–25). Besides, m6A regulators were reported to serve as reliable biomarkers to predict the treatment response and/or prognosis in BCa (26) as well as other tumors (27–29). Nonetheless, whether m6A regulators could aid in the prediction of immunotherapy response in urothelial carcinoma remains unknown.
In the present study, we systematically analyzed the association between the expression of 23 widely reported m6A regulators and the anti-PDL1 treatment (i.e., atezolizumab) response in advanced urothelial carcinoma patients. And we developed and validated a nomogram that integrated a gene signature derived from pre-treatment expression of m6A regulators and clinical variables for individualized prediction of the response to atezolizumab treatment in patients with urothelial carcinoma.
Under the Creative Commons 3.0 license, standardized RNA-sequencing data and corresponding clinicopathological data, including TMB, PD-L1 expression on immune cells (IC), and tumor cells (TC), for the IMvigor210 cohort were extracted from the IMvigor210CoreBiologies R package (http://research-pub.gene.com/IMvigor210CoreBiologies/) developed by Mariathasan et al (30). Tumor specimens were scored via immunohistochemistry for PD-L1 expression on immune cells as IC0, IC1, IC2, or IC3 if <1%, ≥1% but <5%, ≥5% but <10%, or ≥10% of immune cells were PD-L1 positive, respectively. Besides, tumor tissue samples were scored as TC0, TC1, TC2, or TC3 if <1%, ≥1% but <5%, ≥5% but <50%, or ≥50% of tumor cells were PD-L1 positive, respectively. RNA-seq count data were transformed into Transcripts Per Million (TPM). Among 348 bladder cancer patients in the IMvigor210 cohort, we excluded those patients without treatment response data. Therefore, a total of 298 patients were finally included in our study (Supplementary Table S1). A reduction of tumor volume over 10% is defined as partial response (RECIST v1.1). All patients were classified into responders (complete and partial response) and non-responders (stable and progressive disease).
To explore the role of m6A methylation regulators in atezolizumab treatment, their differential expressions in different treatment outcomes were analyzed in all enrolled patients. The expressions of m6A methylation regulators were compared between the response group and non-response group using Wilcoxon’s test. To further understand the interactions among 23 m6A regulators, their expression correlations were evaluated using the correlation plot and the Spearman correlation test.
Metascape (http://metascape.org) is an online analysis tool designed to provide a comprehensive gene list annotation and analysis resource for experimental biologists, including gene annotation, functional enrichment, and construction of protein-protein interaction networks (31). In this study, we used Metascape to conduct the pathway and process enrichment of the m6A methylation regulators.
The model construction flowchart of this study is presented in Supplementary Figure S1. All enrolled patients were randomly divided into two groups at a ratio of 7:3. As a result, 209 patients were allocated to the training set, whereas 89 patients were allocated to the independent validation set. In the training set, the univariable logistic regression analyses were used to measure the potential associations between 23 m6A regulators and the therapeutic outcomes. And the least absolute shrinkage and selection operator (LASSO) regression algorithm was performed to select treatment response-related genes with nonzero coefficients among 23 m6A regulators (32). An m6A-related gene signature was developed to evaluate the probability of treatment outcome for each patient using the gene score, which was calculated as a linear combination of the selected genes weighted by their respective coefficients. The discrimination of the gene signature was estimated by the area under the receiver operator characteristic (ROC) curve (AUC) in the training set and then validated in the validation set.
We used genes in the IMvigor210 dataset that were in the top 25% of variance from responders and non-responders to construct a weighted gene co-expression network analysis (WGCNA). Detailed descriptions regarding the WGCNA are shown in Supplementary Methods. To ensure the reliability of the WGCNA result, outlier samples that were distant from other samples were removed. An appropriate power cut-off threshold was selected to generate a scale-free topology overlap matric (TOM) and average linkage hierarchical clustering was used to detect gene modules. With the Dynamic Tree-Cut algorithm, gene modules were displayed as branched of dendrogram. The significance and correlation of module eigengenes of each gene module were generated. Then, we explored whether the module that most significantly correlated to treatment response contains m6A-related genes.
The CIBERSORT algorithm was utilized to estimate the infiltration of 22 types of immune cells in all samples (33). Furthermore, to further investigate the role of treatment outcome-related genes in atezolizumab therapy, the relationship of those m6A methylation regulators selected in the LASSO regression analysis with different types of immune cells were analyzed.
After univariable logistic regression analyses, the variables with P < 0.05 in the regression analyses were included in the following multivariable analysis in the training set. Backward stepwise selection using Akaike’s Information Criterion (AIC) was used to identify the significant predictors to develop the prediction model. A variance inflation factor (VIF) was calculated to assess the collinearity diagnostics of the multivariable logistic regression. According to the results of the multivariable logistic analysis, a nomogram was then constructed. A response score for each patient was calculated based on the multivariable logistic regression formula to reflect the probability of treatment response.
In the training set, the AUC was used to measure the discrimination performance of the nomogram. In addition, a calibration curve was performed to estimate the calibration of the nomogram, along with the Hosmer-Lemeshow test to assess the goodness-of-fit (34).
The performance of the nomogram was subsequently validated in the validation set. A response score can be calculated for each patient in the validation set by using the formula constructed in the training set. The AUC was then calculated, and the calibration curve and the Hosmer-Lemeshow test were conducted.
All patients were categorized into the predicted response or the predicted non-response groups according to their response scores, whose optimal cut-off point value was determined by the maximum Youden index in the training set (35). The log-rank test was performed to compare the Kaplan-Meier overall survival curves of the predicted response and the predicted non-response groups in the training and validation sets. Moreover, to determine the clinical usefulness of the nomogram, a decision curve analysis (DCA) was performed by calculating the net benefits for different threshold probabilities using the training and validation sets separately (36).
All statistical tests were conducted using R statistical software (version 4.0.4; R Foundation for Statistical Computing). R packages used in this study, detailed descriptions regarding the LASSO algorithm, and DCA are available in Supplementary Methods. A two-sided P-value < 0.05 was considered statistically significant.
Patient clinical characteristics in the training and validation sets are shown in Table 1. Totally, 22.8% (68/298) of patients achieved complete response/partial response after atezolizumab treatment. In addition, 189 patients (63.4%) were dead during the follow-up. The median follow-up was 10.3 months (Interquartile range, 4.4–18.8). No significant difference was found between the training and validation set regarding the clinical characteristics (Table 1).
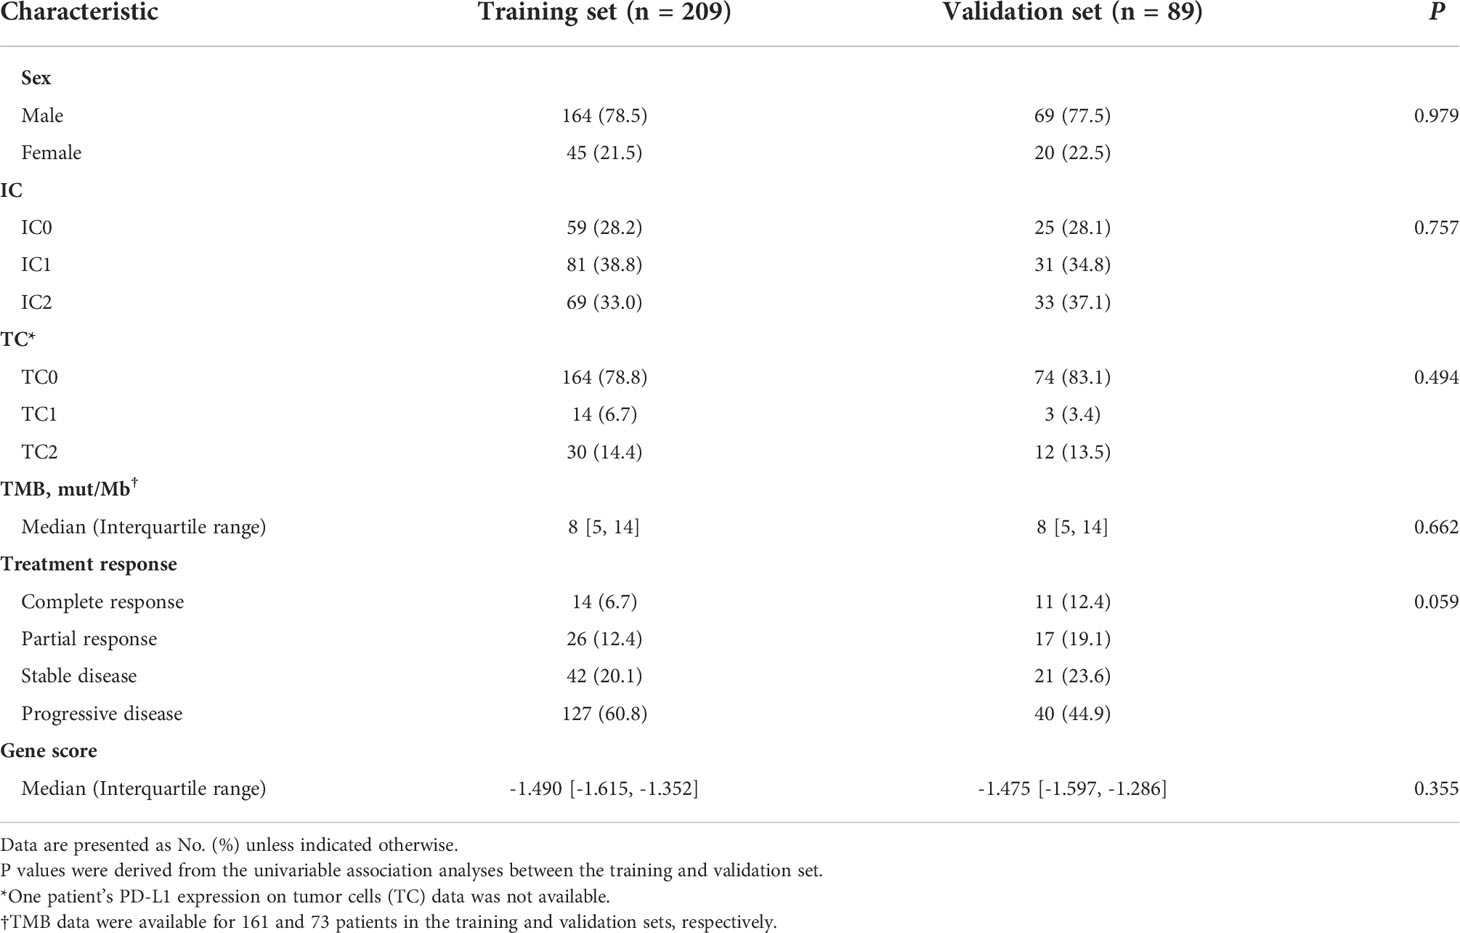
Table 1 Baseline characteristics of the patients.
Figures 1A, B show that six m6A methylation regulatory genes (IGF2BP1, IGF2BP3, YTHDF2, HNRNPA2B1, FMR1, and FTO) expressed differentially between the responders and non-responders. The expression levels of IGF2BP1, IGF2BP3, YTHDF2, HNRNPA2B1, and FMR1 were significantly higher in the response group, while expression levels of FTO were significantly decreased in the non-response group. Among them, a significant difference in expression between bladder cancer and normal tissue in the TCGA-BLCA cohort is only detected in IGF2BP3 (Supplementary Figure S2). The correlation heatmap indicated that FMR1, YTHDF3, CBLL1, ZC3H13, METTL14, YTHDC1, KIAA1429, and LRPPRC have a strong association with others (most r2>0.4; Figure 1C).
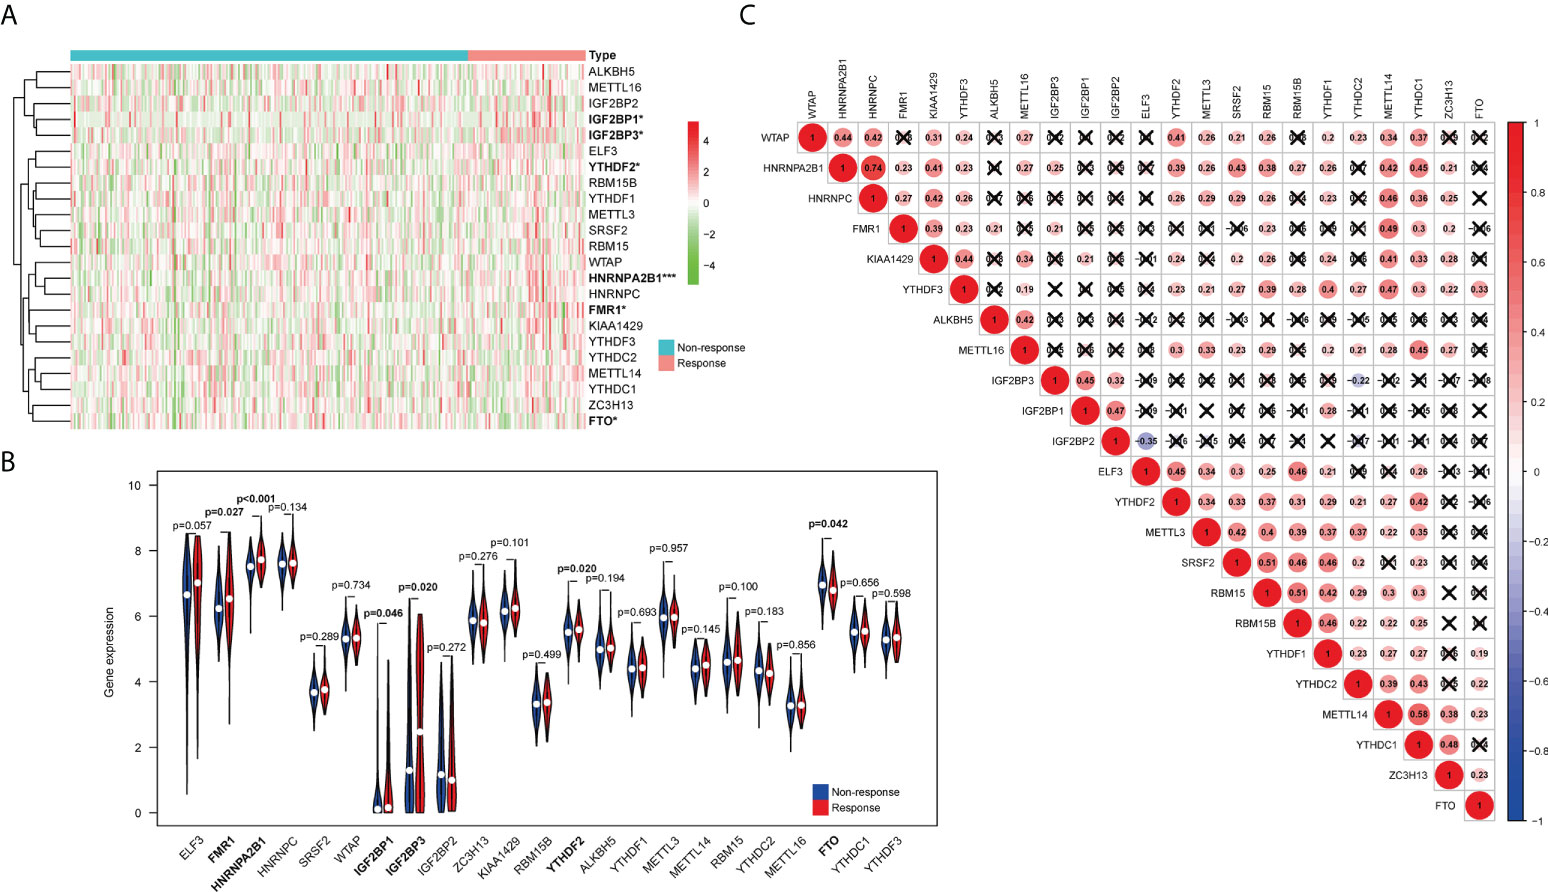
Figure 1 Relationship between the expression of m6A RNA methylation regulators and treatment response in urothelial carcinoma patients. (A) The heatmap shows the expression patterns of the 23 m6A methylation regulators between the response group and non-response group. (B) The violin plots exhibit the differential expression of the 23 m6A methylation regulators in the response group (red) and the non-response group (blue). (C) Spearman correlation analyses of the expression of the 23 m6A methylation regulators. *P < 0.05, ***P < 0.001.
Supplementary Figure S3 presents the results of the functional enrichment analysis obtained from Metascape. As shown in Supplementary Figure S3A, we found that several pathways were enriched, including regulation of mRNA metabolic process, regulation of mRNA stability, mRNA metabolic process, mRNA modification, regulation of mRNA process, mRNA transport, and negative regulation of mRNA metabolic process. The network of enriched terms can be found in Supplementary Figure S3B and Table S2. Supplementary Figures S3C, D presents the protein-protein interaction network and Molecular Complex Detection (MCODE) components. Five treatment response associated m6A regulators were found in the MCODE_1 component.
In the univariable logistic regression analysis, ELF3, FMR1, HNRNPA2B1, HNRNPC, IGF2BP3, and KIAA1429 were associated with the therapeutic outcomes in the training set (Figure 2A). Additionally, using the LASSO regression analysis, two treatment outcome-related genes (FMR1 and HNRNPA2B1) with nonzero coefficients were selected in the training set (Figures 2B, C). Based on the LASSO logistic regression analysis, a gene signature was constructed, which can be calculated as a gene score for each patient: gene score = 0.000545 × FMR1 expression level + 0.004127 × HNRNPA2B1 expression level - 2.30373.
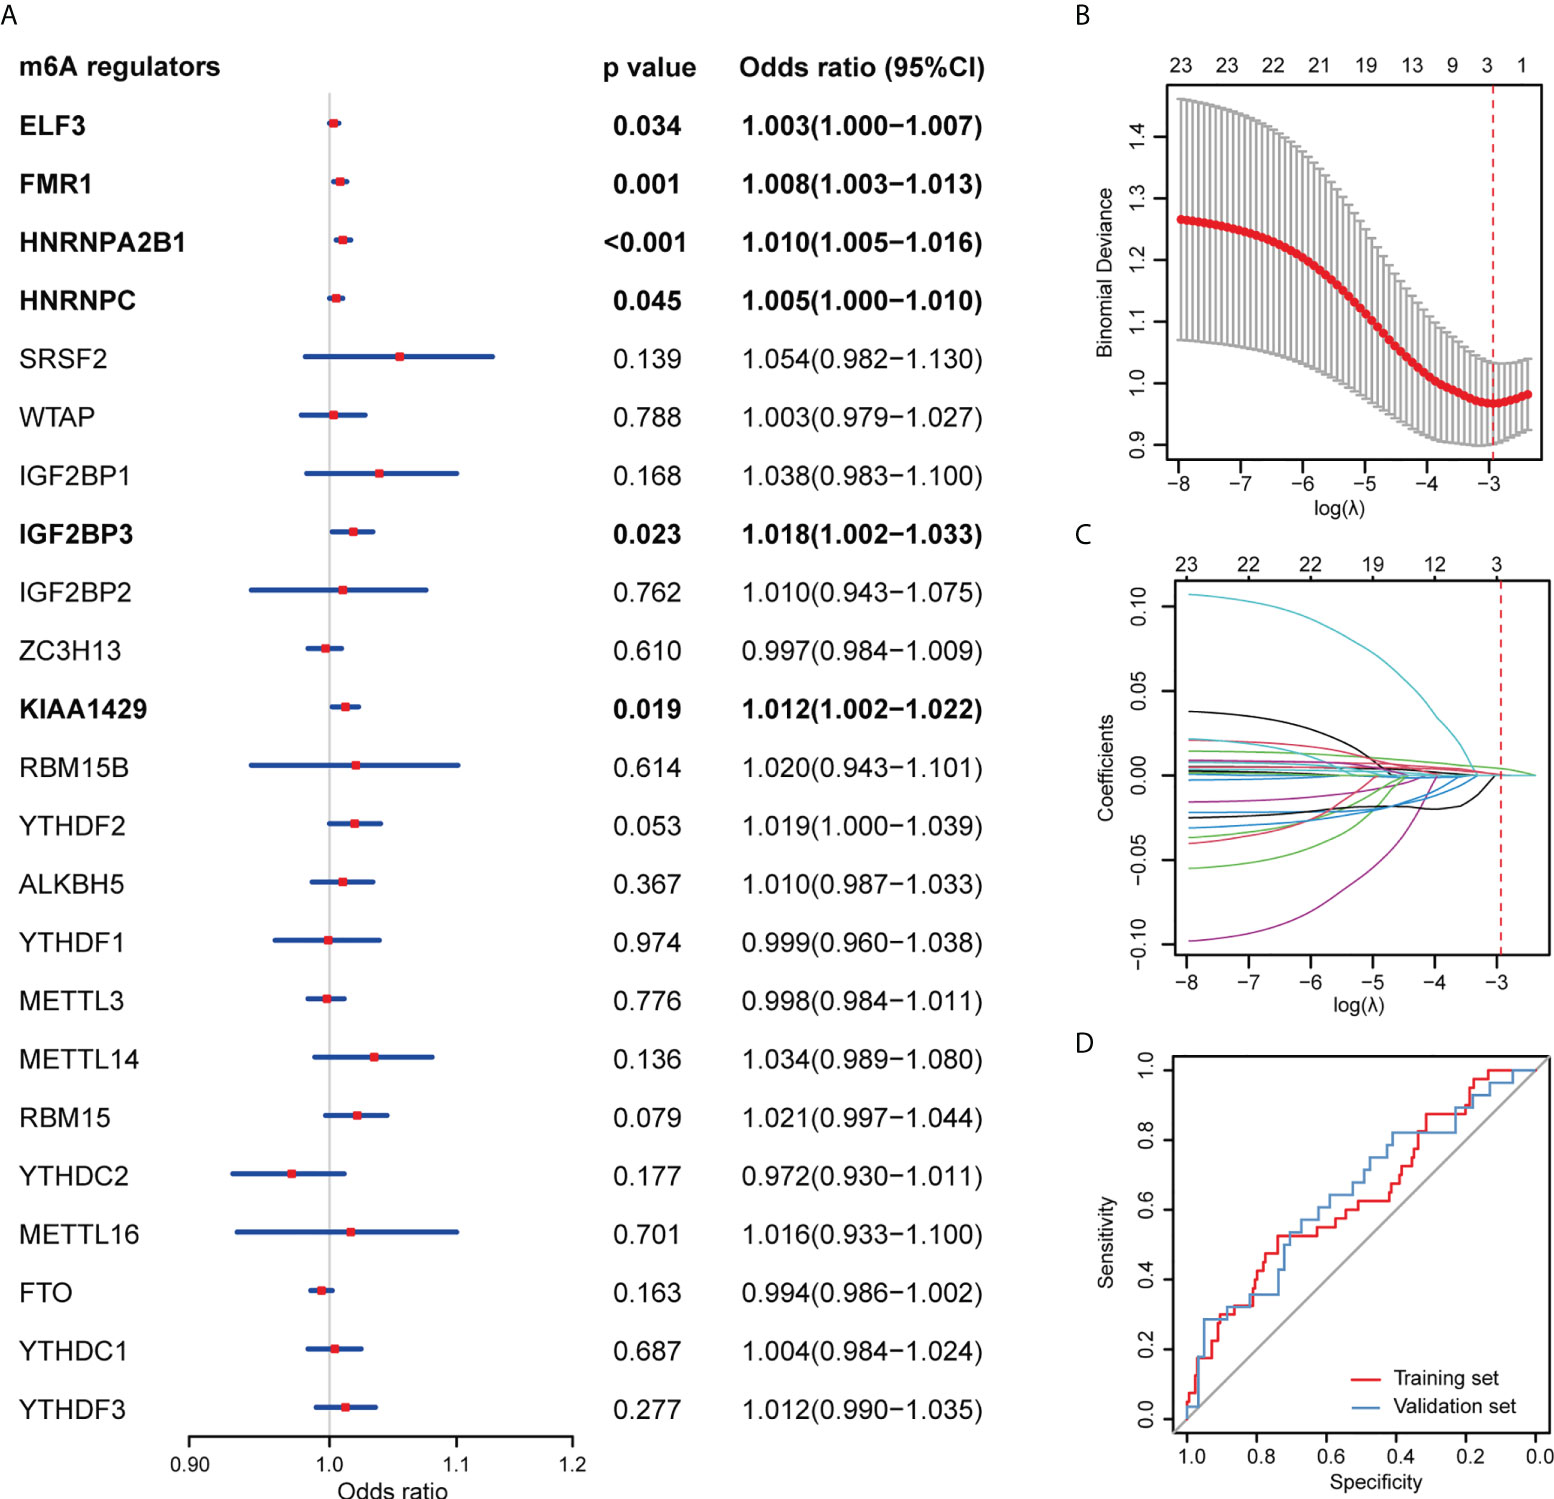
Figure 2 Construction and assessment of the m6A-related gene signature. (A) Univariable logistic regression analyses evaluating the predictive ability of m6A methylation regulators for treatment response of urothelial carcinoma patients. (B) Tuning parameter (λ) selection in the LASSO model used 10-fold cross-validation via minimum criteria. Binomial deviances from the LASSO regression cross-validation procedure were plotted as a function of log(λ). The numbers along the upper x-axis represent the average number of predictors. The red dots indicate the average deviance values for each model with a given λ, and the vertical bars through the red dots show the upper and lower values of the deviances. The dotted vertical lines are drawn at the optimal values where the model provides its best fit to the data. The optimal λ value of 0.053 with log (λ) = -2.936 was chosen. (C) LASSO coefficient profiles of the 23 m6A methylation regulators. The dotted vertical line is drawn at the value selected using 10-fold cross-validation in Figure 2B, where optimal λ resulted in 2 nonzero coefficients. (D) ROC curves of the gene signature in the training and validation sets.
The gene signature showed favorable discrimination, with an AUC of 0.634 (95% confidence interval [CI] 0.535-0.733) in the training set, which was validated in the validation set with an AUC of 0.646 (95% CI 0.520-0.773; Figure 2D).
There was one outlier in the sample clustering (Supplementary Figure S4), which was excluded in the subsequent WGCNA. As 4 is the lowest value that allows obtaining more than 90% similarities in topology models (Figures 3A, B), a soft threshold power of 4 was selected. Finally, a total of 15 modules was obtained using a dynamic tree-cutting method (Figure 3C). Among these modules, the turquoise module was the most significantly correlated to treatment response (Pearson correlation coefficient = 0.23 and P < 0.001, Figure 3D). Of note, two identified treatment outcome-related genes, FMR1 and HNRNPA2B1, are found in the turquoise module, indicating the important role of these two m6A regulators in the immunotherapy of bladder cancer.
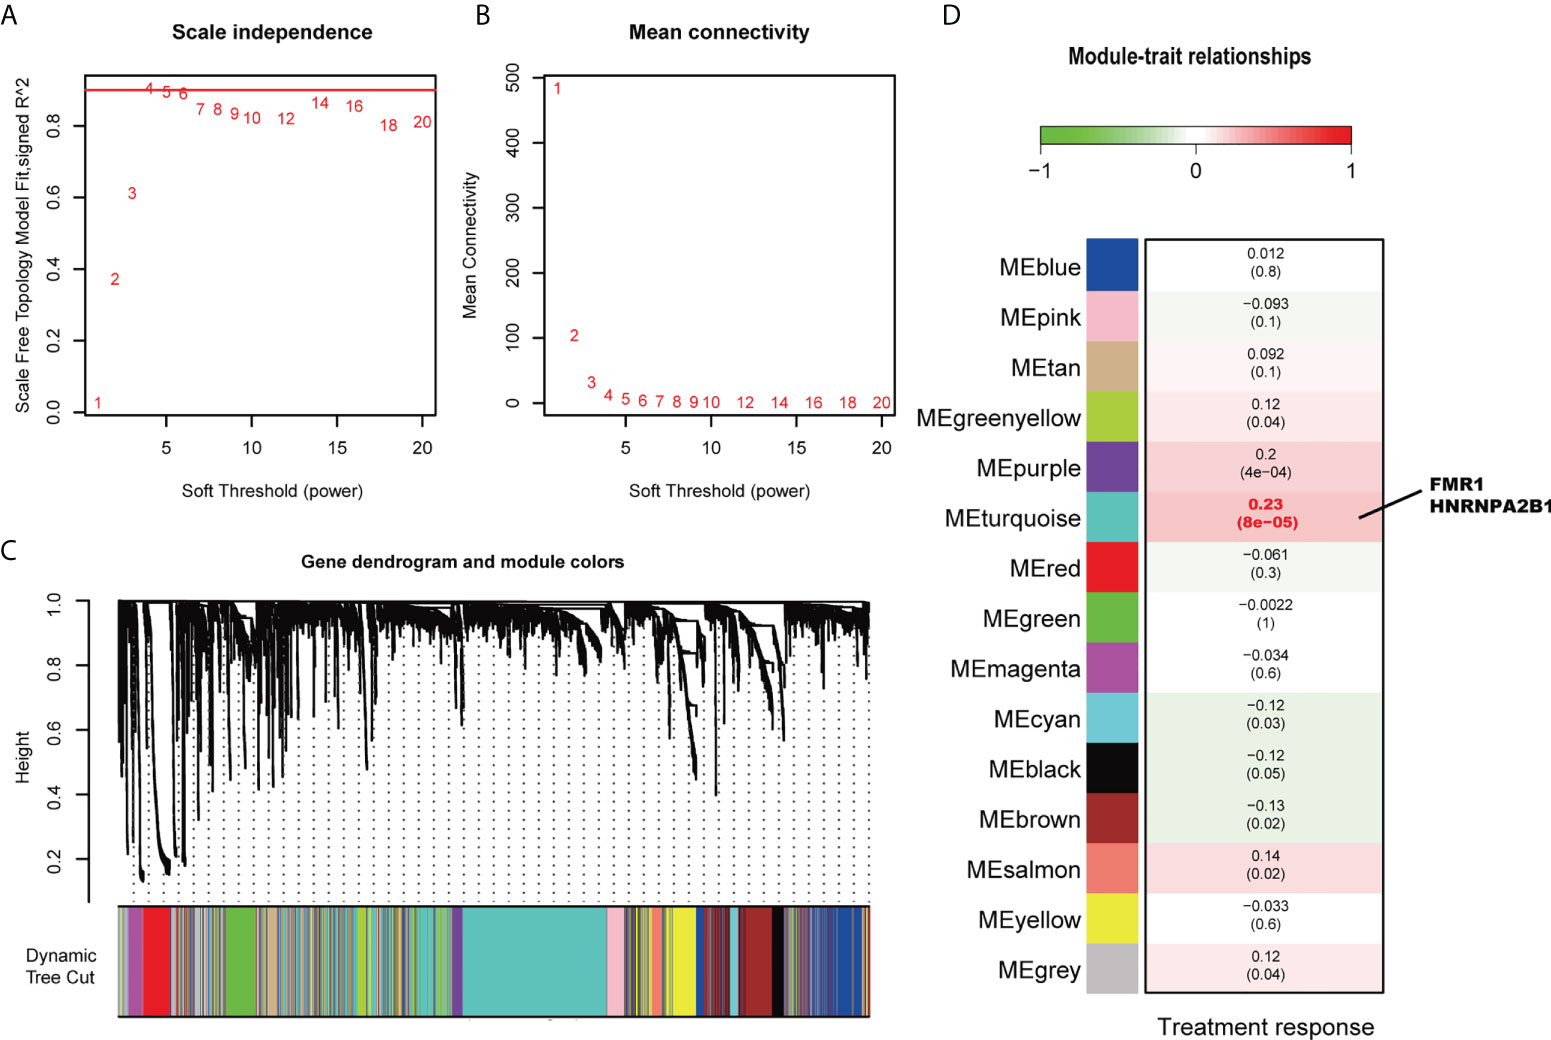
Figure 3 Weight Gene Co-expression Network Analysis. (A) Analysis of the scale-free index for various soft power thresholds. (B) Analysis of the mean connectivity of various soft power thresholds. (C) Dendrogram of the genes clustered based on a dissimilarity measure (1-TOM). (D) Average gene significances and errors in the modules associated with treatment response. The turquoise module was the most significantly correlated to treatment response. FMR1 and HNRNPA2B1 are in this module.
Patients with low expression of FMR1 and HNRNPA2B1 were more likely to have death after receiving immunotherapy in the IMvigor210 cohort (Supplementary Figure S5). Their performance in prognostic prediction is also presented in Supplementary Table S3. However, we found that expression of FMR1 and HNRNPA2B1 were not correlated with the overall survival in bladder cancer patients based on TCGA-BLCA dataset, who were not treated with immunotherapy (Supplementary Figure S6). These results suggest that these two identified genes might influence the immunotherapy response through m6A methylation, affecting the prognosis of patients with urothelial carcinoma.
As shown in Figure 4, FMR1 was negatively related to regulatory T cells, resting NK cells, M0 macrophages, M2 macrophages, was positively correlated with activated CD4+ memory T cells, gamma delta T cells, activated myeloid dendritic cells, and eosinophil. HNRNPA2B1 was negatively related with M0 macrophages, and was positively correlated with activated CD4+ memory T cells and activated myeloid dendritic cells. Note that FMR1 was most negatively correlated with M2 macrophages, and HNRNPA2B1 was most negatively correlated with M0 macrophages.
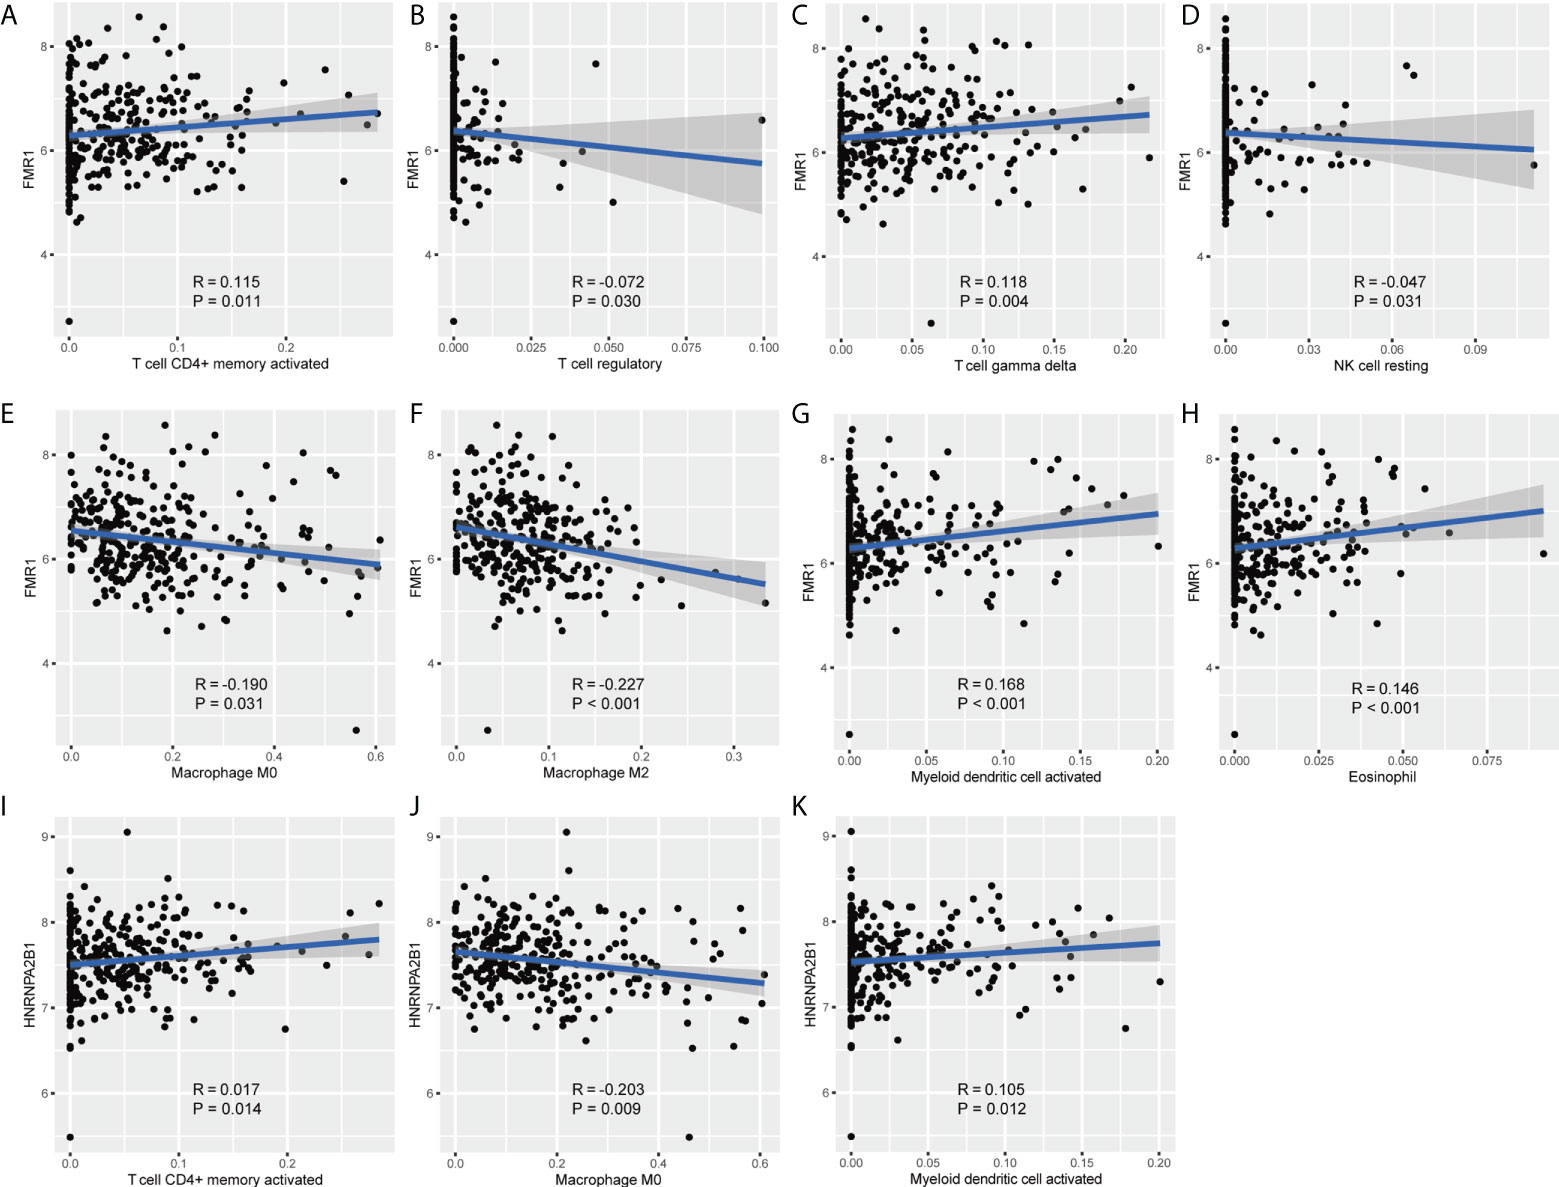
Figure 4 The relationship of FMR1 and HNRNPA2B1 with different types of immune cells. (A–H) Correlation plots show the relationship between FMR1 and different types of immunocytes. (I–K) Correlation plots show the relationship between HNRNPA2B1 and different types of immunocytes.
According to the univariate logistic regression analyses, three candidate variables were found to meet the threshold of P < 0.05, including the gene signature, IC, and TMB (Table 2). They were identified as the significant predictors of treatment outcomes in the subsequent multivariable logistic regression analysis. The VIF values ranged from 1.000 to 1.003, indicating that there was no collinearity in the collinearity diagnosis. By incorporating IC, TMB, and the gene signature, a nomogram was developed (Figure 5A) and the response score could be calculated for each patient to reflect the probability of treatment response based on the multivariable logistic regression formula. The calculating formula was as follow: response score = 1.673 × gene score + 0.481 × IC + 0.093 × TMB − 0.542. The predicted treatment response probability was calculated using 1/[1 + exp (−response score)].
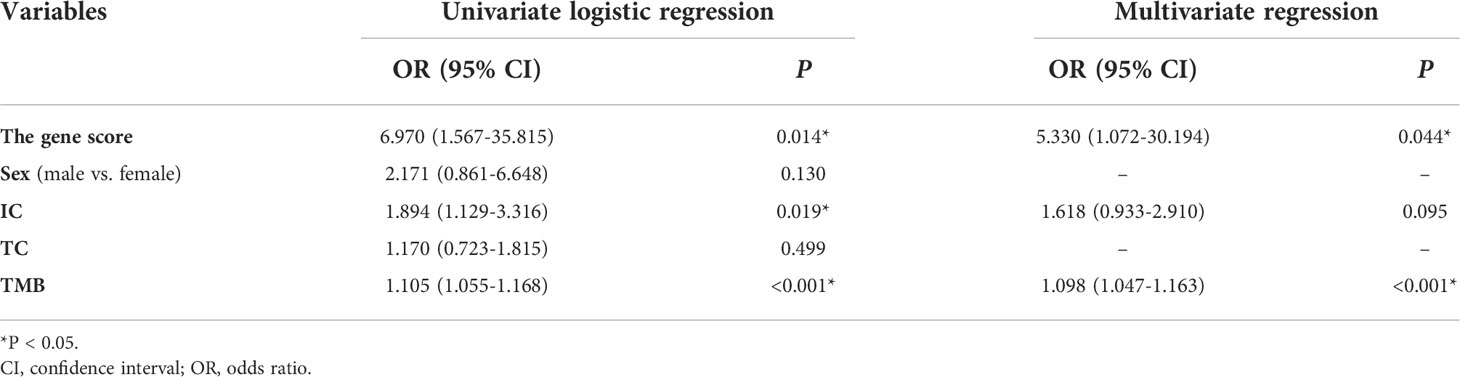
Table 2 Univariate logistic regression analysis of the gene score and clinical candidate predictors in the training set.
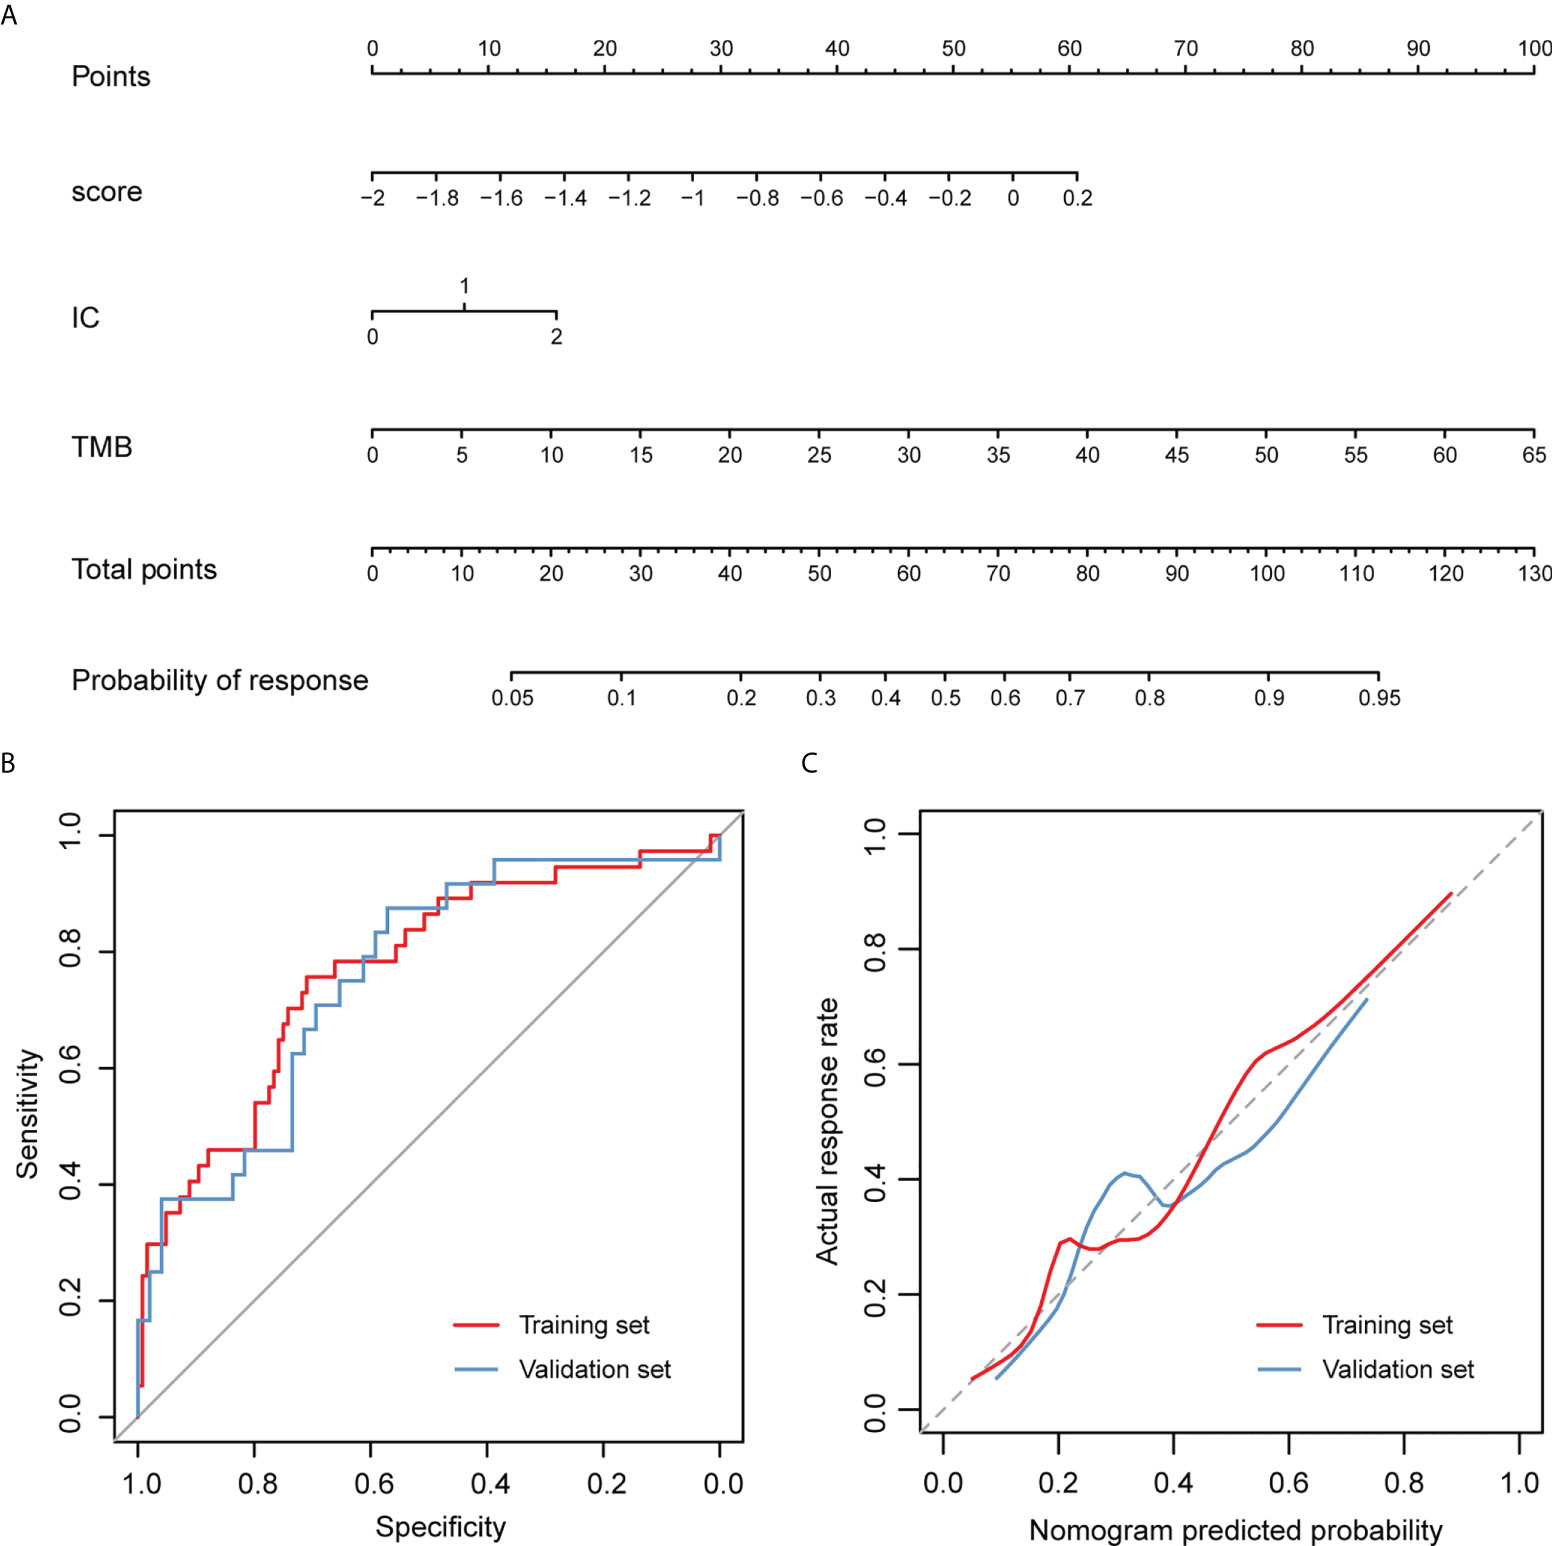
Figure 5 Nomogram to predict the response of atezolizumab treatment for patients with advanced urothelial carcinoma and its performance evaluation. (A) Points were assigned for gene score, IC and TMB by drawing a line upward from the corresponding values to the “Points” line. The sum of these three points, plotted on the “Total points” line, corresponds to predictions of the treatment response. (B) ROC curves of the nomogram. (C) Calibration curves of the nomogram. The observed treatment outcome is shown compared with the nomogram using the training set and validation set, respectively. The calibration curves depict the calibration of the nomogram in terms of the agreement between the predicted treatment outcomes and the observed treatment outcomes. The 45-degree dotted gray line represents a perfect prediction, and the solid lines represent the predictive performance of the nomogram. The distance between the solid line and the ideal line represents the superior predictive accuracy of the nomogram.
In the training set, an AUC of 0.768 (95% CI, 0.678-0.858) indicated that the nomogram had good discrimination (Figure 5B). The calibration curve of the nomogram estimating the probability of an effective treatment response demonstrated good agreement (Figure 5C), and the Hosmer-Lemeshow test yielded a non-significant statistic (P = 0.256), suggesting no departure from the perfect fit. The favorable calibration and discrimination performance of the nomogram was confirmed in the validation set, with an AUC of 0.755 (95% CI 0.636-0.875; Figures 5B, C). The Hosmer-Lemeshow test also demonstrated a non-significant statistic for the nomogram (P = 0.214).
After obtaining the response scores from the nomogram, the patients were classified into the predicted response and the predicted non-response groups according to the optimal cutoff value of 0.194. Notably, in the training set, patients in the predicted response group had better OS compared with those in the predicted non-response group (Figure 6A); the same was true in the validation set (Figure 6B).
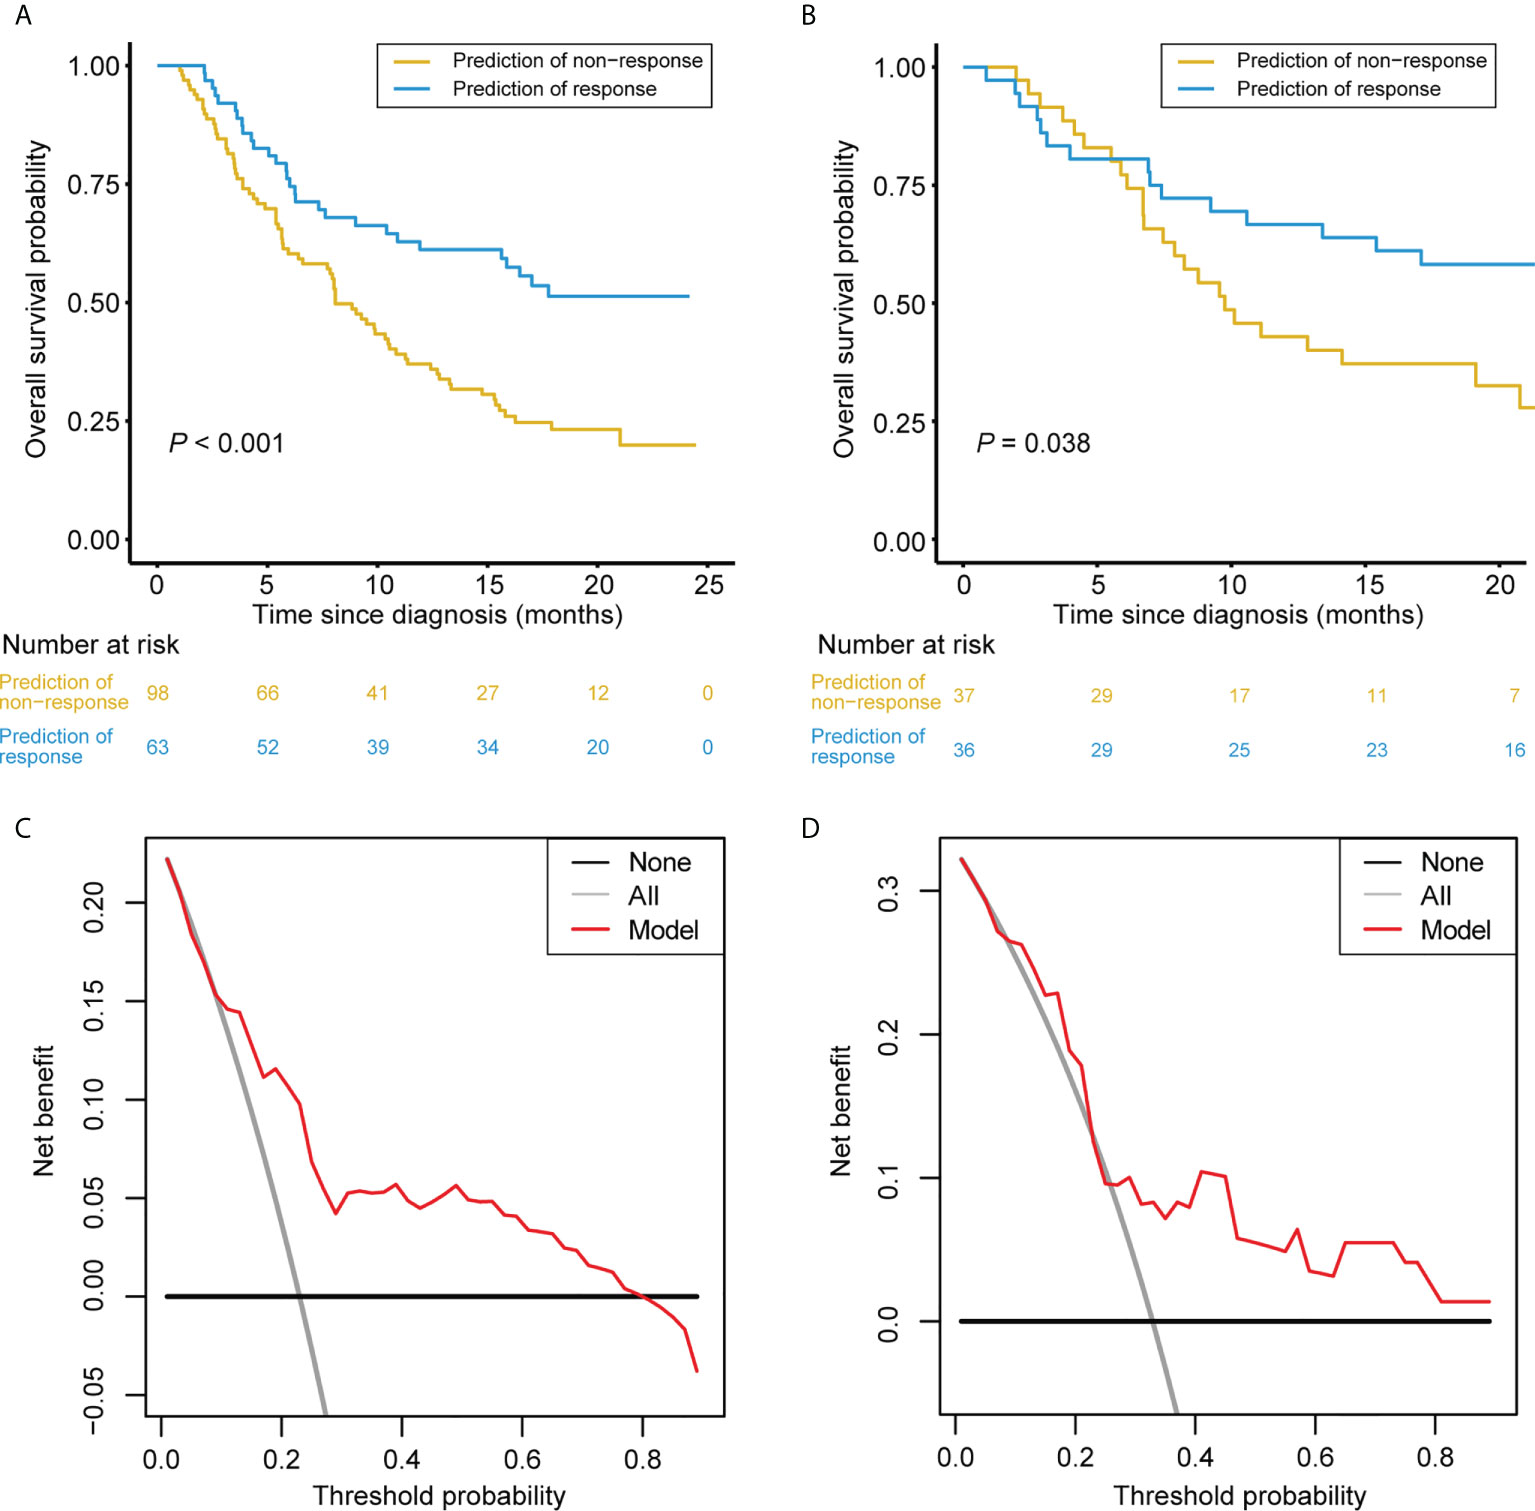
Figure 6 Clinical Usefulness of the Nomogram. (A, B) Kaplan-Meier survival curves of patients categorized into response and non-response groups in the training set (A) and validation set (B), respectively. (C, D) DCA of the nomogram in the training set (A) and validation set (B), respectively. The x-axis represents the threshold probability. The y-axis measures the net benefit. The black line depicts the net benefit of the strategy of treating no patients. The gray line depicts the net benefit of the strategy of treating all patients. The red line represents the nomogram. The net benefit was calculated by subtracting the proportion of all patients who are false positive from the proportion who are true positive, weighting by the relative harm of forgoing treatment compared with the negative consequences of unnecessary treatment. The threshold probability is where the expected benefit of treatment is equal to the expected benefit of avoiding treatment.
In the training and validation sets, the DCA suggested that using the nomogram to detect a treatment response adds more net benefit than either the treat-all or treat-none scheme for a wide range of threshold probability (Figures 6C, D).
Anti-PD1/PDL1 treatment has been increasingly recognized as a critical strategy in urothelial carcinoma. Precise targeting of patients is of great importance to increase benefits and cost-effectiveness. In this study, we determined the associations between m6A methylation regulators and atezolizumab treatment response. Furthermore, we developed a nomogram incorporating the m6A-related gene signature and clinical variables for individualized prediction of the response to atezolizumab in patients with urothelial carcinoma. This could aid in making treatment strategies and facilitate precision medicine.
In the study, differential expression analysis showed that six m6A methylation regulators, including IGF2BP1, IGF2BP3, YTHDF2, HNRNPA2B1, FMR1, and FTO, were significantly differentially expressed between the responders and non-responders. Moreover, the expression of these six regulators was significantly correlated with the treatment outcomes. These results may preliminarily indicate that these six m6A regulators have the potential of influencing the survival of urothelial carcinoma cells. Subsequently, we identified two critical m6A methylation regulators (i.e., FMR1 and HNRNPA2B1) to develop an m6A-related gene signature for the prediction of the response to atezolizumab. The gene signature showed satisfactory discrimination with an AUC of 0.634 in the training set, which was further confirmed in the validation set with an AUC of 0.646.
Furthermore, after using multivariable logistic regression analysis to select candidate predictors, a nomogram was built by incorporating the gene signature, IC, and TMB. The nomogram demonstrated favorable calibration and discrimination in the training set (AUC 0.768) and also performed well in the validation set (AUC 0.755). Moreover, the DCA suggested that within a broad threshold probability, using the prediction tool to predict treatment response adds more benefit than the treat-all or the treat-none scheme. The presented nomogram could serve as a reliable prediction tool and inform a clinician how big the possibility is that a certain patient with advanced urothelial carcinoma would respond to atezolizumab treatment. Furthermore, this tool would aid in better risk stratification among these patients, which could allow better allocation of health resources and avoid adverse effects brought by atezolizumab on patients that would not respond well.
In our study, two treatment outcome-related m6A methylation regulators, i.e., FMR1 and HNRNPA2B1, were determined by the LASSO regression analysis. And a high expression of FMR1 and HNRNPA2B1 indicated a favorable treatment outcome. The result of the prognostic value of FMR1 is in line with previous research where the expression levels of FMR1 were positively correlated with the overall survival of testicular germ cell tumors (37). On the other hand, the finding regarding HNRNPA2B1 is contrary to other studies where high expression of HNRNPA2B1 was significantly associated with poor prognosis in osteosarcoma (38), esophageal cancer (39) and adrenocortical carcinoma (40).
FMR1 and HNRNPA2B1 were both regarded as m6A methylation reader (41–43). FMR1 plays an important role in promoting m6A-modified mRNA nuclear export (44, 45) and interacts with m6A reader YTHDF1 and YTHDF2 to maintain the stability of its mRNA targets (43, 46, 47). To our knowledge, there is a lack of studies between FMR1 and tumor immunity. In our study, FMR1 was correlated with several types of tumor-infiltrating immune cells, suggesting that FMR1 may be involved in the regulation of immune cells in the tumor microenvironment. HNRNPA2B1 mediates mRNA slicing, primary microRNA processing and facilitates nucleocytoplasmic trafficking of mRNAs (41, 48–50). Previous studies have found that high expression of HNRNPA2B1 promotes lymphatic metastasis (51)and recurrence (52)of bladder cancer. The function of HNRNPA2B1 in tumor immunity remains controversial. Some studies have shown that HNRNPA2B1 can promote tumor immunity and anti-tumor. For example, there is a significant positive correlation between HNRNPA2B1 and M1 macrophages in esophageal cancer (39), and the expression of HNRNPA2B1 is higher in M1 macrophages and T/NK cells than in other cells in glioblastoma (53). In contrast, other studies have revealed that HNRNPA2B1 inhibits tumor immunity. For example, HNRNPA2B1 is negatively correlated with the immune score, stromal score, and ESTIMATE in adrenal cortical cancer (40), as well as Th1 and Th17 in prostate cancer (54). In our study, HNRNPA2B1 was positively correlated with activated CD4+ memory T cells and activated myeloid dendritic cells, implying that HNRNPA2B1 may enhance the efficacy of immunotherapy through regulating the tumor-infiltrating immune cells. However, further experiments are needed to clarify the mechanism between these two genes and tumor immunity.
Of note, tumor mutation burden (TMB) has been found to be able to predict treatment efficacy of immune checkpoint blockade and has become a reliable biomarker for the identification of patients that will benefit from immunotherapy in many tumor types (55–57). In our study, patients with high TMB were prone to achieve a positive response. This is consistent with some previous studies which have shown that high TMB is associated with response to anti-CTLA-4 in melanoma (58, 59), and anti-PD1 in NSCLC (60). Given that high TMB is correlated with a greater likelihood of presenting cancer neoantigens on cancer cell surface (61), it is reasonable to speculate that those cancers with high TMB tend to respond to immune checkpoint blockade drugs as this greater mutation load may increase the probability of recognition by neoantigen-reactive T cells.
In addition, IC was positively correlated with an effective response in our study, which is in line with previous studies (62, 63). Webb et al. found that PD-L1 was mainly expressed by tumor-associated CD68+ macrophages rather than cancer cells, and showed a positive association with survival in high-grade serous carcinomas (62). PD-L1+ tumor-infiltrating lymphocytes densities were favorable prognostic indicators for progression-free (PFS) and overall survival (OS) (63).
Our study has several limitations. First, although m6A methylation regulatory genes have been found to have high prognostic values in the response to atezolizumab among advanced urothelial carcinoma patients, their specific mechanisms in urothelial carcinoma progression and prognosis are not yet clear and warranted to be further investigated by in vitro and in vivo experiments. Second, external validation in a larger dataset is needed to confirm the performance of the nomogram.
In summary, two critical m6A methylation regulators associated with immunotherapy in patients with advanced urothelial carcinoma were identified in our study. In addition, the presented nomogram derived from the m6A-related gene signature and clinical variables could serve as a reliable tool to predict the response to atezolizumab in advanced urothelial carcinoma. Further external validation is needed to determine the performance of the nomogram before its application in clinical practice.
The datasets presented in this study can be found in online repositories. The names of the repository/repositories and accession number(s) can be found in the article/Supplementary Material.
Ethical review and approval was not required for the study on human participants in accordance with the local legislation and institutional requirements. Written informed consent for participation was not required for this study in accordance with the national legislation and the institutional requirements.
JK, SL, JJZ, and TL conceptualized and designed the study. LZ, YY, JZ, ZS, and ML did the literature research, performed the study selection, and data extraction. JK, JJZ, and BL analyzed and interpreted the data. BL, JJZ, and TL supervised the study. All the authors wrote, reviewed, and/or revised the manuscript. All authors contributed to the article and approved the submitted version.
This study was supported by the China Postdoctoral Science Foundation (Grant No. 2021TQ0387, 2021M703709, 2022M713625), the National Natural Science Foundation of China (Grant No. 81825016), Project Supported by Guangdong Province Higher Vocational Colleges & Schools Pearl River Scholar Funded Scheme (for TL), Guangdong Provincial Clinical Research Center for Urological Diseases (2020B1111170006), the GuangDong Basic and Applied Basic Research Foundation (Grant No. 2020A1515111119).
The authors declare that the research was conducted in the absence of any commercial or financial relationships that could be construed as a potential conflict of interest.
All claims expressed in this article are solely those of the authors and do not necessarily represent those of their affiliated organizations, or those of the publisher, the editors and the reviewers. Any product that may be evaluated in this article, or claim that may be made by its manufacturer, is not guaranteed or endorsed by the publisher.
The Supplementary Material for this article can be found online at: https://www.frontiersin.org/articles/10.3389/fimmu.2022.1014861/full#supplementary-material
Supplementary Table 1 | Data Source and Clinical Table.
1. Siegel RL, Miller KD, Fuchs HE, Jemal A. Cancer statistics, 2021. CA: Cancer J Clin Jan (2021) 71(1):7–33. doi: 10.3322/caac.21654
2. Witjes JA, Bruins HM, Cathomas R, Comperat EM, Cowan NC, Gakis G, et al. European Association of urology guidelines on muscle-invasive and metastatic bladder cancer: Summary of the 2020 guidelines. Eur Urology Jan (2021) 79(1):82–104. doi: 10.1016/j.eururo.2020.03.055
3. Lenis AT, Lec PM, Chamie K, Mshs MD. Bladder cancer: A review. JAMA Nov 17 (2020) 324(19):1980–91. doi: 10.1001/jama.2020.17598
4. Tregunna R. Combination treatment in advanced urothelial carcinoma. Nat Rev Urology Jul (2021) 18(7):383. doi: 10.1038/s41585-021-00489-7
5. Helmink BA, Khan MAW, Hermann A, Gopalakrishnan V, Wargo JA. The microbiome, cancer, and cancer therapy. Nat Med Mar (2019) 25(3):377–88. doi: 10.1038/s41591-019-0377-7
6. Brahmer JR, Tykodi SS, Chow LQ, Hwu WJ, Topalian SL, Hwu P, et al. Safety and activity of anti-PD-L1 antibody in patients with advanced cancer. N Engl J Med Jun 28 (2012) 366(26):2455–65. doi: 10.1056/NEJMoa1200694
7. Wolchok JD, Chiarion-Sileni V, Gonzalez R, Rutkowski P, Grob JJ, Cowey CL, et al. Overall survival with combined nivolumab and ipilimumab in advanced melanoma. N Engl J Med Oct 5 (2017) 377(14):1345–56. doi: 10.1056/NEJMoa1709684
8. Topalian SL, Hodi FS, Brahmer JR, Gettinger SN, Smith DC, McDermott DF, et al. Safety, activity, and immune correlates of anti-PD-1 antibody in cancer. N Engl J Med Jun 28 (2012) 366(26):2443–54. doi: 10.1056/NEJMoa1200690
9. Lee JS, Ruppin E. Multiomics prediction of response rates to therapies to inhibit programmed cell death 1 and programmed cell death 1 ligand 1. JAMA Oncol Aug 22 (2019) 5(11):1614–8. doi: 10.1001/jamaoncol.2019.2311
10. Pauken KE, Dougan M, Rose NR, Lichtman AH, Sharpe AH. Adverse events following cancer immunotherapy: Obstacles and opportunities. Trends Immunol Jun (2019) 40(6):511–23. doi: 10.1016/j.it.2019.04.002
11. Khoja L, Day D, Wei-Wu Chen T, Siu LL, Hansen AR. Tumour- and class-specific patterns of immune-related adverse events of immune checkpoint inhibitors: a systematic review. Ann Oncol Off J Eur Soc Med Oncol (2017) 28(10):2377–85. doi: 10.1093/annonc/mdx286
12. Hegde PS, Chen DS. Top 10 challenges in cancer immunotherapy. Immunity Jan 14 (2020) 52(1):17–35. doi: 10.1016/j.immuni.2019.12.011
13. Shilts J, Severin Y, Galaway F, Müller-Sienerth N, Chong Z, Pritchard S, et al. A physical wiring diagram for the human immune system. Nature (2022) 608(7922):397–404. doi: 10.1038/s41586-022-05028-x
14. Riaz N, Havel JJ, Makarov V, Desrichard A, Urba WJ, Sims JS, et al. Tumor and microenvironment evolution during immunotherapy with nivolumab. Cell Nov 2 (2017) 171(4):934–949.e16. doi: 10.1016/j.cell.2017.09.028
15. Yarchoan M, Hopkins A, Jaffee EM. Tumor mutational burden and response rate to PD-1 inhibition. N Engl J Med Dec 21 (2017) 377(25):2500–1. doi: 10.1056/NEJMc1713444
16. Yang Y, Hsu PJ, Chen YS, Yang YG. Dynamic transcriptomic m(6)A decoration: writers, erasers, readers and functions in RNA metabolism. Cell Res Jun (2018) 28(6):616–24. doi: 10.1038/s41422-018-0040-8
17. Paramasivam A, Priyadharsini JV, Raghunandhakumar S. Implications of m6A modification in autoimmune disorders. Cell Mol Immunol May (2020) 17(5):550–1. doi: 10.1038/s41423-019-0307-0
18. Paramasivam A, Priyadharsini JV. Novel insights into m6A modification in circular RNA and implications for immunity. Cell Mol Immunol Jun (2020) 17(6):668–9. doi: 10.1038/s41423-020-0387-x
19. Paramasivam A, Priyadharsini JV, Raghunandhakumar S. N6-adenosine methylation (m6A): a promising new molecular target in hypertension and cardiovascular diseases. Hypertens Res (2020) 43(2):153–4. doi: 10.1038/s41440-019-0338-z
20. Fu Y, Dominissini D, Rechavi G, He C. Gene expression regulation mediated through reversible m(6)A RNA methylation. Nat Rev Genet May (2014) 15(5):293–306. doi: 10.1038/nrg3724
21. Tong J, Cao G, Zhang T, Sefik E, Amezcua Vesely MC, Broughton JP, et al. m(6)A mRNA methylation sustains treg suppressive functions. Cell Res Feb (2018) 28(2):253–6. doi: 10.1038/cr.2018.7
22. Pinello N, Sun S, Wong JJ. Aberrant expression of enzymes regulating m(6)A mRNA methylation: implication in cancer. Cancer Biol Med Nov (2018) 15(4):323–34. doi: 10.20892/j.issn.2095-3941.2018.0365
23. Cheng M, Sheng L, Gao Q, Xiong Q, Zhang H, Wu M, et al. The m(6)A methyltransferase METTL3 promotes bladder cancer progression via AFF4/NF-κB/MYC signaling network. Oncogene May (2019) 38(19):3667–80. doi: 10.1038/s41388-019-0683-z
24. Gao Q, Zheng J, Ni Z, Sun P, Yang C, Cheng M, et al. The m(6)A methylation-regulated AFF4 promotes self-renewal of bladder cancer stem cells. Stem Cells Int (2020) 2020:8849218. doi: 10.1155/2020/8849218
25. Jin H, Ying X, Que B, Wang X, Chao Y, Zhang H, et al. N(6)-methyladenosine modification of ITGA6 mRNA promotes the development and progression of bladder cancer. EBioMed Sep (2019) 47:195–207. doi: 10.1016/j.ebiom.2019.07.068
26. Chen M, Nie ZY, Wen XH, Gao YH, Cao H, Zhang SF. m6A RNA methylation regulators can contribute to malignant progression and impact the prognosis of bladder cancer. Bioscience Rep (2019) 39(12):BSR20192892. doi: 10.1042/bsr20192892
27. Wang P, Wang X, Zheng L, Zhuang C. Gene signatures and prognostic values of m6A regulators in hepatocellular carcinoma. Front Genet (2020) 11:540186. doi: 10.3389/fgene.2020.540186
28. Zhao R, Li B, Zhang S, He Z, Pan Z, Guo Q, et al. The N(6)-Methyladenosine-Modified pseudogene HSPA7 correlates with the tumor microenvironment and predicts the response to immune checkpoint therapy in glioblastoma. Front Immunol (2021) 12:653711. doi: 10.3389/fimmu.2021.653711
29. Xu W, Tian X, Liu W, Anwaier A, Su J, Zhu W, et al. m(6)A regulator-mediated methylation modification model predicts prognosis, tumor microenvironment characterizations and response to immunotherapies of clear cell renal cell carcinoma. Front Oncol (2021) 11:709579. doi: 10.3389/fonc.2021.709579
30. Mariathasan S, Turley SJ, Nickles D, Castiglioni A, Yuen K, Wang Y, et al. TGFβ attenuates tumour response to PD-L1 blockade by contributing to exclusion of T cells. Nature Feb 22 (2018) 554(7693):544–8. doi: 10.1038/nature25501
31. Zhou Y, Zhou B, Pache L, Chang M, Khodabakhshi AH, Tanaseichuk O, et al. Metascape provides a biologist-oriented resource for the analysis of systems-level datasets. Nat Commun Apr 3 (2019) 10(1):1523. doi: 10.1038/s41467-019-09234-6
32. Tibshirani R. Regression shrinkage and selection via the lasso: a retrospective. J R Stat Soc Ser B Stat Methodol (2011) 73:273–82. doi: 10.1111/j.1467-9868.2011.00771.x
33. Chen B, Khodadoust MS, Liu CL, Newman AM, Alizadeh AA. Profiling tumor infiltrating immune cells with CIBERSORT. Methods Mol Biol (Clifton NJ) (2018) 1711:243–59. doi: 10.1007/978-1-4939-7493-1_12
34. Kramer AA, Zimmerman JE. Assessing the calibration of mortality benchmarks in critical care: The hosmer-lemeshow test revisited. Crit Care Med Sep (2007) 35(9):2052–6. doi: 10.1097/01.Ccm.0000275267.64078.B0
35. Camp RL, Dolled-Filhart M, Rimm DL. X-Tile: a new bio-informatics tool for biomarker assessment and outcome-based cut-point optimization. Clin Cancer Res (2004) 10(21):7252–9. doi: 10.1158/1078-0432.ccr-04-0713
36. Vickers AJ, Elkin EB. Decision curve analysis: a novel method for evaluating prediction models. Med decision making an Int J Soc Med Decision Making Nov-Dec (2006) 26(6):565–74. doi: 10.1177/0272989x06295361
37. Cong R, Ji C, Zhang J, Zhang Q, Zhou X, Yao L, et al. m6A RNA methylation regulators play an important role in the prognosis of patients with testicular germ cell tumor. Transl Androl Urol. Feb (2021) 10(2):662–79. doi: 10.21037/tau-20-963
38. Li J, Rao B, Yang J, Liu L, Huang M, Liu X, et al. Dysregulated m6A-related regulators are associated with tumor metastasis and poor prognosis in osteosarcoma. Front Oncol (2020) 10:769. doi: 10.3389/fonc.2020.00769
39. Zhao H, Xu Y, Xie Y, Zhang L, Gao M, Li S, et al. m6A regulators is differently expressed and correlated with immune response of esophageal cancer. Front Cell Dev Biol (2021) 9:650023. doi: 10.3389/fcell.2021.650023
40. Jin Y, Wang Z, He D, Zhu Y, Hu X, Gong L, et al. Analysis of m6A-related signatures in the tumor immune microenvironment and identification of clinical prognostic regulators in adrenocortical carcinoma. Front Immunol (2021) 12:637933. doi: 10.3389/fimmu.2021.637933
41. Alarcón CR, Goodarzi H, Lee H, Liu X, Tavazoie S, Tavazoie SF. HNRNPA2B1 is a mediator of m(6)A-dependent nuclear RNA processing events. Cell Sep 10 (2015) 162(6):1299–308. doi: 10.1016/j.cell.2015.08.011
42. Arguello AE, DeLiberto AN, Kleiner RE. RNA Chemical proteomics reveals the N(6)-methyladenosine (m(6)A)-regulated protein-RNA interactome. J Am Chem Soc Dec 6 (2017) 139(48):17249–52. doi: 10.1021/jacs.7b09213
43. Edupuganti RR, Geiger S, Lindeboom RGH, Shi H, Hsu PJ, Lu Z, et al. N(6)-methyladenosine (m(6)A) recruits and repels proteins to regulate mRNA homeostasis. Nat Struct Mol Biol Oct (2017) 24(10):870–8. doi: 10.1038/nsmb.3462
44. Edens BM, Vissers C, Su J, Arumugam S, Xu Z, Shi H, et al. FMRP modulates neural differentiation through m(6)A-dependent mRNA nuclear export. Cell Rep Jul 23 (2019) 28(4):845–854.e5. doi: 10.1016/j.celrep.2019.06.072
45. Hsu PJ, Shi H, Zhu AC, Lu Z, Miller N, Edens BM, et al. The RNA-binding protein FMRP facilitates the nuclear export of n (6)-methyladenosine-containing mRNAs. J Biol Chem Dec 27 (2019) 294(52):19889–95. doi: 10.1074/jbc.AC119.010078
46. Zhang F, Kang Y, Wang M, Li Y, Xu T, Yang W, et al. Fragile X mental retardation protein modulates the stability of its m6A-marked messenger RNA targets. Hum Mol Genet Nov 15 (2018) 27(22):3936–50. doi: 10.1093/hmg/ddy292
47. Worpenberg L, Paolantoni C, Longhi S, Mulorz MM, Lence T, Wessels HH, et al. Ythdf is a N6-methyladenosine reader that modulates Fmr1 target mRNA selection and restricts axonal growth in drosophila. EMBO J Feb 15 (2021) 40(4):e104975. doi: 10.15252/embj.2020104975
48. Wu Y, Yang X, Chen Z, Tian L, Jiang G, Chen F, et al. m(6)A-induced lncRNA RP11 triggers the dissemination of colorectal cancer cells via upregulation of Zeb1. Mol Cancer Apr 13 (2019) 18(1):87. doi: 10.1186/s12943-019-1014-2
49. Jiang F, Tang X, Tang C, Hua Z, Ke M, Wang C, et al. HNRNPA2B1 promotes multiple myeloma progression by increasing AKT3 expression via m6A-dependent stabilization of ILF3 mRNA. J Hematol Oncol Apr 1 (2021) 14(1):54. doi: 10.1186/s13045-021-01066-6
50. Liu X, Liu Y, Liu Z, Lin C, Meng F, Xu L, et al. CircMYH9 drives colorectal cancer growth by regulating serine metabolism and redox homeostasis in a p53-dependent manner. Mol Cancer Sep 8 (2021) 20(1):114. doi: 10.1186/s12943-021-01412-9
51. Chen C, Luo Y, He W, Zhao Y, Kong Y, Liu H, et al. Exosomal long noncoding RNA LNMAT2 promotes lymphatic metastasis in bladder cancer. J Clin Invest Jan 2 (2020) 130(1):404–21. doi: 10.1172/jci130892
52. Li X, Huang C, Zhang X, Yang T, Zuo S, Fu C, et al. Discovery of bladder cancer biomarkers in paired pre- and postoperative urine samples. Transl Androl Urol. Aug (2021) 10(8):3402–14. doi: 10.21037/tau-21-562
53. Yuan F, Cai X, Cong Z, Wang Y, Geng Y, Aili Y, et al. Roles of the m(6)A modification of RNA in the glioblastoma microenvironment as revealed by single-cell analyses. Front Immunol (2022) 13:798583. doi: 10.3389/fimmu.2022.798583
54. Liu Z, Zhong J, Zeng J, Duan X, Lu J, Sun X, et al. Characterization of the m6A-associated tumor immune microenvironment in prostate cancer to aid immunotherapy. Front Immunol (2021) 12:735170. doi: 10.3389/fimmu.2021.735170
55. Hugo W, Zaretsky JM, Sun L, Song C, Moreno BH, Hu-Lieskovan S, et al. Genomic and transcriptomic features of response to anti-PD-1 therapy in metastatic melanoma. Cell Mar 24 (2016) 165(1):35–44. doi: 10.1016/j.cell.2016.02.065
56. Carbone DP, Reck M, Paz-Ares L, Creelan B, Horn L, Steins M, et al. First-line nivolumab in stage IV or recurrent non-Small-Cell lung cancer. N Engl J Med Jun 22 (2017) 376(25):2415–26. doi: 10.1056/NEJMoa1613493
57. Chowell D, Morris L, Grigg C, Weber J, Samstein R, Makarov V, et al. Patient HLA class I genotype influences cancer response to checkpoint blockade immunotherapy. Sci (New York NY) (2018) 359(6375):582–7. doi: 10.1126/science.aao4572
58. Snyder A, Makarov V, Merghoub T, Yuan J, Zaretsky JM, Desrichard A, et al. Genetic basis for clinical response to CTLA-4 blockade in melanoma. N Engl J Med Dec 4 (2014) 371(23):2189–99. doi: 10.1056/NEJMoa1406498
59. Van Allen EM, Miao D, Schilling B, Shukla SA, Blank C, Zimmer L, et al. Genomic correlates of response to CTLA-4 blockade in metastatic melanoma. Sci (New York NY) Oct 9 (2015) 350(6257):207–11. doi: 10.1126/science.aad0095
60. Rizvi NA, Hellmann MD, Snyder A, Kvistborg P, Makarov V, Havel JJ, et al. Cancer immunology. mutational landscape determines sensitivity to PD-1 blockade in non-small cell lung cancer. Sci (New York NY) Apr 3 (2015) 348(6230):124–8. doi: 10.1126/science.aaa1348
61. Peggs KS, Segal NH, Allison JP. Targeting immunosupportive cancer therapies: accentuate the positive, eliminate the negative. Cancer Cell Sep (2007) 12(3):192–9. doi: 10.1016/j.ccr.2007.08.023
62. Webb JR, Milne K, Kroeger DR, Nelson BH. PD-L1 expression is associated with tumor-infiltrating T cells and favorable prognosis in high-grade serous ovarian cancer. Gynecol Oncol May (2016) 141(2):293–302. doi: 10.1016/j.ygyno.2016.03.008
63. Darb-Esfahani S, Kunze CA, Kulbe H, Sehouli J, Wienert S, Lindner J, et al. Prognostic impact of programmed cell death-1 (PD-1) and PD-ligand 1 (PD-L1) expression in cancer cells and tumor-infiltrating lymphocytes in ovarian high grade serous carcinoma. Oncotarget Jan 12 (2016) 7(2):1486–99. doi: 10.18632/oncotarget.6429
Keywords: m6A methylation regulators, urothelial carcinoma, PD1/PDL1, prediction, outcome
Citation: Kong J, Lu S, Zhang L, Yao Y, Zhang J, Shen Z, Luo M, Liu B, Zheng J and Lin T (2022) m6A methylation regulators as predictors for treatment of advanced urothelial carcinoma with anti-PDL1 agent. Front. Immunol. 13:1014861. doi: 10.3389/fimmu.2022.1014861
Received: 09 August 2022; Accepted: 29 August 2022;
Published: 15 September 2022.
Edited by:
Jinghua Pan, Jinan University, ChinaReviewed by:
Weihong Guo, Southern Medical University, ChinaCopyright © 2022 Kong, Lu, Zhang, Yao, Zhang, Shen, Luo, Liu, Zheng and Lin. This is an open-access article distributed under the terms of the Creative Commons Attribution License (CC BY). The use, distribution or reproduction in other forums is permitted, provided the original author(s) and the copyright owner(s) are credited and that the original publication in this journal is cited, in accordance with accepted academic practice. No use, distribution or reproduction is permitted which does not comply with these terms.
*Correspondence: Tianxin Lin, bGludHhAbWFpbC5zeXN1LmVkdS5jbg==; Junjiong Zheng, emhlbmdqajU5QG1haWwuc3lzdS5lZHUuY24=; Bin Liu, YmlubGl1M0Bhcml6b25hLmVkdQ==
†These authors share first authorship
Disclaimer: All claims expressed in this article are solely those of the authors and do not necessarily represent those of their affiliated organizations, or those of the publisher, the editors and the reviewers. Any product that may be evaluated in this article or claim that may be made by its manufacturer is not guaranteed or endorsed by the publisher.
Research integrity at Frontiers
Learn more about the work of our research integrity team to safeguard the quality of each article we publish.