
95% of researchers rate our articles as excellent or good
Learn more about the work of our research integrity team to safeguard the quality of each article we publish.
Find out more
ORIGINAL RESEARCH article
Front. Immunol. , 15 September 2022
Sec. Cancer Immunity and Immunotherapy
Volume 13 - 2022 | https://doi.org/10.3389/fimmu.2022.1009306
This article is part of the Research Topic Targeting Tumor Vasculature to Enhance Cancer Immunotherapy View all 9 articles
Tumor-associated tertiary lymphoid structures are ectopic lymphoid aggregates that have considerable morphological, cellular, and molecular similarity to secondary lymphoid organs, particularly lymph nodes. Tumor vessels expressing peripheral node addressin (PNAd) are hallmark features of these structures. Previous work from our laboratory demonstrated that PNAd is displayed on intratumoral vasculature of murine tumors, and its expression is controlled by the engagement of lymphotoxin-α3, secreted by effector CD8 T cells, with tumor necrosis factor receptors (TNFR) on tumor endothelial cells (TEC). The goals of the present work were: 1) to identify differences in expression of genes encoding the scaffolding proteins and glycosyl transferases associated with PNAd biosynthesis in TEC and lymph node blood endothelial cells (LN BEC); and 2) to determine which of these PNAd associated components are regulated by TNFR signaling. We found that the same genes encoding scaffolding proteins and glycosyl transferases were upregulated in PNAd+ LN BEC and PNAd+ TEC relative to their PNAdneg counterparts. The lower level of PNAd expression on TEC vs LN BEC was associated with relatively lower expression of these genes, particularly the carbohydrate sulfotransferase Chst4. Loss of PNAd on TEC in the absence of TNFR signaling was associated with lack of upregulation of these same genes. A small subset of PNAd+ TEC remaining in the absence of TNFR signaling showed normal upregulation of a subset of these genes, but reduced upregulation of genes encoding the scaffolding proteins podocalyxin and nepmucin, and carbohydrate sulfotransferase Chst2. Lastly, we found that checkpoint immunotherapy augmented both the fraction of TEC expressing PNAd and their surface level of this ligand. This work points to strong similarities in the regulation of PNAd expression on TEC by TNFR signaling and on LN BEC by lymphotoxin-β receptor signaling, and provides a platform for the development of novel strategies that manipulate PNAd expression on tumor vasculature as an element of cancer immunotherapy.
Trafficking of leukocytes, including T- and B-cells, into lymphoid and inflamed non-lymphoid tissues involves sequential interactions of a set of homing receptors (HR) on leukocytes with cognate ligands on blood endothelial cells (BEC) (1). During an immune response, effector T cells acquire the ability to enter inflamed tissues by upregulating HR that bind to ligands that are upregulated on activated BEC. HR and HR ligands that are utilized for T-cell infiltration into tumors have been identified (2–7). However, tumor endothelial cells (TEC) express HR ligands at low levels (8–10), and a number of studies have showed a correlation between the levels of HR ligands on the tumor vasculature and the numbers of intratumoral T cells (9, 11–16). A better understanding of how HR ligands are regulated in TEC may provide significant opportunities to increase the number of intratumoral T cells.
Since naïve T cells do not generally enter peripheral tissue, it had been assumed that all intratumoral lymphocytes are effectors that differentiate in tumor-draining LN and home to the tumor thereafter. However, naïve T cells infiltrated tumors that had been genetically modified to secrete homotrimeric lymphotoxin-α (LTα3) (17, 18) or LIGHT (19). Similar results were also obtained through the intratumoral injection of either homeostatic chemokine CCL21 (20, 21) or DCs genetically modified to express this molecule (22). Naïve T cells enter lymph nodes (LN) based on their expression of L-selectin and CCR7, which bind to peripheral node addressin (PNAd) and the chemokines CCL19/CCL21, respectively (23). These HR ligands are normally expressed on specialized LN blood vessels called high endothelial venules. However, they have been detected in a variety of human tumors, and their presence is associated with a positive clinical prognosis (24–30). Recently, our laboratory demonstrated that PNAd and CCL21 were co-expressed on a small fraction of blood vessels in murine melanomas and lung carcinomas growing in multiple anatomical locations (31). The primary source of CCL21 was cancer associated fibroblasts, and to a lesser extent, TEC. PNAd+ CCL21+ vessels developed spontaneously, and supported the infiltration of naive CD8 T cells that differentiated into functional effectors after intratumoral activation and significantly delayed tumor outgrowth (31, 32). Thus, PNAd+ CCL21+ intratumoral vessels contribute to anti-tumor immunity by generating a self-sustaining infiltration of naïve T cells into the tumor mass.
PNAd refers to the 6-sulfo sialyl Lewis X carbohydrate structure that is displayed on O-linked glycans that decorate multiple mucin-domain containing scaffolding proteins, including GlyCAM-1, CD34, sgp200, podocalyxin, endomucin, and nepmucin, and recognized by L-selectin (33, 34). Generation of 6-sulfo sialyl Lewis X involves a series of post-translational modifications, described in detail in Figure 1. The glycosyl transferases GALNT1, C1GALT1, B3gnt3, and GCNT1 construct a biantennary structure (35–38). The terminal GlcNAc residues of the Core 1 and Core 2 branches are each modified in 3 additional ways: fucosylation by FUT7 and FUT4 (43, 44); galactosylation and sialylation by B4GALT and one of several sialyl transferases (45–48); and sulfation by GlcNAc6ST-1 and GlcNAc6ST-2. While GLCNAC6ST-2 efficiently attaches sulfate onto both Core 1 and Core 2 GlcNAc residues, GLCNAC6ST-1 acts primarily on Core 2, and only inefficiently modifies Core 1 (39–42). This completes formation of the 6-sulfo sialyl Lewis X structure that is recognized by L-selectin expressed on naïve and central memory T- and B-cells.
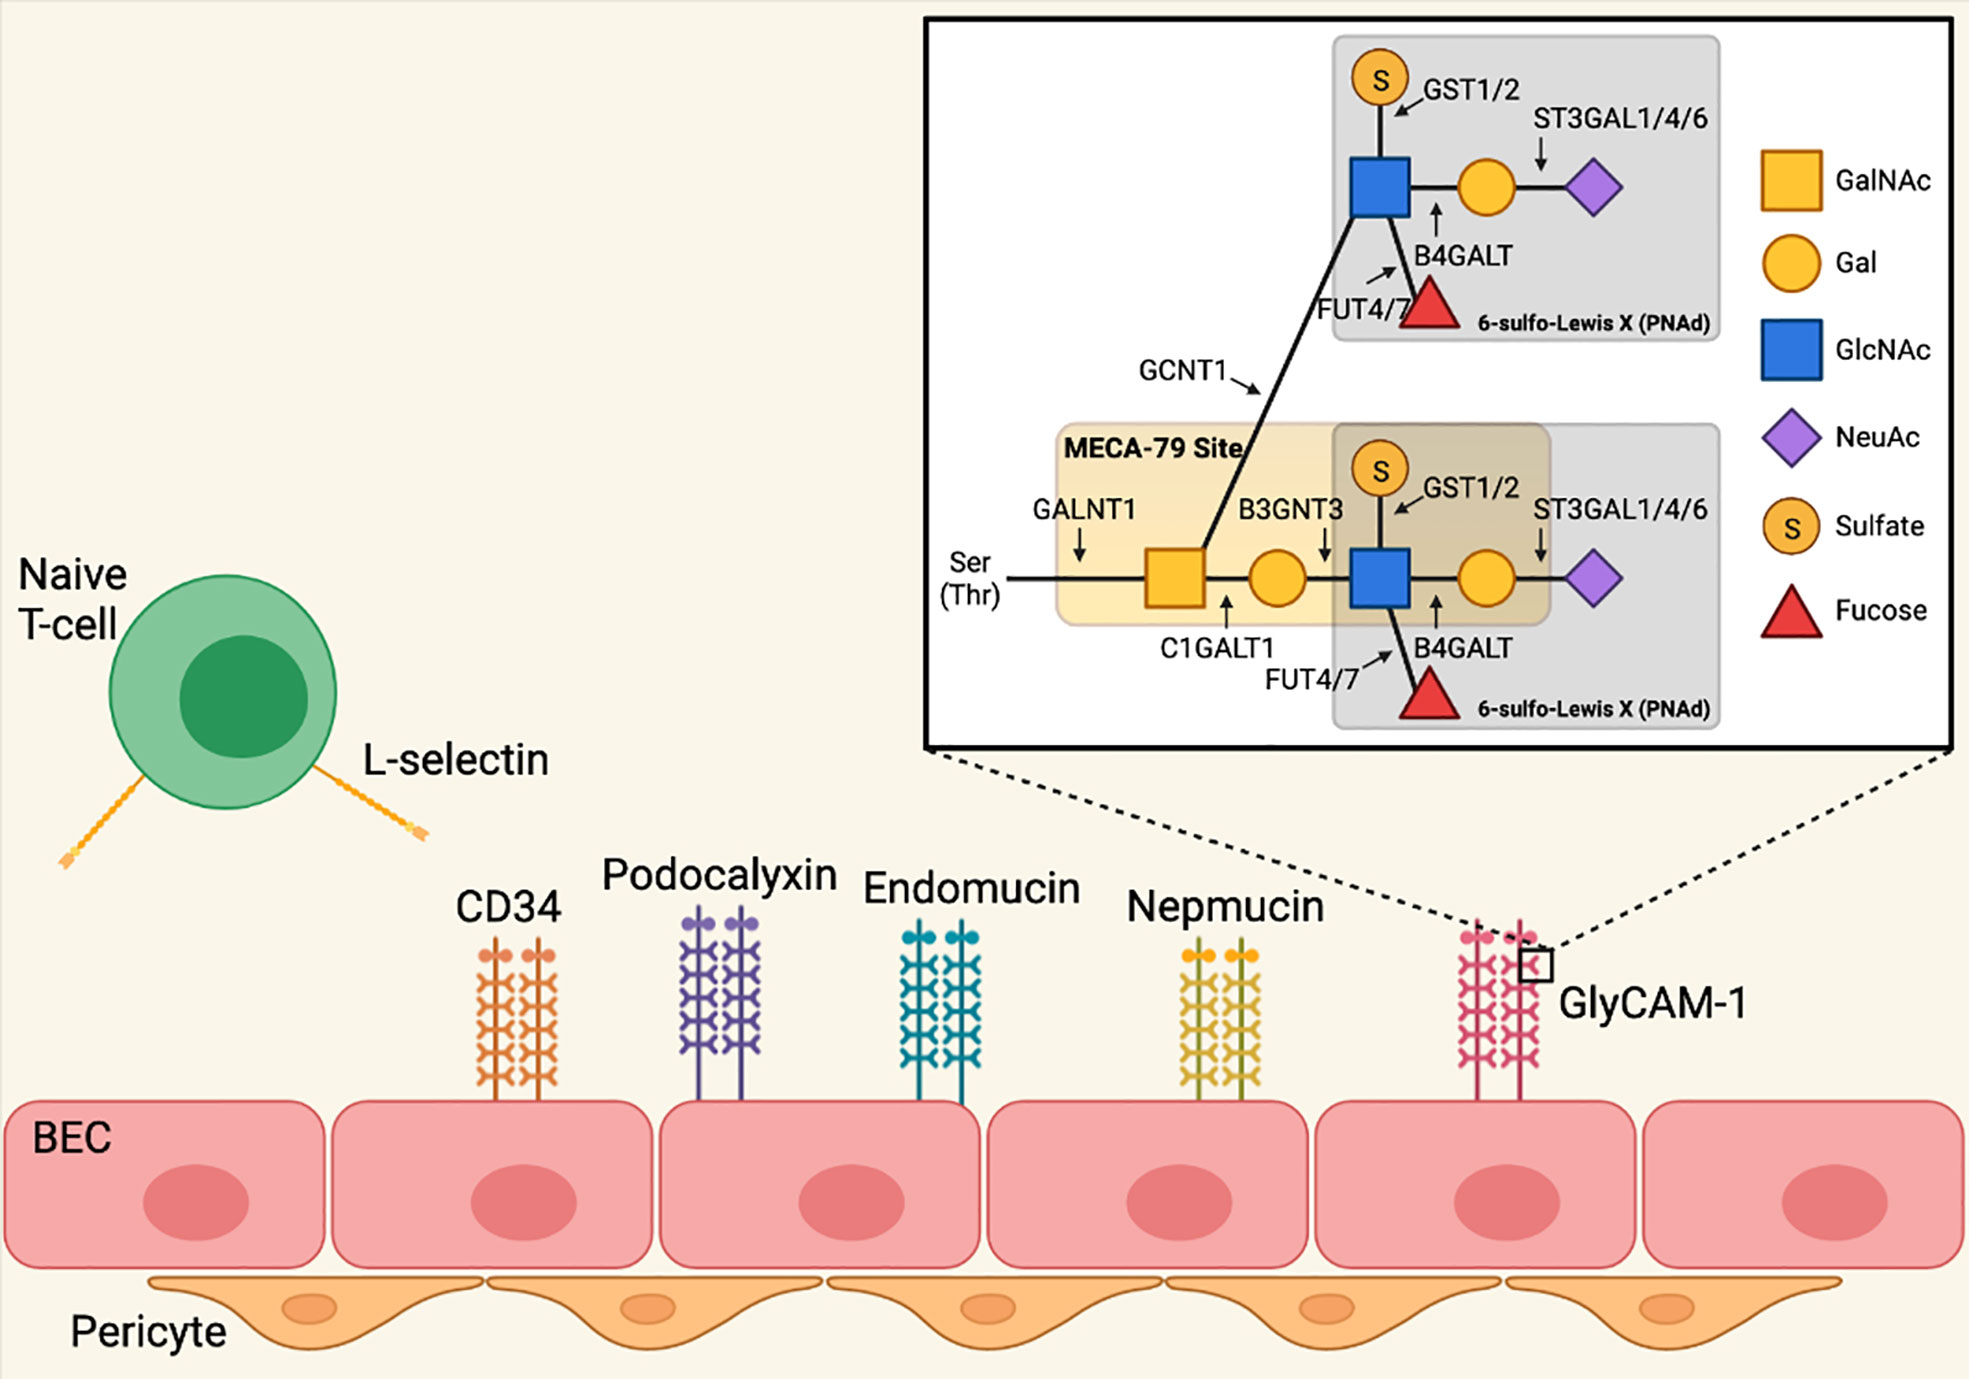
Figure 1 Biosynthesis of peripheral node addressin in lymph node blood endothelial cells. PNAd refers to the 6-sulfo sialyl Lewis X carbohydrate structure that is displayed on O-linked glycans that decorate multiple mucin-domain containing scaffolding proteins. Generation of 6-sulfo sialyl Lewis X involves a series of post-translational modifications mediated by glycosyl transferases. Polypeptide N-acetylgalactosaminyltransferase 1 (GALNT1) initiates formation of the O-linked glycan by attaching a N-acetyl-galactosamine (GalNAc) residue to serine and/or threonine (35). O-glycans are biantennary structures consisting of Core 1 and Core 2 branches. Glycoprotein-N-acetylgalactosamine 3-beta-galactosyltransferase 1 (C1GALT1, Core 1 synthase) creates the core 1 branch by attaching a galactose (Gal) residue to the O-linked GalNAc residue (36, 37), and this branch is extended by the addition of N-acetylglucosamine (GlcNAc) by beta-1,3-N-acetylglucosaminyltransferase 3 (B3GNT3) (37). The Core 2 branch is created by Beta-1,3-galactosyl-O-glycosyl-glycoprotein beta-1,6-N-Acetylglucosaminyltransferase 1 (GCNT1, Core 2 synthase), which attaches a GlcNAc residue to the O-linked GalNAc (38). The GlcNAc residues of the Core 1 and Core 2 branches are each modified in 3 additional ways. Galactose/N-acetylglucosamine/N-acetylglucosamine 6-O-sulfotransferase 1 (GLCNAC6ST-1) and 2 (GLCNAC6ST-2) attach sulfate onto the Core 1 and Core 2 GlcNAc residues, although GLCNAC6ST-1 acts only inefficiently to modify Core 1 (39–42). Alpha- (1, 3)-fucosyltransferase 4 (FUT4) (43) and 7 (FUT7) (44) attach fucose to both Core 1 and Core 2 GlcNAc residues. Finally, beta-1,4-galactosyltransferase (B4GALT) attaches Gal residues to GlcNAc in both branches (45), which are then further modified by CMP-N-acetylneuraminate-beta-galactosamide-alpha-2,3-sialyltransferase 1 (ST3GAL1) (46), 4 (ST3GAL4) (47), and 6 (ST3GAL6) (48), which attach N-acetylneuraminic acid (NeuAc) to Gal. This completes formation of the 6-sulfo sialyl Lewis X structure that is recognized by L-selectin expressed on naïve and central memory T- and B-cells. Image created with BioRender.com.
In adult LN, transcripts of genes encoding the scaffolding protein GlyCAM-1 (Glycam1), and the transferases B3GNT3 (B3gnt3), GCNT1 (Gcnt1), GLCNAC6ST-1 (Chst2), GLCNAC6ST-2 (Chst4), and FUT7 (Fut7) are elevated in PNAd+ compared to PNAdneg BEC, while transcripts of genes encoding the scaffolding proteins CD34 (Cd34), podocalyxin (Podxl), endomucin (Emcn), and nepmucin (Cd300lg) are comparable (49, 50). Expression of Glycam1, Gcnt1, Chst2, Chst4, and Fut7 is also dependent on continuous engagement of the lymphotoxin-β receptor (LTβR) expressed on LN BEC with lymphotoxin-α1β2 (LTα1β2) expressed on DCs (50–52), while B3gnt3 is regulated independently of LTβR signaling through an unknown pathway (50). Chst2 (53) and Chst4 (54) can also be induced in cultured monocytes and endothelial cells, respectively, by TNFα, leading to expression of PNAd, but the impact of TNFα on expression of other PNAd biosynthetic components is unknown.
Previous work from this lab demonstrated that PNAd expression on murine melanoma TEC was not induced by either DC or LTβR signaling, and was instead controlled by effector CD8 T cells secreting LTα3, which signaled through TNF receptors (TNFR) expressed on TEC (31). Here, we demonstrate that TEC expressed key PNAd glycosyl transferases and scaffolding proteins normally found in LN BEC, albeit at lower levels. We also determined the mechanisms by which TNFR regulated their expression, and that checkpoint immunotherapy augments PNAd expression on the tumor vasculature. These findings provide significant insight into the basis for PNAd biosynthesis in TEC.
Transplantable murine tumors growing intraperitoneally (I.P.) and subcutaneously (S.C.) develop CD31+ blood vessels that express PNAd (31). By immunofluorescence microscopy (IF), ~30% of CD31+ BEC pixels in LN sections co-stained for PNAd, while ~1.8% and ~0.7% of CD31+ TEC pixels in I.P. and S.C. tumor sections did so, respectively (Figure 2A). The staining intensity of PNAd+ pixels on TEC was also significantly lower than on LN BEC. However, the fraction of CD31+ pixels that were PNAd+ was significantly higher in I.P. than S.C. tumors, and their staining intensity was also significantly higher. Tyramide signal amplification enables detection of low-abundance targets by IF. In tyramide amplified sections, ~50% of CD31+ BEC pixels in LN co-stained for PNAd, while ~4% and ~1.6% of CD31+ TEC pixels in I.P. and S.C. tumors, respectively, did so (Figure 2A). PNAd staining intensity in tyramide amplified tumor sections was still significantly lower than in amplified LN sections, and still significantly higher in amplified I.P. sections than in amplified S.C. sections. By flow cytometry, which has the capacity to detect low-abundance targets on cells without amplification, PNAd was expressed at a uniformly high levels on ~30% of CD31+ LN BEC. In contrast, ~5% of I.P. CD31+ TEC stained for PNAd, and the geometric mean fluorescence intensity (gMFI) of PNAd on these cells was significantly lower and more variable relative to PNAd+ LN BEC (Figure 2). Overall, these results demonstrate that TEC express PNAd less frequently and at substantially lower levels relative to LN BEC, although TEC from I.P. tumors express PNAd more frequently and at higher levels than TEC from S.C. tumors.
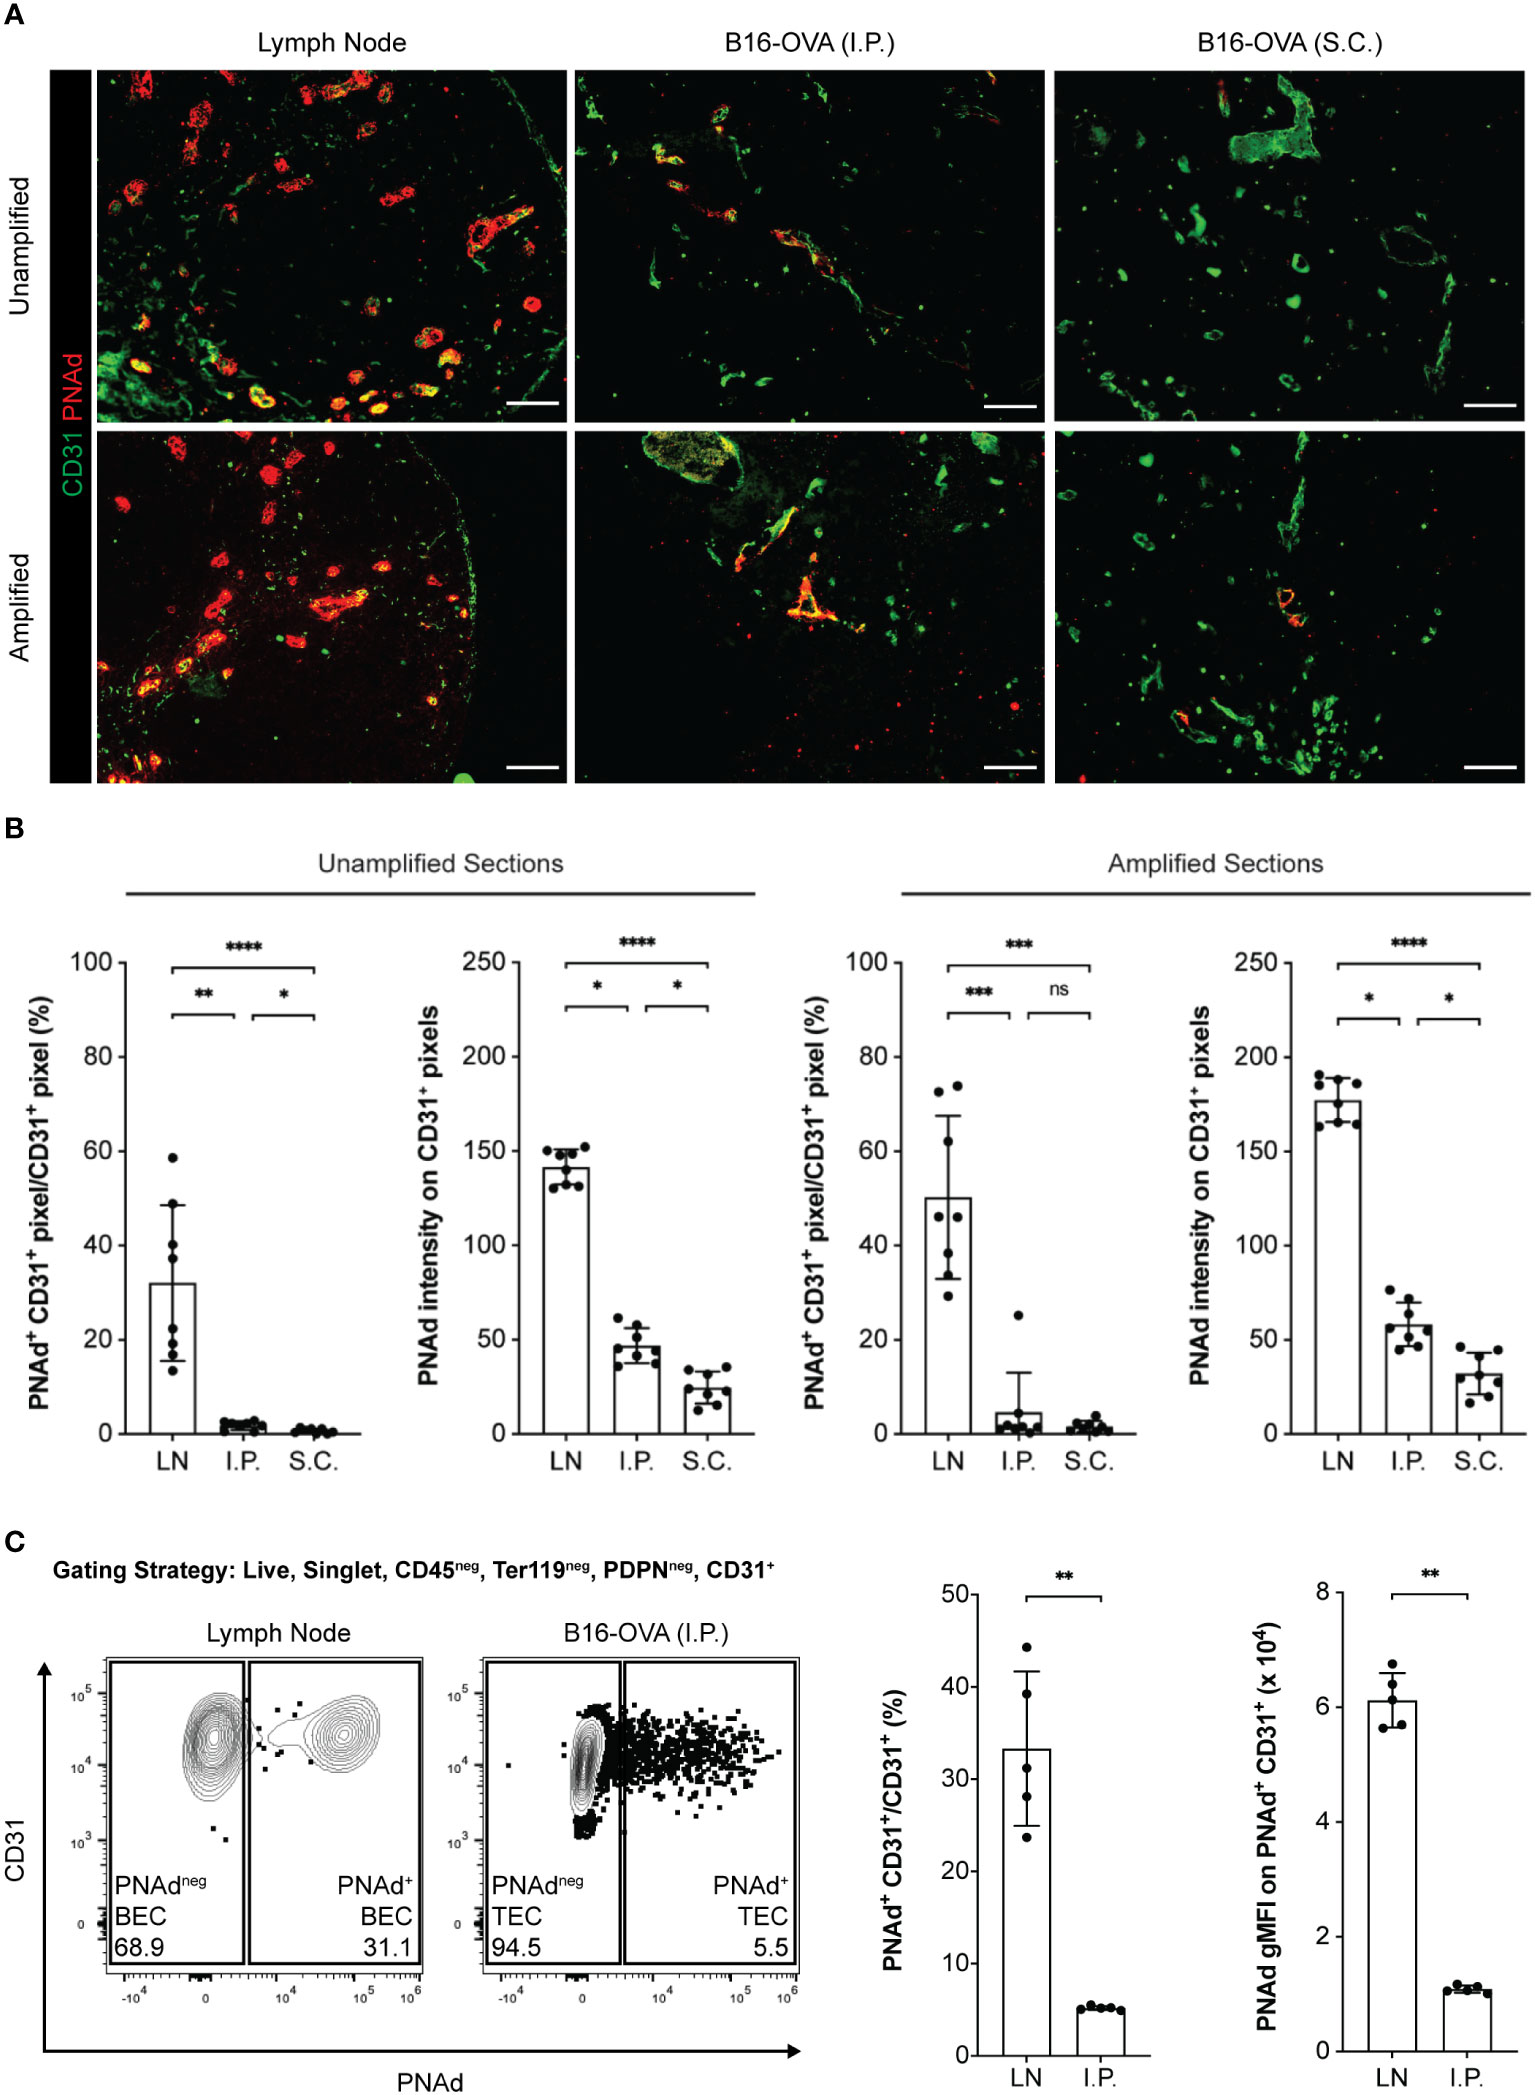
Figure 2 PNAd expression is significantly lower on tumor-associated endothelium than on lymph node endothelium. C57BL/6 mice were S.C. or I.P. injected with B16-OVA cells. Tumors were harvested 14 days later. LN were harvested from non-tumor-bearing mice. Resected tissues were prepared for IF microscopy (A, B) or flow cytometry (C) as described in Methods. (A) Representative images of unamplified and tyramide signal amplified LN and tumor sections stained with indicated markers. Scale bar = 100 µm. (B) Quantitative image summary data for unamplified and amplified tissue sections. PNAd percentages and pixel intensities were calculated on a CD31+ mask. Data represents two experiments, n = 8 sections per group. (C) Representative flow cytometry plot, percentages, and gMFI intensities of PNAd on CD45neg Ter119neg PDPNneg CD31+ endothelial cells in CD45+ depleted LN and I.P. tumors suspensions. PNAd gMFIs were calculated on cells gated above the fluorescence minus one (FMO) control. Data represents one experiment, n = 5 LN or tumors per group. (B, C) Results are mean standard deviation (SD) analyzed by unpaired Welch’s t-test. ns: p>0.05, *p<0.05, **p<0.01, ***p<0.001, and ****p<0.0001.
The lower level of PNAd on TEC might reflect lower expression of either glycosyl transferases that synthesize PNAd or scaffolding proteins that display it. We flow sorted PNAd+ and PNAdneg cells from I.P. tumors and LN and evaluated expression of these molecules by quantitative PCR (qPCR). Consistent with other work (49, 50), the glycosyl transferases Gcnt1, B3gnt3, Fut7, Chst2, and Chst4 were all expressed at significantly higher levels in PNAd+ than PNAdneg LN BEC (Figure 3). Similarly, all of these enzymes were expressed at higher levels in PNAd+ TEC than in PNAdneg TEC. With the exception of Fut7, the expression levels of these glycosyl transferases were not significantly different between PNAdneg LN BEC and PNAdneg TEC (Figure 3). However, Gcnt1, B3gnt3, Fut7, and Chst2 were expressed ~2-7-fold lower in PNAd+ TEC than in PNAd+ LN BEC (Figure 3), consistent with the 6-fold lower gMFI of surface PNAd on PNAd+ TEC (Figure 2). Most significantly, Chst4 expression was ~42-fold lower in PNAd+ TEC than in PNAd+ LN BEC. Chst4 is selectively expressed in LN high endothelial venules and the major enzyme responsible for the generation of 6-sulfo sialyl Lewis X on the Core 1 O-glycan structure of PNAd (39–42).

Figure 3 Glycosyl transferases are expressed at significantly lower levels in PNAd+ TEC than in LN PNAd+ BEC. C57BL/6 mice were I.P. injected with B16-OVA cells and tumors were harvested 14 days after implantation. LN were harvested from non-tumor-bearing mice. Endothelial cells were sorted from CD45+ depleted LN and I.P. tumor suspensions, and the expression levels of indicated RNA transcripts were determined by quantitative PCR (qPCR), as described in Methods. Data from one experiment presented as 2-ΔCT relative to Hprt, n=5 LN or I.P. tumors per group. Results are mean ± SD analyzed by unpaired Welch’s t-test. **p<0.01.
Transcript levels for scaffolding proteins Cd34 and Emcn were comparable between LN BEC and TEC, regardless of whether they expressed PNAd (Figure 4). Podxl was also expressed comparably by PNAd+ and PNAdneg cells from either LN or I.P. tumors, but the transcript levels for this molecule were significantly less in TEC than in LN BEC. On the other hand, Glycam1 and Cd300lg were more highly expressed in PNAd+ cells than in PNAdneg cells in both LN BEC and TEC, although as with Podxl, they were expressed at significantly lower levels in TEC than in LN BEC (Figure 4). The ~2-7-fold differences in expression of Podxl, Glycam1, and Cd300lg between PNAd+ LN BEC and PNAd+ TEC are again consistent with the 6-fold lower gMFI of surface PNAd on PNAd+ TEC. Collectively, these results suggest that PNAd expression on TEC is achieved by upregulation of the same subsets of glycosyl transferases and scaffolding proteins as on LN BEC. However, the magnitude of these upregulations in TEC is significantly lower in every case, and the substantially deficient upregulation of Chst4 could also affect PNAd structure.

Figure 4 Scaffolding proteins are expressed at significantly lower levels in PNAd+ TEC than in LN PNAd+ BEC. C57BL/6 mice were I.P. injected with B16-OVA cells and tumors were harvested 14 days after implantation. LN were harvested from non-tumor-bearing mice. Endothelial cells were sorted from CD45+ depleted LN and I.P. tumor suspensions, and the expression levels of indicated RNA transcripts were determined by qPCR, as described in Methods. Data from one experiment presented as 2-ΔCT relative to Hprt, n=5 LN or I.P. tumors per group. Results are mean ± SD analyzed by unpaired Welch’s t-test. **p<0.01, all other paired bar comparisons are not significant (p>0.05) and have been omitted for clarity.
PNAd expression on LN BEC depends on signaling through LTβR (31, 51, 52) but not TNFR (Figure 5). In contrast, PNAd is not detected by IF on the vasculature of I.P. tumors grown in TNFR1/2-/- mice, and its expression does not depend on LTβR signaling (31). By flow cytometry, only a small percentage of TEC from I.P. tumors grown in TNFR1/2-/- mice retained PNAd, although their surface expression level was lower than that of TEC from wild-type (WT) mice (Figure 5). This confirms that PNAd expression in most TEC depends on TNFR signaling, while a small subset of TEC apparently depends on an alternative signaling pathway. Using these cells, we determined how the loss of TNFR signaling altered expression of genes involved in PNAd biosynthesis. As expected from Figure 5, the expression of genes encoding glycosyl transferases (Figure 6) and scaffolding proteins (Figure 7) in PNAd+ and PNAdneg LN BEC was unaltered in TNFR1/2-/- mice relative to their WT counterparts. In PNAdneg TEC from I.P. tumors grown in TNFR1/2-/- mice, there was no reduction in the expression of genes encoding scaffolding proteins (Figure 7) or most glycosyl transferases, although the expression of Gcnt1 increased (Figure 6). This suggests that the TNFR-induced expression of PNAd on TEC in WT mice is a consequence of upregulation of the genes identified in Figure 3 and 4. In the small subset of PNAd+ TEC from I.P. tumors grown in TNFR1/2-/- mice, Chst2 expression was 7-fold lower, but no other biosynthetic enzyme, including Chst4, was significantly changed (Figure 6). Also, Podxl and Cd300lg expression was lower by 2- and 6-fold, respectively, and there was a trending but insignificant reduction in Glycam1 (Figure 7). These results are consistent with the possibility that an alternative signaling pathway, operating in the absence of TNFR signaling, upregulates most of the relevant genes identified in Figures 3 and 4, but is selectively deficient in its ability to upregulate Chst2, Podxl, and Cd300lg, and potentially Glycam1.
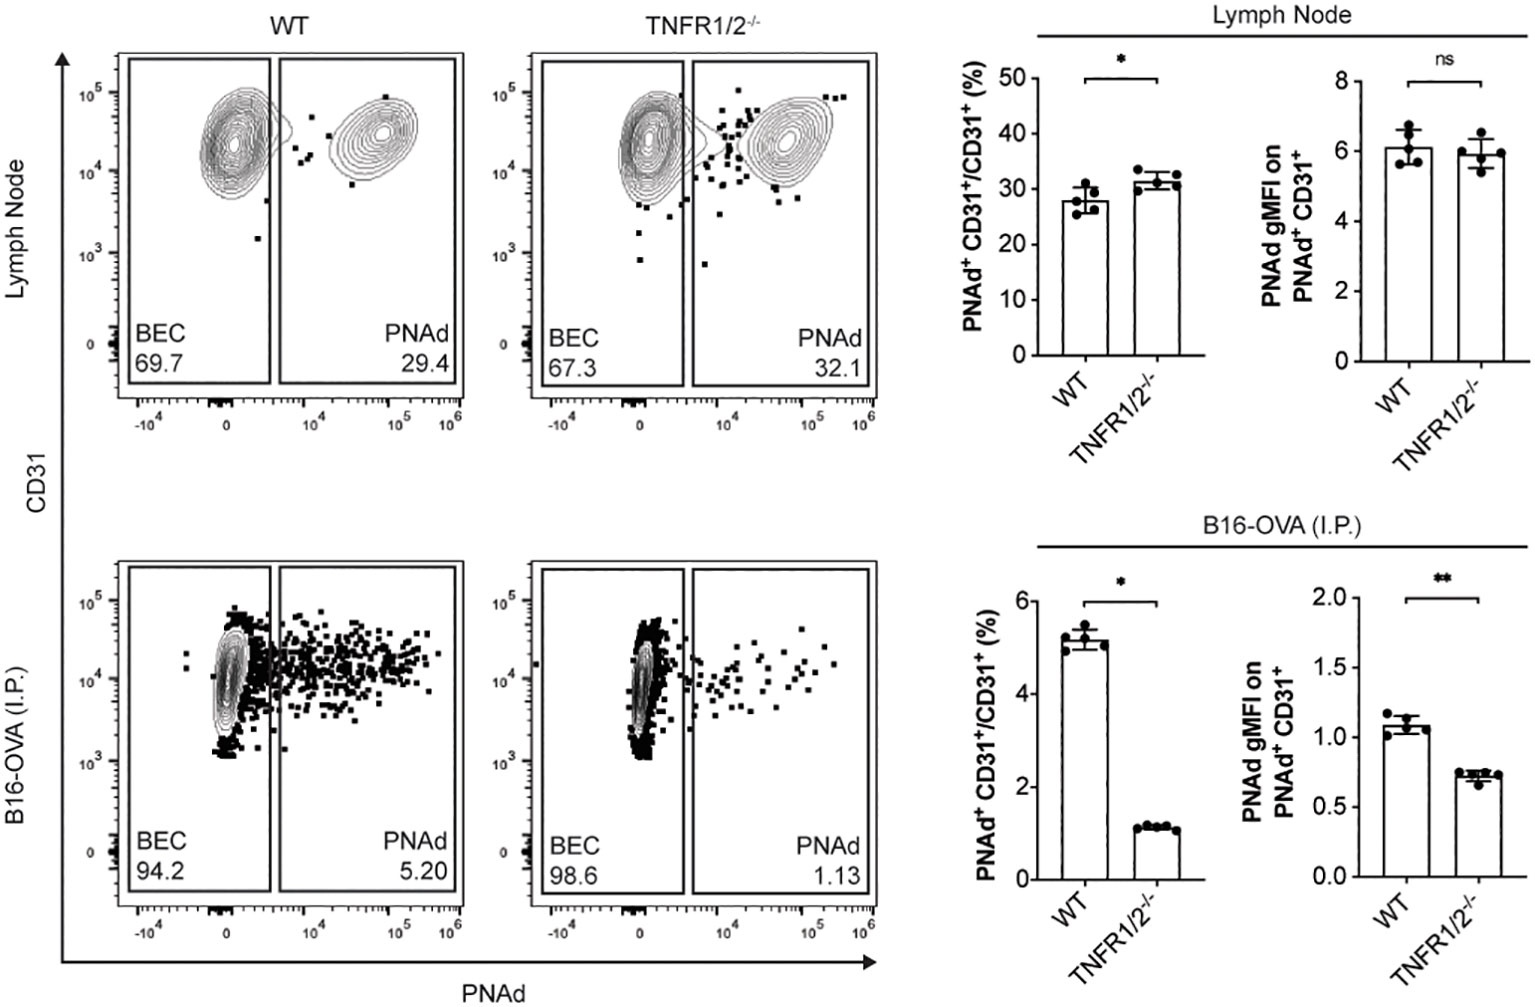
Figure 5 Tumor necrosis factor receptor signaling controls PNAd expression in most TEC but not in LN BEC. C57BL/6 WT or TNFR1/2-/- mice were I.P. injected with B16-OVA cells and tumors were harvested 14 days later. LN were harvested from non-tumor-bearing mice. Resected tissues were prepared for flow cytometry as described in Methods. Representative flow cytometry plot, percentages, and gMFI of PNAd on CD45neg Ter119neg PDPNneg CD31+ endothelial cells in CD45+ depleted LN and I.P. tumors suspensions. PNAd gMFIs were calculated on cells gated above FMO control. Data represents one experiment, n = 5 LN or tumors per group. Results are mean ± SD analyzed by unpaired Welch’s t-test. ns: p>0.05, *p<0.05, **p<0.01.
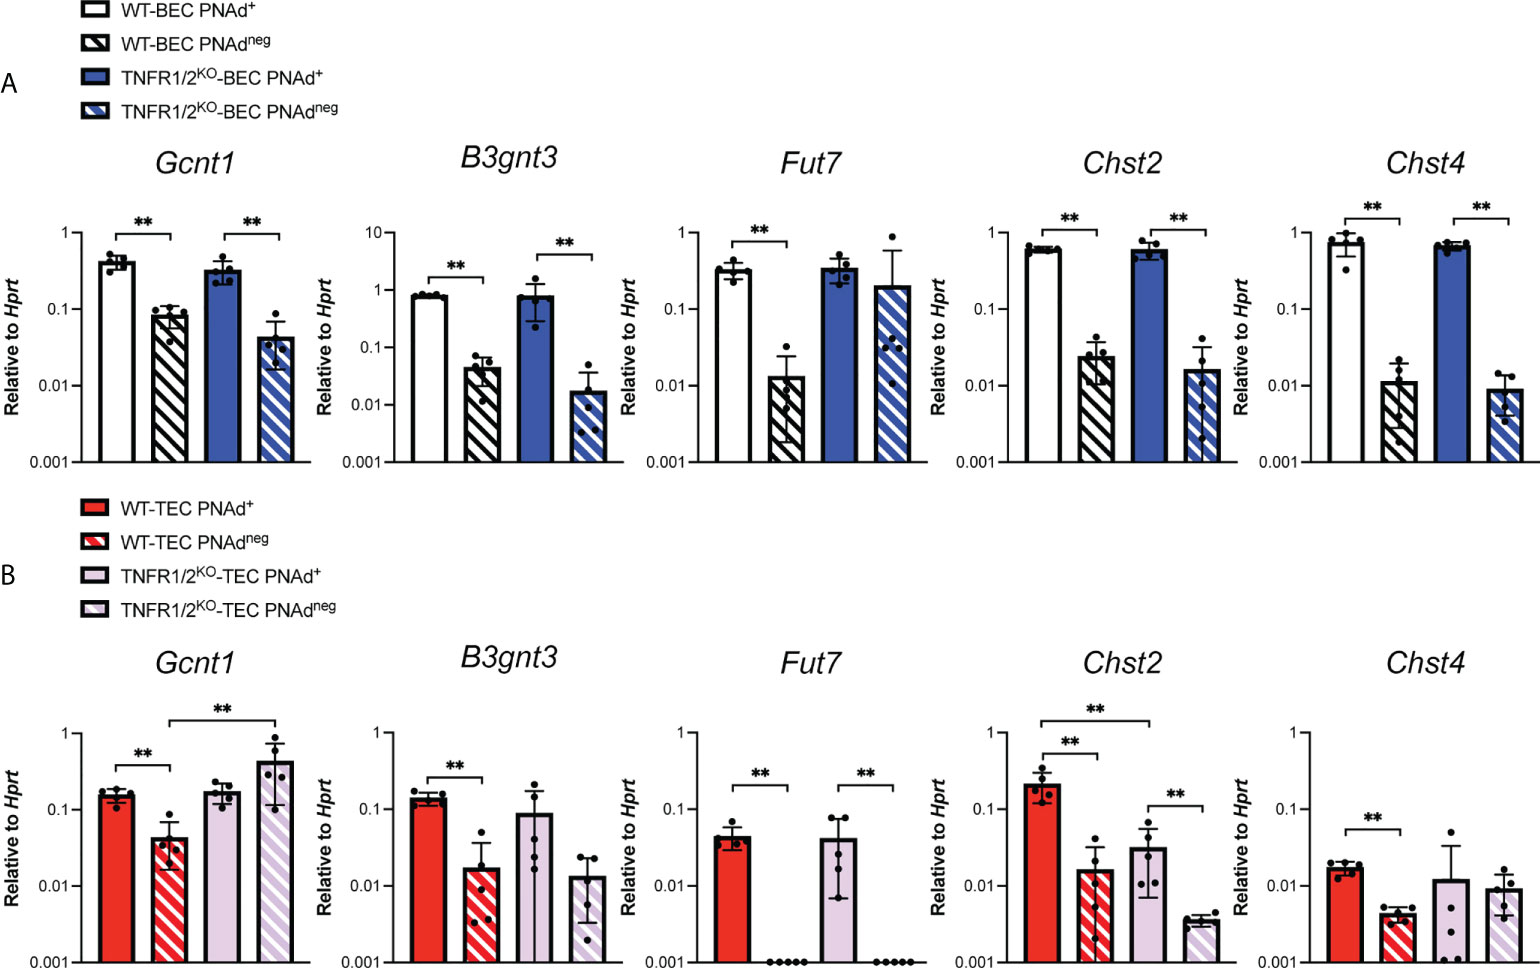
Figure 6 Tumor necrosis factor receptor signaling regulates Chst2 expression in PNAd+ TEC. C57BL/6 WT or TNFR1/2-/- mice were I.P. injected with B16-OVA cells and tumors were harvested 14 days after implantation. LN were harvested from non-tumor-bearing mice. (A, B) Endothelial cells were sorted from CD45+ depleted LN and I.P. tumor suspensions, and the expression levels of indicated RNA transcripts were determined by qPCR, as described in Methods. Data from one experiment presented as 2-ΔCT relative to Hprt, n=5 LN or I.P. tumors per group. (A, B) Results are mean ± SD analyzed by unpaired Welch’s t-test. **p<0.01, all other paired bar comparisons are not significant (p>0.05) and have been omitted for clarity.
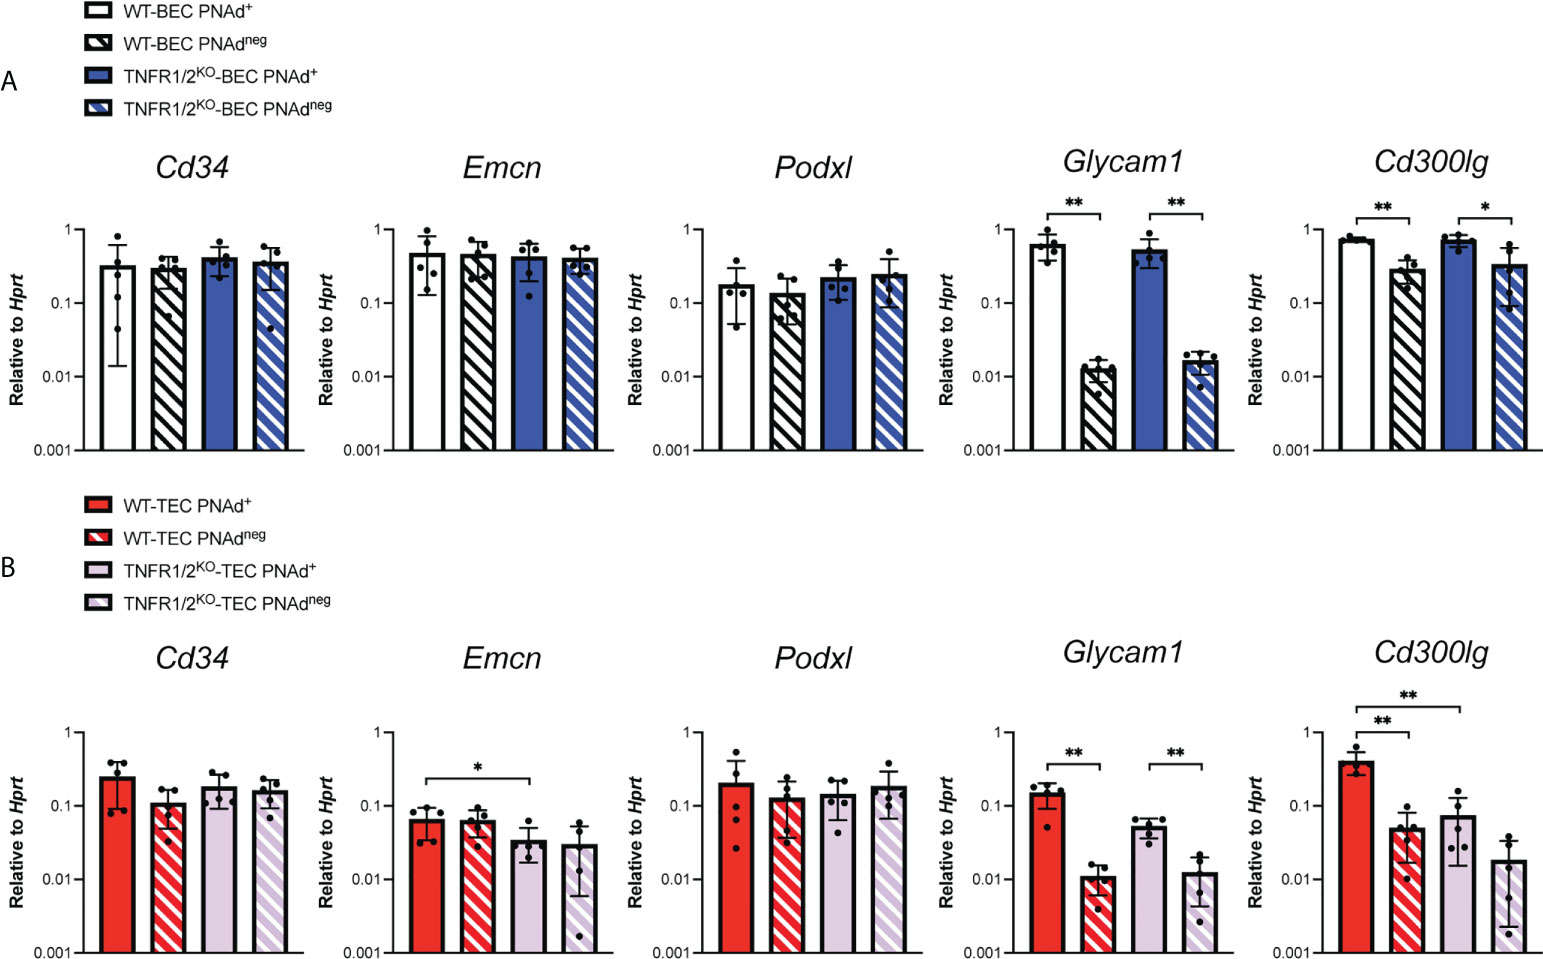
Figure 7 Tumor necrosis factor receptor signaling regulates Podxl and Cd300lg expression in PNAd+ TEC. C57BL/6 WT or TNFR1/2-/- mice were I.P. injected with B16-OVA cells and tumors were harvested 14 days after implantation. LN were harvested from non-tumor-bearing mice. (A, B) Endothelial cells were sorted from CD45+ depleted LN and I.P. tumor suspensions, and the expression levels of indicated RNA transcripts were determined by qPCR, as described in Methods. Data from one experiment presented as 2-ΔCT relative to Hprt, n=5 LN or I.P. tumors per group. (A-B) Results are mean ± SD analyzed by unpaired Welch’s t-test. *p<0.05, **p<0.01, all other paired bar comparisons are not significant (p>0.05) and have been omitted for clarity.
Checkpoint immunotherapy has also been associated with enhanced expression of HR ligands on the tumor vasculature, such as ICAM-1 and VCAM-1 (55, 56). To determine whether checkpoint immunotherapy altered the expression of PNAd on tumor vasculature, we treated I.P. tumor-bearing WT mice with either anti-PD-L1 monotherapy or the combination of anti-CTLA4 and anti-PD1 and analyzed PNAd expression after 14 days of outgrowth. Both treatments significantly increased the percentage of CD31+ TEC pixels that co-stained with PNAd (Figures 8A, B). Also, the staining intensity of PNAd on CD31+ TEC pixels was significantly higher in treated tumors. Despite these increases, PNAd staining remained localized with tumor associated tertiary lymphoid structures (TA-TLS), and was not found on non-TA-TLS associated vasculature (57). Previously, we demonstrated that checkpoint immunotherapy augmented the number of T-cells in I.P. tumors (57). Since PNAd expression in I.P. tumors depends on effector CD8 T cells secreting LTα3 (31), these results suggest that checkpoint immunotherapy augments PNAd expression on the tumor vasculature by increasing the representation of CD8 T cells secreting LTα3 in tumors, which in turn enhances the expression of PNAd associated components.
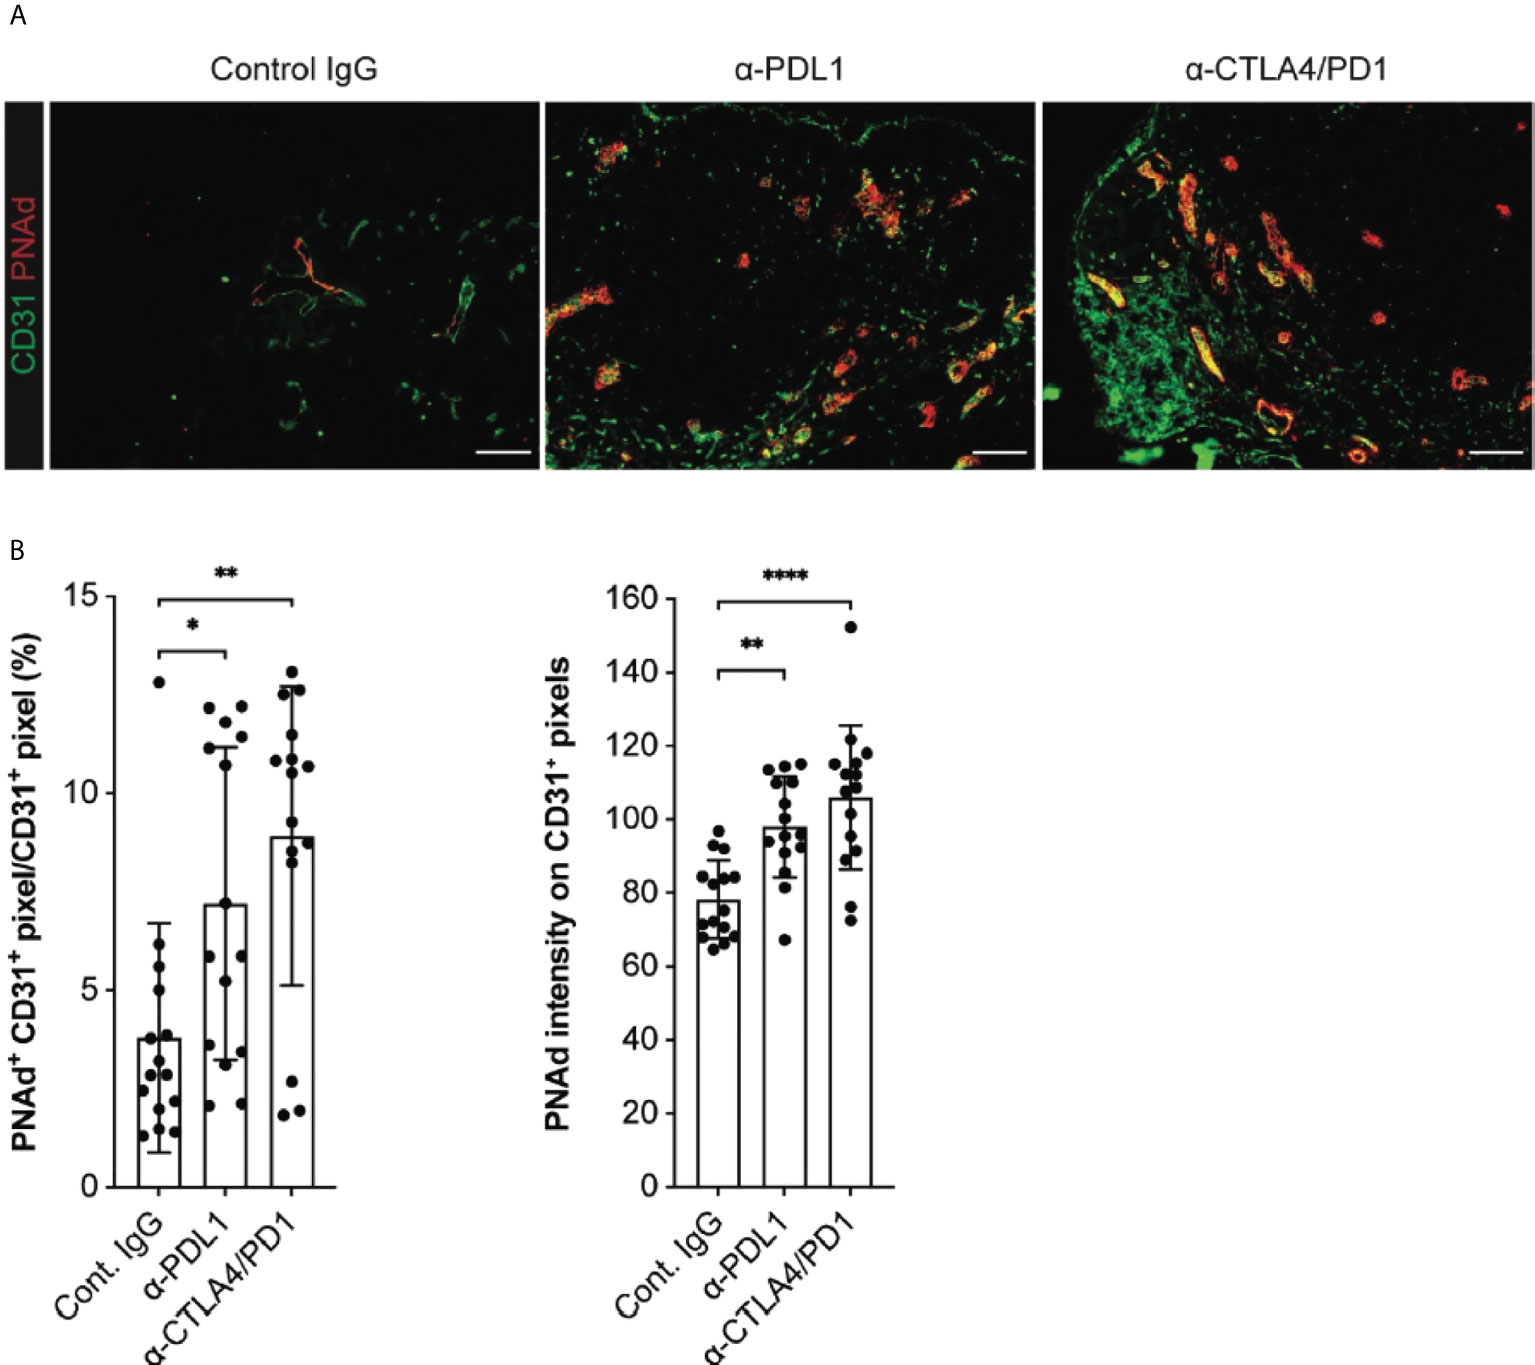
Figure 8 Checkpoint immunotherapy augments PNAd expression on I.P. tumor vasculature. C57BL/6 mice were I.P. injected with B16-OVA cells and tumor-bearing mice were treated with control IgG, anti-PDL1, or anti-CTLA4/PD1 beginning 3 days after implantation. Tumors were harvested 14 days after implantation and prepared for IF as described in Methods. (A) Representative images of tyramide signal amplified tumor sections stained with indicated markers. Scale bar = 100 µm. (B) Quantitative image summary data for amplified tissue sections. PNAd percentages and pixel intensities were calculated on a CD31+ mask. Data represents three experiments, n = 15 individual sections per group. (B) Results are mean ± SD analyzed by unpaired Welch’s t-test. *p<0.05, **p<0.01, and ****p<0.0001, all other paired bar comparisons are not significant (p>0.05) and have been omitted for clarity.
In this report, we identified differences in the expression of genes encoding scaffolding proteins and glycosyl transferases involved in biosynthesis of PNAd that could account for its lower expression level in TEC, and its dependence on TNFR signaling. We found that TEC and LN BEC upregulated the same subsets of molecules in association with PNAd expression, but the extent of upregulation was less in PNAd+ TEC than in LN PNAd+ BEC, consistent with the lower level expression of PNAd on tumor endothelium. The glycosyl sulfotransferase Chst4 was particularly poorly induced, likely contributing to a significant underrepresentation of mature 6-sulfo sialyl Lewis X glycans on both Core 1 and Core 2 branches. Previously, we demonstrated that PNAd expression on the tumor vasculature was controlled by a mechanism involving intratumoral effector CD8 T cells secreting LTα3, which signaled through TNFR on TEC (31). Here, we showed that loss of TNFR signaling led to PNAdneg cells that were indistinguishable from their WT counterparts, suggesting that TNFR signaling regulates the same PNAd associated genes as LTβR signaling in LN BEC. However, we also found a remnant population of PNAd+ TEC with normally upregulated expression of most of these genes, but impaired upregulation of genes encoding the scaffolding proteins Podxl and Cd300lg and the glycosyl sulfotransferase Chst2, suggesting the operation of a 3rd pathway for PNAd induction. Finally, we showed that the percentage of PNAd+ TEC and their surface expression level were increased by checkpoint immunotherapy treatment. This work provides insight into the mechanisms regulating PNAd biosynthesis in TEC and provides a platform to enhance its expression to support a continual influx of naïve cells, sustaining anti-tumor immunity.
Our results provide new insights into the control of the biosynthetic pathway leading to expression of 6-sulfo-sialyl Lewis X on TEC. We found that B3gnt3, Gcnt1, Fut7, Chst2, and Chst4 were expressed at higher levels in PNAd+ TEC relative to their PNAdneg counterparts. This is consistent with their elevated expression in PNAd+ vs. PNAdneg LN BEC (49, 50), and their essential roles in PNAd biosynthesis in these cells (33). However, while Chst2 and Chst4 were comparably expressed in PNAd+ LN BEC, Chst4 was significantly under expressed relative to Chst2 in PNAd+ TEC. Previous studies using knockout mice have established that Chst2 and Chst4 play complementary and partially redundant roles in PNAd expression in LN (39, 40). Chst4 is primarily responsible for PNAd that is expressed on the luminal endothelial surface (39), while Chst2 contributes to PNAd expressed on both luminal and abluminal surfaces (40–42). Our previous observation of PNAd expression on both surfaces of tumor endothelium (31) is consistent with the very low level of Chst4 expression in TEC, and suggests that Chst2 is largely responsible for synthesizing 6-sulfo-sialyl Lewis X in TEC. The MECA-79 antibody detects 6-sulfo-sialyl Lewis X in the Core 1, but not Core 2, O-glycan biantennary branch (37). Since Chst2 mediates GlcNAc sulfation on the Core 1 branch inefficiently (41), the levels of 6-sulfo-sialyl Lewis X on TEC may be higher than is suggested by MECA-79. PNAd structures on TEC may also be largely “single-armed”, with only Core 2 derivatized by 6-sulfo-sialyl Lewis X. Regardless, PNAd expression on Peyer’s Patch endothelium is entirely dependent on Chst2 (39, 40). This, together with our earlier work (31, 32), demonstrates that these structures support naïve lymphocyte entry.
We found that PNAd+ TEC and LN BEC also express similar scaffolding proteins that have been shown to display PNAd and regulate them similarly. Cd34 and Emcn were expressed comparably by PNAd+ and PNAdneg endothelial cells from both LN and I.P. tumors. In contrast, Podxl expression also did not differ between PNAd+ and PNAdneg endothelial cells in either tissue, but its overall level of expression was substantially higher in LN BEC than TEC. Finally, Glycam1 and Cd300lg were expressed at higher levels in PNAd+ than in PNAdneg cells in both tissues, and again, the transcript levels for these molecules were significantly less in PNAd+ TEC than in PNAd+ LN BEC. These scaffolding proteins are redundant with one another in PNAd display, and at least partially redundant in promoting L-selectin engagement with PNAd, as mice deficient in Cd34 (58) or Glycam1 (33) show no impaired trafficking of naïve T cells to peripheral LN. However, together with the lower expression levels of multiple glycosyl transferases, particularly Chst4, the overall lower level of Podxl, Glycam1, and Cd300lg in PNAd+ TEC may also contribute to the lower level of PNAd expression on the tumor vasculature.
This report also identified components of the PNAd biosynthesis pathway in TEC that are regulated by TNFR signaling. The number of PNAd+ TEC is reduced by about 80% in TNFR1/2-/- mice. The resulting PNAdneg cells showed no reduction in any evaluated glycosyl transferases or scaffolding proteins and are thus indistinguishable from their counterparts in tumors from WT mice. By comparison of gene expression in PNAd+ and PNAdneg LN BEC and TEC, this suggests that TNFR signaling induces PNAd by acting on the same genes as LTβR signaling does in LN BEC, albeit less efficiently, and with a particular deficiency in upregulation of Chst4. However, a small percentage of TEC from these tumors continue to express a lower level of PNAd. These cells selectively express lower levels of Chst2, Podxl, and Cd300lg, and potentially Glycam1, all of which are also elevated in PNAd+ cells vs PNAdneg cells from WT mouse tumors. It is possible that TEC that retain PNAd in the absence of TNFR signaling are responsive to signals from LTβR as an alternative. However, in PNAd+ LN BEC, LTβR signaling upregulates Chst2 and Glycam1, but also Gcnt1, Chst4, Fut7, and not Podxl or Cd300lg (51, 52). This difference in response pattern seems inconsistent with the hypothesis that the remnant fraction of PNAd+ TEC in TNFR1/2-/- mice are regulated by LTβR signaling. Nonetheless, these results demonstrate a distinct regulation of PNAd biosynthetic components by TNFR1/2 and LTβR signaling. the mutually exclusive responses of LN BEC and TEC to these two different signals also point to important anatomic microenvironmental controls on endothelial cell signaling responsiveness.
Related to this, the reasons that all evaluated PNAd glycosyl transferases and several scaffolding proteins are expressed at significantly lower levels in PNAd+ TEC than in LN PNAd+ BEC are unclear. It is possible that this reflects the relative efficiency with which the TNFR and LTβR signaling pathways engage transcription factors that upregulate these genes. On the other hand, several studies have also shown that the epigenetic profile of BEC is different from TEC (reviewed in (59). Two studies demonstrated that human umbilical vein endothelial cells cultured with conditioned tumor media underwent epigenetic modifications that resulted in reduced VCAM-1 and ICAM-1 expression (60, 61). Thus, epigenetic modifications that occur in the tumor microenvironment could also reduce upregulation of PNAd associated components in TEC. Finally, it is possible that this is controlled by the immunosuppressive microenvironment of the tumor. In murine methylcholanthrene-induced fibrosarcoma, regulatory T cells have been shown to limit PNAd expression on tumor vessels (62, 63), although the mechanism of action is unknown. Conversely, checkpoint immunotherapy has been associated with enhanced expression of HR ligands, such as ICAM-1 and VCAM-1, on tumor vasculature (55, 56), and we found that anti-PD-L1 monotherapy or the combination of anti-CTLA4 and anti-PD1 enhanced the fraction of CD31+ TEC expressing PNAd and their surface levels of PNAd. However, the fraction of PNAd+ CD31+ TEC and their PNAd expression level in treated tumors still did not reach that of LN BEC. In related work, we demonstrated that these therapies also led to an increase in the number and size of TA-TLS, but we found no evidence for PNAd expression on non-TA-TLS associated tumor vasculature (57). Since PNAd expression in I.P. tumors depends on effector CD8 T cells secreting LTα3 (31), and these therapies also enhanced the representation of T-cells in I.P. tumors (57), this suggests that immunotherapy-augmented PNAd expression on the tumor vasculature is driven by an increased number of intratumoral CD8 T cell effectors secreting LTα3. It also suggests that the increased fraction of TEC expressing PNAd create nucleation sites for the formation of new TA-TLS, or the expansion of existing ones. Determining the factors that limit the expression of PNAd scaffolding proteins and glycosyl transferases could identify targets for enhancing the expression of these molecules to enhance naïve and central memory cell infiltration into tumors, promote the development and/or expansion of tertiary lymphoid structures, and augment anti-tumor immunity.
Female C57BL/6 mice were from the National Cancer Institute. TNFR1/2-/- mice were from the Jackson Laboratory. All mice were bred and maintained in specific pathogen-free conditions. All experiments were carried out on female mice that were ~8-12 weeks of age. All protocols and experiments were approved by the University of Virginia Institutional Animal Care and Use Committee.
B16-OVA mouse melanoma cells expressing recombinant ovalbumin has previously been described (64). B16-OVA tumor cells were cultured at 37°C and 5% CO2 in RPMI-1640 (Corning) containing 10% (v/v) fetal bovine serum, 2 mM L-glutamine (ThermoFisher Scientific), and 15 mM HEPES (ThermoFisher Scientific).
Tumor cells (4 x 10⁵) were I.P. or S.C. (loose neck scruff) injected into mice and allowed to establish for 14 days prior to harvest. For checkpoint immunotherapy experiments, either monotherapy anti-PDL1 (250 µg per injection, 10F.9G2, BioXcell) or dual therapy anti-PD1 (250 µg per injection, RMP1-14, BioXcell) and anti-CTLA4 (250 µg per injection, 9D9, BioXcell) was injected I.P. into tumor-bearing mice three days after tumor implantation and then every three days until tumor harvest.
Resected LN and tumors were minced and digested with a solution of 0.1 mg/ml DNase I (Sigma), 0.8 mg/ml Collagenase Dispase (Sigma), and 0.2 mg/ml Collagenase P (Sigma) for 30 minutes at 37°C. Every 5 minutes, tissue suspensions were pipetted up-and-down several times. Digested tissues were depleted of red blood cells using RBC Lysing Buffer Hybri-Max (Sigma) according to manufacturer’s instructions.
Digested tumor suspensions were depleted of hematopoietic cells using CD45 magnetic beads (Miltenyi Biotec) on an AutoMACS Pro Separator (Miltenyi Biotec) according to manufacturer’s instructions. CD45+ depleted suspensions were stained with biotinylated anti-CD31 (0.5 µg/mL) for 15 minutes at 4°C and enriched using anti-biotin magnetic beads (Miltenyi Biotec) on an AutoMACS Pro Separator according to manufacturer’s instructions. BEC and TEC were sorted to highest purity according to the procedure below.
Cell surface staining was done in PBS containing 2% FBS, 2 mM EDTA (Sigma), and 2 mM NaN3 (Sigma) for 30 minutes at 4°C. Live/Dead Aqua (Invitrogen) or 4,6-diamidino-2-phenylindole (Sigma) were used to exclude dead cells from analysis. Endothelial cells were defined as live, singlet, Ter119neg, CD45neg, PDPNneg, CD31+. Samples were run on a FACSCanto II (BD) or Attune NxT (ThermoFisher/Invitrogen) and analyzed using FlowJo Software (BD Bioscience). For qPCR experiments, pre-enriched endothelial cell populations were sorted on an Influx Cell Sorter (BD) directly into RNAlater Stabilization Solution (ThermoFischer Scientific) or PBS. A small aliquot of the sorted population was re-run to determine ~95% purity.
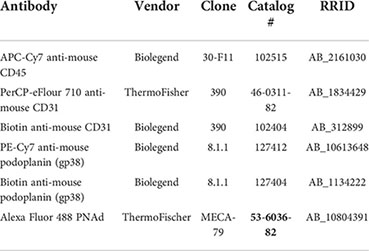
Preparation of tumor tissue for IF microscopy using formalin fixation and cutting frozen blocks on a -20°C cryostat has previously been described (65). Tumor sections were incubated in 100% methanol for 10 minutes at -20°C. Then, slides were immersed in PBS for 10 minutes at room temperature. For Fc blocking, tumor sections were incubated with 0.5 μg/mL anti-CD16/32 (BioXcell; Clone:2.4G2) unconjugated antibody in PBS containing 5% BSA (Sigma) and 0.3% Triton X-100 (Sigma) for 15 minutes at room temperature. Endogenous biotin in tumor sections was blocked using the Avidin/Biotin Blocking kit (Vector Laboratories) according to manufacturer’s instructions. Endogenous peroxidases in tumor sections were quenched with PBS containing 3% hydrogen peroxide and 0.1% (w/v) sodium azide for 45 minutes at room temperature. Tumor sections were incubated overnight at 4°C with primary antibodies in either PBS containing 3% hydrogen peroxide and 0.1% (w/v) sodium azide or TNB Blocking Buffer (PerkinElmer) if performing tyramide signal amplification. The TSA Biotin Kit (Perkin Elmer) was used according to manufactures instructions to amplify biotinylated labelled tumor sections. Tumor sections are counterstained with fluorescently conjugated secondary antibodies and/or streptavidin in PBS containing 3% hydrogen peroxide and 0.1% (w/v) sodium azide for 2 hours at room temperature. Prior to imaging, tumor sections are mounted with ProLong Gold Antifade Mountant with or without DAPI (ThermoFisher Scientific).
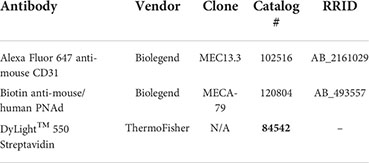
One section per tumor was evaluated and all images were captured on an AxioImager with Apotome (Zeiss). Fluorescence minus one (FMO) or isotype staining controls were used to establish thresholds and exposure times to visualize positive signals while minimizing background fluorescence. Fifteen-20 low magnification images per tumor section were captured and stitched together using ImageJ Software (NIH) to create an image of the entire tumor section. Values across respective regional images were averaged together for each tumor section. In all experiments, the quantification of CD31+ and PNAd+ areas were performed using ImageJ software (NIH) on original fluorescence images taken at identical exposures. Consistent thresholds were applied to each image to identify CD31+ and PNAd+ pixels. The percentages and gMFI of PNAd+ pixels within the region of interest of CD31+ area was calculated using ImageJ Software (NIH). For image presentation, brightness and contrast were linearly adjusted and color-merged images were generated using Photoshop CS6 Software (Adobe).
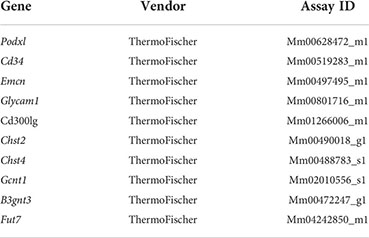
RNA was purified from flow sorted endothelial cells using RNEasy kits (Qiagen). High-Capacity cDNA Reverse Transcription Kit (Applied Biosystems) and purified RNA was used to generate cDNA. Amplification was performed using TaqMan Fast Advanced Master Mix (Applied Biosystems) and QuantStudio 6 Flex Real-Time PCR system (Applied Biosystems) with the following program: 50°C for 2 minutes; 95°C for 2 minutes; 40 cycles of 95°C for 1 second, 60°C for 20 seconds.
Statistical details of each experiment in this work are reported in the figure legends. Normality of data distribution was determined by D’Agostino-Pearson omnibus normality test and variance between groups was assessed by the F-test. P-values for the comparison between two independent groups were calculated by Welch’s t-test. Error bars shown in graphical data represents mean ± standard deviation (S.D.) for normally distributed data. P<0.05 was considered statistically significant. All statistics were calculated using Graph Pad Prism version 7.0, R version 4, and the SAS software suite version 9.4.
The original contributions presented in the study are included in the article/supplementary material. Further inquiries can be directed to the corresponding author.
The animal study was reviewed and approved by University of Virginia Institutional Animal Care and Use Committee.
Experiments involving tumor implantation, flow cytometry, endothelial cell sorting, and quantitative PCR were performed and analyzed by AR and GP. Immunofluorescence image capture and analysis were performed by AR. VE supervised all experiments associated with this project and participated in experimental design and interpretation of results. All authors contributed to the article and approved the submitted version.
This work was supported by the United States Public Health Service (USPHS) Grants CA78400 and CA181794, the University of Virginia (UVA) Cancer Center Schiff Foundation Grant, USPHS Immunology Training Grant AI007496, USPHS Cancer Center Support Grant P30 CA44579, and a Robert Wagner Fellowship from the University of Virginia School of Medicine.
We thank all the members of Dr. Victor H. Engelhard and Dr. Andrew Dudley laboratories for insightful discussion and suggestions. We also thank Dr. Kenneth Tung and members of his laboratory for aid in developing immunofluorescence protocols for capturing PNAd expression on tumor endothelial cells. Lastly, we thank the University of Virginia School of Medicine Histology Core for tissue sectioning and the Flow Cytometry Core for cell sorting experiments.
The authors declare that the research was conducted in the absence of any commercial or financial relationships that could be construed as a potential conflict of interest.
All claims expressed in this article are solely those of the authors and do not necessarily represent those of their affiliated organizations, or those of the publisher, the editors and the reviewers. Any product that may be evaluated in this article, or claim that may be made by its manufacturer, is not guaranteed or endorsed by the publisher.
1. Ley K, Laudanna C, Cybulsky MI, Nourshargh S. Getting to the site of inflammation: the leukocyte adhesion cascade updated. Nat Rev Immunol (2007) 7(9):678–89. doi: 10.1038/nri2156
2. Yamada M, Yanaba K, Hasegawa M, Matsushita Y, Horikawa M, Komura K, et al. Regulation of local and metastatic host-mediated anti-tumour mechanisms by l-selectin and intercellular adhesion molecule-1. Clin Exp Immunol (2006) 143(2):216–27. doi: 10.1111/j.1365-2249.2005.02989.x
3. Sasaki K, Zhu X, Vasquez C, Nishimura F, Dusak JE, Huang J, et al. Preferential expression of very late antigen-4 on type 1 CTL cells plays a critical role in trafficking into central nervous system tumors. Cancer Res (2007) 67(13):6451–8. doi: 10.1158/0008-5472.CAN-06-3280
4. Buckanovich RJ, Facciabene A, Kim S, Benencia F, Sasaroli D, Balint K, et al. Endothelin b receptor mediates the endothelial barrier to T cell homing to tumors and disables immune therapy. Nat Med (2008) 14(1):28–36. doi: 10.1038/nm1699
5. Fisher DT, Chen Q, Skitzki JJ, Muhitch JB, Zhou L, Appenheimer MM, et al. IL-6 trans-signaling licenses mouse and human tumor microvascular gateways for trafficking of cytotoxic T cells. J Clin Invest (2011) 121(10):3846–59. doi: 10.1172/JCI44952
6. Bose A, Taylor JL, Alber S, Watkins SC, Garcia JA, Rini BI, et al. Sunitinib facilitates the activation and recruitment of therapeutic anti-tumor immunity in concert with specific vaccination. Int J Cancer (2011) 129(9):2158–70. doi: 10.1002/ijc.25863
7. Mikucki ME, Fisher DT, Matsuzaki J, Skitzki JJ, Gaulin NB, Muhitch JB, et al. Non-redundant requirement for CXCR3 signaling during tumoricidal T-cell trafficking across tumour vascular checkpoints. Nat Commun (2015) 6:7458. doi: 10.1038/ncomms8458
8. Weishaupt C, Munoz KN, Buzney E, Kupper TS, Fuhlbrigge RC. T-Cell distribution and adhesion receptor expression in metastatic melanoma. Clin Cancer Res (2007) 13(9):2549–56. doi: 10.1158/1078-0432.CCR-06-2450
9. Clark RA, Huang SJ, Murphy GF, Mollet IG, Hijnen D, Muthukuru M, et al. Human squamous cell carcinomas evade the immune response by down-regulation of vascular e-selectin and recruitment of regulatory T cells. J Exp Med (2008) 205(10):2221–34. doi: 10.1084/jem.20071190
10. Dengel LT, Norrod AG, Gregory BL, Clancy-Thompson E, Burdick MD, Strieter RM, et al. Interferons induce CXCR3-cognate chemokine production by human metastatic melanoma. J Immunother (2010) 33(9):965–74. doi: 10.1097/CJI.0b013e3181fb045d
11. Kunz M, Toksoy A, Goebeler M, Engelhardt E, Bröcker E, Gillitzer R. Strong expression of the lymphoattractant c-X-C chemokine mig is associated with heavy infiltration of T cells in human malignant melanoma. J Pathol (1999) 189(4):552–8. doi: 10.1002/(SICI)1096-9896(199912)189:4<552::AID-PATH469>3.0.CO;2-I
12. Garbi N, Arnold B, Gordon S, Hämmerling GJ, Ganss R. CpG motifs as proinflammatory factors render autochthonous tumors permissive for infiltration and destruction. J Immunol (2004) 172(10):5861–9. doi: 10.4049/jimmunol.172.10.5861
13. Hensbergen PJ, Wijnands PG, Schreurs MW, Scheper RJ, Willemze R, Tensen CP. The CXCR3 targeting chemokine CXCL11 has potent antitumor activity in vivo involving attraction of CD8+ T lymphocytes but not inhibition of angiogenesis. J Immunother (2005) 28(4):343–51. doi: 10.1097/01.cji.0000165355.26795.27
14. Musha H, Ohtani H, Mizoi T, Kinouchi M, Nakayama T, Shiiba K, et al. Selective infiltration of CCR5(+)CXCR3(+) T lymphocytes in human colorectal carcinoma. Int J Cancer (2005) 116(6):949–56. doi: 10.1002/ijc.21135
15. Quezada SA, Peggs KS, Simpson TR, Shen Y, Littman DR, Allison JP. Limited tumor infiltration by activated T effector cells restricts the therapeutic activity of regulatory T cell depletion against established melanoma. J Exp Med (2008) 205(9):2125–38. doi: 10.1084/jem.20080099
16. Lohr J, Ratliff T, Huppertz A, Ge Y, Dictus C, Ahmadi R, et al. Effector T-cell infiltration positively impacts survival of glioblastoma patients and is impaired by tumor-derived TGF-β. Clin Cancer Res (2011) 17(13):4296–308. doi: 10.1158/1078-0432.CCR-10-2557
17. Schrama D, thor Straten P, Fischer WH, McLellan AD, Bröcker EB, Reisfeld RA, et al. Targeting of lymphotoxin-α to the tumor elicits an efficient immune response associated with induction of peripheral lymphoid-like tissue. Immunity (2001) 14(2):111–21. doi: 10.1016/S1074-7613(01)00094-2
18. Schrama D, Voigt H, Eggert AO, Xiang R, Zhou H, Schumacher TNM, et al. Immunological tumor destruction in a murine melanoma model by targeted LTalpha independent of secondary lymphoid tissue. Cancer Immunol Immunother (2008) 57(1):85–95. doi: 10.1007/s00262-007-0352-x
19. Yu P, Lee Y, Liu W, Chin RK, Wang J, Wang Y, et al. Priming of naive T cells inside tumors leads to eradication of established tumors. Nat Immunol (2004) 5:141–9. doi: 10.1038/ni1029
20. Kirk CJ, Hartigan-O’Connor D, Nickoloff BJ, Chamberlain JS, Giedlin M, Aukerman L, et al. T Cell-dependent antitumor immunity mediated by secondary lymphoid tissue chemokine augmentation of dendritic cell-based immunotherapy. Cancer Res (2001) 61(5):2062–70.
21. Turnquist HR, Lin X, Ashour AE, Hollingsworth MA, Singh RK, Talmadge JE, et al. CCL21 induces extensive intratumoral immune cell infiltration and specific anti-tumor cellular immunity. Int J Oncol (2007) 30(3):631–9. doi: 10.3892/ijo.30.3.631
22. Kirk CJ, Hartigan-O’Connor D, Mule JJ. The dynamics of the T-cell antitumor response: chemokine-secreting dendritic cells can prime tumor-reactive T cells extranodally. Cancer Res (2001) 61(24):8794–802.
23. Girard JP, Moussion C, Förster R. HEVs, lymphatics and homeostatic immune cell trafficking in lymph nodes. Nat Rev Immunol (2012) 12(11):762–73. doi: 10.1038/nri3298
24. de Chaisemartin L, Goc J, Damotte D, Validire P, Magdeleinat P, Alifano M, et al. Characterization of chemokines and adhesion molecules associated with T cell presence in tertiary lymphoid structures in human lung cancer. Cancer Res (2011) 71(20):6391–9. doi: 10.1158/0008-5472.CAN-11-0952
25. Coppola D, Nebozhyn M, Khalil F, Dai H, Yeatman T, Loboda A, et al. Unique ectopic lymph node-like structures present in human primary colorectal carcinoma are identified by immune gene array profiling. Am J Pathol (2011) 179(1):37–45. doi: 10.1016/j.ajpath.2011.03.007
26. Martinet L, Garrido I, Filleron T, Le Guellec S, Bellard E, Fournie JJ, et al. Human solid tumors contain high endothelial venules: association with T- and b-lymphocyte infiltration and favorable prognosis in breast cancer. Cancer Res (2011) 71(17):5678–87. doi: 10.1158/0008-5472.CAN-11-0431
27. Cipponi A, Mercier M, Seremet T, Baurain JF, Théate I, van den Oord J, et al. Neogenesis of lymphoid structures and antibody responses occur in human melanoma metastases. Cancer Res (2012) 72(16):3997–4007. doi: 10.1158/0008-5472.CAN-12-1377
28. Martinet L, Le Guellec S, Filleron T, Lamant L, Meyer N, Rochaix P, et al. High endothelial venules (HEVs) in human melanoma lesions: Major gateways for tumor-infiltrating lymphocytes. Oncoimmunology (2012) 1(6):829–39. doi: 10.4161/onci.20492
29. Messina JL, Fenstermacher DA, Eschrich S, Qu X, Berglund AE, Lloyd MC, et al. 12-chemokine gene signature identifies lymph node-like structures in melanoma: potential for patient selection for immunotherapy? Sci Rep (2012) 2:765. doi: 10.1038/srep00765
30. Sakai Y, Hoshino H, Kitazawa R, Kobayashi M. High endothelial venule-like vessels and lymphocyte recruitment in testicular seminoma. Andrology (2014) 2(2):282–9. doi: 10.1111/j.2047-2927.2014.00192.x
31. Peske JD, Thompson ED, Gemta L, Baylis RA, Fu YX, Engelhard VH. Effector lymphocyte-induced lymph node-like vasculature enables naive T-cell entry into tumours and enhanced anti-tumour immunity. Nat Commun (2015) 6:7114. doi: 10.1038/ncomms8114
32. Thompson ED, Enriquez HL, Fu YX, Engelhard VH. Tumor masses support naive T cell infiltration, activation, and differentiation into effectors. J Exp Med (2010) 207(8):1791–804. doi: 10.1084/jem.20092454
33. Rosen SD. Ligands for l-selectin: homing, inflammation, and beyond. Annu Rev Immunol (2004) 22:129–56. doi: 10.1146/annurev.immunol.21.090501.080131
34. Umemoto E, Tanaka T, Kanda H, Jin S, Tohya K, Otani K, et al. Nepmucin, a novel HEV sialomucin, mediates l-selectin-dependent lymphocyte rolling and promotes lymphocyte adhesion under flow. J Exp Med (2006) 203(6):1603–14. doi: 10.1084/jem.20052543
35. Ten Hagen KG, Fritz TA, Tabak LA. All in the family: the UDP-GalNAc:polypeptide n-acetylgalactosaminyltransferases. Glycobiology (2003) 13(1):1R–16R. doi: 10.1093/glycob/cwg007
36. Amado M, Almeida R, Schwientek T, Clausen H. Identification and characterization of large galactosyltransferase gene families: galactosyltransferases for all functions. Biochim Biophys Acta BBA - Gen Subj. (1999) 1473(1):35–53. doi: 10.1016/S0304-4165(99)00168-3
37. Yeh JC, Hiraoka N, Petryniak B, Nakayama J, Ellies LG, Rabuka D, et al. Novel sulfated lymphocyte homing receptors and their control by a Core1 extension beta 1,3-n-acetylglucosaminyltransferase. Cell (2001) 105(7):957–69. doi: 10.1016/S0092-8674(01)00394-4
38. Ellies LG, Tsuboi S, Petryniak B, Lowe JB, Fukuda M, Marth JD. Core 2 oligosaccharide biosynthesis distinguishes between selectin ligands essential for leukocyte homing and inflammation. Immunity (1998) 9(6):881–90. doi: 10.1016/S1074-7613(00)80653-6
39. Hemmerich S, Bistrup A, Singer MS, van Zante A, Lee JK, Tsay D, et al. Sulfation of l-selectin ligands by an HEV-restricted sulfotransferase regulates lymphocyte homing to lymph nodes. Immunity (2001) 15(2):237–47. doi: 10.1016/S1074-7613(01)00188-1
40. Uchimura K, Kadomatsu K, El-Fasakhany FM, Singer MS, Izawa M, Kannagi R, et al. N-acetylglucosamine 6-O-Sulfotransferase-1 regulates expression of l-selectin ligands and lymphocyte homing. J Biol Chem (2004) 279(33):35001–8. doi: 10.1074/jbc.M404456200
41. Kawashima H, Petryniak B, Hiraoka N, Mitoma J, Huckaby V, Nakayama J, et al. N-acetylglucosamine-6-O-sulfotransferases 1 and 2 cooperatively control lymphocyte homing through l-selectin ligand biosynthesis in high endothelial venules. Nat Immunol (2005) 6(11):1096–104. doi: 10.1038/ni1259
42. Uchimura K, Gauguet JM, Singer MS, Tsay D, Kannagi R, Muramatsu T, et al. A major class of l-selectin ligands is eliminated in mice deficient in two sulfotransferases expressed in high endothelial venules. Nat Immunol (2005) 6(11):1105–13. doi: 10.1038/ni1258
43. Homeister JW, Thall AD, Petryniak B, Malý P, Rogers CE, Smith PL, et al. The α(1,3)fucosyltransferases FucT-IV and FucT-VII exert collaborative control over selectin-dependent leukocyte recruitment and lymphocyte homing. Immunity (2001) 15(1):115–26. doi: 10.1016/S1074-7613(01)00166-2
44. Malý P, Thall A, Petryniak B, Rogers CE, Smith PL, Marks RM, et al. The alpha(1,3)fucosyltransferase fuc-TVII controls leukocyte trafficking through an essential role in l-, e-, and p-selectin ligand biosynthesis. Cell (1996) 86(4):643–53. doi: 10.1016/S0092-8674(00)80137-3
45. Asano M, Nakae S, Kotani N, Shirafuji N, Nambu A, Hashimoto N, et al. Impaired selectin-ligand biosynthesis and reduced inflammatory responses in beta-1,4-galactosyltransferase-I-deficient mice. Blood (2003) 102(5):1678–85. doi: 10.1182/blood-2003-03-0836
46. Priatel JJ, Chui D, Hiraoka N, Simmons CJT, Richardson KB, Page DM, et al. The ST3Gal-I sialyltransferase controls CD8+ T lymphocyte homeostasis by modulating O-glycan biosynthesis. Immunity (2000) 12(3):273–83. doi: 10.1016/S1074-7613(00)80180-6
47. Ellies LG, Sperandio M, Underhill GH, Yousif J, Smith M, Priatel JJ, et al. Sialyltransferase specificity in selectin ligand formation. Blood (2002) 100(10):3618–25. doi: 10.1182/blood-2002-04-1007
48. Yang WH, Nussbaum C, Grewal PK, Marth JD, Sperandio M. Coordinated roles of ST3Gal-VI and ST3Gal-IV sialyltransferases in the synthesis of selectin ligands. Blood (2012) 120(5):1015–26. doi: 10.1182/blood-2012-04-424366
49. Lee M, Kiefel H, LaJevic MD, Macauley MS, Kawashima H, O’Hara E, et al. Transcriptional programs of lymphoid tissue capillary and high endothelium reveal control mechanisms for lymphocyte homing. Nat Immunol (2014) 15(10):982–95. doi: 10.1038/ni.2983
50. Veerman K, Tardiveau C, Martins F, Coudert J, Girard JP. Single-cell analysis reveals heterogeneity of high endothelial venules and different regulation of genes controlling lymphocyte entry to lymph nodes. Cell Rep (2019) 26(11):3116–31.e5. doi: 10.1016/j.celrep.2019.02.042
51. Browning JL, Allaire N, Ngam-Ek A, Notidis E, Hunt J, Perrin S, et al. Lymphotoxin-beta receptor signaling is required for the homeostatic control of HEV differentiation and function. Immunity (2005) 23(5):539–50. doi: 10.1016/j.immuni.2005.10.002
52. Moussion C, Girard JP. Dendritic cells control lymphocyte entry to lymph nodes through high endothelial venules. Nature (2011) 479(7374):542–6. doi: 10.1038/nature10540
53. Tjew SL, Brown KL, Kannagi R, Johnson P. Expression of n-acetylglucosamine 6-o-sulfotransferases (GlcNAc6STs)-1 and -4 in human monocytes: GlcNAc6ST-1 is implicated in the generation of the 6-sulfo n-acetyllactosamine/Lewis x epitope on CD44 and is induced by TNF-α. Glycobiology (2005) 15(7):7C–13C. doi: 10.1093/glycob/cwi050
54. Pablos J, Santiago B, Tsay D, Singer M, Palao G, Galindo M, et al. A HEV-restricted sulfotransferase is expressed in rheumatoid arthritis synovium and is induced by lymphotoxin-α/β and TNF-α in cultured endothelial cells. BMC Immunol (2005) 6(1):6. doi: 10.1186/1471-2172-6-6
55. Hailemichael Y, Woods A, Fu T, He Q, Nielsen MC, Hasan F, et al. Cancer vaccine formulation dictates synergy with CTLA-4 and PD-L1 checkpoint blockade therapy. J Clin Invest. (2018) 128(4):1338–54. doi: 10.1172/JCI93303
56. Taggart D, Andreou T, Scott KJ, Williams J, Rippaus N, Brownlie RJ, et al. Anti–PD-1/anti–CTLA-4 efficacy in melanoma brain metastases depends on extracranial disease and augmentation of CD8+ T cell trafficking. Proc Natl Acad Sci (2018) 115(7):E1540–9. doi: 10.1073/pnas.1714089115
57. Rodriguez AB, Peske JD, Woods AN, Leick KM, Mauldin IS, Meneveau MO, et al. Immune mechanisms orchestrate tertiary lymphoid structures in tumors via cancer-associated fibroblasts. Cell Rep (2021) 36(3):109422. doi: 10.1016/j.celrep.2021.109422
58. Suzuki A, Andrew DP, Gonzalo JA, Fukumoto M, Spellberg J, Hashiyama M, et al. CD34-deficient mice have reduced eosinophil accumulation after allergen exposure and show a novel crossreactive 90-kD protein. Blood (1996) 87:3550–62. doi: 10.1182/blood.V87.9.3550.bloodjournal8793550
59. Ciesielski O, Biesiekierska M, Panthu B, Vialichka V, Pirola L, Balcerczyk A. The epigenetic profile of tumor endothelial cells. effects of combined therapy with antiangiogenic and epigenetic drugs on cancer progression. Int J Mol Sci (2020) 21(7):2606. doi: 10.3390/ijms21072606
60. Hellebrekers DMEI, Castermans K, Viré E, Dings RPM, Hoebers NTH, Mayo KH, et al. Epigenetic regulation of tumor endothelial cell anergy: Silencing of intercellular adhesion molecule-1 by histone modifications. Cancer Res (2006) 66(22):10770–7. doi: 10.1158/0008-5472.CAN-06-1609
61. Hellebrekers DMEI, Melotte V, Viré E, Langenkamp E, Molema G, Fuks F, et al. Identification of epigenetically silenced genes in tumor endothelial cells. Cancer Res (2007) 67(9):4138–48. doi: 10.1158/0008-5472.CAN-06-3032
62. Hindley JP, Jones E, Smart K, Bridgeman H, Lauder SN, Ondondo B, et al. T-Cell trafficking facilitated by high endothelial venules is required for tumor control after regulatory T-cell depletion. Cancer Res (2012) 72(21):5473–82. doi: 10.1158/0008-5472.CAN-12-1912
63. Colbeck EJ, Jones E, Hindley JP, Smart K, Schulz R, Browne M, et al. Treg depletion licenses T cell-driven HEV neogenesis and promotes tumor destruction. Cancer Immunol Res (2017) 5(11):1005–15. doi: 10.1158/2326-6066.CIR-17-0131
64. Hargadon KM, Brinkman CC, Sheasley-O’Neill SL, Nichols LA, Bullock TNJ, Engelhard VH. Incomplete differentiation of antigen-specific CD8 T cells in tumor-draining lymph nodes. J Immunol (2006) 177(9):6081–90. doi: 10.4049/jimmunol.177.9.6081
Keywords: blood endothelial cells, high endothelial venules, PNAd, B16, carbohydrate sulfotransferase, checkpoint immunotherapy, tertiary lymphoid structure
Citation: Rodriguez AB, Parriott G and Engelhard VH (2022) Tumor necrosis factor receptor regulation of peripheral node addressin biosynthetic components in tumor endothelial cells. Front. Immunol. 13:1009306. doi: 10.3389/fimmu.2022.1009306
Received: 01 August 2022; Accepted: 26 August 2022;
Published: 15 September 2022.
Edited by:
Tong Xiang, Sun Yat-sen University Cancer Center (SYSUCC), ChinaReviewed by:
Walter J. Storkus, University of Pittsburgh, United StatesCopyright © 2022 Rodriguez, Parriott and Engelhard. This is an open-access article distributed under the terms of the Creative Commons Attribution License (CC BY). The use, distribution or reproduction in other forums is permitted, provided the original author(s) and the copyright owner(s) are credited and that the original publication in this journal is cited, in accordance with accepted academic practice. No use, distribution or reproduction is permitted which does not comply with these terms.
*Correspondence: Victor H. Engelhard, dmhlQHZpcmdpbmlhLmVkdQ==
†Present addresses: Anthony B. Rodriguez, Pyxis Oncology, Cambridge, MA, United States
Geoffrey Parriott, Department of Pathology, The University of Chicago, Chicago, IL, United States
Disclaimer: All claims expressed in this article are solely those of the authors and do not necessarily represent those of their affiliated organizations, or those of the publisher, the editors and the reviewers. Any product that may be evaluated in this article or claim that may be made by its manufacturer is not guaranteed or endorsed by the publisher.
Research integrity at Frontiers

Learn more about the work of our research integrity team to safeguard the quality of each article we publish.