 Carlo Sorrentino1,2†
 Luigi D’Antonio
 Cristiano Fieni
 Emma Di Carlo
- 1Department of Medicine and Sciences of Aging, “G. d’Annunzio” University” of Chieti-Pescara, Chieti, Italy
- 2Anatomic Pathology and Immuno-Oncology Unit, Center for Advanced Studies and Technology (CAST), “G. d’Annunzio” University of Chieti-Pescara, Chieti, Italy
Colorectal cancer (CRC) is one of the most common cancer worldwide, with a growing impact on public health and clinical management. Immunotherapy has shown promise in the treatment of advanced cancers, but needs to be improved for CRC, since only a limited fraction of patients is eligible for treatment, and most of them develop resistance due to progressive immune exhaustion. Here, we identify the transcriptional, molecular, and cellular traits of the immune exhaustion associated with CRC and determine their relationships with the patient’s clinic-pathological profile. Bioinformatic analyses of RNA-sequencing data of 594 CRCs from TCGA PanCancer collection, revealed that, in the wide range of immune exhaustion genes, those coding for PD-L1, LAG3 and T-bet were associated (Cramér’s V=0.3) with MSI/dMMR tumors and with a shorter overall survival (log-rank test: p=0.0004, p=0.0014 and p=0.0043, respectively), whereas high levels of expression of EOMES, TRAF1, PD-L1, FCRL4, BTLA and SIGLEC6 were associated with a shorter overall survival (log-rank test: p=0.0003, p=0.0188, p=0.0004, p=0.0303, p=0.0052 and p=0.0033, respectively), independently from the molecular subtype of CRC. Expression levels of PD-L1, PD-1, LAG3, EOMES, T-bet, and TIGIT were significantly correlated with each other and associated with genes coding for CD4+ and CD8+CD3+ T cell markers and NKp46+CD94+EOMES+T-bet+ cell markers, (OR >1.5, p<0.05), which identify a subset of group 1 innate lymphoid cells, namely conventional (c)NK cells. Expression of TRAF1 and BTLA co-occurred with both T cell markers, CD3γ, CD3δ, CD3ε, CD4, and B cell markers, CD19, CD20 and CD79a (OR >2, p<0.05). Expression of TGFβ1 was associated only with CD4+ and CD8+CD3ε+ T cell markers (odds ratio >2, p<0.05). Expression of PD-L2 and IDO1 was associated (OR >1.5, p<0.05) only with cNK cell markers, whereas expression of FCRL4, SIGLEC2 and SIGLEC6 was associated (OR >2.5; p<0.05) with CD19+CD20+CD79a+ B cell markers. Morphometric examination of immunostained CRC tissue sections, obtained from a validation cohort of 53 CRC patients, substantiated the biostatistical findings, showing that the highest percentage of immune exhaustion gene expressing cells were found in tumors from short-term survivors and that functional exhaustion is not confined to T lymphocytes, but also involves B cells, and cNK cells. This concept was strengthened by CYBERSORTx analysis, which revealed the expression of additional immune exhaustion genes, in particular FOXP1, SIRT1, BATF, NR4A1 and TOX, by subpopulations of T, B and NK cells. This study provides novel insight into the immune exhaustion landscape of CRC and emphasizes the need for a customized multi-targeted therapeutic approach to overcome resistance to current immunotherapy.
Introduction
Colorectal cancer (CRC) ranks third for incidence, after breast and lung cancers, and second for mortality, after lung cancer (1). Mortality is mainly due to metastatic disease, which affects nearly 22% of CRC patients at diagnosis, and more than 50% thereafter due to relapses (2). CRC is an age-related malignancy, since 90% of cases are diagnosed after the age of 50, and the average age at diagnosis is 70 (1, 3), therefore the overall aging of the population, will inevitably lead to an increase in the number of new cases diagnosed in the near future, which makes CRC a significant public health challenge.
Advances in patient-tailored therapy, which is based on the mutational, transcriptomic, and proteomic profiles of individual CRC (4), and on its immune cell context, can fulfill this need. Genetic and epigenetic alterations play a key role in shaping the CRC microenvironment (5). Defects in DNA mismatch repair proteins and subsequent microsatellite instability lead to the accumulation of mutation loads in cancer-related genes and the generation of neoantigens, which promote intra-tumoral immune cell influx, essential for immunotherapy. Mismatch repair deficiency (dMMR) or microsatellite instability (MSI) is significantly associated with long-term immunotherapy-related responses and better prognosis in cancers treated with immune checkpoint inhibitors (6). However, many of the patients that initially respond to treatment later become resistant or relapse due to the occurrence of further genetic and epigenetic alterations, which generate new cancer clones with different molecular traits. These molecular events re-shape the tumor microenvironment (TME), upregulating other inhibitory receptors and immunosuppressive mediators, and expanding the landscape of immune cell exhaustion. Exhaustion is a functional status attributed to T lymphocytes and characterized by the loss of effector function, including proliferation, release of cytokines, and secretion of cytolytic molecules, due to persistent antigen stimulation and inflammatory signals in pathological contexts, such as chronic infections or inflammatory diseases and cancer (7, 8). However, in the last few years it has become progressively evident that exhaustion is not exclusive of T cells, but can also affect other immune cell subsets (9–12) homing the TME.
In this study, using bioinformatics, we analyzed the transcriptional profile, and concomitant immune cell context, of the immune exhaustion in CRCs of the TCGA PanCancer collection, and its relationship with patients’ clinical-pathological characteristics and follow-ups. A validation cohort of CRC patients, which includes short- and long-term survivors, provided tumor samples to localize and quantify, by immunohistochemistry and computerized morphometric analysis, immune exhaustion gene expression at protein level.
Our findings reveal that high levels of expression of specific immune exhaustion genes occurs in MSI molecular subtype, however, independently from the molecular subtype of CRC, high expression levels of a range of immune exhaustion genes regulating different immune cell subsets, are significantly associated with worst prognosis. Biostatistical co-occurrence and morphological co-localization of the expression of immune exhaustion genes and markers of T and B lymphocytes, and of conventional (c) NK cells, strongly suggest that, regardless of the molecular subtype of tumor, CRC-associated immune exhaustion is not only a “T cell matter”. CIBERSORTx analysis corroborates this concept revealing that the expression of relevant immune exhaustion-related genes, detected in the different T lymphocyte subpopulations, also involves B and NK cell subpopulations.
Profiling of functional immune exhaustion in individual CRC can lead to the development of a successful patient tailored therapy to counteract metastasis and disease recurrence.
Materials and Methods
Bioinformatic Analyses
For bioinformatic analyses, RNA sequencing (seq) data (obtained using the Illumina HiSeq 2000 RNA Sequencing System, Version 2) of tumor samples from the “Colorectal Adenocarcinoma TCGA PanCancer collection”, which includes 594 CRC cases (Table 1), were downloaded from the cBioportal for Cancer Genomics database (https://www.cbioportal.org; cBioPortal, RRID : SCR_014555). The expression of the genes listed in the Tables 2, 3 was examined.
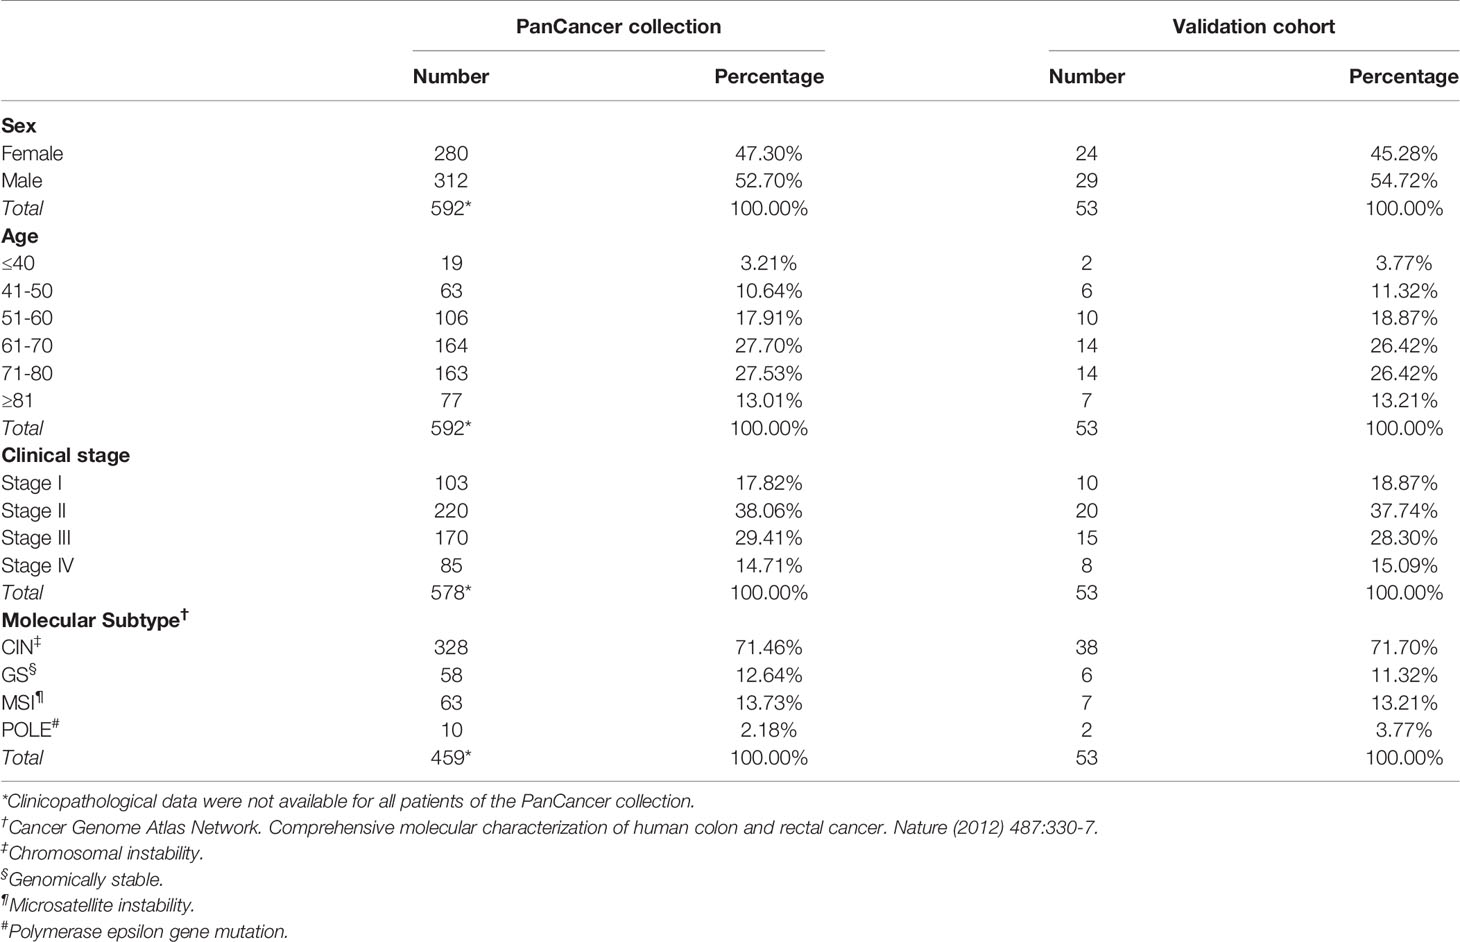
Table 1 Clinicopathological characteristics of patients included in the Colorectal Adenocarcinoma TCGA PanCancer collection and in the validation cohort.
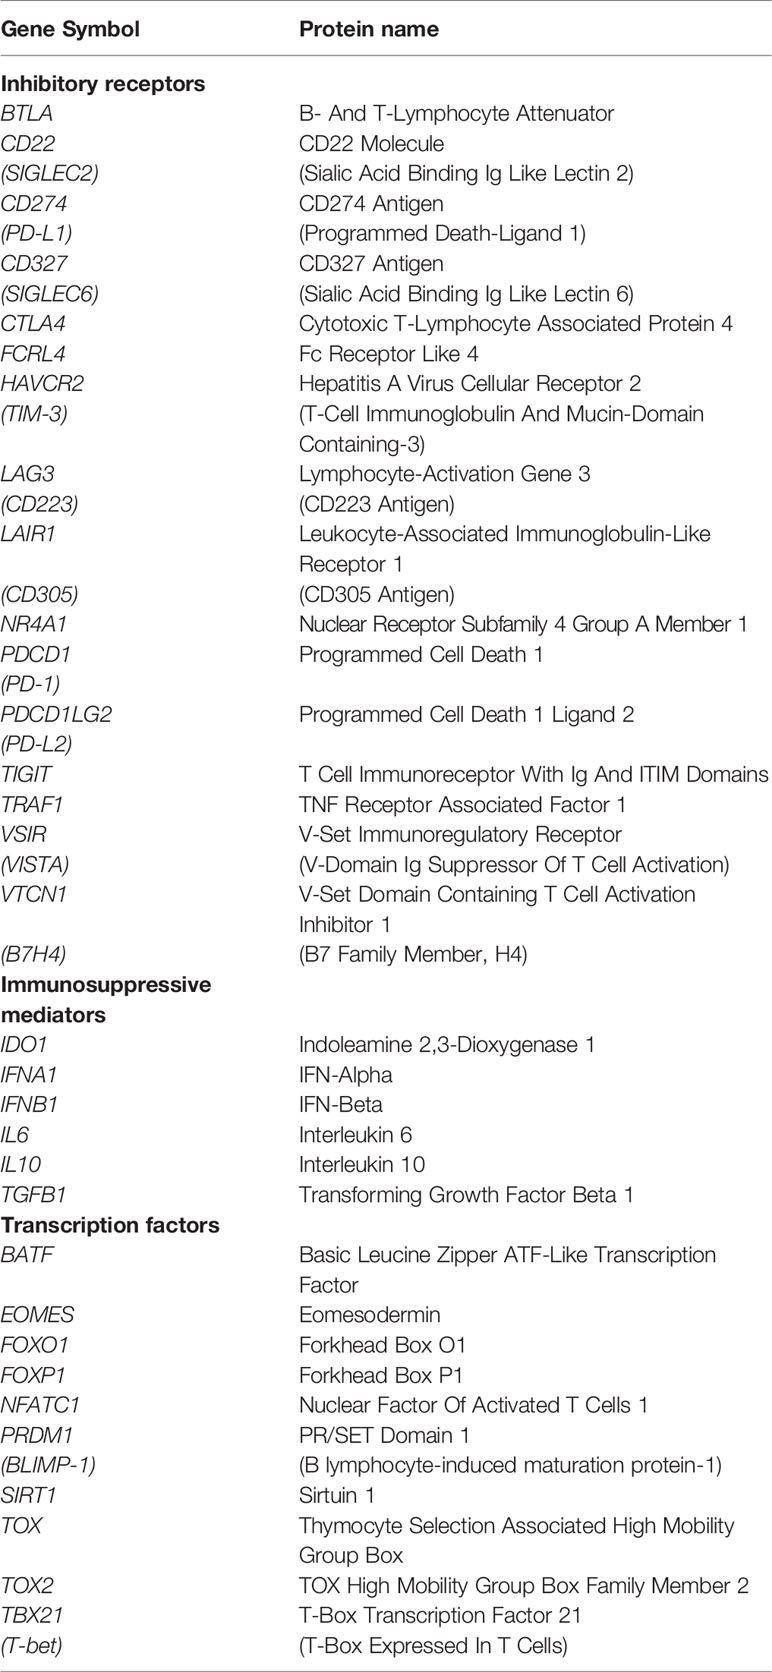
Table 2 Immune exhaustion-related genes.
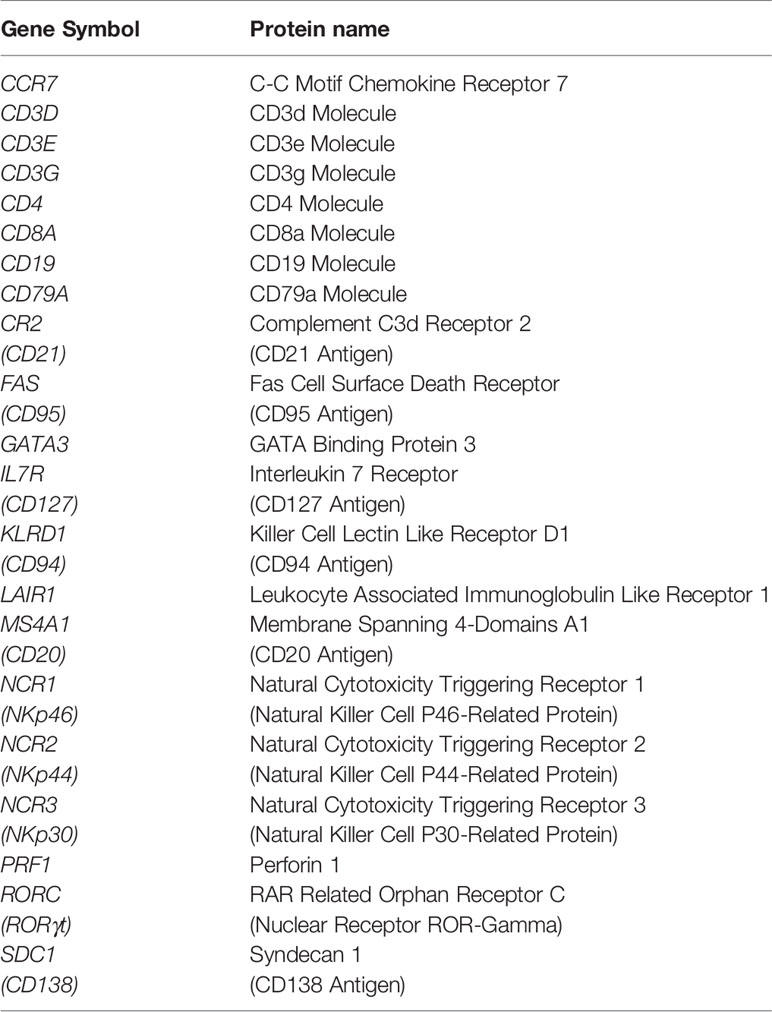
Table 3 Innate and acquired immune cell markers.
For each CRC sample, the Z-score of the expression level for each gene of interest was calculated and compared to the mean of all the samples in the study. Samples with a Z-score ≥ 2 were considered high-expressing, whereas samples with a Z-score < 2 were considered low-expressing. Survival curves were constructed (with CRC cases for which both gene expression and follow-up data were available) using the Kaplan-Meier method and survival differences were analyzed by the Log-rank test, whereas the association between gene expression and CRC molecular subtypes was assessed using Cramér’s V test. Gene co-occurrence analysis was performed by odds ratio (OR) calculation, while Spearman’s correlation coefficient (ρ) was used to exclude correlations between gene expression and patients’ age, sex and TNM staging.
To estimate the expression of immune exhaustion genes in the immune cell subsets infiltrating CRC samples, Transcripts Per Million (TPM)-normalized RNA-seq data of the “Colorectal Adenocarcinoma TCGA PanCancer collection” were downloaded from http://firebrowse.org and analyzed using CIBERSORTx (13), a computational framework, which accurately infers cell type abundance from the RNA profiles of tissue samples, using specific gene signatures. LM22 was used as signature matrix, that contains 547 genes, which distinguish 22 human hematopoietic cell phenotypes (14), and batch correction option was enabled, to remove technical differences between the signature matrix and RNA-seq data. For each immune exhaustion gene, the Z-score of the expression level in each immune cell subset was calculated and genes with a Z-score ≥ 2 were considered highly expressed.
All statistical tests were evaluated at an α level of 0.05, using Stata, version 13 (StataCorp, College Station, TX, USA; RRID : SCR_012763).
Patients and Samples
To validate bioinformatic data at the protein level, we collected colon tissue samples and clinicopathological profiles of patients (15) who underwent colectomy for CRC, between 2009 and 2013, at the S.S. Annunziata Hospital (Chieti, Italy). Patients had not received immunosuppressive treatments and were free from chronic inflammatory or immune system diseases. Fifty-three patients were selected by matching for sex, age, clinical stage and molecular subtype with CRC patients from the PanCancer collection (Table 1). Follow-up time was of 84 months. Subsequently, patients were divided into short-term survivors (23 patients with an overall survival, OS, ≤ 40 months), and long-term survivors (30 patients with an OS > 40 months). This cut-off value was determined from the estimated survival probabilities derived from the Kaplan-Meier curves of patients from the PanCancer collection.
The study was reviewed and approved by the Ethical Committee of the “G. d’Annunzio” University and Local Health Authority of Chieti, Italy. The study was performed, after written informed consent from patients, in accordance with the principles outlined in the Declaration of Helsinki.
Histopathology, Immunohistochemistry and Morphometric Analyses
CRC samples, obtained from the validation cohort, based on standard sampling protocols (16), were fixed in 4% formalin and embedded in paraffin. For histology, paraffin-embedded samples were sectioned at 4 μm and stained with hematoxylin and eosin (H&E). Single or double (T-bet/EOMES, PD-1/LAG3, CD20/FCRL4, CD20/BTLA, CD20/TRAF1, CD20/SIGLEC6, CD3/PD-1, CD3/EOMES, CD3/T-bet, CD3/PD-L1, CD3/LAG3, CD3/TGFβ1, NKp46/TIGIT, NKp46/IDO1, NKp46/PD-L2) immunostainings, on formalin fixed and paraffin-embedded tissue sections, were performed as described (17), using the Abs listed in Table 4.
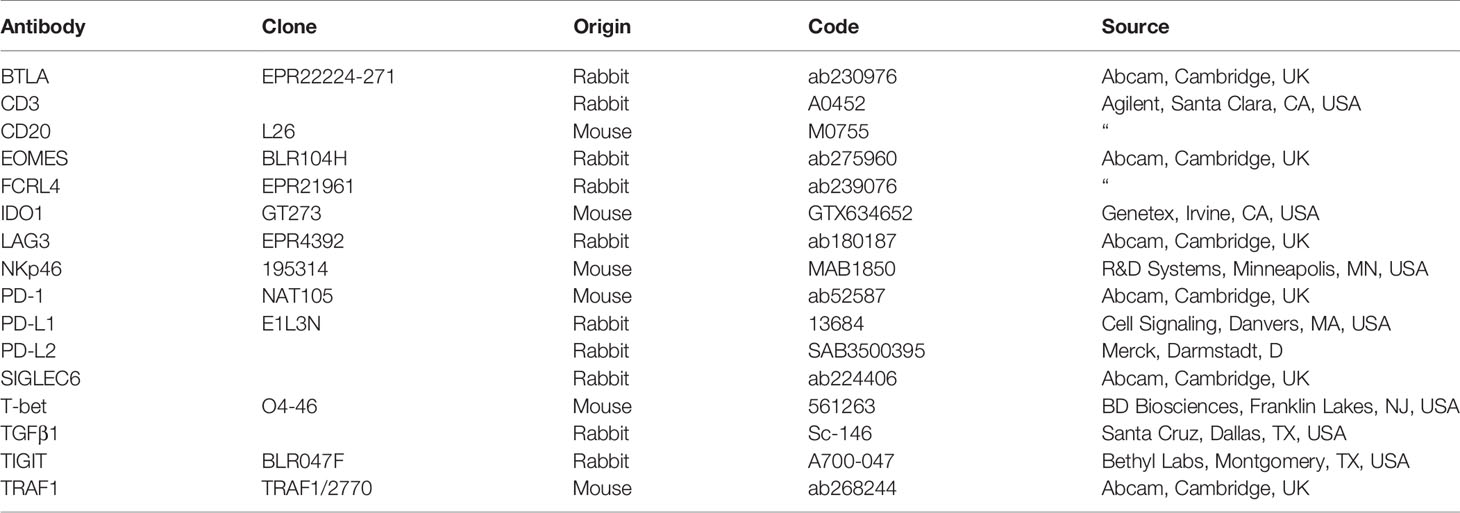
Table 4 Antibodies used in immunostaining.
The morphometric analysis of immune exhaustion markers was confined to the neoplastic areas of colon tissue sections, and was performed by light microscopy, at ×400, in an 85431.59 μm2 field, on single or double immunostained sections, with Qwin image analysis software (version 2.7) (Qiagen, Hilden D). The Qwin image analyses ensures the following highly reproducible steps: 1) image acquisition; 2) conversion of RGB image (true colors) to binary image (black and white); 3) filtering to remove noise; 4) counting of immunostained cells or measurement of positively stained area. Six to eight high-power fields, randomly chosen, were evaluated for each section and two sections per sample were analyzed. Results were expressed as mean percentage ± standard deviation (SD) of positive cells/number of total cells per field. Immunostained sections were examined by two pathologists in a blind fashion, with very good agreement (κ value = 0.89). Representative images of immunostained sections for exhaustion markers were captured in the stroma, between tumor glands, or in lymphoid aggregates, because in these areas their expression was more evident, regardless of the number of lymphoid-like structures in tumor samples from short versus long-term survivors, which has been the subject of previous investigations (18, 19).
Statistics
For the bioinformatics, statistical analyses have been described above. For morphometric studies, between-group differences were assessed by Student’s t-test. All statistical tests were evaluated at an α level of 0.05, using Stata, version 13 (Stata Corp).
Results
Association of the Expression of Immune Exhaustion Genes With the Molecular CRC Subtypes and With the Clinical Outcome
Functional and exhausted immune cells display distinct transcriptional programs (7, 20). To investigate immune cell dysfunction in the CRC microenvironment, we performed bioinformatic analysis of the immune exhaustion gene expression according to the clinic-pathological profiles of CRC patients. For this purpose, we used the publicly available RNA-seq data of CRC samples, obtained from 594 patients (Table 1), from the TCGA PanCancer collection (21). The range of genes, whose expression data was analyzed, includes inhibitory receptors, immunosuppressive mediators, and transcription factors, as listed in the Table 2. Biostatistical findings, based on RNA-seq data, were then assessed, at the protein expression level, by immunohistochemical and morphometric analyses of CRC samples obtained from a validation cohort of 53 patients.
a. High Levels of PD-L1, LAG3 and T-bet Expression Are Associated With the MSI Subtype in CRC
Approximately 15% of all CRCs have high frequency of MSI, which results from impaired DNA mismatch repair due to mutation or hypermethylation of mismatch repair genes (MLH1, MSH2, MSH6 or PMS2) (22). This defect leads to the accumulation of insertions and deletions in DNA repeat sequences (microsatellites), that ultimately result in high tumor mutational burden (TMB), and to a high density of CD8+ tumor infiltrating lymphocytes, that are required for response to immunotherapy (23). Bioinformatic analyses of gene expression data from CRC samples of TCGA PanCancer collection, revealed that among immune exhaustion-related genes, the expression of those coding for PD-L1, LAG3 and T-bet was associated (Cramér’s V=0.3) with MSI/dMMR tumors, which were diagnosed in 63/594 (10.61%) of CRC patients (Table 5).
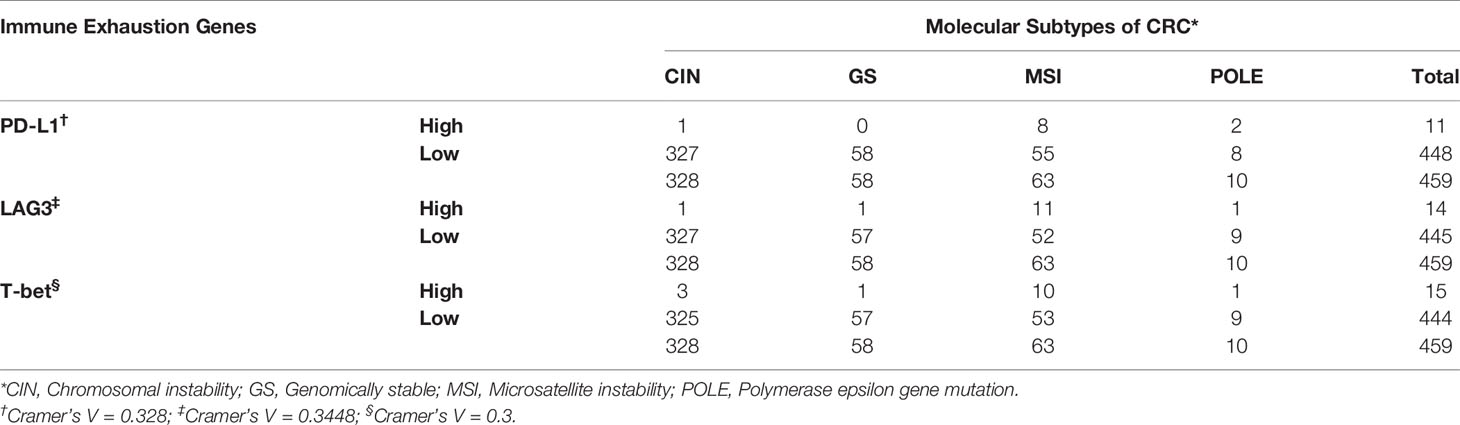
Table 5 Association of the expression of immune exhaustion genes with the molecular subtypes of CRC.
b. High Levels of PD-1, LAG3, T-bet, EOMES, TRAF1 and PD-L1 Expression Are Associated With Shorter Overall Survival in CRC Patients
To assess whether the expression of PD-1, LAG3 and T-bet in CRC samples, was related with patients’ clinical outcome, Kaplan Meier survival analysis was performed for patients with CRC, of all stages and molecular subtype. As shown in Figures 1A–C, the log-rank test indicated that high levels of expression of all these immunity genes were associated with a shorter mean overall survival (OS). Patients bearing tumors with high level of expression of PD-1 (PD-1high) had an OS of 29.43 months, versus 91.21 months of patients bearing tumors with a low level of expression (PD-1low) (log-rank test, p=0.0069).
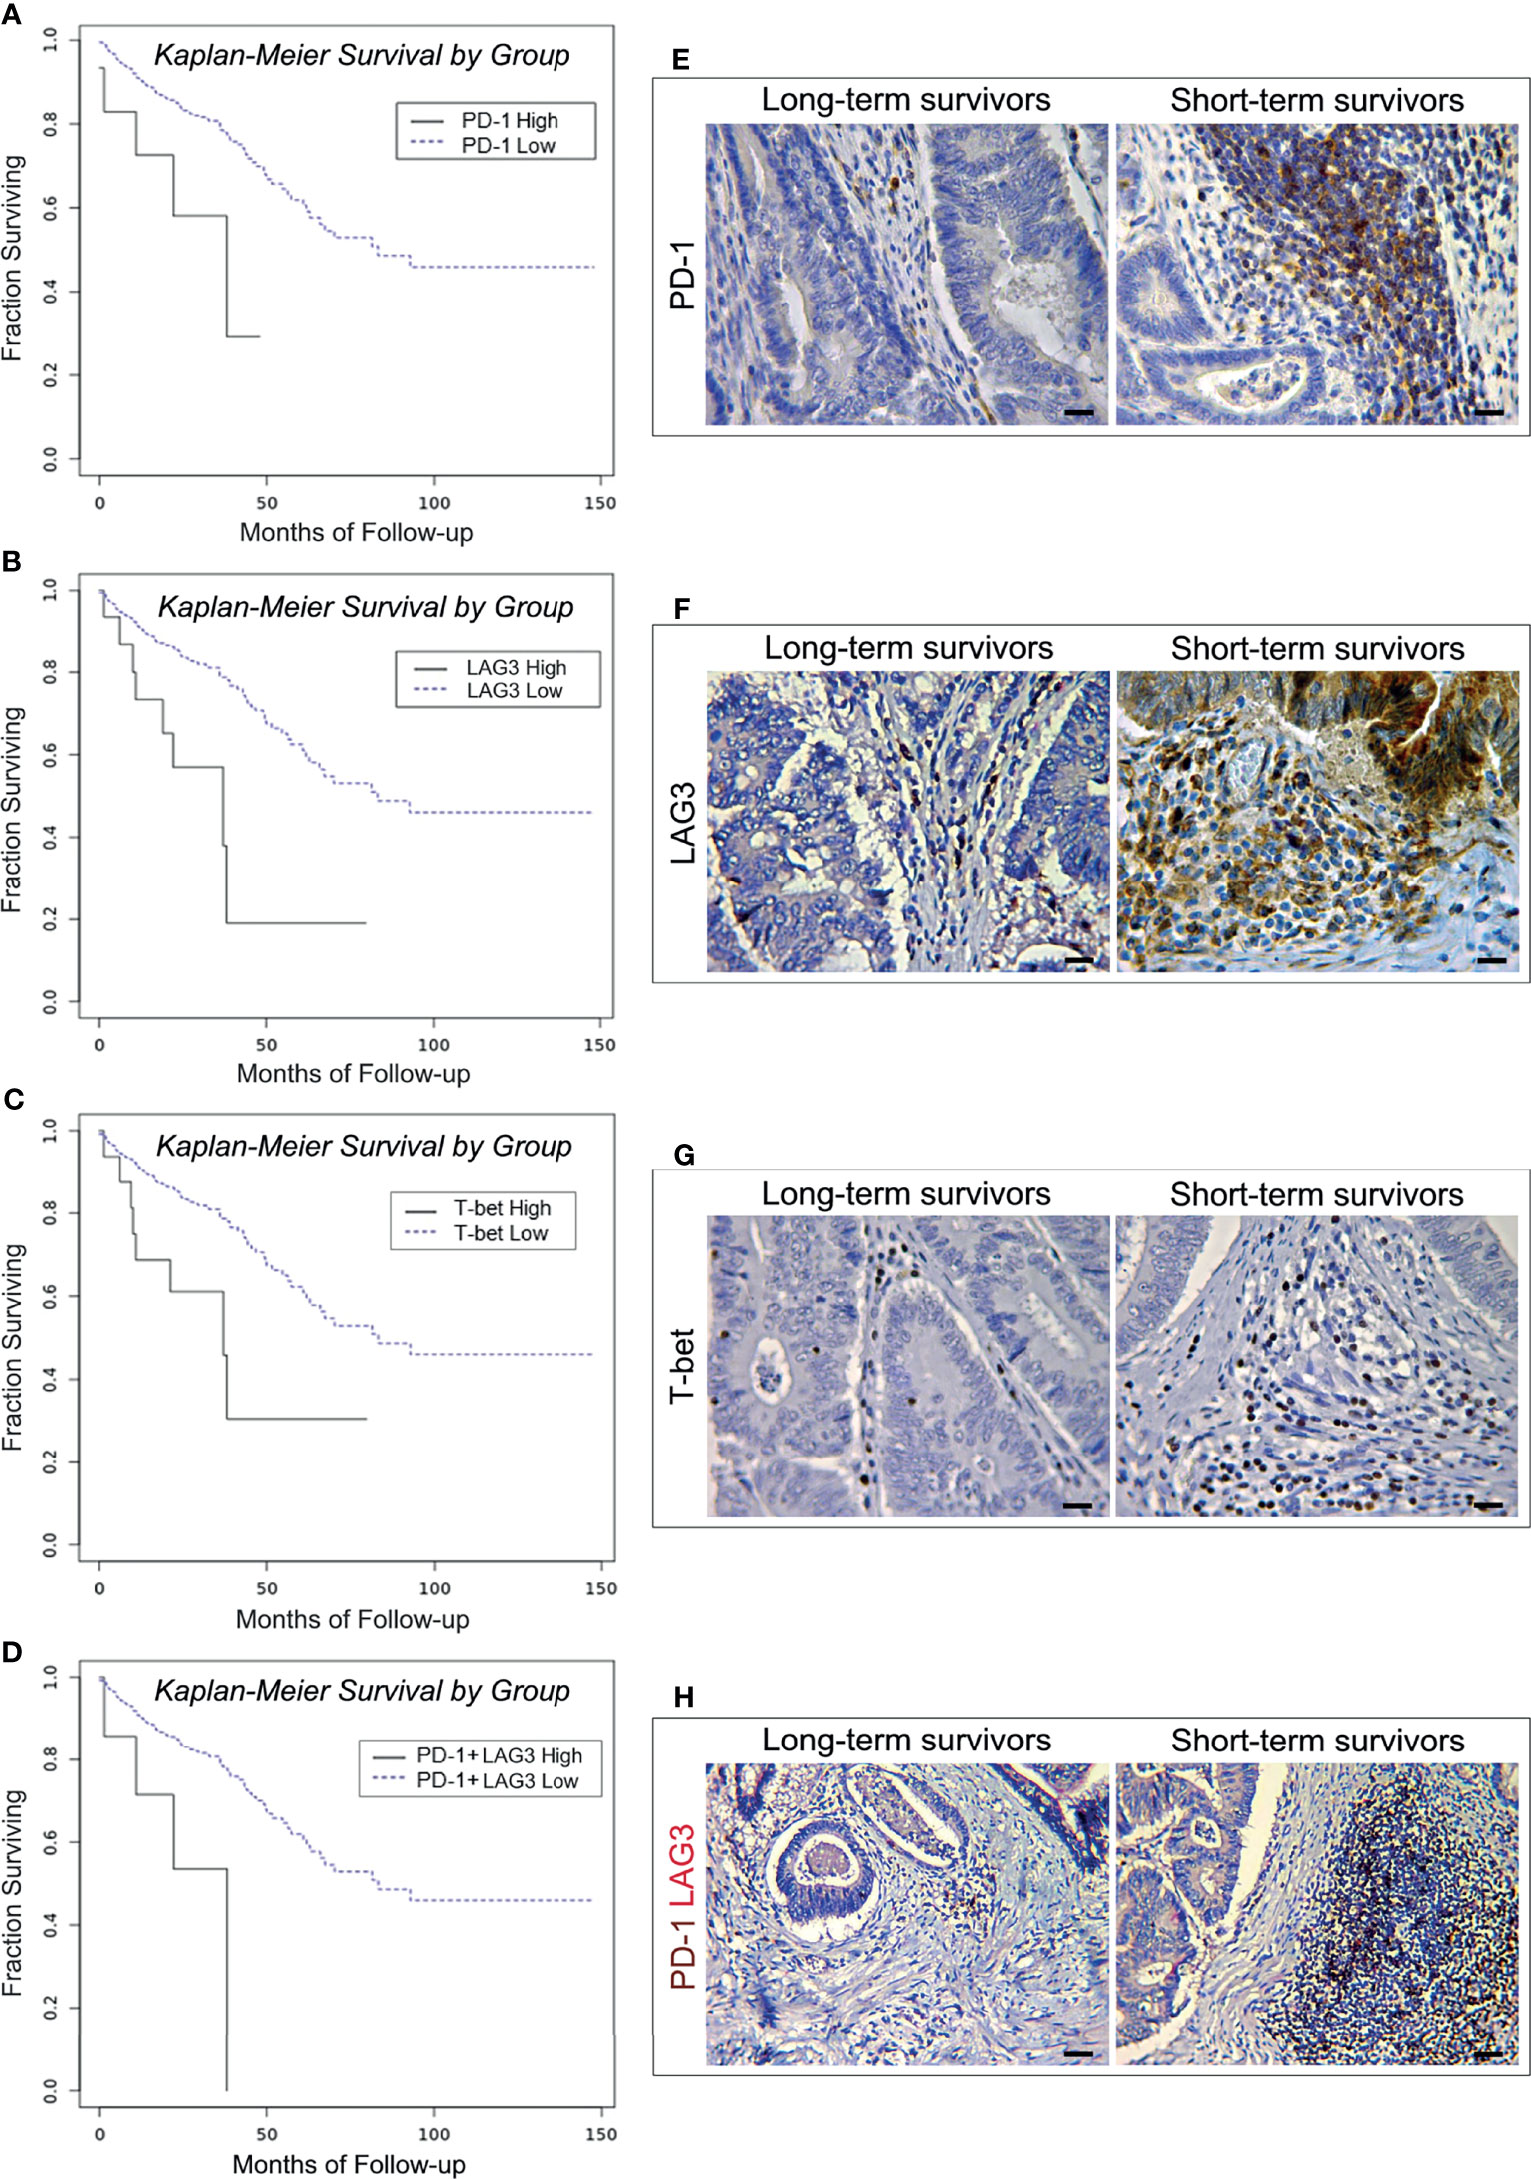
Figure 1 Survival curves and immunopathological features of PD-1, LAG3 and T-bet expression in CRC patients from the PanCancer collection and from the validation cohort. (A) Kaplan-Meier curves representing, for each time point, the fraction of surviving CRC patients classified, based on mRNA expression levels in tumor samples, as PD-1 mRNAhigh (n. 15) and PD-1 mRNAlow (n. 573). (B) Kaplan-Meier curves representing, for each time point, the fraction of surviving CRC patients classified, based on mRNA expression levels in tumor samples, as LAG3 mRNAhigh (n. 19) and LAG3 mRNAlow (n. 569). (C) Kaplan-Meier curves representing, for each time point, the fraction of surviving CRC patients classified, based on mRNA expression levels in tumor samples, as T-bet mRNAhigh (n. 18) and T-bet mRNAlow (n. 570). (D) Kaplan-Meier curves representing, for each time point, the fraction of surviving CRC patients classified, based on mRNA expression levels in tumor samples, as PD-1 mRNAhigh + LAG3 mRNAhigh (n. 10) and PD-1 mRNAlow + LAG3 mRNAlow (n. 578). (E) Expression of PD-1 in CRC tissue sections obtained from patients with long- and short-term survival. Magnification: X400. Scale bars: 20 μm. (F) Expression of LAG3 in CRC tissue sections obtained from patients with long- and short-term survival. Magnification: X400. Scale bars: 20 μm. (G) Expression of T-bet in CRC tissue sections obtained from patients with long- and short-term survival. Magnification: X400. Scale bars: 20 μm. (H) Co-expression of PD-1 (brown) and LAG3 (red) in CRC tissue sections obtained from patients with long- and short-term survival. Magnification: X200. Scale bars: 30 μm.
The OS of patients bearing LAG3high, or T-bethigh was 34.68 and 39.82 months, respectively, versus 91.63 and 91.45 months of patients with LAG3low, or T-betlow tumors (log-rank test, p=0.0014 and p=0.0043, respectively). Odds ratio calculation revealed that the expression of LAG3 was strongly associated with that of PD-1 (OR >3, p<0.001). In agreement with this finding, high levels of co-expression of these genes were also associated with a shorter OS (26.08 versus 91.21 months. Log-rank test, p=0.0041) (Figure 1D).
To assess whether the association between the expression of immune exhaustion genes in CRC and clinical outcome could be confirmed, at the protein expression level, immunopathological analyses were performed on tumor samples obtained from a validation cohort of 53 CRC patients (matched for sex, age, clinical stage and molecular subtype, with CRC patients from the PanCancer collection, previously analyzed for gene expression data and clinical outcome), which were distinguished, by outcome, as short-term (OS ≤ 40 months, 23 patients) and long-term (OS > 40 months, 30 patients) survivors (Table 6).
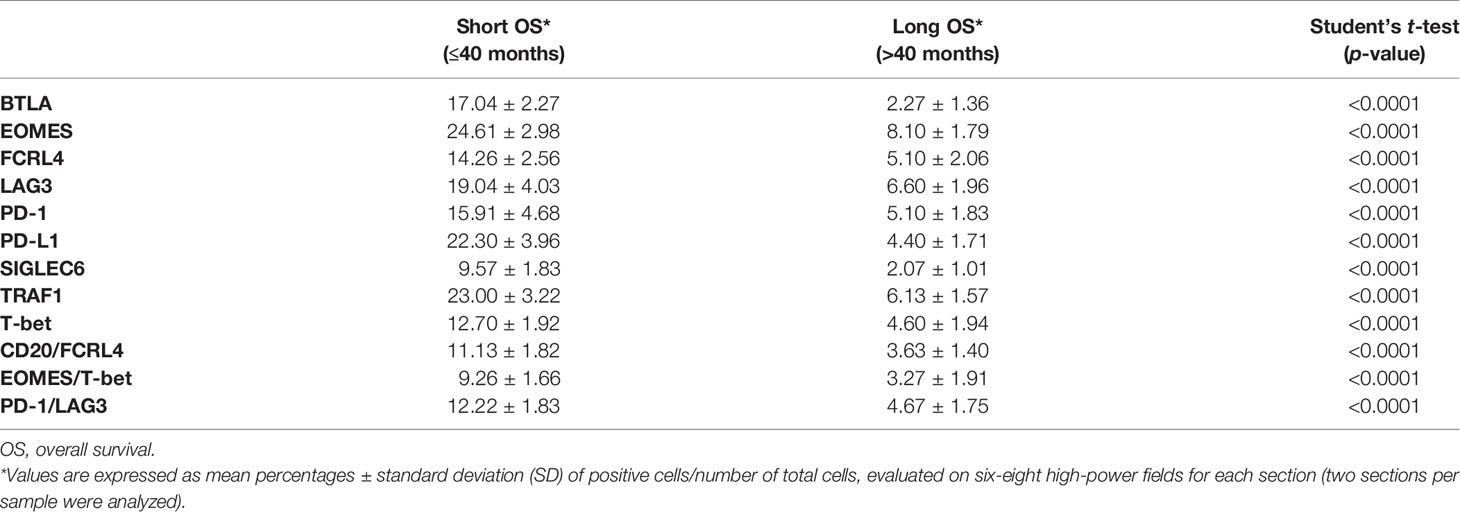
Table 6 Expression of immune exhaustion markers in the validation cohort.
Expression of PD-1, LAG3 and T-bet was detected in lymphoid aggregates and scattered among the neoplastic glands, or at intra-epithelial sites, whereas LAG3 was also occasionally expressed by clusters of colonic cancer cells (Figures 1E–G). Morphometric evaluation revealed that, the mean percentage of immune cells positive for PD-1, or LAG3 or T-bet was higher (p<0.001) in CRC samples from short-term survivors, than in tumor samples from long-term survivors, as reported in the Table 6.
Double immunostaining of PD-1/LAG3 confirmed their frequent co-expression and showed that tumors obtained from short-term survivors contained a higher percentage (p<0.0001) of double positive cells than tumors from long-term survivors (Figure 1H, and Table 6).
Expanding the analysis to the whole range of immune exhaustion markers (Table 2) has revealed that high levels of expression of TRAF1 and PD-L1 were also associated with worst patient outcome. The OS of patients bearing EOMEShigh tumors was 25.16 months, versus 91.34 months for patients bearing EOMESlow tumors (log-rank test, p=0.0003; Figure 2A). OR calculation revealed a strong association between the expression of EOMES and expression of T-bet (OR >3, p<0.001). Notably, co-expression of high levels of T-bet and EOMES led to a further reduction in the OS (19.17 versus 91.18 months for patients with low co-expression levels (log-rank test, p<0.0001; Figure 2B). Finally, patients bearing PD-L1high or TRAF1high CRCs, had a shorter OS (27.34 months and 35.70 months, respectively), than patients bearing PD-L1low or TRAF1low CRCs (91.44 and 91.60 months, respectively. Log-rank test, p=0.0004 and p=0.0188, respectively; Figures 2C, D).
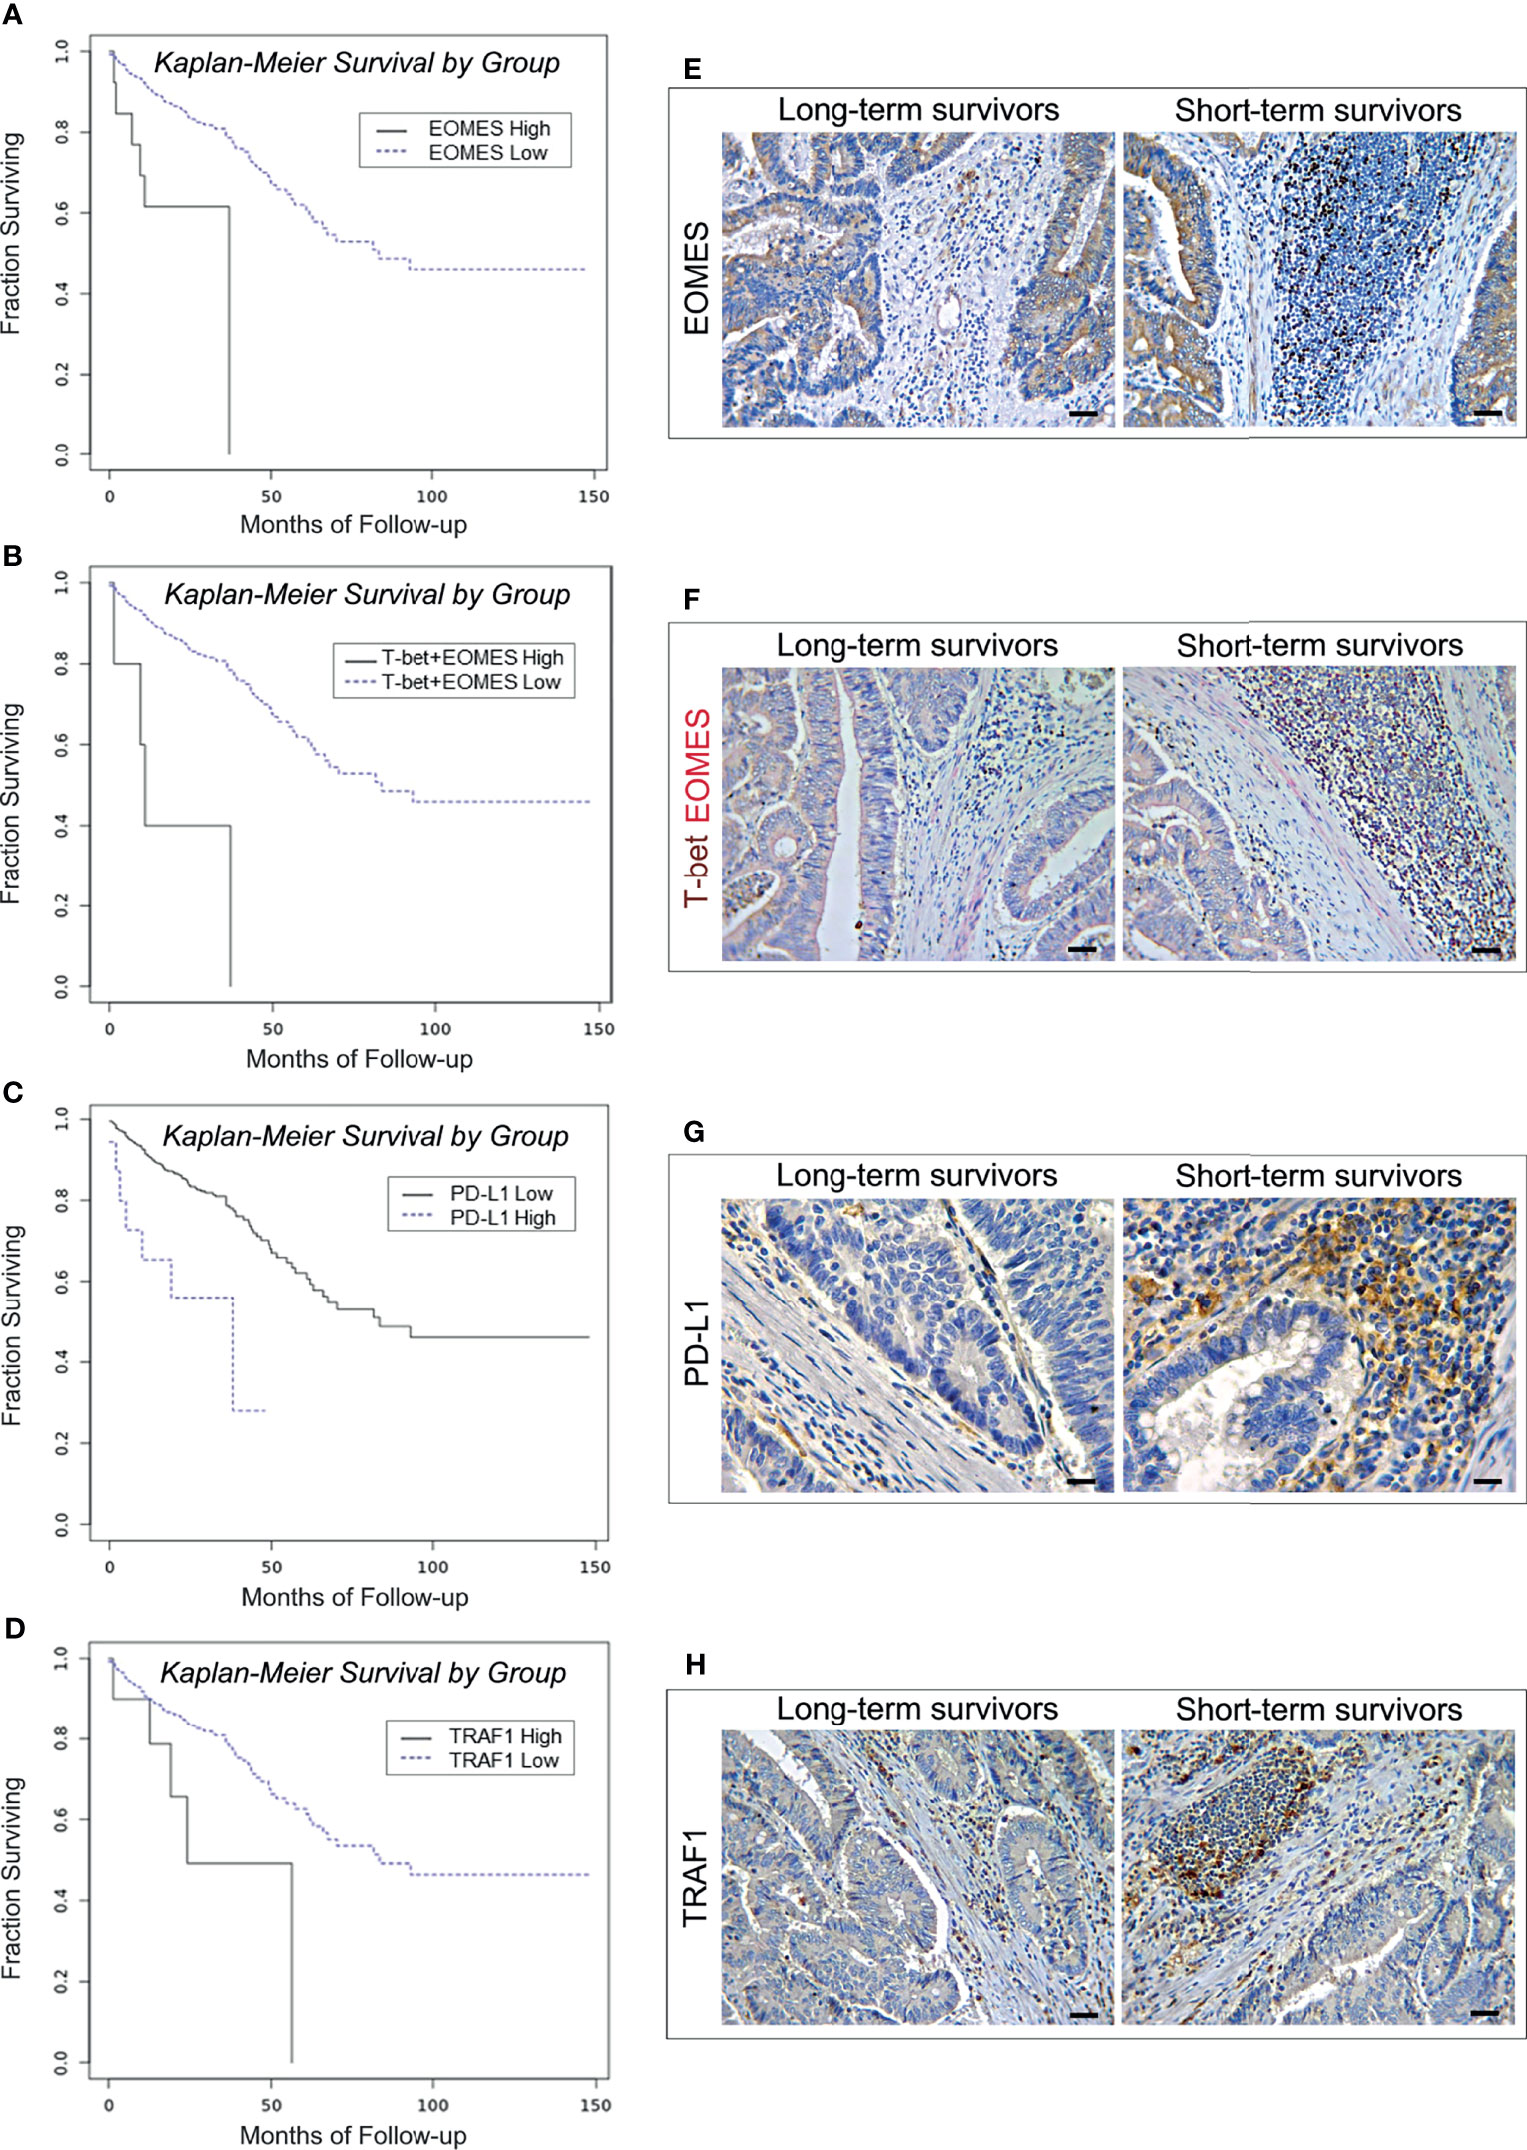
Figure 2 Survival curves and immunopathological features of EOMES/T-bet, PD-L1 and TRAF1 expression in CRC patients from the PanCancer collection and from the validation cohort. (A) Kaplan-Meier curves representing, for each time point, the fraction of surviving CRC patients classified, based on mRNA expression levels in tumor samples, as EOMES mRNAhigh (n. 14) and EOMES mRNAlow (n. 574). (B) Kaplan-Meier curves representing, for each time point, the fraction of surviving CRC patients classified, based on mRNA expression levels in tumor samples, as T-bet mRNAhigh + EOMES mRNAhigh (n. 6) and T-bet mRNAlow + EOMES mRNAlow (n. 582). (C) Kaplan-Meier curves representing, for each time point, the fraction of surviving CRC patients classified, based on mRNA expression levels in tumor samples, as PD-L1 mRNAhigh (n. 18) and PD-L1 mRNAlow (n. 570). (D) Kaplan-Meier curves representing, for each time point, the fraction of surviving CRC patients classified, based on mRNA expression levels in tumor samples, as TRAF1 mRNAhigh (n. 11) and TRAF1 mRNAlow (n. 577). (E) Expression of EOMES in CRC tissue sections obtained from patients with long- and short-term survival. Magnification: X200. Scale bars: 30 μm. (F) Co-expression of T-bet (brown) and EOMES (red) in CRC tissue sections obtained from patients with long- and short-term survival. Magnification: X200. Scale bars: 30 μm. (G) Expression of PD-L1 in CRC tissue sections obtained from patients with long- and short-term survival. Magnification: X400. Scale bars: 20 μm. (H) Expression of TRAF1 in CRC tissue sections obtained from patients with long- and short-term survival. Magnification: X200. Scale bars: 30 μm.
Immunohistochemistry corroborated the biostatistical findings showing that CRC samples, from short-term survivors, contained an average percentage of EOMES/T-bet double positive cells, and of PD-L1 and TRAF1 positive cells, that was considerably higher (p<0.0001) than in CRC samples from long-term survivors (Table 6 and Figures 2E–H).
c. High Levels of BTLA, FCRL4 and SIGLEC6 Are Associated With Shorter Overall Survival in CRC Patients
B cell exhaustion was first described in association to HIV infection, after the demonstration of persistent virus-induced T-cell exhaustion (24). Inhibition of B cell receptor (BCR) signaling, and loss of B cell effector functions, are tightly regulated by several different co-receptors (9, 24). CD22 (SIGLEC2), PD-1, BTLA, LAIR1, FCRL4 and CD327 (SIGLEC6) have been identified as inhibitors of BCR signaling (9, 25, 26), and therefore their expression was analyzed to assess the functional state of B cells in CRC samples of the PanCancer collection. Biostatistics revealed that the transcriptional expression of genes coding for BTLA (27), FCRL4 (28) and for SIGLEC6 (29), was associated with worst patient outcome.
Specifically, the OS of patients bearing BTLAhigh tumors was 27.82 months, versus 91.27 months for patients bearing BTLAlow tumors (log-rank test, p=0.0052; Figure 3A). The OS of patients bearing CRC with high level of expression of SIGLEC6 or FCRL4 was 23.08 and 24.54 months, respectively, versus 91.04 and 91.30 months for patients bearing tumors with low expression levels (log-rank test, p=0.0033 and p=0.0303, respectively; Figures 3B, C). Notably, co-expression of high levels of FCRL4 and CD20 in CRC samples was associated with a shorter OS, compared to low transcriptional levels of both genes (18.91 versus 91.48 months. Log-rank test, p=0.0007 and Figure 3D).
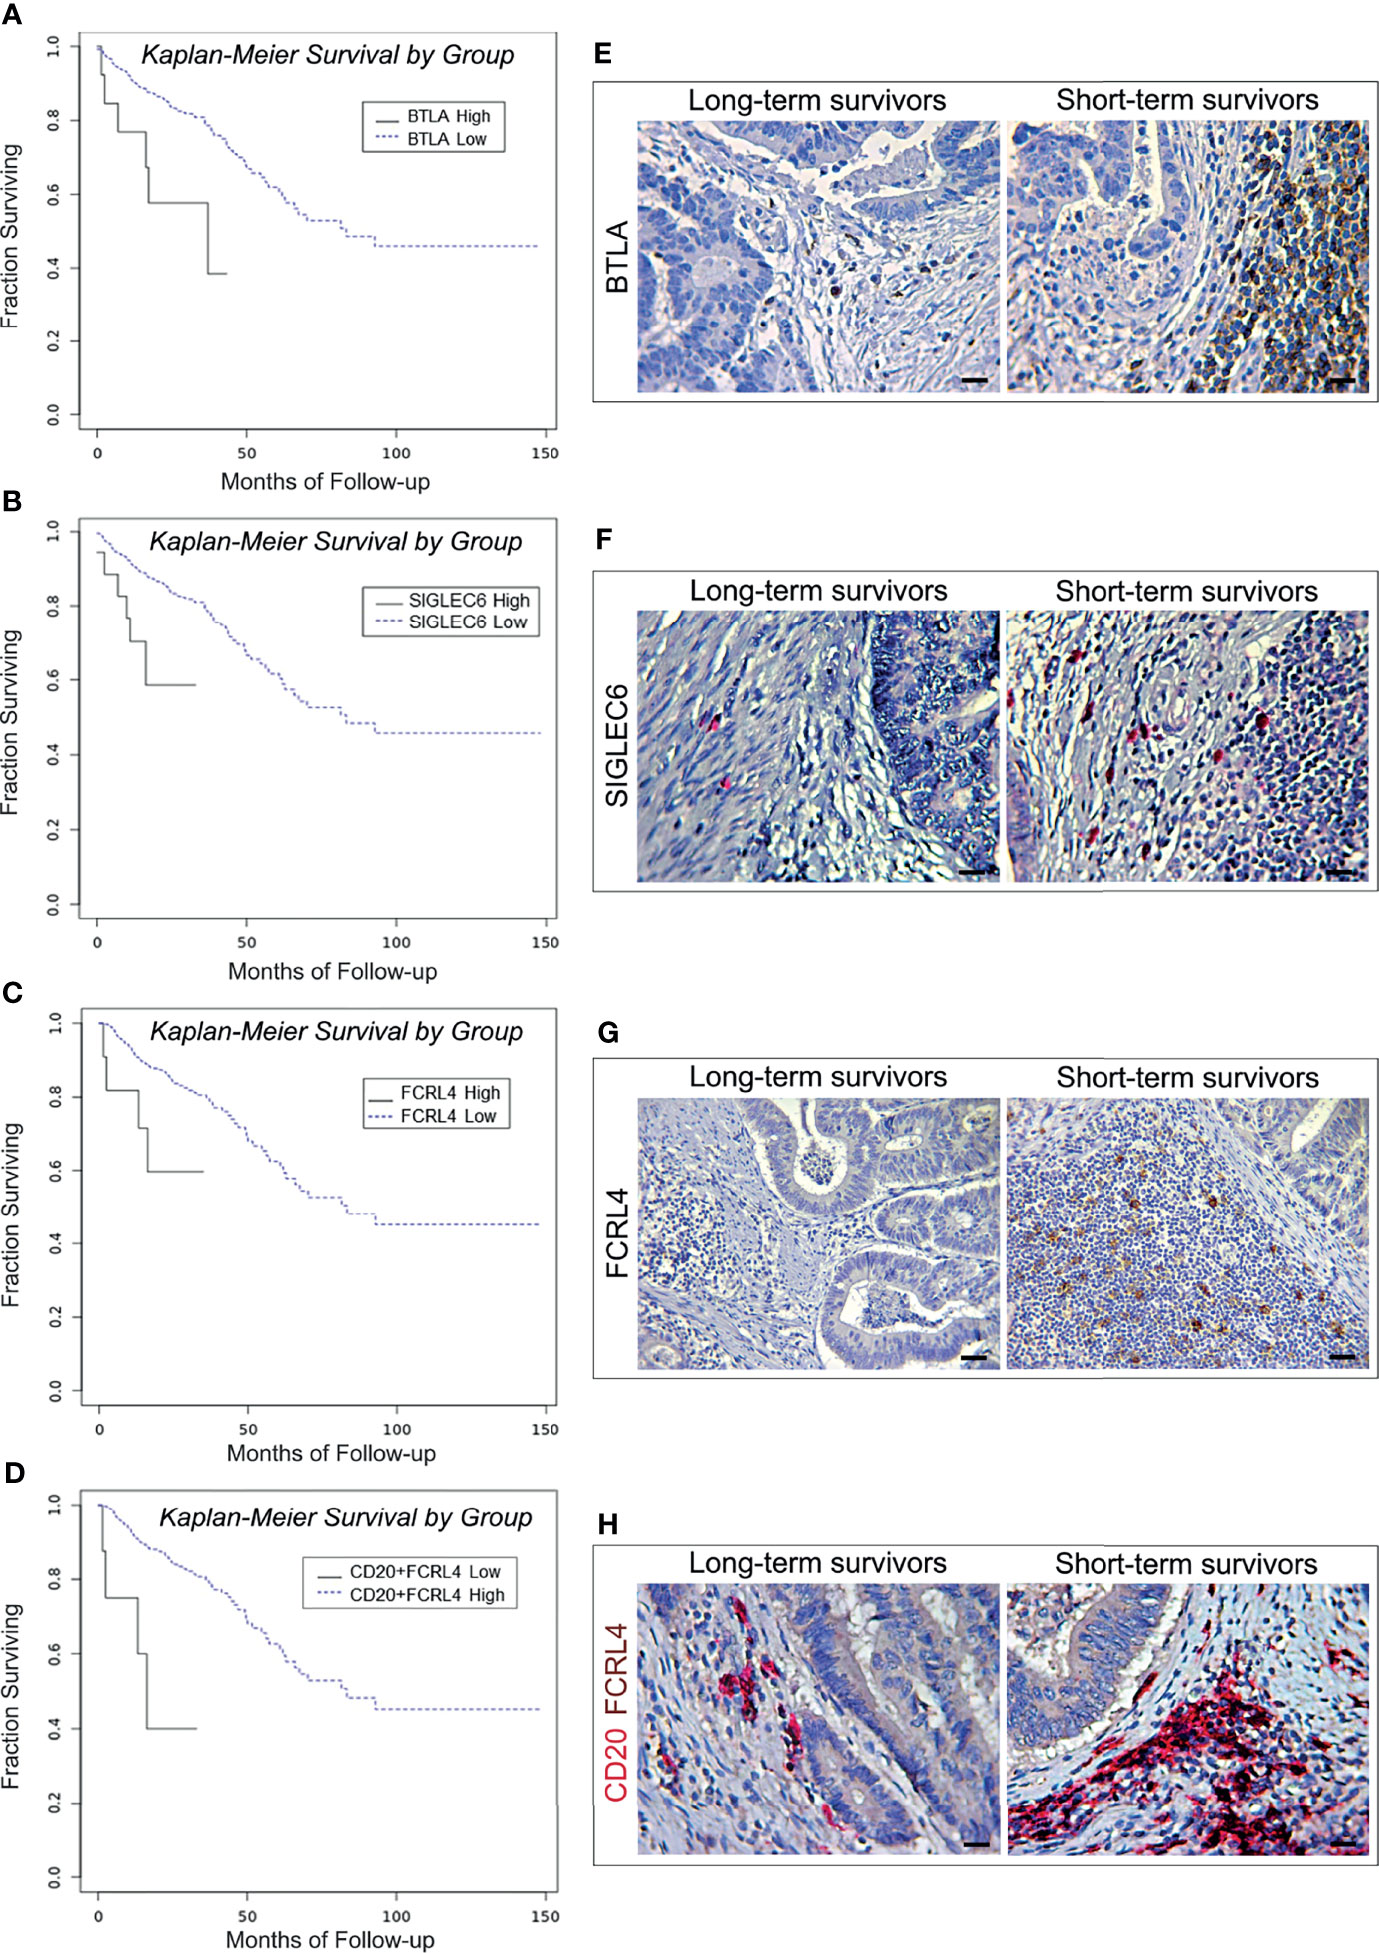
Figure 3 Survival curves and immunopathological features of BTLA, SIGLEC6, and CD20/FCRL4 expression in CRC patients from the PanCancer collection and from the validation cohort. (A) Kaplan-Meier curves representing, for each time point, the fraction of surviving CRC patients classified, based on mRNA expression levels in tumor samples, as BTLA mRNAhigh (n. 15) and BTLA mRNAlow (n. 573). (B) Kaplan-Meier curves representing, for each time point, the fraction of surviving CRC patients classified, based on mRNA expression levels in tumor samples, as FCRL4 mRNAhigh (n. 11) and FCRL4 mRNAlow (n. 351). (C) Kaplan-Meier curves representing, for each time point, the fraction of surviving CRC patients classified, based on mRNA expression levels in tumor samples, as SIGLEC6 mRNAhigh (n. 18) and SIGLEC6 mRNAlow (n. 570). (D) Kaplan-Meier curves representing, for each time point, the fraction of surviving CRC patients classified, based on mRNA expression levels in tumor samples, as CD20 mRNAhigh + FCRL4 mRNAhigh (n. 8) andCD20 mRNAlow + FCRL4 mRNAlow (n. 354). (E) Expression of BTLA in CRC tissue sections obtained from patients with long- and short-term survival. Magnification: X400. Scale bars: 20 μm. (F) Expression of SIGLEC6 in CRC tissue sections obtained from patients with long- and short-term survival. Magnification: X400. Scale bars: 20 μm. (G) Expression of FCRL4 in CRC tissue sections obtained from patients with long- and short-term survival. Magnification: X200. Scale bars: 30 μm. (H) Co-expression of CD20 (red) and FCRL4 (brown) in CRC tissue sections obtained from patients with long- and short-term survival. Magnification: X400. Scale bars: 20 μm.
Morphometric analyses performed on CRC samples from the validation cohort substantiated the survival data of patients from the PanCancer collection, revealing that the mean percentage of BTLA and SIGLEC6 positive cells was significantly (p<0.0001) higher in short-term survivors than in long-term survivors. Moreover, immunostaining for FCRL4 and double staining for both CD20 and FCRL4 performed on CRC samples from short-term survivors, also showed mean percentages of single or double positive cells significantly (p<0.0001) higher than that found in CRC samples from long-term survivors (Table 6 and Figures 3E–H).
Association of Immune Exhaustion Genes With T and B Lymphocyte Markers, and Conventional NK Cell Markers in CRC Samples
Since the expression of many of the genes that regulate functional exhaustion can be shared by multiple immune cell types (30), to bring out the immune populations most involved in the functional exhaustion that occurs in CRC, we next investigated, by OR calculation (Figure 4), if there was an association between the transcriptional expression of each exhaustion gene and immune cell marker genes, which are listed in the Table 3.
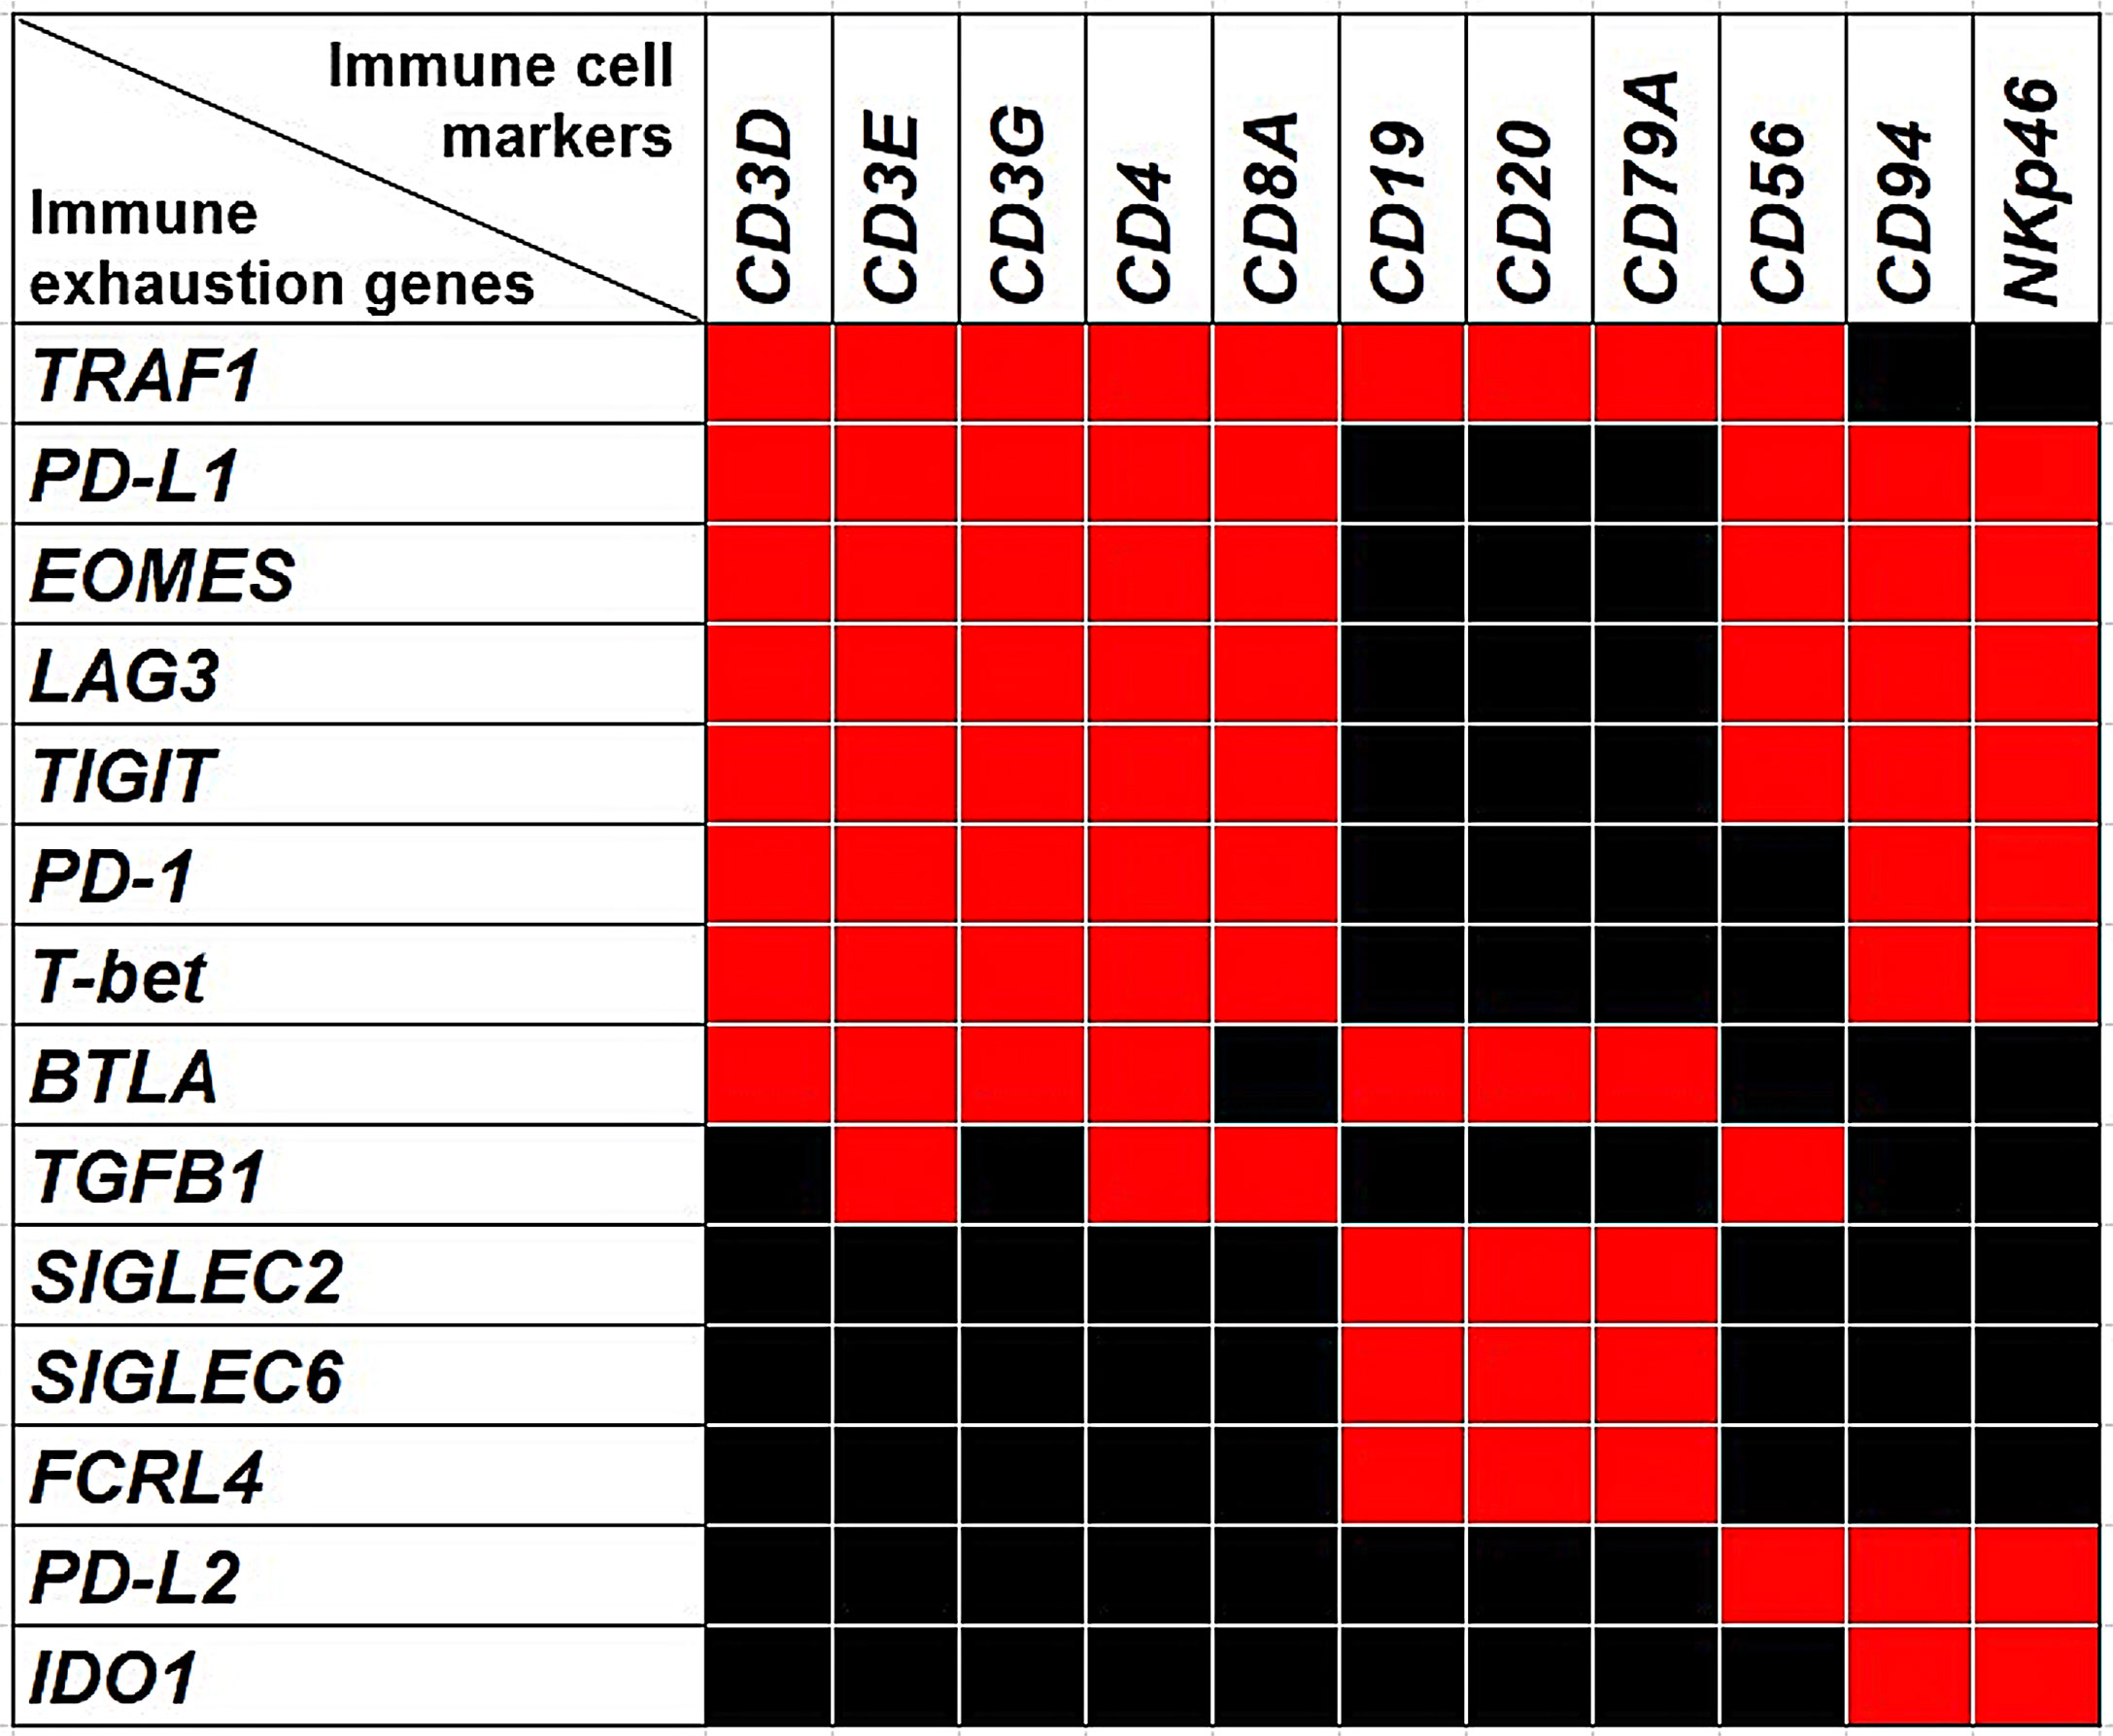
Figure 4 The Heatmap shows the associations between the expression of immune exhaustion genes and the expression of immune cell markers. Red squares indicate co-occurrence (OR >1.5, p<0.05), while black squares indicate lack of association.
a. Expressions of PD-L1, PD-1, LAG3, EOMES, T-bet, TIGIT, TRAF1, BTLA and TGFB1 Are Associated With T Lymphocyte Markers
Expressions of TIGIT, T-bet, EOMES, LAG3, PD-1 and PD-L1 were significantly (p<0.05) correlated with each other and were associated with the expression of genes coding for CD4, CD8a, and CD3γ, CD3δ and CD3ε chains, with an OR >1.5; p<0.05, which suggests that expression of these immune exhaustion genes primarily involves CD8+ and CD4+CD3+ T cells. Furthermore, expression of TRAF1 co-occurred with those of PD-1, PD-L1, EOMES, T-bet, TIGIT, BTLA, CD3γ, CD3δ, CD3ε, CD4 and CD8a, with an OR >2, p<0.05.
BTLA co-occurred with the expression of PD-1, PD-L1, EOMES, T-bet, TIGIT, TRAF1 CD3γ, CD3δ, CD3ε and CD4 (OR >1.5; p<0.05), whereas TGFβ1 co-occurred with PD-1, PD-L1, LAG3, CD3γ, CD8a, and CD4 (OR >2; p<0.05).
To evaluate, at the level of protein expression, the gene expression data provided by bionformatics, CD3 and TRAF1 immunostaining of consecutive serial sections, and double immunostainings of CD3 with PD-L1, or PD-1, or LAG3, or EOMES, or T-bet, or TIGIT or TGFβ1 were performed on CRC samples from the short-term survivors, which revealed a higher level of immune exhaustion. The frequent co-localizations of these immune exhaustion molecules with CD3+ cells, in the lymphoid aggregates, or scattered in the stroma and CRC epithelia, substantiated the biostatistical findings (Figures 5A–I).
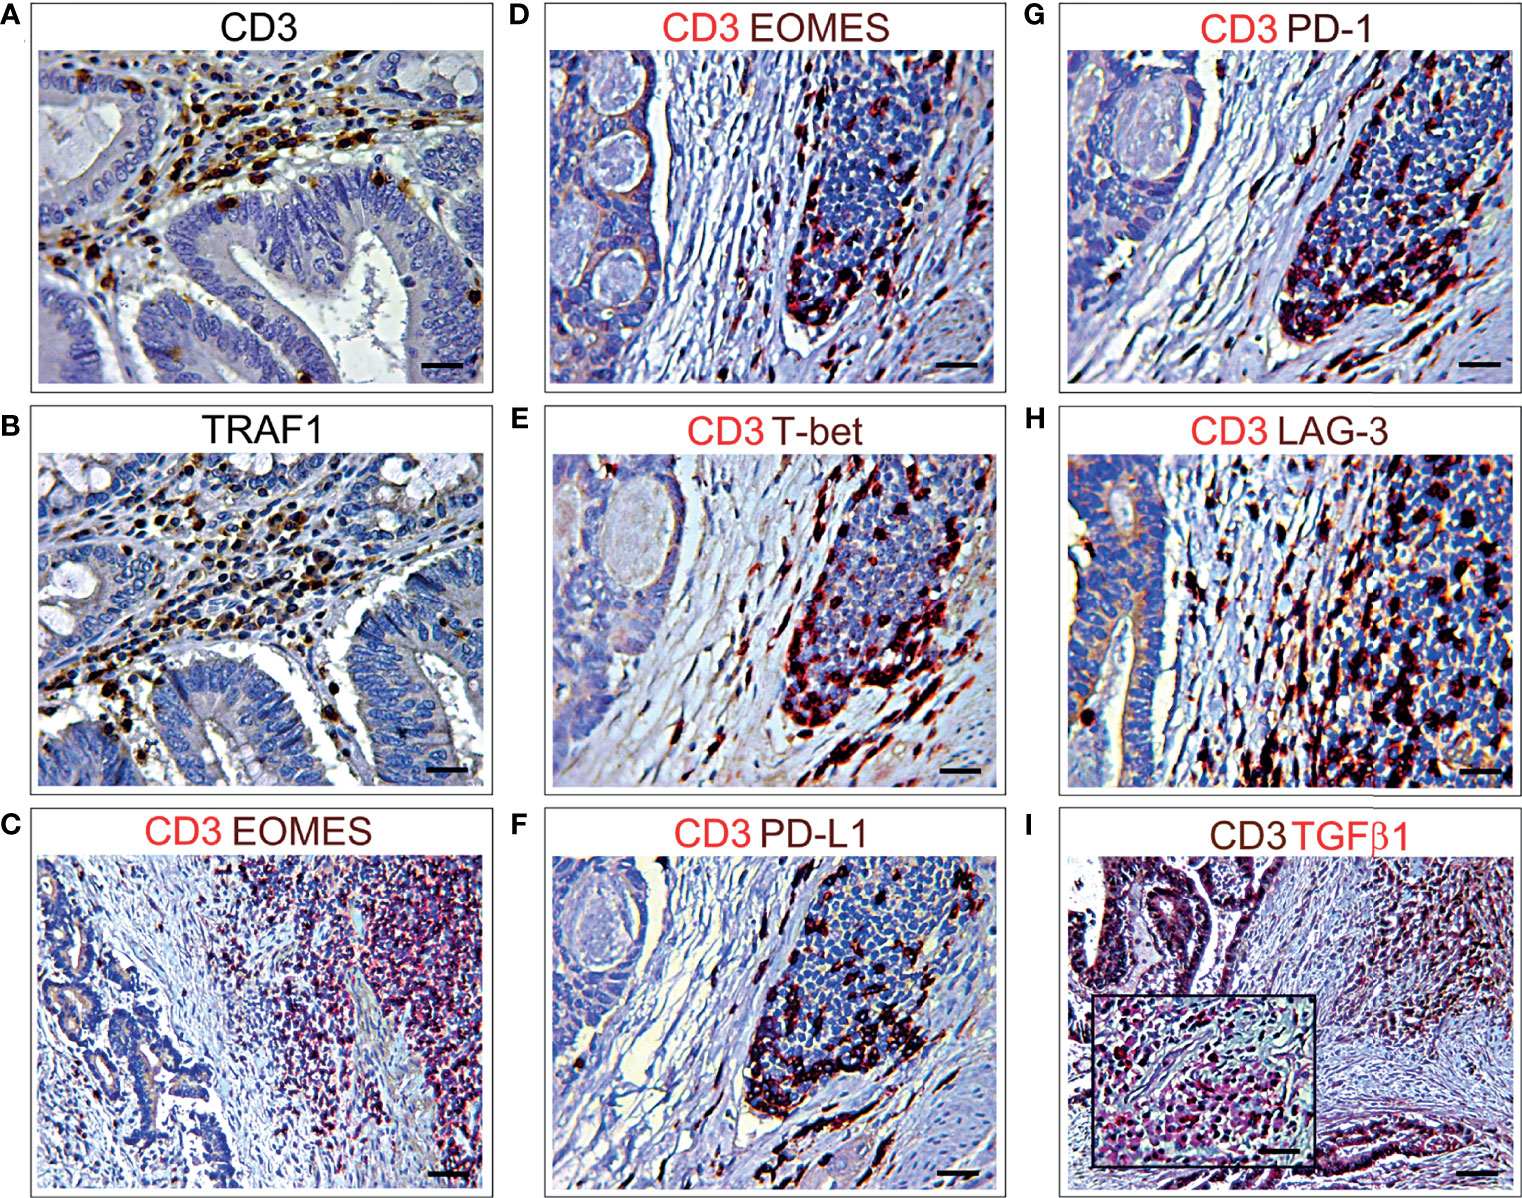
Figure 5 Immunohistochemical features of CD3+ T lymphocyte co-localization with different immune exhaustion molecules in CRC. (A) Immunohistochemical staining of CRC tissue sections, from short-term survivors, showing CD3+ T cells in the stroma, among neoplastic glands. Magnification: X400. Scale bars: 20 μm. (B) Immunohistochemical staining of consecutive serial CRC tissue sections, from short-term survivors, showing TRAF1+ cells localized in the areas infiltrated by CD3+ T cells, among neoplastic glands. Magnification: X400. Scale bars: 20 μm. (C, D). Double immunohistochemical staining of CRC tissue sections from short-term survivors shows a frequent co-localization of EOMES (brown) with CD3 (red). Images C and D represent two different areas of the same sample. Magnification: C, X200; D, X400. Scale bars: C, 30 μm; D, 20 μm. (E) Double immunohistochemical staining of CRC tissue sections from short-term survivors shows a frequent co-localization of T-bet (brown) with CD3 (red). Magnification: X400. Scale bars: 20 μm. (F) Double immunohistochemical staining of CRC tissue sections from short-term survivors shows that the vast majority of CD3+ cells (red) express PD-L1 (brown). Magnification: X400. Scale bars: 20 μm. (G) Double immunohistochemical staining of CRC tissue sections from short-term survivors shows that the vast majority of CD3+ cells (red) express PD-1 (brown). Magnification: X400. Scale bars: 20 μm. (H) Double immunohistochemical staining of CRC tissue sections from short-term survivors shows that most of CD3+ cells (red) express LAG3 (brown). Magnification: X400. Scale bars: 20 μm. (I) Double immunohistochemical staining of CRC tissue sections from short-term survivors shows a frequent co-localization of TGFβ1 (red) with CD3+ cells (brown). Magnification of CD3+TGFβ1+ inflammatory infiltrate in the inset. Magnification: X200; Inset, X400. Scale bars: 30 μm; Inset, 20 μm.
Furthermore, to assess the immune exhaustion-related gene expression by the different T lymphocyte subpopulations, we used CIBERSORTx, which, when applied to the PanCancer collection data, was able to detect, in the context of CRC microenvironment, the expression of FOXP1 and SIRT1 in CD4+ memory resting and CD8+ cells. CD8+ cells also expressed BATF, whereas CD4+ memory resting cells also expressed NR4A1 and TOX.
Interestingly, CIBERSORTx analyses revealed that expression of FOXP1 was not confined to the T cell populations, including T regulatory (Tregs) cells, but also involved both naïve and memory B cells, and that expression of SIRT1 and NR4A1 was extended to naïve B cells, whereas expression of BATF was also found in resting NK cells.
b. Expressions of BTLA, FCRL4, SIGLEC2, SIGLEC6 and TRAF1 Are Associated With B Lymphocyte Markers
Expressions of BTLA, FCRL4 and SIGLEC6, that were found to be associated with a worst outcome (Figures 3A–D), correlated with each other and with the expression of SIGLEC2 (OR >2.5, p<0.05), which also dampens BCR signaling (26). It is noteworthy that, the expression of BTLA, FCRL4, SIGLEC2 and SIGLEC6 genes, showed a moderate co-occurrence with the expression of typical B cell markers, such as CD19, CD20 and CD79a with an OR >2.5, p<0.05, and immunohistochemistry clearly showed the frequent co-localization of BTLA, FCRL4 and SIGLEC6 with CD20+ cells (Figures 3H, 6A, C). As observed for BTLA, the expression of TRAF1 not only co-occurred with T cell markers, but also with the expression of CD19, CD20 and CD79a (OR >2, p<0.05), which was confirmed by immunohistochemistry (Figures 5A, B, 6B), thus suggesting its contribution to B cell exhaustion.

Figure 6 Immunohistochemical features of CD20+ B lymphocyte co-localization with different immune exhaustion molecules in CRC. (A) Double immunohistochemical staining of CRC tissue sections from short-term survivors shows a frequent co-localization of BTLA (brown) with CD20 (red). Magnification: X400. Scale bars: 20 μm. (B) Double immunohistochemical staining of CRC tissue sections from short-term survivors shows a frequent co-localization of TRAF1 (brown) with CD20 (red). Magnification: X400. Scale bars: 20 μm. (C) Double immunohistochemical staining of CRC tissue sections from short-term survivors shows a frequent co-localization of SIGLEC6 (red) with CD20 (brown). Magnification: X400. Scale bars: 20 μm.
c. Expression of PD-L1, PD-L2, PD-1, LAG3, TIGIT and IDO1 Is Associated With Conventional NK Cell Markers
Further insights into the immune exhaustion profiles of CRCs from the PanCancer collection, revealed that expression of genes coding for PD-L1, PD-1, LAG3, and TIGIT not only co-occurred with those coding for T cell markers, but along with the expression of PD-L2 (31), and IDO1 (32, 33), also co-occurred with the expression of genes that identify a subset of group 1 innate lymphoid cells (ILC) defined as conventional (c) NK cells (34), which are endowed with high level expression of transcription factors, EOMES and T-bet, and surface molecules, NKp46 and CD94/NKG2A. The OR for the co-occurrence of PD-L1, PD-1, LAG3, TIGIT, PD-L2, EOMES, T-bet, NKp46 and CD94/NKG2A was > 1.5; p<0.05.
Immunostainings of consecutive (3 μm serial) CRC tissue sections, from short-term survivors of the validation cohort, revealed a distinct expression of TIGIT, IDO1 and PD-L2 among the neoplastic glands, mostly in the areas infiltrated by EOMES+T-bet+NKp46+ cells. However, expression of TIGIT extended to other stromal infiltrating cells, whereas PD-L2 was also expressed by colorectal cancer cells (Figures 7A–H).
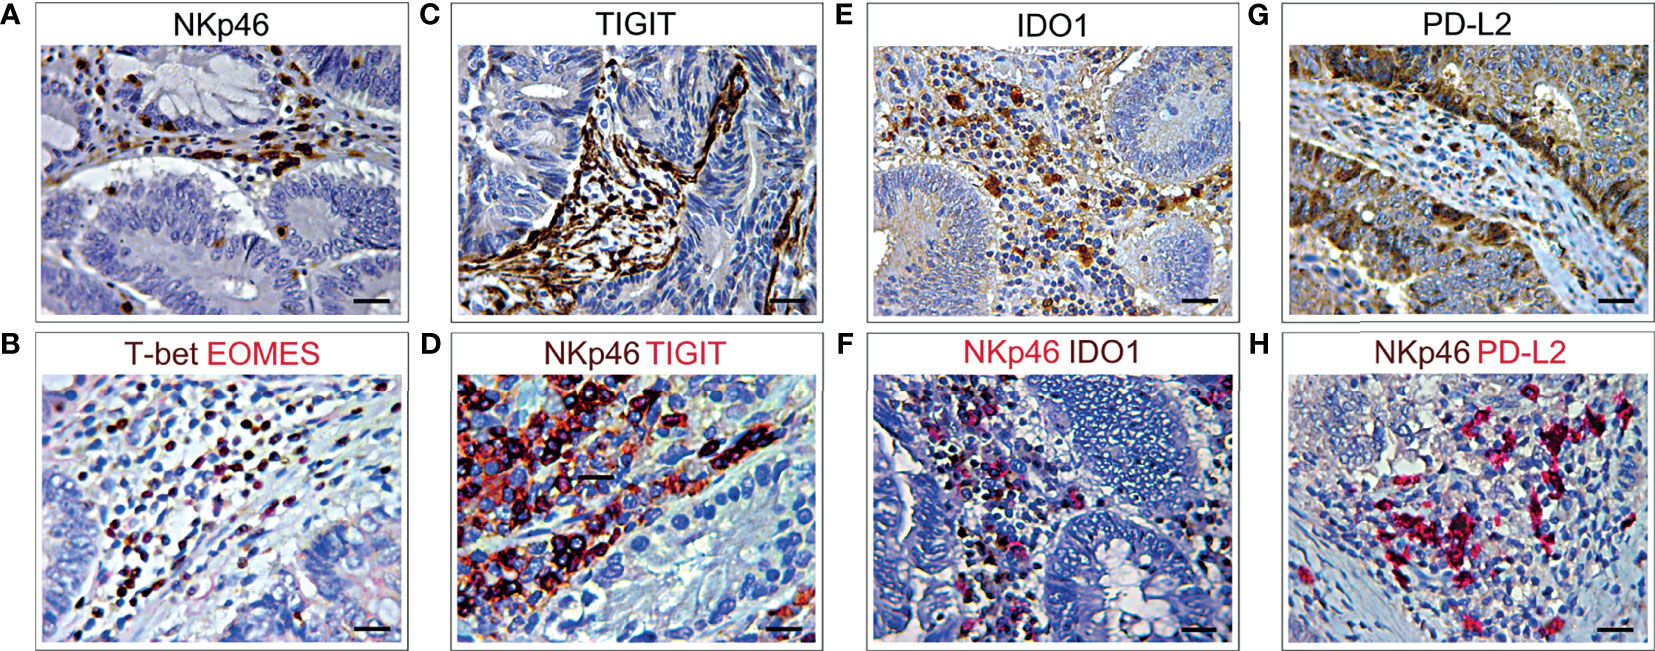
Figure 7 Immunohistochemical features NKp46 co-localization with different immune exhaustion molecules in CRC. (A) Immunohistochemical staining of CRC tissue sections, from short-term survivors, showing NKp46+ cells in the stroma, among neoplastic glands. Magnification: X400. Scale bars: 20 μm. (B) Double immunohistochemistry of consecutive serial CRC tissue sections, showing that EOMES (red) frequently co-localized with T-bet (brown). EOMES+T-bet+ cells (brick red) localized in the stroma, among neoplastic glands, in the same area showing NKp46+ cell infiltrate (A). Magnification: X400. Scale bars: 20 μm. (C) Immunohistochemical staining of consecutive serial CRC tissue sections, showing TIGIT+ cells localized in the stroma, among neoplastic glands. Magnification: X400. Scale bars: 20 μm. (D) Double immunohistochemistry of consecutive serial CRC tissue sections, showing that TIGIT (red) frequently co-localizes with NKp46 cells (brown), as revealed by the brick red stained NKp46+TIGIT+ cells. Magnification: X400. Scale bars: 20 μm. (E) Immunohistochemical staining of consecutive serial CRC tissue sections showing expression of IDO1 in the stroma, among neoplastic glands. Magnification: X400. Scale bars: 20 μm. (F) Double immunohistochemistry of consecutive serial CRC tissue sections, showing that IDO1 (brown) frequently co-localizes with NKp46 cells (red), as revealed by the brick red stained NKp46+IDO1+ cells. Magnification: X400. Scale bars: 20 μm. (G) Immunohistochemical staining of consecutive serial CRC tissue sections showing PD-L2 expression in stromal infiltrating cells and colon cancer cells. Magnification: X400. Scale bars: 20 μm. (H) Double immunohistochemistry of consecutive serial CRC tissue sections, showing that PD-L2 (red) frequently co-localizes with NKp46 cells (brown), as revealed by the brick red stained NKp46+PD-L2+ cells. Magnification: X400. Scale bars: 20 μm.
Taken together, immunohistochemical and morphometric analyses substantiated the biostatistical findings, which suggested that CRC-associated immune exhaustion, demonstrated by high levels of a wide range of immune checkpoint molecules, affects T and B lymphocytes, and cNK cells, and is associated with a worse clinical outcome, independently of the disease stage and molecular subtype.
Discussion
Despite the survival benefit of early detection through increased screening, CRC remains a leading cause of cancer related death (35), which is primarily due to disease progression or to the failure of current therapies to counteract metastasis (36). Immunotherapy, which has recently revolutionized the treatment of advanced tumors (37, 38), needs to be improved for CRC care, since: a) eligible patients are limited to a subset diagnosed with mismatch-repair-deficient mutations or microsatellite instability tumors (39) and, b) responsive patients will eventually experience resistance to treatment and relapse (40), concurrently with a weakening of their immune response, namely immune exhaustion (8). Exhaustion, i.e. the progressive loss of effector function due to chronic low-affinity antigen stimulation, is essential in maintaining immune homeostasis by regulating the duration and the magnitude of T cell responses, through a reduced proliferation, impaired effector functions, and elevated and sustained expression of multiple inhibitory receptors, known as immune checkpoint proteins (41). It is becoming progressively clear that the range of checkpoint inhibitors extends well beyond the few targets of current immunotherapy (41), and that functional exhaustion is not an exclusive matter of T lymphocytes, but heavily involves other immune cell populations (12, 42–44), that take part in mounting an effective immune response (19, 45, 46).
Through biostatistics and immunopathological investigations, this study explores the transcriptional program and immune cell context, that characterize the immune exhaustion landscape of CRC. While confirming the previously reported observation of high levels of expression of PD-L1, LAG3 and T-bet in the context of MSI tumors (39, 47, 49), our findings reveal that, independently of tumor stage and molecular subtype, high levels of a wide range of inhibitory receptors and exhaustion-related transcription factors, such as EOMES, T-bet, PD-L1, PD-1, LAG3, BTLA, FCRL4, SIGLEC6 and TRAF1 are associated with reduced survival in CRC patients.
TRAF1 belongs to the Tumor necrosis factor receptor (TNFR)-associated factors (TRAF) protein family, which plays important roles in the immune system as key intracellular signaling molecules in TNFR, Toll-like receptor (TLR), cytokine and antigen receptor signaling pathways (19). TRAF1 expression in T and B lymphocytes can be induced by different stimuli that activate the transcription factor NF-κB (49–51), and may act as both positive and negative regulator of immune signaling. Our immunopathological analyses show TRAF1 expression in CRC infiltrating immune cells and lymphoid aggregates, mostly in CRC samples from short-term survivors, coherently with its negative prognostic value. Besides being produced by immune cells, TRAF1 can be overexpressed by neoplastic cells in different B cell malignancies, and in solid tumors including non-small cell lung cancer for which TRAF1 has been proposed as a biomarker of tumor progression and worst clinical outcome (52–54).
Both PD-1, which binds to PD-L1 and PD-L2, and LAG3, which binds to MHC class II molecules, can be found on T and B lymphocytes, macrophages, dendritic cells (DCs), and NK cells (55–59). In CRC their expressions are strongly correlated with each other and, along with TIGIT and BTLA, are tightly associated with markers of T lymphocytes and cNK cells, in which they can inhibit receptor dependent activation (60), thereby dampening anti-tumor effector functions.
BTLA is primarily expressed on B and T cells, and on monocytes and DCs to a lesser extent, and shares structural similarity with PD-1, but its only known ligand is the Herpes virus entry mediator (HVEM), a member of the tumor necrosis factor receptor superfamily (TNFR-SF) (61). The inhibition of T cells by BTLA is stronger than the positive stimulatory effect of HVEM, a co-stimulatory tumor-necrosis factor receptor on T cells, and prevents the excessive activation of T cells (62), thereby maintaining T cell tolerance (63). It is prominently expressed on human T cells in the TME and can inhibit tumor specific CD8+ T cells (64). BTLA blockers have been found to enhance human T cell responses when used alone or in combination with antibodies against PD-1 (65–67). Although it is well established that BTLA mainly functions as a negative regulator of lymphocytes, recent studies indicate that the role of BTLA in tumor-resident T cells is complex, as engagement by its ligand, HVEM, inhibits proliferation and cytokine production, but promotes survival of tumor-infiltrating lymphocytes (68). Furthermore, BTLA associates with the BCR and, upon binding to HVEM, recruits the tyrosine phosphatase Src homology 2 domain-containing phosphatase 1, reduces activation of signaling molecules downstream of the BCR and inhibits B cell activation (69).
The role of TGFβ1 in the development of T regulatory cells and immunosuppression is well established (70, 71). In CRC its expression has been found to be increased when compared to adenoma and normal colon tissue (72). Elevated TGFβ1 levels were observed in the primary tumor and in plasma from CRC patients and were correlated with metastasis and poor prognosis (73, 74). TGFβ1 has also been implicated in T cell exhaustion. Notably, inhibition of TGFβ1 can prevent CRC metastasis by unleashing a cytotoxic T cell response against cancer cells, implying that TGFβ1 signaling suppresses cancer recognition by the immune system (75, 76). In vivo, inhibition of TGFβ1 signaling in CD8+ T cells, through expression of a dominant-negative receptor, improved the function of exhausted T cells (77). Enhanced and sustained TGFβ1/Smad signaling is a distinctive feature of virus-specific CD8+ T cells during chronic viral infections in vivo and leads to the up-regulation of the pro-apoptotic protein Bim and to T cell apoptosis. By contrast diminished TGFβ receptor signaling reduces T cell death and indirectly inhibits PD-1 and IL10 expression, and enables the acquisition of effector CD8+ T cell functions (77).
While PD-L2 expression is mainly restricted to professional APCs, such as DCs and macrophages, PD-L1 is constitutively expressed by T and B cells, macrophages and DCs and is up-regulated by inflammatory mediators (78). However, it can also be expressed by cancer cells in different tumors, including CRC, and inhibit the adaptive immune response preventing tumor cell apoptosis, which could explain the association of its high levels of expression with a worse clinical outcome (79–81).
EOMES and T-bet are T-box transcription factors that drive the differentiation and function of cytotoxic CD8+ T lymphocytes and NK cells (82) and that promote type 1 innate and adaptive cell-mediated immunity (83). In HCV and HIV infected patients, EOMEShigh T cells display high expression of inhibitory receptors and severe functional defects, that lead to the persistent stage of chronic infection (84, 85). In acute myeloid leukemia, it has been reported that EOMES binds to the promoter of TIGIT and up-regulates the expression of this inhibitory receptor on patient-derived T cells. Moreover, in these patients a high frequency of EOMES+ T-betlow CD8+ T cells was associated with poor response to chemotherapy and shorter OS (86, 87). Co-expression of high levels of EOMES and T-bet, and its correlation with the expression of PD-L1, PD-1, LAG3, and TIGIT has been determined, trough bioinformatic analyses, in CRC from patients with a shorter OS, and confirmed by immunopathological investigations.
TIGIT is a checkpoint receptor which mediates T and NK cell exhaustion in tumor-bearing mice and in patients with colon cancer (88). Immunostainings of CRC samples from short-term survivors show a strong expression of TIGIT in intra-tumoral immune cells, scattered within the cancer and lymphoid structures, but also in fibroblast-like stromal cells, resulting in a robust barrier against immune attack. Blockade of TIGIT, in colon cancer-bearing mice, prevents NK cell exhaustion and promotes a potent tumor-specific T cell immunity in an NK cell-dependent manner (88). Conventional NK cells belong to group 1 ILCs and are essential in killing infected or transformed cells that have null or low expression levels of MHC-I molecules (89, 90). NK cells are involved in the control of CRC progression and metastasis, but they are also susceptible to tumor-directed dysregulation (60, 91, 92). Similar to T cells, NK cells undergo exhaustion during tumor progression or chronic infections and reveal impaired cytolytic activity and production of effector cytokines, downregulation of activating receptors and overexpression of inhibitory receptors (93). Analysis of RNA-seq data from the TCGA PanCancer cohort and morphological investigations of CRC samples from the validation cohort, reveal that expression of PD-L1, PD-1, LAG3, EOMES, T-bet and TIGIT is associated and co-localizes not only with CD8+ and CD4+CD3+ T cells, but as well as with the expression of PD-L2 and IDO1, it co-occurs with typical markers of cNK cells, which are identified as NKp46+EOMES+T-bet+CD94+, a subset of group 1 ILCs (34). Group 1 ILCs were found to be increased in CRC, when compared with normal colonic mucosa (94), and to exhibit high level of inhibitory receptor in the late stage of the disease (92). The CD94/NKG2-A functions as a natural killer cell inhibitory receptor for different HLA class I alleles (95) including HLA-E, its predominant ligand, which confers resistance to NK-cell-mediated lysis (96). PD-1 overexpression in NK cells results in decreased degranulation (97), indicating that PD-1 signaling is suppressive not only in T cells but also in NK cells, and identifies a subset of fully mature NK cells with low proliferative response and impaired anti-tumor activity (98). A role as inhibitor of NK effector functions has been recently described also for IDO1, a rate-limiting metabolic enzyme that converts tryptophan into downstream catabolites kynurenines (KYN) (99) and is involved in the establishment and maintenance of peripheral tolerance and tumor immune escape (33). It has been demonstrated that KYN suppresses the function of CD4+ T cells and DCs (100) and promotes NK cell apoptosis (101), and that tryptophan-derived L-KYN impairs NK cell cytotoxicity by decreasing NKp46 and NKG2D/NKG2DLs activating receptors (102–104).
A scenario which mimics exhaustion in T lymphocytes, can affect B cells during chronic infection, inflammatory diseases (9, 25, 105) and cancer (106). B cell exhaustion manifests through the progressive loss of effector functions, of antibody and cytokine production, and high levels of inhibitory receptors. BTLA, FCRL4 and SIGLEC6, which have been shown to inhibit BCR signaling (26), have been found to be highly expressed in CRC from patients with shorter OS, by Kaplan Meyer curves of the PanCancer cohort, and in CRC of short-term survivors from the validation cohort, as detected by immunopathology. The tight association of high levels of BTLA, FCRL4, SIGLEC2 and SIGLEC6 (107) with the B lymphocyte markers, CD19, CD20 and CD79a, along with their negative prognostic value, strongly suggests a role for exhausted B lymphocytes in CRC immune escape and patient outcome.
The CIBERSORTx tool, which identifies immune cell subpopulations, based on their molecular signature, provides additional information on the immune exhaustion landscape of CRC, and strengthens the concept that, in the TME, exhaustion affects cells other than just T lymphocytes. Expression of FOXP1 and SIRT1, which can suppress antitumor T cells (108) and promote chemoresistance (109, 110), has been found in CRC infiltrating Tregs (FOXP1), CD8+ and memory resting CD4+ cells, but also in naïve and memory B lymphocytes (both FOXP1 and SIRT1). Expression of BATF involves CD8+ cells (111), but also resting NK cells, while expression of NR4A1 and TOX (112, 113) has been found in memory resting CD4+ cells, but also in naïve and memory B cells, respectively.
The integration of bioinformatics with immunopathology, used in the present study, provides new insight into the CRC microenvironment and its clinical relevance. Results suggest that CRC-associated immune exhaustion is not limited to the MSI subtype and is not exclusive of T lymphocytes, but it also involves B cells and cNK cells, and includes a wide range of checkpoint molecules and immune-related transcription factors, with significant prognostic and therapeutic implications. Taken as a whole, our findings emphasize the need to extend genome sequencing and comprehensive immunopathological analyses of individual CRC into the clinical practice, for the development of a multi-targeted patient tailored immunotherapy to effectively counteract disease progression.
Data Availability Statement
The raw data supporting the conclusions of this article will be made available by the authors, without undue reservation.
Ethics Statement
The studies involving human participants were reviewed and approved by Ethical Committee of the “G. d’Annunzio” University and Local Health Authority of Chieti. The patients/participants provided their written informed consent to participate in this study.
Author Contributions
EDC conceived and supervised the study. CS performed bioinformatic analyses. LD’A, CF, and SLC performed the experiments. EDC, CS, and LD’A interpreted the data. EDC wrote the manuscript. All authors contributed to the article and approved the submitted version.
Funding
The research leading to these results has received funding from AIRC under IG 2019 - ID. 23264 project – P.I. EDC and from the Italian Ministry of University and Research (PRIN - 2017M8YMR8 – Unit 3 P.I. EDC).
Conflict of Interest
The authors declare that the research was conducted in the absence of any commercial or financial relationships that could be construed as a potential conflict of interest.
Publisher’s Note
All claims expressed in this article are solely those of the authors and do not necessarily represent those of their affiliated organizations, or those of the publisher, the editors and the reviewers. Any product that may be evaluated in this article, or claim that may be made by its manufacturer, is not guaranteed or endorsed by the publisher.
References
1. World Health Organization. Cancer Today (2020). Available at: https://gco.iarc.fr/today/home (Accessed September 02, 2021).
2. Leporrier J, Maurel J, Chiche L, Bara S, Segol P, Launoy G. A Population-Based Study of the Incidence, Management and Prognosis of Hepatic Metastases From Colorectal Cancer. Br J Surg (2006) 93:465–74. doi: 10.1002/bjs.5278
3. Smetana K Jr, Lacina L, Szabo P, Dvořánková B, Brož P, Šedo A. Ageing as an Important Risk Factor for Cancer. Anticancer Res (2016) 36:5009–17. doi: 10.21873/anticanres.11069
4. Wang W, Kandimalla R, Huang H, Zhu L, Li Y, Gao F, et al. Molecular Subtyping of Colorectal Cancer: Recent Progress, New Challenges and Emerging Opportunities. Semin Cancer Biol (2019) 55:37–52. doi: 10.1016/j.semcancer.2018.05.002
5. Lin A, Zhang J, Luo P. Crosstalk Between the MSI Status and Tumor Microenvironment in Colorectal Cancer. Front Immunol (2020) 11:2039. doi: 10.3389/fimmu.2020.02039
6. Zhao P, Li L, Jiang X, Li Q. Mismatch Repair Deficiency/Microsatellite Instability-High as a Predictor for Anti-PD-1/PD-L1 Immunotherapy Efficacy. J Hematol Oncol (2019) 12:54. doi: 10.1186/s13045-019-0738-1
7. Blank CU, Haining WN, Held W, Hogan PG, Kallies A, Lugli E, et al. Defining ‘T Cell Exhaustion’. Nat Rev Immunol (2019) 19:665–74. doi: 10.1038/s41577-019-0221-9
8. Wherry EJ, Kurachi M. Molecular and Cellular Insights Into T Cell Exhaustion. Nat Rev Immunol (2015) 15:486–99. doi: 10.1038/nri3862
9. Pritchard NR, Smith KG. B Cell Inhibitory Receptors and Autoimmunity. Immunology (2003) 108:263–73. doi: 10.1046/j.1365-2567.2003.01592.x
10. Sungur CM, Murphy WJ. Positive and Negative Regulation by NK Cells in Cancer. Crit Rev Oncog (2014) 19:57–66. doi: 10.1615/CritRevOncog.2014010805
11. Merino AM, Kim H, Miller JS, Cichocki F. Unraveling Exhaustion in Adaptive and Conventional NK Cells. J Leukoc Biol (2020) 108:1361–8. doi: 10.1002/JLB.4MR0620-091R
12. Mariotti FR, Quatrini L, Munari E, Vacca P, Moretta L. Innate Lymphoid Cells: Expression of PD-1 and Other Checkpoints in Normal and Pathological Conditions. Front Immunol (2019) 10:910. doi: 10.3389/fimmu.2019.00910
13. Newman AM, Steen CB, Liu CL, Gentles AJ, Chaudhuri AA, Scherer F, et al. Determining Cell Type Abundance and Expression From Bulk Tissues With Digital Cytometry. Nat Biotechnol (2019) 37:773–82. doi: 10.1038/s41587-019-0114-2
14. Newman AM, Liu CL, Green MR, Gentles AJ, Feng W, Xu Y, et al. Robust Enumeration of Cell Subsets From Tissue Expression Profiles. Nat Methods (2015) 12:453–7. doi: 10.1038/nmeth.3337
16. The Royal College of Pathologists. Dataset for Colorectal Cancer Histopathology Reports (2014). Available at: https://www.rcpath.org/uploads/assets/e94ce4a2-d722-44a7-84b9d68294134cfc/Dataset-for-colorectal-cancer-histopathology-reports-3rd-edition.pdf (Accessed November 12, 2021).
17. Sorrentino C, Musiani P, Pompa P, Cipollone G, Di Carlo E. Androgen Deprivation Boosts Prostatic Infiltration of Cytotoxic and Regulatory T Lymphocytes and has No Effect on Disease-Free Survival in Prostate Cancer Patients. Clin Cancer Res (2011) 17:1571–81. doi: 10.1158/1078-0432.CCR-10-2804
18. Väyrynen JP, Sajanti SA, Klintrup K, Mäkelä J, Herzig KH, Karttunen TJ, et al. Characteristics and Significance of Colorectal Cancer Associated Lymphoid Reaction. Int J Cancer (2014) 134:2126–35. doi: 10.1002/ijc.28533
19. Kinker GS, Vitiello GAF, Ferreira WAS, Chaves AS, Cordeiro de Lima VC, Medina TDS. B Cell Orchestration of Anti-Tumor Immune Responses: A Matter of Cell Localization and Communication. Front Cell Dev Biol (2021) 9:678127. doi: 10.3389/fcell.2021.678127
20. McLane LM, Abdel-Hakeem MS, Wherry EJ. CD8 T Cell Exhaustion During Chronic Viral Infection and Cancer. Annu Rev Immunol (2019) 37:457–95. doi: 10.1146/annurev-immunol-041015-055318
21. Hoadley KA, Yau C, Hinoue T, Wolf DM, Lazar AJ, Drill E, et al. Cell-Of-Origin Patterns Dominate the Molecular Classification of 10,000 Tumors From 33 Types of Cancer. Cell (2018) 173:291–304.e6. doi: 10.1016/j.cell.2018.03.022
22. Boland CR, Goel A. Microsatellite Instability in Colorectal Cancer. Gastroenterology (2010) 138:2073–87.e3. doi: 10.1053/j.gastro.2009.12.064
23. Maby P, Galon J, Latouche JB. Frameshift Mutations, Neoantigens and Tumor-Specific CD8(+) T Cells in Microsatellite Unstable Colorectal Cancers. Oncoimmunology (2015) 5:e1115943. doi: 10.1080/2162402X.2015.1115943
24. Moir S, Fauci AS. B-Cell Exhaustion in HIV Infection: The Role of Immune Activation. Curr Opin HIV AIDS (2014) 9:472–7. doi: 10.1097/COH.0000000000000092
25. Nitschke L. The Role of CD22 and Other Inhibitory Co-Receptors in B-Cell Activation. Curr Opin Immunol (2005) 17:290–7. doi: 10.1016/j.coi.2005.03.005
26. Kardava L, Moir S, Wang W, Ho J, Buckner CM, Posada JG, et al. Attenuation of HIV-Associated Human B Cell Exhaustion by siRNA Downregulation of Inhibitory Receptors. J Clin Invest (2011) 121:2614–24. doi: 10.1172/JCI45685
27. Ning Z, Liu K, Xiong H. Roles of BTLA in Immunity and Immune Disorders. Front Immunol (2021) 12:654960. doi: 10.3389/fimmu.2021.654960
28. Ehrhardt GR, Davis RS, Hsu JT, Leu CM, Ehrhardt A, Cooper MD. The Inhibitory Potential of Fc Receptor Homolog 4 on Memory B Cells. Proc Natl Acad Sci USA (2003) 100:13489–94. doi: 10.1073/pnas.1935944100
29. Crocker PR, Paulson JC, Varki A. Siglecs and Their Roles in the Immune System. Nat Rev Immunol (2007) 7:255–66. doi: 10.1038/nri2056
30. Schnell A, Bod L, Madi A, Kuchroo VK. The Yin and Yang of Co-Inhibitory Receptors: Toward Anti-Tumor Immunity Without Autoimmunity. Cell Res (2020) 30:285–99. doi: 10.1038/s41422-020-0277-x
31. Tanegashima T, Togashi Y, Azuma K, Kawahara A, Ideguchi K, Sugiyama D, et al. Immune Suppression by PD-L2 Against Spontaneous and Treatment-Related Antitumor Immunity. Clin Cancer Res (2019) 25:4808–19. doi: 10.1158/1078-0432.CCR-18-3991
32. Wang D, Saga Y, Mizukami H, Sato N, Nonaka H, Fujiwara H, et al. Indoleamine-2,3-Dioxygenase, an Immunosuppressive Enzyme That Inhibits Natural Killer Cell Function, as a Useful Target for Ovarian Cancer Therapy. Int J Oncol (2012) 40:929–34. doi: 10.3892/ijo.2011.1295
33. Vacchelli E, Aranda F, Eggermont A, Sautès-Fridman C, Tartour E, Kennedy EP, et al. Trial Watch: IDO Inhibitors in Cancer Therapy. Oncoimmunology (2014) 3:e957994. doi: 10.4161/21624011.2014.957994
34. Wagner M, Moro K, Koyasu S. Plastic Heterogeneity of Innate Lymphoid Cells in Cancer. Trends Cancer (2017) 3:326–35. doi: 10.1016/j.trecan.2017.03.008
35. Bray F, Ferlay J, Soerjomataram I, Siegel RL, Torre LA, Jemal A. Global Cancer Statistics 2018: GLOBOCAN Estimates of Incidence and Mortality Worldwide for 36 Cancers in 185 Countries. CA Cancer J Clin (2018) 68:394–424. doi: 10.3322/caac.21492
36. Siegel RL, Miller KD, Jemal A. Cancer Statistics, 2019. CA Cancer J Clin (2019) 69:7–34. doi: 10.3322/caac.21551
37. Sharma P, Allison JP. The Future of Immune Checkpoint Therapy. Science (2015) 348:56–61. doi: 10.1126/science.aaa8172
38. Decker WK, da Silva RF, Sanabria MH, Angelo LS, Guimarães F, Burt BM, et al. Cancer Immunotherapy: Historical Perspective of a Clinical Revolution and Emerging Preclinical Animal Models. Front Immunol (2017) 8:829. doi: 10.3389/fimmu.2017.00829
39. Xiao Y, Freeman GJ. The Microsatellite Instable Subset of Colorectal Cancer Is a Particularly Good Candidate for Checkpoint Blockade Immunotherapy. Cancer Discovery (2015) 5:16–8. doi: 10.1158/2159-8290.CD-14-1397
40. Van Cutsem E, Cervantes A, Adam R, Sobrero A, Van Krieken JH, Aderka D, et al. ESMO Consensus Guidelines for the Management of Patients With Metastatic Colorectal Cancer. Ann Oncol (2016) 27:1386–422. doi: 10.1093/annonc/mdw235
41. Qin S, Xu L, Yi M, Yu S, Wu K, Luo S. Novel Immune Checkpoint Targets: Moving Beyond PD-1 and CTLA-4. Mol Cancer (2019) 18:155. doi: 10.1186/s12943-019-1091-2
42. Waldman AD, Fritz JM, Lenardo MJ. A Guide to Cancer Immunotherapy: From T Cell Basic Science to Clinical Practice. Nat Rev Immunol (2020) 20:651–68. doi: 10.1038/s41577-020-0306-5
43. Sciaranghella G, Tong N, Mahan AE, Suscovich TJ, Alter G. Decoupling Activation and Exhaustion of B Cells in Spontaneous Controllers of HIV Infection. AIDS (2013) 27:175–80. doi: 10.1097/QAD.0b013e32835bd1f0
44. Kumar S. Natural Killer Cell Cytotoxicity and its Regulation by Inhibitory Receptors. Immunology (2018) 154:383–93. doi: 10.1111/imm.12921
45. Malmberg KJ, Carlsten M, Björklund A, Sohlberg E, Bryceson YT, Ljunggren HG. Natural Killer Cell-Mediated Immunosurveillance of Human Cancer. Semin Immunol (2017) 31:20–9. doi: 10.1016/j.smim.2017.08.002
46. Xia M, Wang B, Wang Z, Zhang X, Wang X. Epigenetic Regulation of NK Cell-Mediated Antitumor Immunity. Front Immunol (2021) 12:672328. doi: 10.3389/fimmu.2021.672328
47. Llosa NJ, Cruise M, Tam A, Wicks EC, Hechenbleikner EM, Taube JM, et al. The Vigorous Immune Microenvironment of Microsatellite Instable Colon Cancer Is Balanced by Multiple Counter-Inhibitory Checkpoints. Cancer Discov (2015) 5:43–51. doi: 10.1158/2159-8290.CD-14-0863
48. Boissière-Michot F, Lazennec G, Frugier H, Jarlier M, Roca L, Duffour J, et al. Characterization of an Adaptive Immune Response in Microsatellite-Instable Colorectal Cancer. Oncoimmunology (2014) 3:e29256. doi: 10.4161/onci.29256
49. Rothe M, Wong SC, Henzel WJ, Goeddel DV. A Novel Family of Putative Signal Transducers Associated With the Cytoplasmic Domain of the 75 kDa Tumor Necrosis Factor Receptor. Cell (1994) 78:681–92. doi: 10.1016/0092-8674(94)90532-0
50. Schwenzer R, Siemienski K, Liptay S, Schubert G, Peters N, Scheurich P, et al. The Human Tumor Necrosis Factor (TNF) Receptor-Associated Factor 1 Gene (TRAF1) Is Up-Regulated by Cytokines of the TNF Ligand Family and Modulates TNF-Induced Activation of NF-kappaB and C-Jun N-Terminal Kinase. J Biol Chem (1999) 274:19368–74. doi: 10.1074/jbc.274.27.19368
51. Wajant H, Henkler F, Scheurich P. The TNF-Receptor-Associated Factor Family: Scaffold Molecules for Cytokine Receptors, Kinases and Their Regulators. Cell Signal (2001) 13:389–400. doi: 10.1016/S0898-6568(01)00160-7
52. Wang Q, Gao G, Zhang T, Yao K, Chen H, Park MH, et al. TRAF1 Is Critical for Regulating the BRAF/MEK/ERK Pathway in Non-Small Cell Lung Carcinogenesis. Cancer Res (2018) 78:3982–94. doi: 10.1158/0008-5472.CAN-18-0429
53. Wen X, Wang B, Feng T, Yuan W, Zhou J, Fang T. TNF Receptor-Associated Factor 1 as a Biomarker for Assessment of non-Small Cell Lung Cancer Metastasis and Overall Survival. Clin Respir J (2018) 12:2197–203. doi: 10.1111/crj.12789
54. Zhu S, Jin J, Gokhale S, Lu AM, Shan H, Feng J, et al. Genetic Alterations of TRAF Proteins in Human Cancers. Front Immunol (2018) 9:2111. doi: 10.3389/fimmu.2018.02111
55. Tumeh PC, Harview CL, Yearley JH, Shintaku IP, Taylor EJ, Robert L, et al. PD-1 Blockade Induces Responses by Inhibiting Adaptive Immune Resistance. Nature (2014) 515:568–71. doi: 10.1038/nature13954
56. De Sousa Linhares A, Leitner J, Grabmeier-Pfistershammer K, Steinberger P. Not All Immune Checkpoints Are Created Equal. Front Immunol (2018) 9:1909. doi: 10.3389/fimmu.2018.01909
57. Freeman GJ, Long AJ, Iwai Y, Bourque K, Chernova T, Nishimura H, et al. Engagement of the PD-1 Immunoinhibitory Receptor by a Novel B7 Family Member Leads to Negative Regulation of Lymphocyte Activation. J Exp Med (2000) 192:1027–34. doi: 10.1084/jem.192.7.1027
58. Kisielow M, Kisielow J, Capoferri-Sollami G, Karjalainen K. Expression of Lymphocyte Activation Gene 3 (LAG3) on B Cells Is Induced by T Cells. Eur J Immunol (2005) 35:2081–8. doi: 10.1002/eji.200526090
59. Anderson AC, Joller N, Kuchroo VK. LAG3, Tim-3, and TIGIT: Co-Inhibitory Receptors With Specialized Functions in Immune Regulation. Immunity (2016) 44:989–1004. doi: 10.1016/j.immuni.2016.05.001
60. Bi J, Tian Z. NK Cell Dysfunction and Checkpoint Immunotherapy. Front Immunol (2019) 10:1999. doi: 10.3389/fimmu.2019.01999
61. Murphy TL, Murphy KM. Slow Down and Survive: Enigmatic Immunoregulation by BTLA and HVEM. Annu Rev Immunol (2010) 28:389–411. doi: 10.1146/annurev-immunol-030409-101202
62. Tao R, Wang L, Murphy KM, Fraser CC, Hancock WW. Regulatory T Cell Expression of Herpesvirus Entry Mediator Suppresses the Function of B and T Lymphocyte Attenuator-Positive Effector T Cells. J Immunol (2008) 180:6649–55. doi: 10.4049/jimmunol.180.10.6649
63. Cheung TC, Oborne LM, Steinberg MW, Macauley MG, Fukuyama S, Sanjo H, et al. T Cell Intrinsic Heterodimeric Complexes Between HVEM and BTLA Determine Receptivity to the Surrounding Microenvironment. J Immunol (2009) 183:7286–96. doi: 10.4049/jimmunol.0902490
64. Derré L, Rivals JP, Jandus C, Pastor S, Rimoldi D, Romero P, et al. BTLA Mediates Inhibition of Human Tumor-Specific CD8+ T Cells That can be Partially Reversed by Vaccination. J Clin Invest (2010) 120:157–67. doi: 10.1172/JCI40070
65. Stecher C, Battin C, Leitner J, Zettl M, Grabmeier-Pfistershammer K, Höller C, et al. PD-1 Blockade Promotes Emerging Checkpoint Inhibitors in Enhancing T Cell Responses to Allogeneic Dendritic Cells. Front Immunol (2017) 8:572. doi: 10.3389/fimmu.2017.00572
66. Grabmeier-Pfistershammer K, Stecher C, Zettl M, Rosskopf S, Rieger A, Zlabinger GJ, et al. Antibodies Targeting BTLA or TIM-3 Enhance HIV-1 Specific T Cell Responses in Combination With PD-1 Blockade. Clin Immunol (2017) 183:167–73. doi: 10.1016/j.clim.2017.09.002
67. Fourcade J, Sun Z, Pagliano O, Guillaume P, Luescher IF, Sander C, et al. CD8(+) T Cells Specific for Tumor Antigens can be Rendered Dysfunctional by the Tumor Microenvironment Through Upregulation of the Inhibitory Receptors BTLA and PD-1. Cancer Res (2012) 72:887–96. doi: 10.1158/0008-5472.CAN-11-2637
68. Haymaker CL, Wu RC, Ritthipichai K, Bernatchez C, Forget MA, Chen JQ, et al. BTLA Marks a Less-Differentiated Tumor-Infiltrating Lymphocyte Subset in Melanoma With Enhanced Survival Properties. Oncoimmunology (2015) 4:e1014246. doi: 10.1080/2162402X.2015.1014246
69. Vendel AC, Calemine-Fenaux J, Izrael-Tomasevic A, Chauhan V, Arnott D, Eaton DL. B and T Lymphocyte Attenuator Regulates B Cell Receptor Signaling by Targeting Syk and BLNK. J Immunol (2009) 182:1509–17. doi: 10.4049/jimmunol.182.3.1509
70. Bierie B, Moses HL. Transforming Growth Factor Beta (TGF-Beta) and Inflammation in Cancer. Cytokine Growth Factor Rev (2010) 21:49–59. doi: 10.1016/j.cytogfr.2009.11.008
71. Yoshimura A, Muto G. TGF-β Function in Immune Suppression. Curr Top Microbiol Immunol (2011) 350:127–47. doi: 10.1007/82_2010_87
72. Buckhaults P, Rago C, St Croix B, Romans KE, Saha S, Zhang L, et al. Secreted and Cell Surface Genes Expressed in Benign and Malignant Colorectal Tumors. Cancer Res (2001) 61:6996–7001.
73. Friedman E, Gold LI, Klimstra D, Zeng ZS, Winawer S, Cohen A. High Levels of Transforming Growth Factor Beta 1 Correlate With Disease Progression in Human Colon Cancer. Cancer Epidemiol Biomarkers Prev (1995) 4:549–54.
74. Tsushima H, Kawata S, Tamura S, Ito N, Shirai Y, Kiso S, et al. High Levels of Transforming Growth Factor Beta 1 in Patients With Colorectal Cancer: Association With Disease Progression. Gastroenterology (1996) 110:375–82. doi: 10.1053/gast.1996.v110.pm8566583
75. Tauriello DVF, Palomo-Ponce S, Stork D, Berenguer-Llergo A, Badia-Ramentol J, Iglesias M, et al. Tgfβ Drives Immune Evasion in Genetically Reconstituted Colon Cancer Metastasis. Nature (2018) 554:538–43. doi: 10.1038/nature25492
76. Wang J, Xiang H, Lu Y, Wu T. Role and Clinical Significance of TGF−β1 and TGF−βr1 in Malignant Tumors (Review). Int J Mol Med (2021) 47:55. doi: 10.3892/ijmm.2021.4888
77. Tinoco R, Alcalde V, Yang Y, Sauer K, Zuniga EI. Cell-Intrinsic Transforming Growth Factor-Beta Signaling Mediates Virus-Specific CD8+ T Cell Deletion and Viral Persistence In Vivo. Immunity (2009) 31(1):145–57. doi: 10.1016/j.immuni.2009.06.015
78. Okazaki T, Honjo T. The PD-1-PD-L Pathway in Immunological Tolerance. Trends Immunol (2006) 27:195–201. doi: 10.1016/j.it.2006.02.001
79. Wu P, Wu D, Li L, Chai Y, Huang J. PD-L1 and Survival in Solid Tumors: A Meta-Analysis. PloS One (2015) 10:e0131403. doi: 10.1371/journal.pone.0131403
80. Song M, Chen D, Lu B, Wang C, Zhang J, Huang L, et al. PTEN Loss Increases PD-L1 Protein Expression and Affects the Correlation Between PD-L1 Expression and Clinical Parameters in Colorectal Cancer. PloS One (2013) 8:e65821. doi: 10.1371/journal.pone.0065821
81. Shan T, Chen S, Wu T, Yang Y, Li S, Chen X. PD-L1 Expression in Colon Cancer and its Relationship With Clinical Prognosis. Int J Clin Exp Pathol (2019) 12:1764–9.
82. Zhang J, Marotel M, Fauteux-Daniel S, Mathieu AL, Viel S, Marçais A, et al. T-Bet and Eomes Govern Differentiation and Function of Mouse and Human NK Cells and ILC1. Eur J Immunol (2018) 48:738–50. doi: 10.1002/eji.201747299
83. Annunziato F, Romagnani C, Romagnani S. The 3 Major Types of Innate and Adaptive Cell-Mediated Effector Immunity. J Allergy Clin Immunol (2015) 135:626–35. doi: 10.1016/j.jaci.2014.11.001
84. Paley MA, Kroy DC, Odorizzi PM, Johnnidis JB, Dolfi DV, Barnett BE, et al. Progenitor and Terminal Subsets of CD8+ T Cells Cooperate to Contain Chronic Viral Infection. Science (2012) 338:1220–5. doi: 10.1126/science.1229620
85. Buggert M, Tauriainen J, Yamamoto T, Frederiksen J, Ivarsson MA, Michaëlsson J, et al. T-Bet and Eomes are Differentially Linked to the Exhausted Phenotype of CD8+ T Cells in HIV Infection. PloS Pathog (2014) 10:e1004251. doi: 10.1371/journal.ppat.1004251
86. Jia B, Zhao C, Rakszawski KL, Claxton DF, Ehmann WC, Rybka WB, et al. Eomes+T-Betlow CD8+ T Cells Are Functionally Impaired and Are Associated With Poor Clinical Outcome in Patients With Acute Myeloid Leukemia. Cancer Res (2019) 79:1635–45. doi: 10.1158/0008-5472.CAN-18-3107
87. Li J, He Y, Hao J, Ni L, Dong C. High Levels of Eomes Promote Exhaustion of Anti-Tumor CD8+ T Cells. Front Immunol (2018) 9:2981. doi: 10.3389/fimmu.2018.02981
88. Zhang Q, Bi J, Zheng X, Chen Y, Wang H, Wu W, et al. Blockade of the Checkpoint Receptor TIGIT Prevents NK Cell Exhaustion and Elicits Potent Anti-Tumor Immunity. Nat Immunol (2018) 19:723–32. doi: 10.1038/s41590-018-0132-0
89. Herberman RB, Nunn ME, Lavrin DH. Natural Cytotoxic Reactivity of Mouse Lymphoid Cells Against Syngeneic Acid Allogeneic Tumors. I. Distribution of Reactivity and Specificity. Int J Cancer (1975) 16:216–29. doi: 10.1002/ijc.2910160204
90. Orange JS. Human Natural Killer Cell Deficiencies and Susceptibility to Infection. Microbes Infect (2002) 4:1545–58. doi: 10.1016/S1286-4579(02)00038-2
91. Mattner J, Wirtz S. Friend or Foe? The Ambiguous Role of Innate Lymphoid Cells in Cancer Development. Trends Immunol (2017) 38:29–38. doi: 10.1016/j.it.2016.10.004
92. Wang S, Qu Y, Xia P, Chen Y, Zhu X, Zhang J, et al. Transdifferentiation of Tumor Infiltrating Innate Lymphoid Cells During Progression of Colorectal Cancer. Cell Res (2020) 30:610–22. doi: 10.1038/s41422-020-0312-y
93. Lanier LL. Up on the Tightrope: Natural Killer Cell Activation and Inhibition. Nat Immunol (2008) 9:495–502. doi: 10.1038/ni1581
94. Carrega P, Orecchia P, Quatrini L, Tumino N, Venè R, Benelli R, et al. Characterisation of Innate Lymphoid Cell Subsets Infiltrating Colorectal Carcinoma. Gut (2020) 69:2261–3. doi: 10.1136/gutjnl-2020-320908
95. Sivori S, Vitale M, Bottino C, Marcenaro E, Sanseverino L, Parolini S, et al. CD94 Functions as a Natural Killer Cell Inhibitory Receptor for Different HLA Class I Alleles: Identification of the Inhibitory Form of CD94 by the Use of Novel Monoclonal Antibodies. Eur J Immunol (1996) 26:2487–92. doi: 10.1002/eji.1830261032
96. Braud VM, Allan DS, O’Callaghan CA, Söderström K, D’Andrea A, Ogg GS, et al. HLA-E Binds to Natural Killer Cell Receptors CD94/NKG2A, B and C. Nature (1998) 391:795–9. doi: 10.1038/35869
97. Beldi-Ferchiou A, Lambert M, Dogniaux S, Vély F, Vivier E, Olive D, et al. PD-1 Mediates Functional Exhaustion of Activated NK Cells in Patients With Kaposi Sarcoma. Oncotarget (2016) 7:72961–77. doi: 10.18632/oncotarget.12150
98. Pesce S, Greppi M, Tabellini G, Rampinelli F, Parolini S, Olive D, et al. Identification of a Subset of Human Natural Killer Cells Expressing High Levels of Programmed Death 1: A Phenotypic and Functional Characterization. J Allergy Clin Immunol (2017) 139:335–46.e3. doi: 10.1016/j.jaci.2016.04.025
99. Frumento G, Rotondo R, Tonetti M, Damonte G, Benatti U, Ferrara GB. Tryptophan-Derived Catabolites are Responsible for Inhibition of T and Natural Killer Cell Proliferation Induced by Indoleamine 2,3-Dioxygenase. J Exp Med (2002) 196:459–68. doi: 10.1084/jem.20020121
100. Salimi Elizei S, Poormasjedi-Meibod MS, Wang X, Kheirandish M, Ghahary A. Kynurenic Acid Downregulates IL-17/1L-23 Axis In Vitro. Mol Cell Biochem (2017) 431:55–65. doi: 10.1007/s11010-017-2975-3
101. Song H, Park H, Kim YS, Kim KD, Lee HK, Cho DH, et al. L-Kynurenine-Induced Apoptosis in Human NK Cells Is Mediated by Reactive Oxygen Species. Int Immunopharmacol (2011) 11:932–8. doi: 10.1016/j.intimp.2011.02.005
102. Della Chiesa M, Carlomagno S, Frumento G, Balsamo M, Cantoni C, Conte R, et al. The Tryptophan Catabolite L-Kynurenine Inhibits the Surface Expression of NKp46- and NKG2D-Activating Receptors and Regulates NK-Cell Function. Blood (2006) 108:4118–25. doi: 10.1182/blood-2006-03-006700
103. Zhang J, Han X, Hu X, Jin F, Gao Z, Yin L, et al. IDO1 Impairs NK Cell Cytotoxicity by Decreasing NKG2D/NKG2DLs via Promoting miR-18a. Mol Immunol (2018) 103:144–55. doi: 10.1016/j.molimm.2018.09.011
104. Zhai L, Ladomersky E, Lenzen A, Nguyen B, Patel R, Lauing KL, et al. IDO1 in Cancer: A Gemini of Immune Checkpoints. Cell Mol Immunol (2018) 15:447–57. doi: 10.1038/cmi.2017.143
105. Holla P, Ambegaonkar A, Sohn H, Pierce SK. Exhaustion may Not be in the Human B Cell Vocabulary, at Least Not in Malaria. Immunol Rev (2019) 292:139–48. doi: 10.1111/imr.12809
106. Yuen GJ, Demissie E, Pillai S. B Lymphocytes and Cancer: A Love-Hate Relationship. Trends Cancer (2016) 2:747–57. doi: 10.1016/j.trecan.2016.10.010
107. Fraschilla I, Pillai S. Viewing Siglecs Through the Lens of Tumor Immunology. Immunol Rev (2017) 276:178–91. doi: 10.1111/imr.12526
108. Stephen TL, Rutkowski MR, Allegrezza MJ, Perales-Puchalt A, Tesone AJ, Svoronos N, et al. Transforming Growth Factor β-Mediated Suppression of Antitumour T Cells Requires FoxP1 Transcription Factor Expression. Immunity (2014) 41:427–39. doi: 10.1016/j.immuni.2014.08.012
109. Yousafzai NA, Zhou Q, Xu W, Shi Q, Xu J, Feng L, et al. SIRT1 Deacetylated and Stabilized XRCC1 to Promote Chemoresistance in Lung Cancer. Cell Death Dis (2019) 10:363. doi: 10.1038/s41419-019-1592-3
110. Abhimanyu, Ontiveros CO, Guerra-Resendez RS, Nishiguchi T, Ladki M, Hilton IB, et al. Reversing Post-Infectious Epigenetic-Mediated Immune Suppression. Front Immunol (2021) 12:688132. doi: 10.3389/fimmu.2021.688132
111. Quigley M, Pereyra F, Nilsson B, Porichis F, Fonseca C, Eichbaum Q, et al. Transcriptional Analysis of HIV-Specific CD8+ T Cells Shows That PD-1 Inhibits T Cell Function by Upregulating BATF. Nat Med (2010) 16:1147–51. doi: 10.1038/nm.2232
112. Liu X, Wang Y, Lu H, Li J, Yan X, Xiao M, et al. Genome-Wide Analysis Identifies NR4A1 as a Key Mediator of T Cell Dysfunction. Nature (2019) 567:525–9. doi: 10.1038/s41586-019-0979-8
Keywords: colorectal cancer, immune exhaustion genes, immune checkpoints, T cell exhaustion, B cell exhaustion, innate lymphoid cells, conventional NK cells
Citation: Sorrentino C, D’Antonio L, Fieni C, Ciummo SL and Di Carlo E (2021) Colorectal Cancer-Associated Immune Exhaustion Involves T and B Lymphocytes and Conventional NK Cells and Correlates With a Shorter Overall Survival. Front. Immunol. 12:778329. doi: 10.3389/fimmu.2021.778329
Received: 16 September 2021; Accepted: 16 November 2021;
Published: 16 December 2021.
Edited by:
Giovanna Schiavoni, National Institute of Health (ISS), ItalyReviewed by:
Varun Sasidharan Nair, Helmholtz Association of German Research Centers (HZ), GermanyJennifer Bando, Stanford University, United States
Copyright © 2021 Sorrentino, D’Antonio, Fieni, Ciummo and Di Carlo. This is an open-access article distributed under the terms of the Creative Commons Attribution License (CC BY). The use, distribution or reproduction in other forums is permitted, provided the original author(s) and the copyright owner(s) are credited and that the original publication in this journal is cited, in accordance with accepted academic practice. No use, distribution or reproduction is permitted which does not comply with these terms.
*Correspondence: Emma Di Carlo, ZWRpY2FybG9AdW5pY2guaXQ=
†These authors have contributed equally to this work and share first authorship