 Xiangmin Qiu
 Xiaoliang Hua2,3
 Juan Chen
- 1The Ministry of Education Key Laboratory of Laboratory Medical Diagnostics, The College of Laboratory Medicine, Chongqing Medical University, Chongqing, China
- 2Department of Urology, The First Affiliated Hospital of Anhui Medical University, Hefei, China
- 3Anhui Province Key Laboratory of Genitourinary Diseases, Anhui Medical University, Hefei, China
Both RNA N6-methyladenosine (m6A) modification of SARS-CoV-2 and immune characteristics of the human body have been reported to play an important role in COVID-19, but how the m6A methylation modification of leukocytes responds to the virus infection remains unknown. Based on the RNA-seq of 126 samples from the GEO database, we disclosed that there is a remarkably higher m6A modification level of blood leukocytes in patients with COVID-19 compared to patients without COVID-19, and this difference was related to CD4+ T cells. Two clusters were identified by unsupervised clustering, m6A cluster A characterized by T cell activation had a higher prognosis than m6A cluster B. Elevated metabolism level, blockage of the immune checkpoint, and lower level of m6A score were observed in m6A cluster B. A protective model was constructed based on nine selected genes and it exhibited an excellent predictive value in COVID-19. Further analysis revealed that the protective score was positively correlated to HFD45 and ventilator-free days, while negatively correlated to SOFA score, APACHE-II score, and crp. Our works systematically depicted a complicated correlation between m6A methylation modification and host lymphocytes in patients infected with SARS-CoV-2 and provided a well-performing model to predict the patients’ outcomes.
Introduction
Recently, a total of seven internal modifications have been discovered on mRNA: N1-methyladenosine (m1A), N4-acetylcytidine (ac4C), 5-methylcytidine (m5C), N6-methyladenosine (m6A), N7-methylguanosine (m7G), ribose methylations (Nm), and pseudouridine (Ψ) (1). mRNA modification is a reversible process mediated by “writers,” “readers,” and “erasers”, and m6A, which was first reported by Desrosiers in 1974, is the most common type of mRNA modification (2). mRNA can be methylated by the writers (METTL3 and METTL14), and translated into protein efficiently with the help of the readers (YTHDF1 and YTHDF2), while the erasers (FTO and ALKBH5) demethylate the residues (3–7). On the molecular level, m6A can affect RNA structures, influence the accessibility of RNA-binding motifs to their RNA-binding proteins, promote the initiation of miRNA biogenesis, and facilitate the translation of proteins (8). With respect to biological function, m6A has been shown to affect individual development, infertility, carcinogenesis, stemness, meiosis, circadian rhythm, and control various aspects of immunity, including immune recognition, activation of innate and adaptive immune responses, and cell fate decisions (9, 10). For instance, deletion of YTHDF2 delays mouse neuronal development through impaired proliferation and differentiation of neural stem and progenitor cells (11). In addition, the function of m6A can be induced by environmental stimuli or cellular signaling pathways. When monkey kidney cells were infected with enterovirus type 71, YTHDF1 and YTHDF2 were upregulated and distributed into both the cytosol and the nucleus (12).
Patients infected with severe acute respiratory syndrome coronavirus clade 2 (SARS-CoV-2) exhibited various changes in the immune system such as those on immune cell fractions, the expression level of the immune checkpoint, cytokine storm, and so on. During the early stages of COVID-19 infection, lymphocyte fractions might change, for example, the numbers of CD4+ and CD8+ T cells are significantly elevated due to immune defense against the virus (13). Another report noted that mild cases of COVID-19 had a greater proportion of CD8+ T cells than CD4+ T cells (14). Apart from the activated T cells, antibody responses in the extrafollicular zone were also stimulated to protect the organism against SARS-CoV-2 invasion (15). Moreover, some immune function assays were also conducted on macaques infected with SARS-CoV-2, and researchers obtained significant results such as a delayed immune response, increased inflammatory cytokine storm, and declined T cell function during the infections (16).
Recent studies have unveiled the alteration of m6A modification in host cells and SARS-CoV-2. Li et al. noted that METTL3 and METTL14 gene expression in lung tissues was significantly downregulated, whereas the expression levels of most of the inflammatory genes and insulin stimulated genes (ISGs) were increased in COVID-19 patients than in healthy individuals. The SARS-CoV-2 virus utilizes host METTL3 to modify viral RNA and to evade host cell immune responses (17). SARS-CoV-2 infections were also found to trigger m6A modification machineries re-localization and enhance the abundance of m6A in Vero and Huh7 cells (18). Although these findings provide evidence of the m6A methylome interaction between host cells and SARS-CoV-2, current studies focused primarily on a few m6A-related genes and nearly all were performed using model cells such as Caco2 and Huh7, which may not adequately reflect the actual situation of m6A methylome modifications in immune cells in patients with SARS-CoV-2 infection. Consequently, there is an urgent need to explore the m6A methylome modification profile in immune cells and the cross-talk between m6A modification and immune functions. Our aim is to explore whether there is a discrepancy in the expression levels of m6A regulators between patients with and without COVID-19, and how m6A methylome modification affects the immune function of lymphocytes.
In this study, we systematically depicted the immune profiles in patients with and without COVID-19 and the correlation between m6A and lymphocytes between these groups. Based on the expression levels of 20 m6A regulators, we discovered two distinctive m6A modification patterns in blood lymphocytes of COVID-19 patients. Surprisingly, there were differences in metabolism, immune cell compositions, and immune checkpoints between the two groups of patients. To better quantify the m6A modification level in each patient group, we established a scoring system termed the m6A score. This system was further analyzed between two m6A patterns and different clinical manifestation groups. Finally, we generated a protective model to accurately predict the clinical outcomes of patients and to determine the presence of SARS-CoV-2 infection among patients.
Materials and Methods
Processing of Data Obtained From a GEO Dataset
RNA-seq data of 126 samples, including those of 100 patients with COVID-19 and 26 patients without COVID-19 were obtained from a GEO dataset (GSE157103) (19). Clinical information obtained included age, diabetic status, ICU status, and hospital-free days at day 45 (HFD45). The HFD45 assigns a zero value (0-free days) to patients who remained admitted for over 45 days or to those who died while they were admitted, and higher HFD45 values are assigned to patients with shorter hospitalization times and milder disease severity.
GSVA Analysis and Functional Annotation
To estimate the biological function between different m6A clusters or between patients with or without COVID-19, we conducted GSVA enrichment analysis using the “GSVA” R package, which estimates the variations of pathway activity over a sample population in an unsupervised manner (20). The “h.all.symbols” and “c5.go.bp.symbols” were downloaded from the MSigDB database for GSVA analysis. The significantly enriched pathways were filtered by an adjusted P value of <0.05. To investigate the potential biological functions of DEGs of two m6A clusters and of individuals with or without COVID-19, the “clusterProfiler” package in R was used to perform enrichment analysis (21).
Estimation of Immune Cell Infiltration Fractions
The abundance of immune cells was determined by cell type identification by “CIBERSORT”, an algorithm that combines support vector regression from purified leukocyte subsets (https://cibersort.stanford.edu/). The LM22 signature gene matrix served as an input of the “CIBERSORT” algorithm to analyze the RNA-seq data of 126 samples, and all samples with a P value of <0.05 were included (22).
Generation of m6A Score
To quantify the m6A modification level per individual, we established an evaluation index called the m6A score.
1) Acquisition of significant DEGs. TPM data were log2-transformed, and the DEGs were acquired from the two m6A clusters using the “limma” package. We used HFD45 = 26 as the cutoff value and categorized COVID-19 patients into two groups. Each gene with differential expression between the two groups was analyzed by the t-test. The significant DEGs were extracted for further analysis.
2) Construction of the m6A score. A PCA analysis was adopted to focus on the well-correlated genes in the set. PC1 and PC2 were extracted to form signature scores. Later, we applied a method similar to GGI to construct the m6A score (23).
Unsupervised Clustering of COVID-19 Patients
A total of 20 m6A genes were obtained from the GEO dataset, including eleven readers (YTHDC1, YTHDF2, YTHDF1, ELAVL1, YTHDC2, FMR1, HNRNPA2B1, IGF2BP1, LRPPRC, YTHDF3, and HNRNPC), seven writers (ZC3H13, RBM15B, RBM15, CBLL1, WTAP, METTL14, and METTL3), and two erasers (ALKBH5 and FTO). An unsupervised clustering algorithm performed by the “ConsensusClusterPlus” package was used on the basis of the m6A genes to classify COVID-19 patients into different subtypes (24).
Construction of the Protective Model
Comparison of the two groups yielded a total of 4,565 genes with differential expression. We constructed the LASSO model in the patient’s cohort on the basis of these DEGs by using the “glmnet” package. The final signatures were filtered by determining the appropriate λ value with 20-fold cross-validation and “deviance” as the target parameter. The coefficients of the final signatures were used to calculate the protective score as follows: protective score = ∑i Coefficientsi × Expression level of signaturei. The patients were divided into two clusters: the training cohort consisted of 70% of the patients while the validation cohort consisted of 30% of the patients. The model constructed in the training cohort was validated in the validation cohort. Receiver operating characteristic (ROC) curves were plotted with AUC scores using the R package “plotROC” to evaluate the performance of the model.
Statistical Analysis
Differences between the two groups were compared using the Wilcoxon sum-rank test and the t-test. The protective score, HFD45, SOFA score, APACHE-II score, crp, and ventilator-free days were subjected to correlation analysis using the Pearson correlation test with the “pancor” package (https://github.com/xuzhougeng/pancor/tree/master/R). All statistical tests conducted were two-sided, and a p value of <0.05 was considered statistically significant.
Results
Upregulation of m6A Regulators and Activation of the Immune System in COVID-19 Patients
A sketch map was depicted to reflect the m6A modification of blood lymphocytes of patients infected with SARS-CoV-2 (Figure 1A). The gene expression profiles and corresponding clinical data of patients with or without COVID-19 were downloaded from the Gene Expression Omnibus (GEO) database for subsequent analyses. Figure 1B shows the workflow. We curated and analyzed a set of 20 acknowledged m6A regulators (11 writers, 7 readers, and 2 erasers) to identify distinct m6A methylation modification patterns. Expression profiling of blood leukocytes revealed that the expression levels of all m6A regulators were significantly upregulated in patients with COVID-19 (P <0.05) (Figure 2A). To explore the association between different m6A regulators, we depicted the correlation patterns between three types of m6A regulators (Figure 2B). Surprisingly, m6A regulators of the same type, such as YTHDF2 and YTHDC1, show strong antagonistic action (coefficient = −0.6). Simultaneously, m6A regulators from different types, such as HNRNPC and WTAP, can also exhibit synergistic effects (coefficient = 0.94). We further analyzed the relevance of the co-expression of regulators and found a significant correlation between YTHDF2 and other regulators, with the highest correlation coefficient between YTHDF2 and ALKBH5 (coefficient = 0.82). Of course, these are predicted interactions that provide a theoretical basis for later experimental validation. The above results provide evidence to the regulatory balance among the 20 m6A regulators.
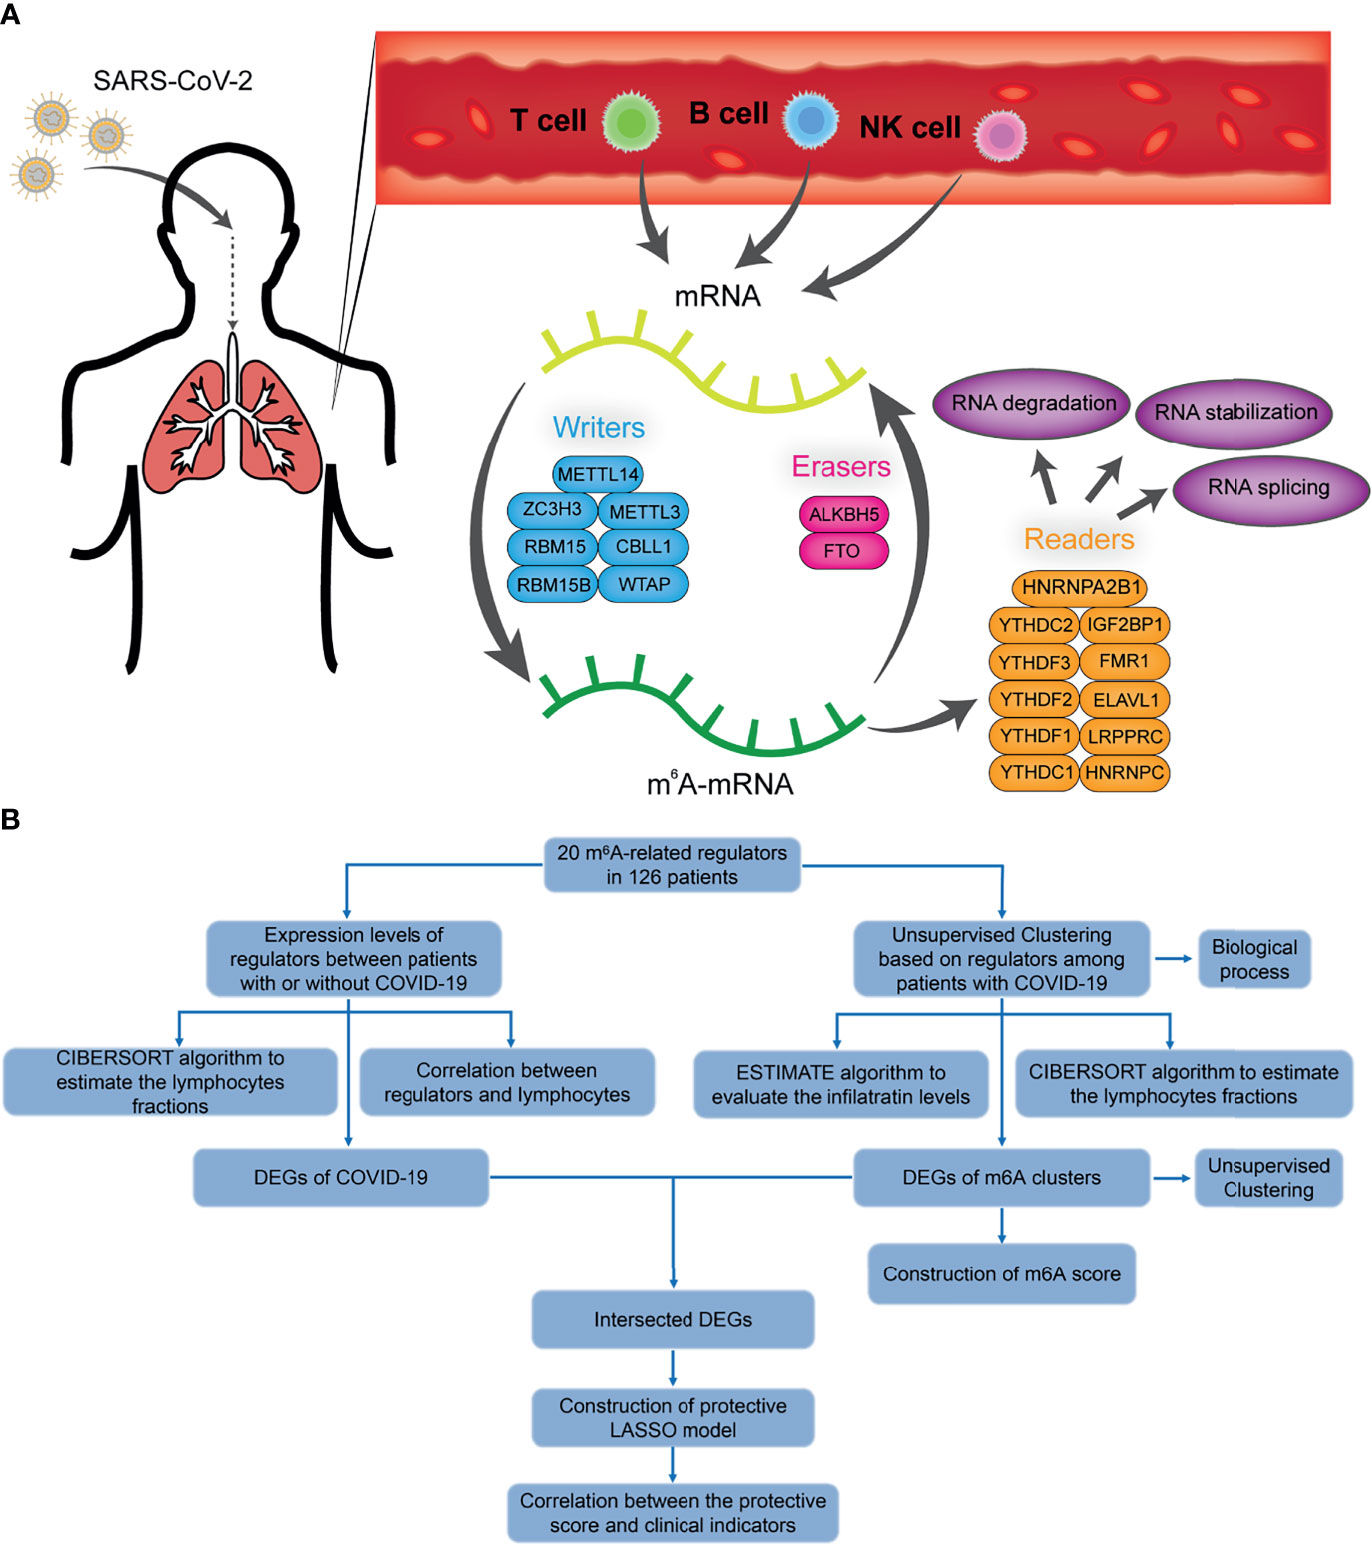
Figure 1 The diagram and workflow of the project. (A) The overview of m6A RNA methylation modification in blood lymphocytes of patients infected with SARS-CoV-2, including ‘writers’, ‘readers’, and ‘erasers’. (B) The study flow chart.
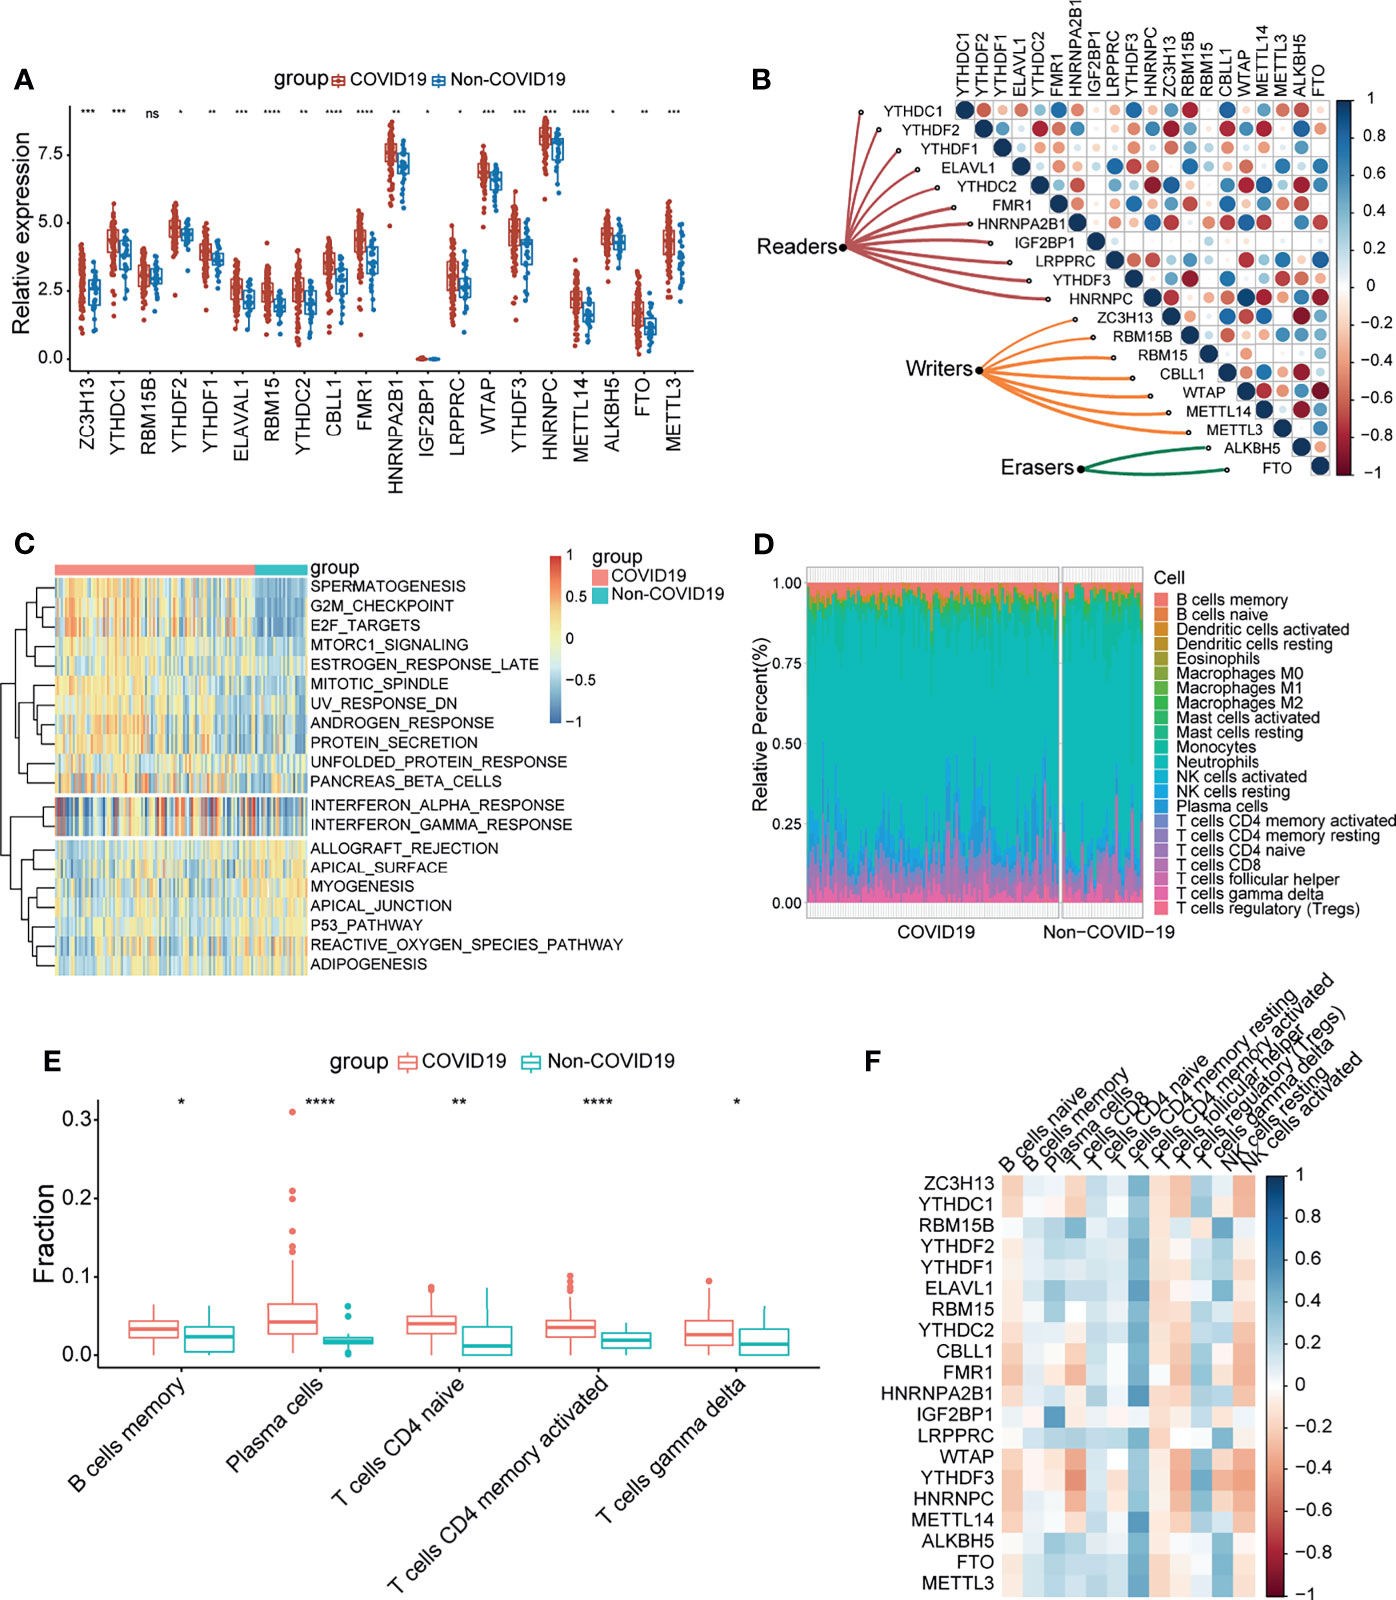
Figure 2 COVID-19 patients were characterized by upregulated m6A genes and activation of the lymphocytes. (A) The expression of 20 m6A genes of blood leukocytes between patients with or without COVID-19. (B) Correlation plot of 20 m6A genes. The positive correlation was marked with blue, and negative correlation was marked with red. The size of circle represents the absolute value of correlation coefficients. (C) GSVA enrichment analysis showing activated interferon pathways in COVID-19 patients. Red represents high expression, blue represents low expression. (D) The abundance of leukocytes in patients with or without COVID-19. (E) The significant leukocytes fractions in patients with or without COVID-19. (F) The heatmap of correlation between leukocytes and m6A genes. The positive correlation was marked with blue, and negative correlation was marked with red. *p < 0.05, **p < 0.01, ***p < 0.001, ****p < 0.0001, ns, no significance.
To determine whether there are alterations in the immune system between the COVID-19 and non-COVID-19 patient groups, gene set variation analysis (GSVA) was conducted to show a difference in well-defined biological states or processes between patients with or without COVID-19, indicating that interferon responses were remarkably upregulated in COVID-19 patients (Figure 2C). We simultaneously analyzed the fraction of 22 immune cell types between the two groups based on the CIBERSORT algorithm (Figure 2D), and the results revealed that COVID-19 patients had higher infiltration levels of memory B cells, plasma cells, naïve CD4 T cells, activated CD4 memory T cells, and gamma delta T cells (Figure 2E). These findings suggested that SARS-CoV-2 infection remarkably activates the immune system. Moreover, correlation analysis underlined that activated CD4 memory T cells were positively correlated with m6A regulators (Figure 2F). Combined with the above results, it can be inferred that the high level of activated CD4 memory T cells in COVID-19 patients may be due to the elevated expression level of m6A regulators. The above results suggested that m6A regulators may play a pivotal role in the molecular traits and immune infiltration phenotype in COVID-19 patients.
Patterns of m6A Regulators and Biological Function of Each Pattern
A consistent unsupervised methodology was employed to obtain a clustering result for subsequent analysis. The consensus matrix showed that the unsupervised algorithm based on the 20 regulators could clearly distinguish the samples, and each sample in a cluster possessed a high correlation (Figures 3A, S1A–C). The consensus distributions and delta area for k (2–5) are displayed in the empirical cumulative distribution function (CDF) plots (Figures S1D–E). Given the consensus matrix for the analysis, k = 2 seemed to be the most suitable choice. Accordingly, in this study we clustered COVID-19 patients into two groups, and the principal component analysis (PCA) revealed that the two groups were distinguished clearly (Figure S1F). Moreover, compared to the expression levels of m6A regulators, a unique m6A transcriptional profile was generated between the two m6A patterns (Figure 3B). m6A cluster A showed high expression levels of CBLL1, HNRNPC, and ZC3H13, while m6A cluster B was characterized by elevated expression of IGF2BP1, METTL3, and RBM15B (Figure 3C). METTL3, which was previously reported by Hu, was considered to be an important part of the methyltransferase complex (5), suggesting that the m6A cluster B might have a higher level of m6A methylation modification in lymphocytes compared to m6A cluster A. Some host proviral genes that are essential for the survival of SARS-CoV-2 have been reported (25–31). We examined the expression levels of these genes in the two clusters. As shown in the result (Figures S2A–C), proviral genes were significantly upregulated in m6A cluster A relative to m6A cluster B. The hospital-free day 45 (HFD45) between the two clusters was compared, and the results revealed a better prognosis for m6A cluster A (Figure 3D). Thus, we speculated that the upregulated expression of proviral genes might be associated with a low level of m6A methylation modification in lymphocytes, leading to better outcomes in COVID-19 patients. We subsequently explored effectors downstream of the innate immune pathways between the two groups, and the results showed that IFN genes and IFN-stimulated genes were significantly upregulated in m6A cluster A (Figure 3E), implying that lymphocytes of this cluster were significantly stimulated to release antiviral proteins such as IFN.
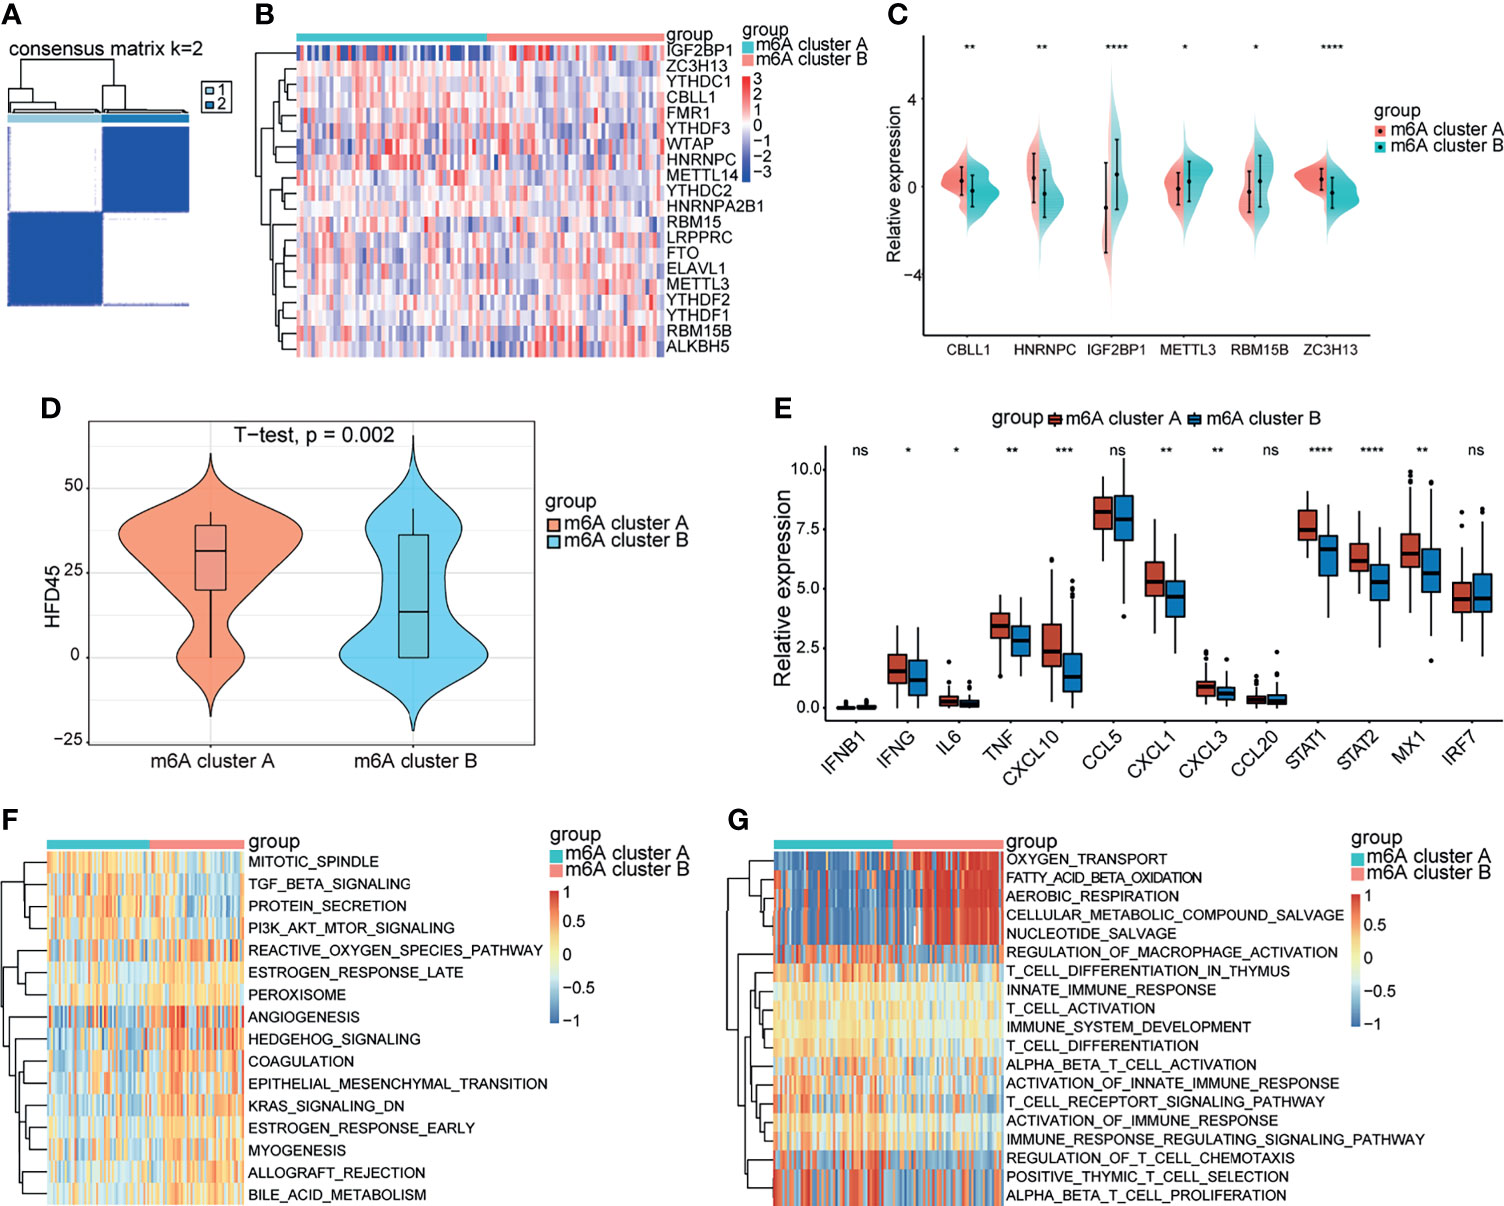
Figure 3 Biological progression between the two m6A clusters. (A) Consensus clustering matrix for k = 2. (B) The heatmap of m6A genes between the two m6A clusters. Red represents high expression, blue represents low expression. (C) Expression levels of significant m6A genes between the two m6A clusters. (D) The HFD45 between the two m6A clusters. (E) The innate immune pathways-related genes between the m6A clusters. (F, G) GSVA analysis showing the activation of classical pathways and distinct biological processes in metabolism and immune response. *p < 0.05, **p < 0.01, ***p < 0.001, ****p < 0.0001, ns, no significance.
GVSA analysis was applied to further explore the biological differences between the two groups. The results revealed that KRAS and TGFβ signaling was upregulated in m6A cluster A while PI3K-AKT-mTOR signaling was downregulated in m6A cluster B (Figure 3F). Otherwise, the significant pathways also focused on metabolism and immune system activation. m6A cluster B was remarkably related to oxygen transport, fatty acid β-oxidation, aerobic respiration, cellular metabolism compound salvage, and nucleotide salvage. T cell pathways, such as T cell activation, T cell differentiation, T cell chemotaxis, and T cell proliferation, were significantly enriched in m6A cluster A (Figure 3G). Thus, we hypothesized that m6A cluster A might be involved in various processes in T cells, such as development and function.
Immune Infiltration and Immune Checkpoint Characteristics in m6A Patterns
Recent studies have shown that m6A modification of RNA plays an essential role in the formation of immune responses and the immune environment. In order to further define the role of m6A modification patterns in the immune environment, we compared the components of different lymphocytes between two m6A clusters by using the CIBERSORT method (Figure 4A). We found that m6A cluster A had higher expression of CD8+ T cells and activated NK cells than m6A cluster B, which is consistent with the above results. To better illustrate the level of infiltration in the two clusters, we leveraged the ESTIMATE algorithm to evaluate the infiltration level of immune cells. The results revealed that m6A cluster A exhibited a high immune score, which suggested that m6A cluster A had prominently elevated infiltration of immune cells (Figure 4B). These results illustrated the differences in immune infiltration between the two modification patterns.
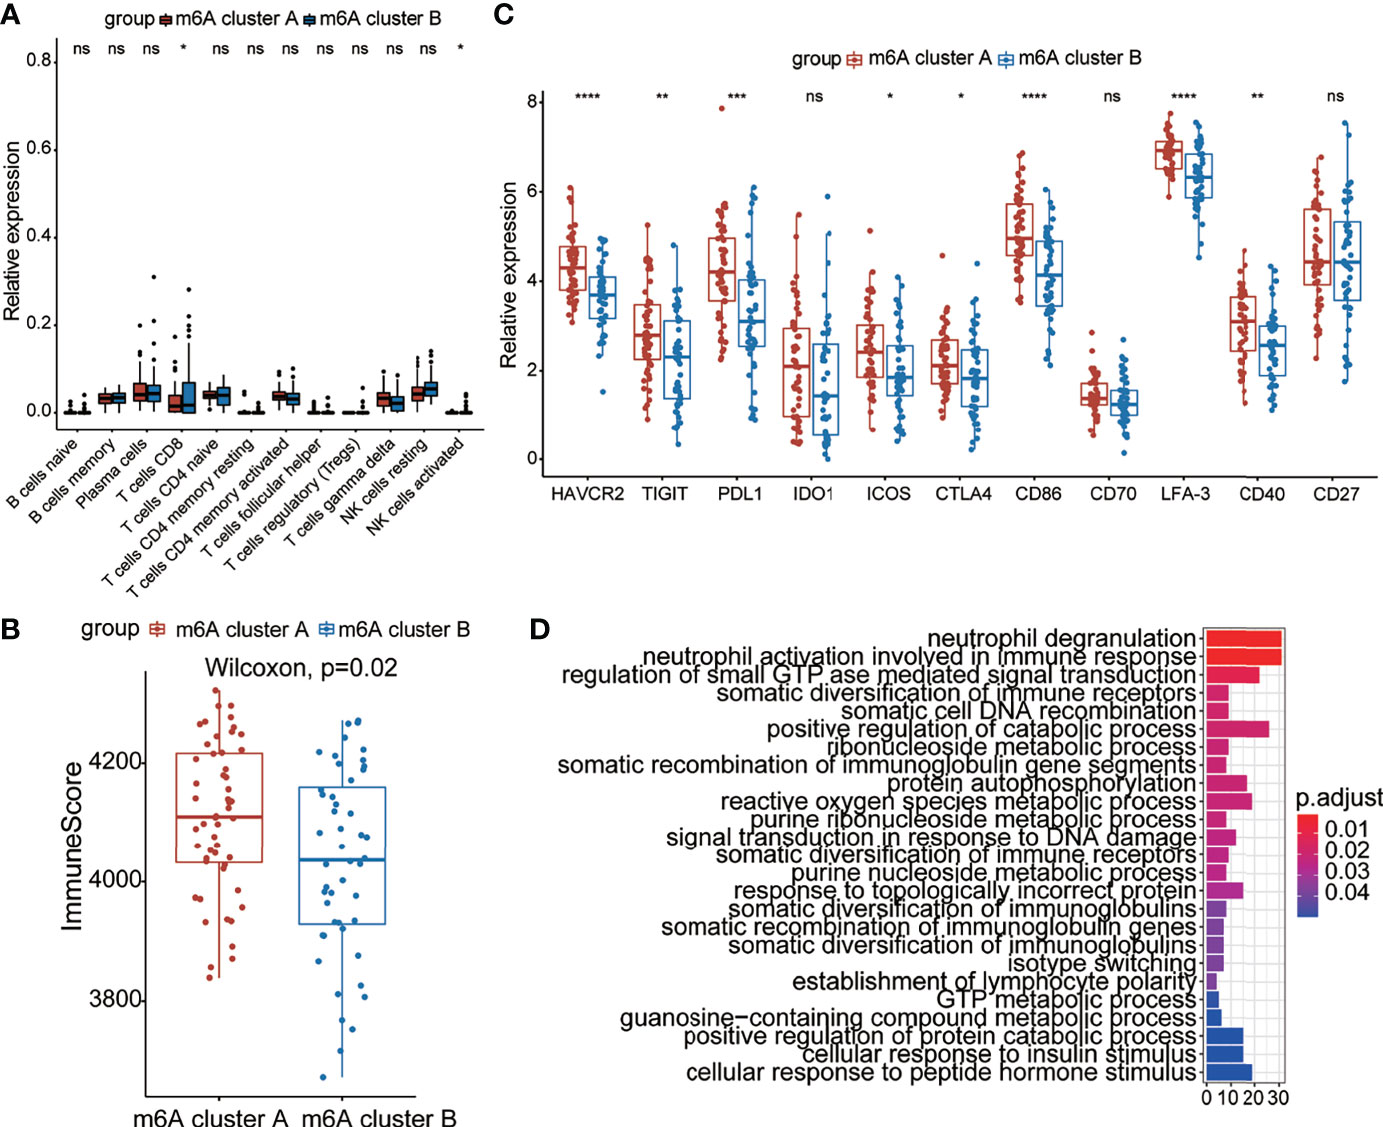
Figure 4 Immune characteristics between the two m6A clusters. (A) The abundance of leukocytes between the m6A clusters. (B) The immunoscore between the two m6A clusters. (C) Expression levels of immune checkpoint genes between the m6A clusters. (D) The KEGG enrichment analysis based on DEGs of the two clusters. The color bar represents the p values of the pathways. *p < 0.05, **p < 0.01, ***p < 0.001, ****p < 0.0001, ns, no significance.
We further analyzed the expression of typical immune-related genes and immune checkpoint-related genes in the groups with different modification patterns. The results uncovered that stimulator, inhibitor, and MHC-related genes were remarkably elevated in m6A cluster A than in m6A cluster B (Figures S3A–C), suggesting that m6A cluster A had a higher immune response than m6A cluster B. Interestingly, m6A cluster A could be remarkably distinguished from m6A cluster B in the immune checkpoint. In particular, we found that the expression of checkpoint inhibitor-related genes, such as HAVCR2, TIGIT, PD-L1, ICOS, CTLA4, CD86, LFA-3, and CD40, in the m6A cluster A was prominently higher than that in m6A cluster B, which meant that the former cluster might benefit from immune therapy (Figure 4C). To better illustrate the biological behaviors between the two groups, Kyoto Encyclopedia of Genes and Genomes (KEGG) enrichment was performed using the “clusterProfiler” package. Surprisingly, immunity- and metabolism-related genes were primarily enriched (Figure 4D), which is the same as the biological process between patients with and without COVID-19. Based on the above results, it could be said that there were distinct immune infiltration and immune checkpoint characteristics between the two groups with different modification patterns.
Construction of m6A Signatures
To further verify the reasonability of classification based on m6A-related genes, we first analyzed the differentially expressed genes (DEGs) using the “limma” package (32). DEGs were identified with cutoff criteria of |logFC| >1 and P <0.05, and finally we screened 6,771 DEGs. Subsequently, unsupervised consensus clustering analysis was conducted on the basis of the DEGs using the R package “ConsensusClusterPlus” to categorize the patients into different genomic subtypes. The delta area and consensus distributions for k (2–5) are displayed in the empirical CDF plots (Figures S4A–E). Consistent with the classification of m6A modification patterns, the unsupervised algorithm clustered two unique genomic subtypes. We designated these subtypes as “Gene cluster A” and “Gene cluster B”, and this classification was further confirmed by PCA (Figure S4F). Coincidently, there were more m6A-related genes in Gene cluster A than in Gene cluster B (Figure S5G), although there were no significant differences in the HFD45 score (Figure S5A). These analyses indicated that the two m6A modification models existed in COVID-19 patients and that the classification based on m6A-related genes was reasonable and could be explained. Furthermore, we analyzed the overall expression of the DEGs, and the results are depicted in a heatmap (Figure 5A), which illustrates the existence of a distinct genomic expression profile between the two groups. Later, we observed the proportions of clinical manifestations of the COVID-19 patients between the two m6A clusters (Figure 5B). It indicated that the patients in m6A cluster B were more likely to be admitted to the ICU or have diabetes than patients in m6A cluster A. Concomitantly, patients in Gene cluster A were characterized by an age of <65 years.
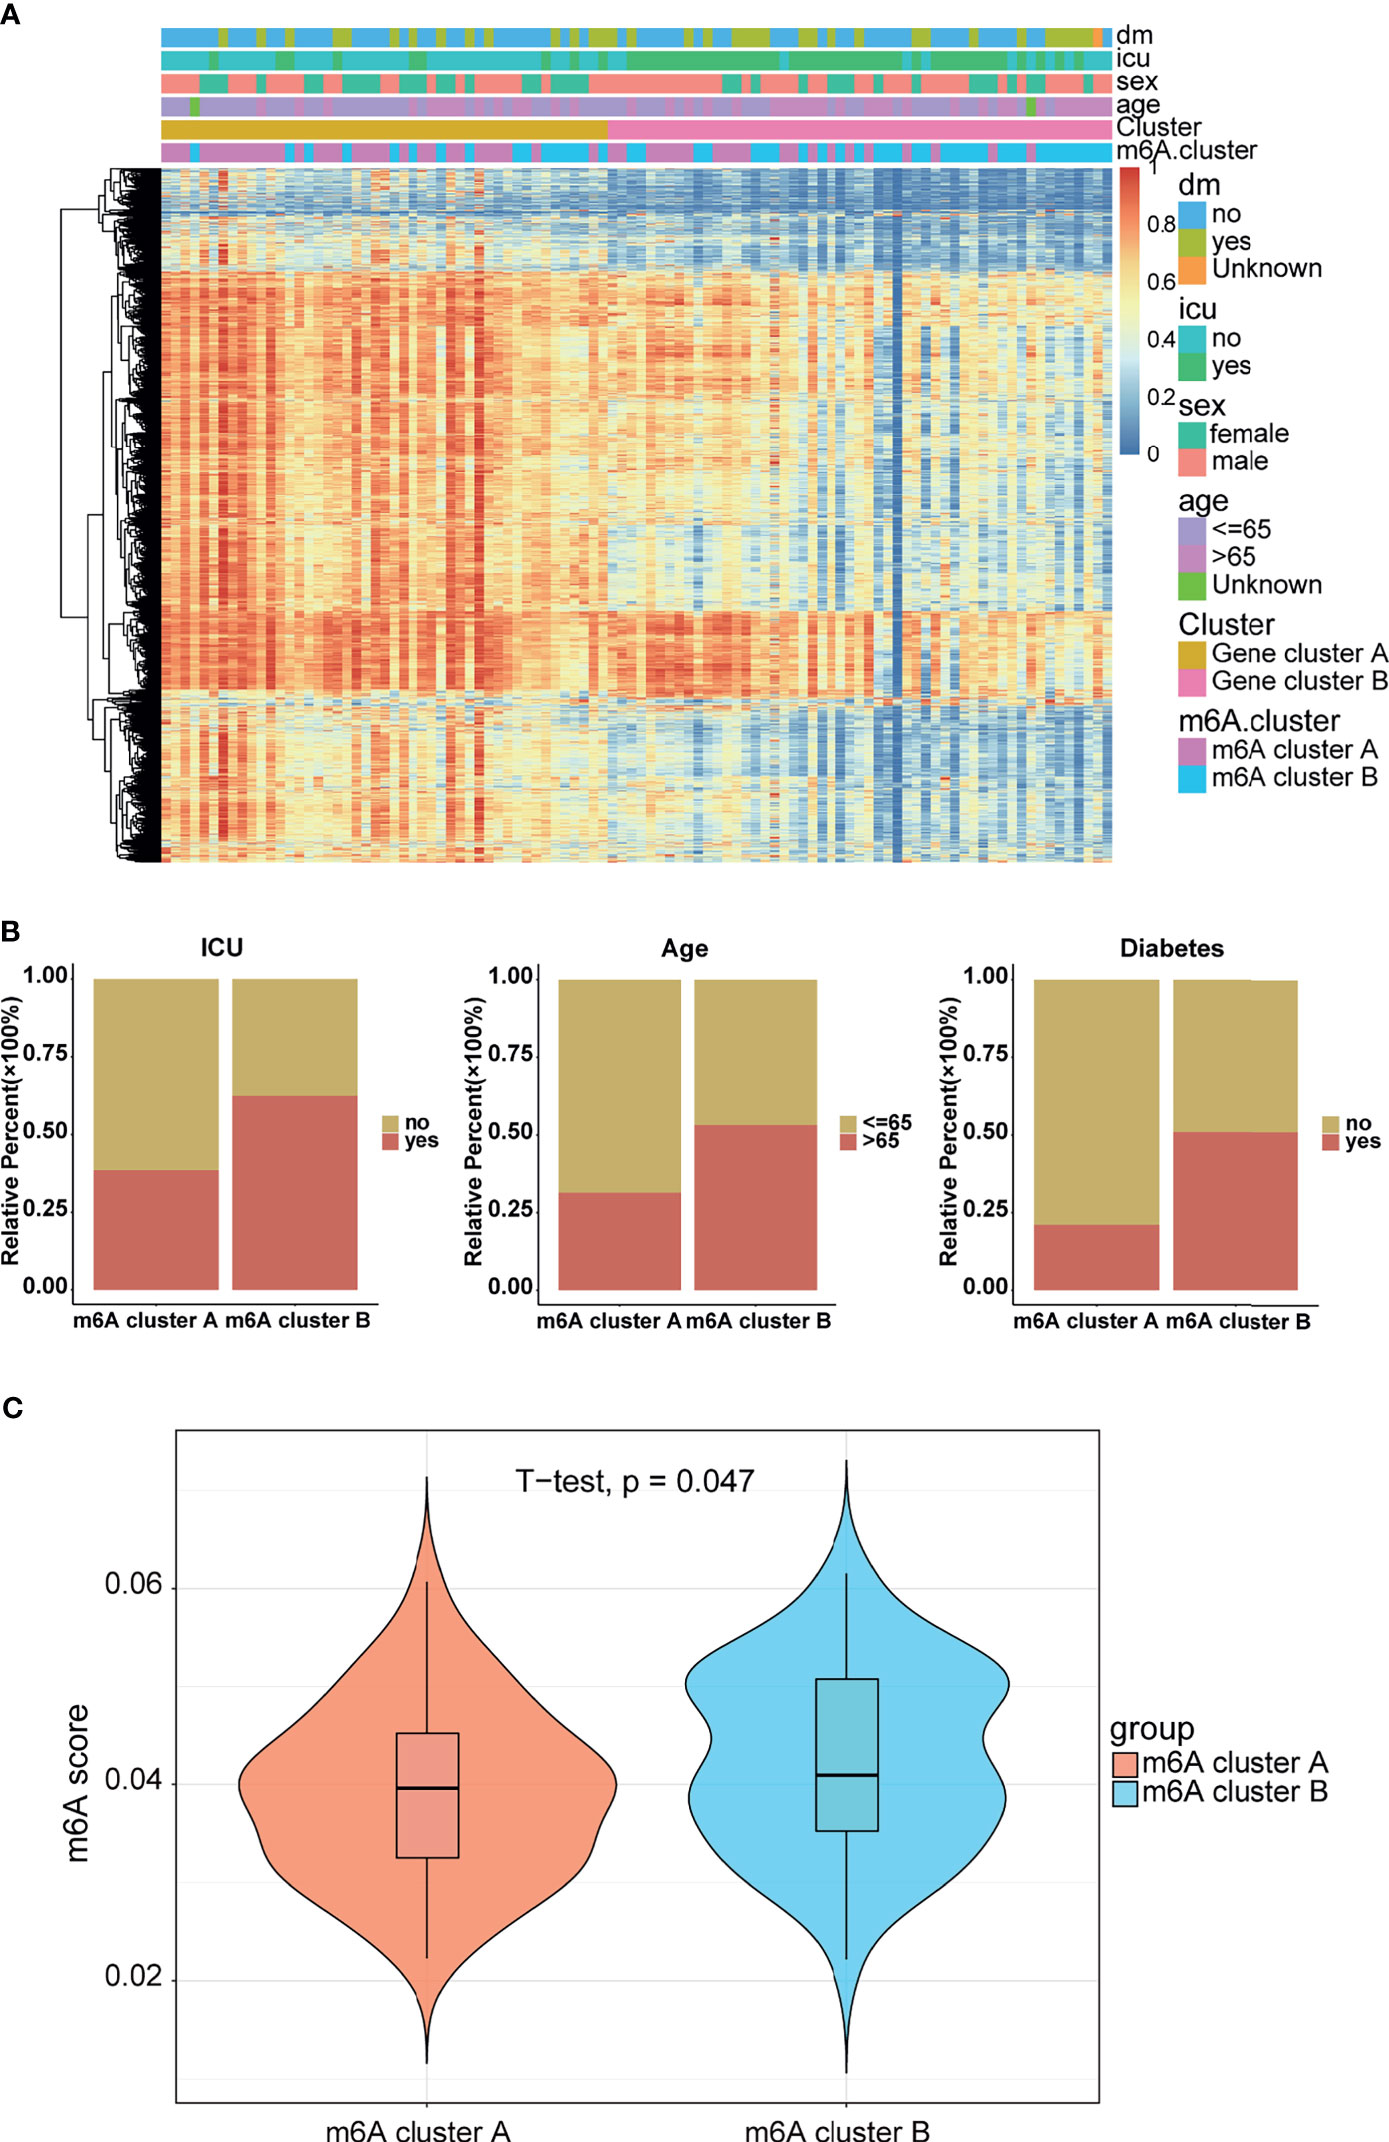
Figure 5 Clinical manifestations and m6A modification levels between the two m6A clusters. (A) Heatmap of the DEGs between the gene clusters. m6A cluster and clinical feature annotation was used. (B) ICU, age, and diabetes proportions between the m6A clusters. (C) m6A score between the m6A clusters.
Considering the unique heterogeneity of m6A modification patterns, we defined an indicator to establish a scoring system to comprehensively quantify the m6A modification pattern of patients with COVID-19, which is termed as the m6A score. Further analysis revealed a lower m6A score in m6A cluster A than in m6A cluster B (Figure 5C). Combined with the conclusion that the m6A cluster A had a higher HFD45 than m6A cluster B, it can be inferred that the m6A score was associated with poor survival. However, there was no significant difference in the m6A signature between Gene clusters A and B (Figure S5B). Similar results were discovered between different clinical groups (Figures S5C–F). To better illustrate the potential function of the m6A score, we analyzed the correlation between the m6A score and common pathways. Based on the results of the correlation analysis, the m6A score was mainly positively correlated with glycerolipid metabolism and autoimmune thyroid disease, and negatively correlated with the regulation of autophagy, peroxisome, drug metabolism, glycerophospholipid metabolism, and RNA degradation (Figure S5G). These results demonstrated that the m6A score might be closely related to metabolic pathways.
Construction and Validation of an m6A-Related Protective Model
In view of the necessity to detect COVID-19 in individuals and the importance of m6A regulators, an accurate predictive model needs to be built. We analyzed the intersections between DEGs of two m6A clusters and DEGs of COVID-19 and COVID-19 individuals, and acquired a total of 4,565 overlapped DEGs (Figure 6A). These DEGs were regarded as candidate genes for least absolute shrinkage and selection operator (LASSO) regression analysis based on the least square method. In the cross-validation process, lambda-min was regarded as the optimal value (Figure 6B). Figure 6C presents the calculated regression coefficient. Finally, nine model-related genes were obtained, which were then used to construct a protective model. The against-COVID-19 signature was as follows: protective score = (−0.40363 × CHEK1) + (−0.00647 × NDC80) + (−0.03129 × PBK) + (−0.27285 × H2BC11) + (−0.06532 × TMSB4X) + (−0.04487 × RPH3A) + (−0.19111 × EEF1D) + (0.083252 × SNAPC2). Further analysis demonstrated that both in the training and validation sets, patients with high protective scores had a higher level of HFD45 and were more likely to protect themselves against COVID-19 infections than those with low protective scores (Figures 6D, E). Moreover, the area under the ROC curve (AUC) values of the model in the training and validation sets were 0.822 and 0.705, respectively (Figures 6F, G), suggesting the excellent performance of the protective model. The heatmaps of the model-related genes were plotted, which indicated a distinct difference in expression levels between the patients with and without COVID-19 in both sets (Figures 6H, I).
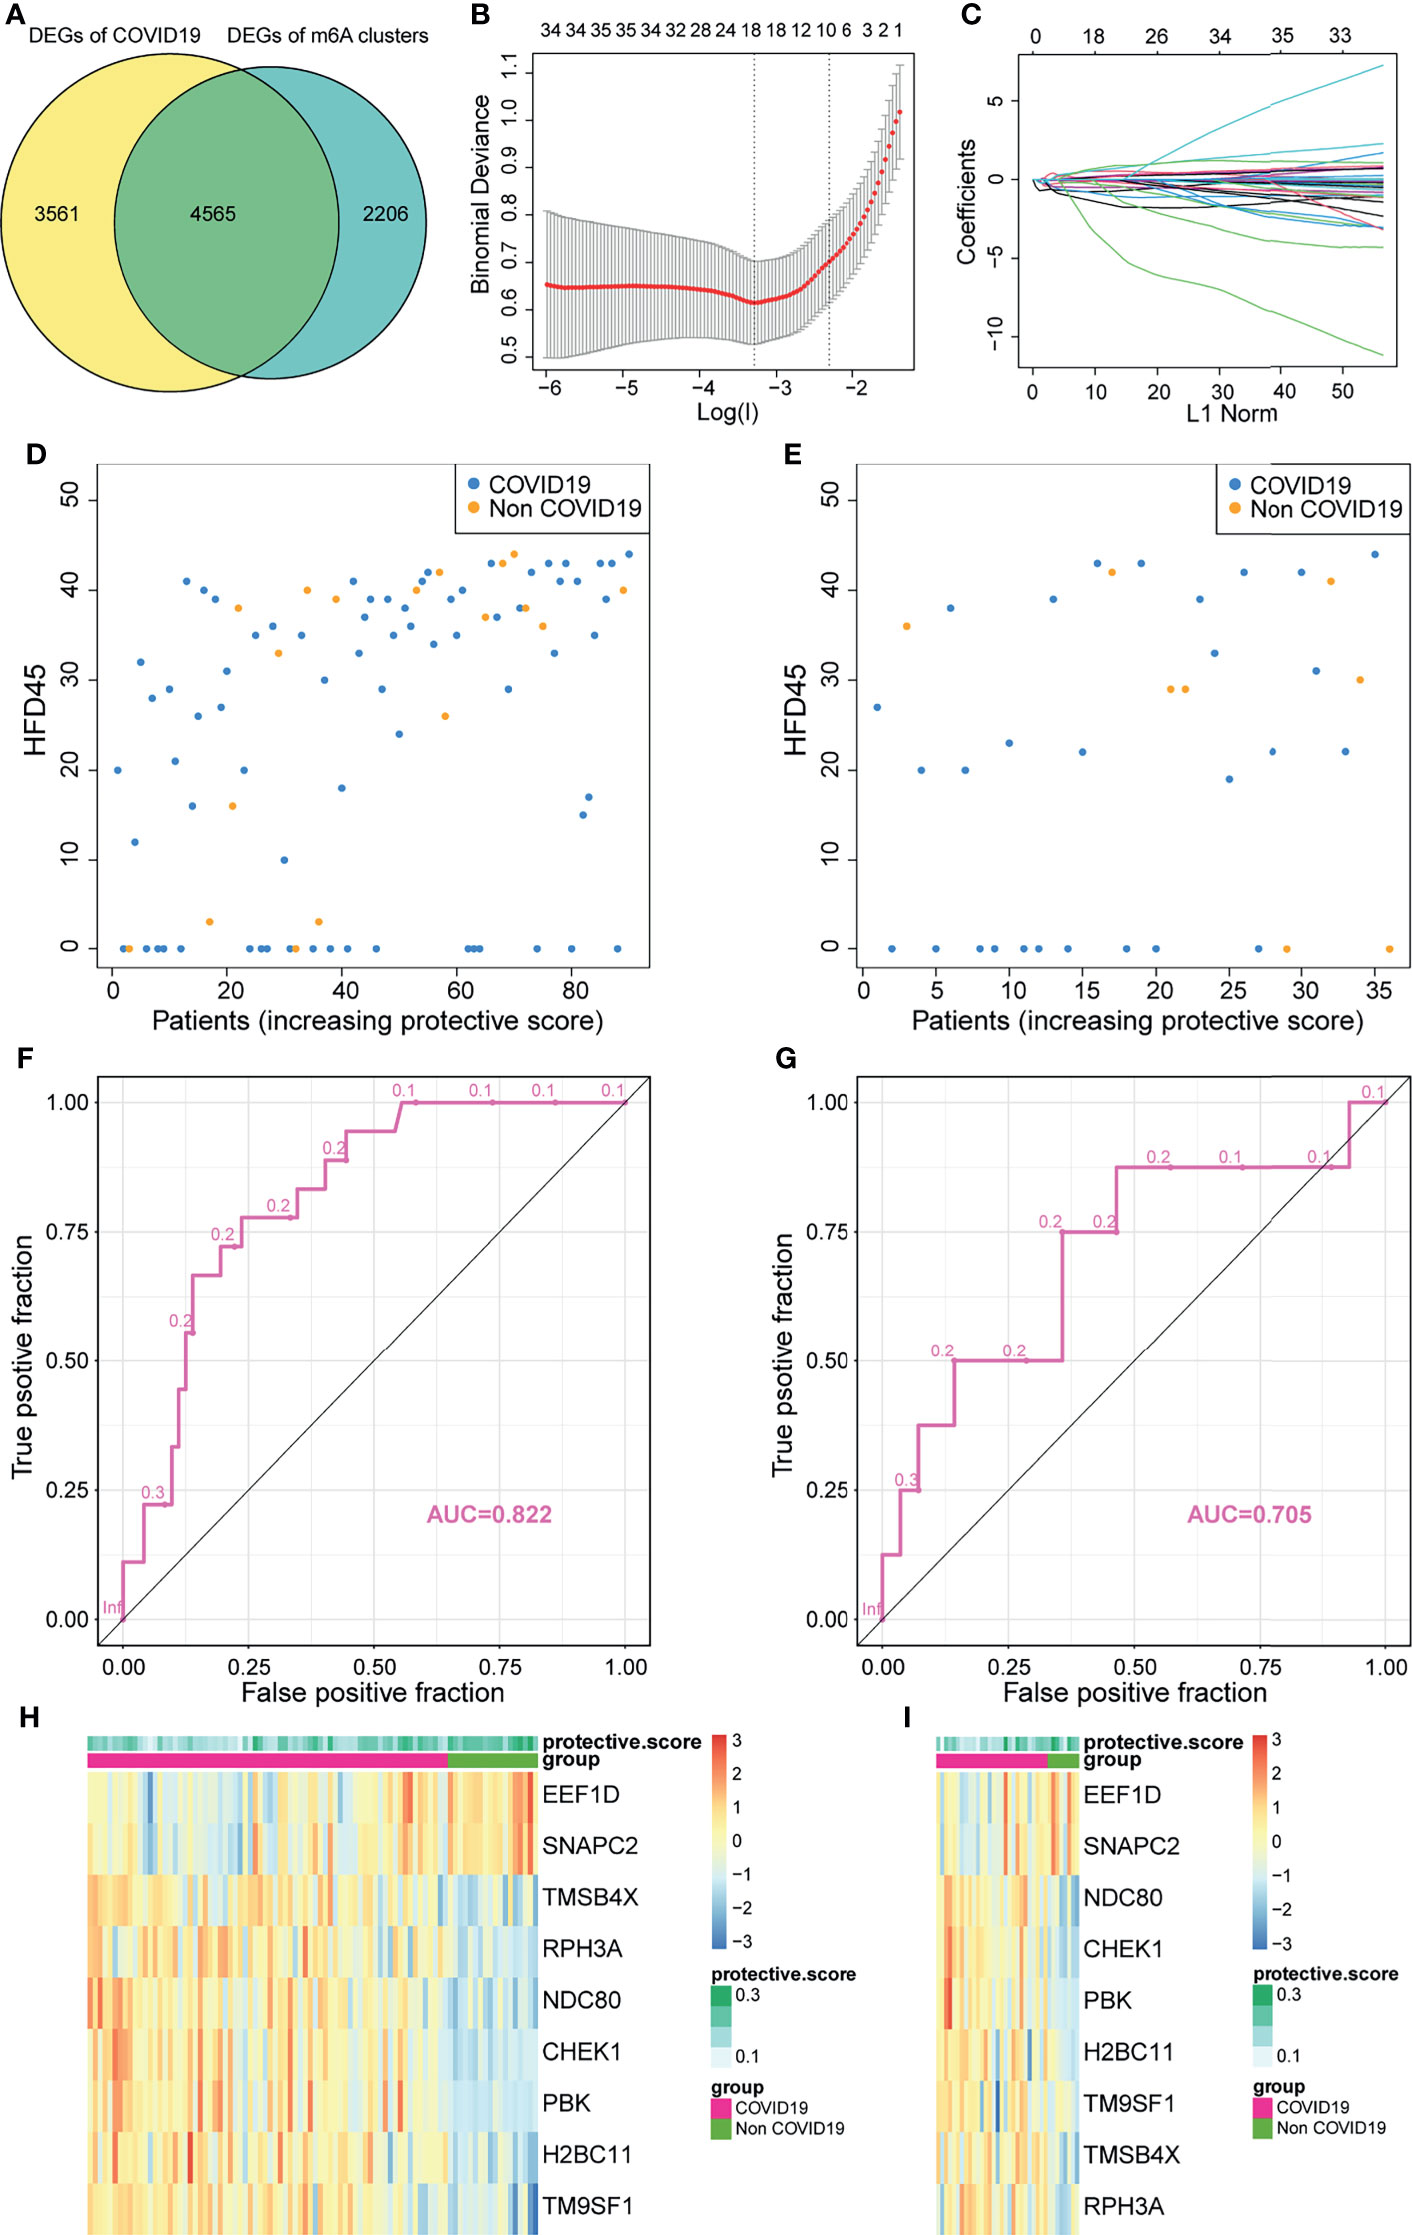
Figure 6 Construction of a protective model to predict patients with COVID-19. (A) Venn plot between DEGs of COVID-19 and DEGs of clusters. (B, C) Construction of a protective model based on intersecting DEGs. (D, E) The HFD45 of patients in the training set and testing set ranked by protective score. (F, G) AUC of patients in the training set and testing set. (H, I) The heatmap of the model genes in the training set and testing set.
To delineate the role and potential mechanisms of the predictive performance of the model, we conducted gene ontology (GO) and KEGG analyses of model-related genes. The results of the analyses revealed that the model was mainly related to external factors, cell cycle, and viral carcinogenesis (Figure 7A). These findings indicated that the protective model can precisely predict the probability of patients infected with SARS-CoV-2. Later, we studied the correlation between the protective score of the model and clinical information (Figures 7B–F), which illustrated that a high protective score was positively correlated with HFD45 and ventilator-free days, whereas a high protective score was negatively correlated with SOFA score, APACHE-II score, and C-reactive protein (crp). Taken together, our findings demonstrated the outstanding predictive value of the newly developed protective model and the clinical prognostic value of the protective score.
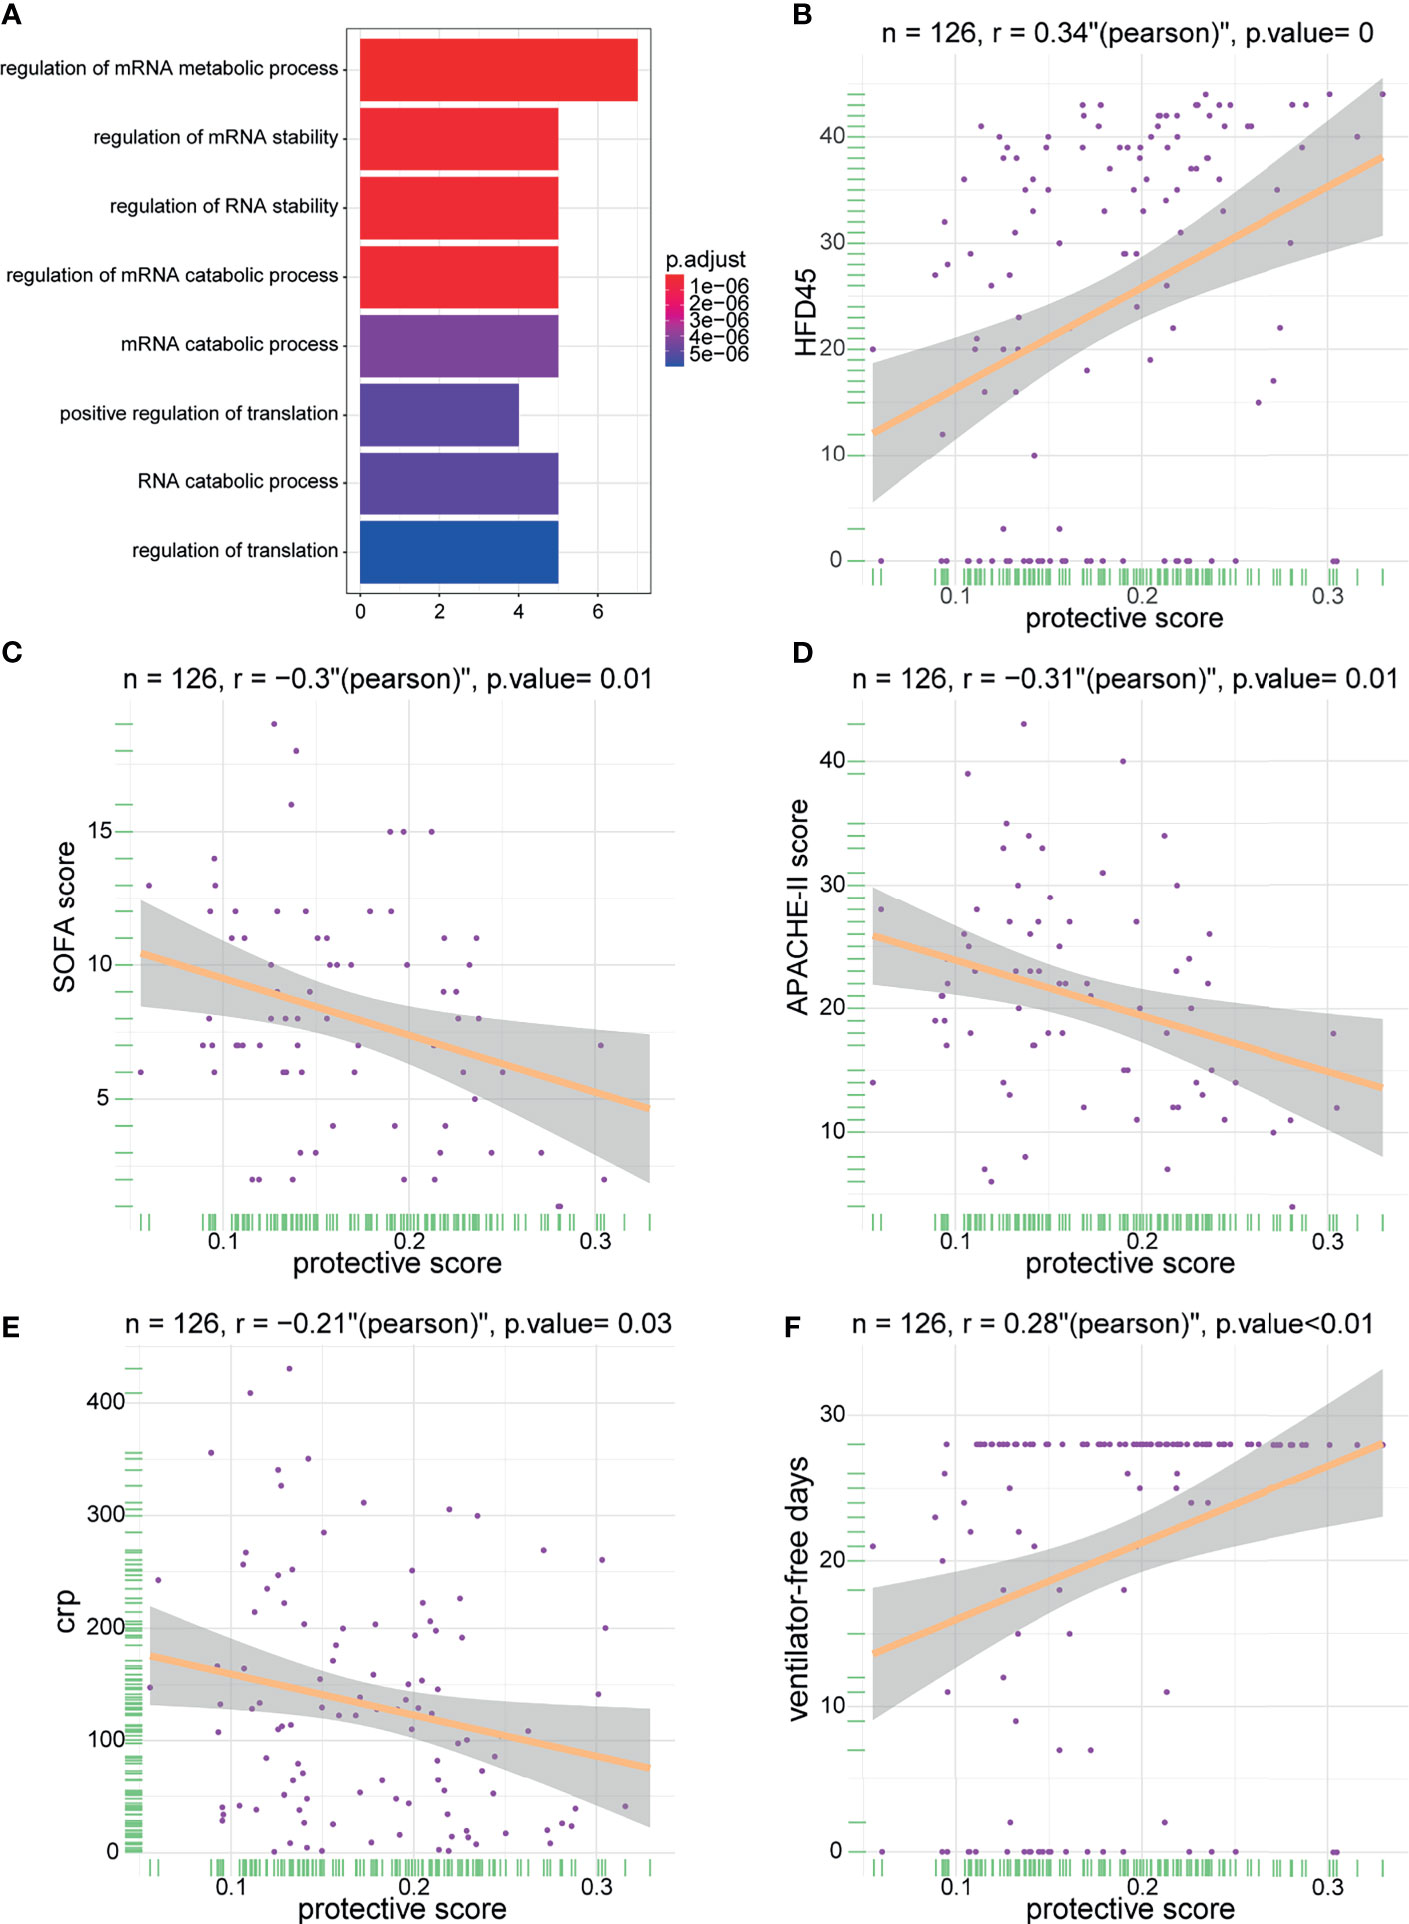
Figure 7 The enrichment of model genes and correlations between protective score and clinical information. (A) The biological process of the model-related genes. (B–F) The correlations between protective score and HFD45 (B), SOFA score (C), APACHE-II score (D), crp (E), and ventilator-free days (F).
Discussion
SARS-CoV-2 is responsible for the severe acute respiratory syndrome. Sokal et al. found that memory B cells in patients responded to COVID-19, while Grifoni et al. and Bert et al. demonstrated that COVID-19-specific CD4+ and CD8+ T cells are generated during the course of COVID-19 disease (13, 15, 33). Interestingly, SARS-CoV-2 spike-reactive CD4+ T cells, which focus on C-terminal S epitopes, can be detected both in patients with COVID-19 and in healthy donors (34). Moreover, a robust CD4+ T cell response to SARS-CoV-2 spike (S) protein and nucleoprotein (N) can be observed in individuals who have recovered from SARS-CoV-2 infection (14, 35). Although the phenotype of lymphocyte responses to COVID-19 has been unraveled by researchers, the underlying mechanism of lymphocyte activation in this disease remains obscure.
RNA modification is diverse and vital in the activation and differentiation of lymphocytes. m6A methylation can control T cell and B cell homeostasis (36, 37). T follicular helper cell differentiation can also be managed by m6A mRNA methylation (38). The above studies primarily focused on communication between tumor and lymphocytes, but whether m6A mRNA methylation was altered in the lymphocytes of COVID-19 patients and the potential function of m6A modification during infection remains unclear. Thus, there is an urgent need to identify the possible mechanisms and promote our understanding of lymphocyte m6A modification in COVID-19 patients.
In this study, we systematically analyzed the m6A modification landscape in blood lymphocytes of COVID-19 patients. The m6A expression level was significantly upregulated in the blood lymphocytes of COVID-19 patients than in those of patients without COVID-19, suggesting that m6A modification might play a vital role in the blood lymphocytes of patients with COVID-19. Later, the correlation between m6A regulators was calculated to explore the intricate relationship between the regulators in patients infected with SARS-CoV-2 and uninfected individuals. We discovered a negative correlation between m6A regulators of the same type, which proved the existence of an m6A modification dynamic balance in COVID-19 patients. The lymphocyte fraction was altered between patients with and without COVID-19. COVID-19 patients had higher levels of B cells and CD4+ T cells, which were consistent with the findings reported by Goel et al. and Kared et al. (39, 40). Further, to explore the different m6A modification patterns in COVID-19 patients, unsupervised cluster analysis of the expression values of m6A regulators identified two distinct modification patterns. m6A cluster A exhibited T cell activation and differentiation, while m6A cluster B was characterized by metabolism-related biological processes such as fatty acid β-oxidation and nucleotide salvage. Essig et al. and Cortez et al. reported that TGF-β signaling and PI3K-AKT signaling are necessary for T cell differentiation (41, 42). Consistent with the above studies, m6A cluster A had a higher level of TGF-β signaling and PI3K-AKT-mTOR signaling, which explained the mechanism of T cell activation and differentiation. Together, it would be reasonable and reliable to state that m6A cluster A which had activated T cell function to fight against SARS-CoV-2 could exhibit a better prognosis.
Due to the remarkably different mRNA profiles between m6A cluster A and m6A cluster B, DEGs between the two clusters were labeled as m6A-DEGs, which were tightly associated with m6A modification. Consistent with the m6A classification, two genomic subtypes were identified by m6A-DEGs based on the unsupervised classification. Moreover, patients in m6A cluster B were more likely to be admitted to the ICU than m6A cluster A patients. Considering the individual heterogeneity of the immune system, it is necessary to establish an evaluation signature to reflect the individual m6A pattern. Here, based on m6A-DEGs, we defined an “m6A score” to quantify the m6A pattern for each COVID-19 individual. Patients in m6A cluster A presented higher HFD45, which meant that they had a better prognosis. In addition, similar to previous results, the m6A score was positively correlated with glycan metabolism, highlighting the core role of the m6A score in glucose metabolism. Furthermore, the clinical value of the m6A score was evaluated. Patients who were not admitted to ICU, did not have diabetes, or had not been treated by mechanical ventilation presented a relatively low median m6A score. These results further confirmed that the m6A score could serve as a satisfactory prognostic indicator.
Finally, we constructed a protective model with nine identified genes (CHEK1, NDC80, PBK, H2BC11, TMSB4X, RPH3A, TM9SF1, EEF1D, and SNAPC2) to predict patients who had COVID-19. Coincidently, some of the genes are linked to viruses infecting humans. CHEK1, which is a gene that is necessary for responding to DNA damage, was reported to be a potential target of saikosaponins which might function as an adjuvant therapy for COVID-19 patients (43). Bioinformatics analysis revealed that NDC80 and PBK can serve as biomarkers for HBV-associated hepatocellular carcinoma (44). Studies have reported that H2BC11 is associated with interferon signaling during viral infections (45). EEF1D, which serves as a guanine nucleotide exchange factor, can inhibit the nuclear import of the nucleoprotein and PA-PB1 heterodimer of the influenza A virus (46). Additionally, some of the genes are essential for immune system activation. For instance, RPH3A is known to be important for neutrophil integrin activation and TM9SF4 is required for cellular immunity in Drosophila (45, 47). The enrichment analysis revealed that external stimulation, cell cycle, and viral carcinogenesis might be the mechanisms underlying this protective model.
The model achieved a high AUC value in the training and validation sets. More importantly, patients without COVID-19 displayed higher protective scores compared to patients with COVID-19. In addition, previous studies have reported that patients with severe COVID-19 had relatively high crp and higher SOFA and APACHE-II scores (48–50). Consistent with the above findings, the results of the correlation analysis suggested that protective score was negatively correlated with the crp, SOFA score, and APACHE-II score. At the same time, protective score was positively correlated with HFD45 and ventilator-free days, both of which are indicators of favorable outcomes. These findings demonstrate that the protective score is an excellent indicator of clinical outcomes and prognosis in COVID-19 patients.
One limitation of our study was the lack of additional clinical confirmation for the expression levels of m6A-related genes and performance of the protective model. Furthermore, due to the vague survival information provided in the GSE157103 dataset, we could not analyze the precise prognostic value for the m6A score and protective model. Nevertheless, HFD45 can reflect a rough prognostic condition to some extent.
In conclusion, this study revealed the correlation between m6A regulators and lymphocytes and discovered the discrepant immune infiltration characteristics among COVID-19 patients with different m6A modifications. The m6A scoring system can effectively predict the clinical outcomes of patients with COVID-19. Importantly, the protective model based on nine signatures was capable of accurately identifying patients with COVID-19. In summary, our work provided novel insights into m6A modification in blood lymphocytes of patients infected with SARS-CoV-2 and an evaluation system to predict the clinical prognosis and possibility of contracting the COVID-19. Based on these findings, m6A DEGs can serve as biomarkers to detect suspected or confirmed SARS-CoV-2 carriers; however, further research is required to uncover the mechanism underlying elevated expression of m6A methylation modification in the lymphocytes of infected individuals.
Data Availability Statement
Publicly available datasets were analyzed in this study. These data can be found here: National Center for Biotechnology Information (NCBI), Gene Expression Omnibus (GEO), https://www.ncbi.nlm.nih.gov/geo/, GSE157103.
Author Contributions
JC designed and supervised the study, XQ collected the data, performed all data analysis and drafted the manuscript. XQ and JC performed original draft preparation, writing, review and editing. XH provided analytical technical support. QL and QZ were responsible for the data acquisition and critical reading of the manuscript. All authors reviewed and approved the final version of the manuscript.
Funding
This study was supported by the Science and Technology Research Plan Project of Chongqing Education Commission (KJQN202100418), the Natural Science Foundation of Chongqing (No. cstc2021jcyj-msxm0317) and the National Natural Science Foundation of China (No. 82030065).
Conflict of Interest
The authors declare that the research was conducted in the absence of any commercial or financial relationships that could be construed as a potential conflict of interest.
Publisher’s Note
All claims expressed in this article are solely those of the authors and do not necessarily represent those of their affiliated organizations, or those of the publisher, the editors and the reviewers. Any product that may be evaluated in this article, or claim that may be made by its manufacturer, is not guaranteed or endorsed by the publisher.
Acknowledgments
The authors are grateful to the GEO database for the availability of the data. We appreciate the linguistic assistance provided by TopEdit (www.topeditsci.com) during the preparation of this manuscript.
Supplementary Material
The Supplementary Material for this article can be found online at: https://www.frontiersin.org/articles/10.3389/fimmu.2021.774776/full#supplementary-material
References
1. Wiener D, Schwartz S. The Epitranscriptome Beyond Ma. Nat Rev Genet (2021) 22(2):119–31. doi: 10.1038/s41576-020-00295-8
2. Desrosiers R, Friderici K, Rottman F. Identification of Methylated Nucleosides in Messenger RNA From Novikoff Hepatoma Cells. Proc Natl Acad Sci USA (1974) 71(10):3971–5. doi: 10.1073/pnas.71.10.3971
3. Zheng G, Dahl J, Niu Y, Fedorcsak P, Huang C, Li C, et al. ALKBH5 Is a Mammalian RNA Demethylase That Impacts RNA Metabolism and Mouse Fertility. Mol Cell (2013) 49(1):18–29. doi: 10.1016/j.molcel.2012.10.015
4. Fu Y, Jia G, Pang X, Wang R, Wang X, Li C, et al. FTO-Mediated Formation of N6-Hydroxymethyladenosine and N6-Formyladenosine in Mammalian RNA. Nat Commun (2013) 4:1798. doi: 10.1038/ncomms2822
5. Liu J, Yue Y, Han D, Wang X, Fu Y, Zhang L, et al. A METTL3-METTL14 Complex Mediates Mammalian Nuclear RNA N6-Adenosine Methylation. Nat Chem Biol (2014) 10(2):93–5. doi: 10.1038/nchembio.1432
6. Wang X, Lu Z, Gomez A, Hon G, Yue Y, Han D, et al. N6-Methyladenosine-Dependent Regulation of Messenger RNA Stability. Nature (2014) 505(7481):117–20. doi: 10.1038/nature12730
7. Wang X, Zhao B, Roundtree I, Lu Z, Han D, Ma H, et al. N(6)-Methyladenosine Modulates Messenger RNA Translation Efficiency. Cell (2015) 161(6):1388–99. doi: 10.1016/j.cell.2015.05.014
8. Liu N, Pan T. N6-Methyladenosine–Encoded Epitranscriptomics. Nat Struct Mol Biol (2016) 23(2):98–102. doi: 10.1038/nsmb.3162
9. Fu Y, Dominissini D, Rechavi G, He C. Gene Expression Regulation Mediated Through Reversible M⁶A RNA Methylation. Nat Rev Genet (2014) 15(5):293–306. doi: 10.1038/nrg3724
10. Shulman Z, Stern-Ginossar N. The RNA Modification N-Methyladenosine as a Novel Regulator of the Immune System. Nat Immunol (2020) 21(5):501–12. doi: 10.1038/s41590-020-0650-4
11. Frye M, Harada B, Behm M, He C. RNA Modifications Modulate Gene Expression During Development. Sci (New York NY) (2018) 361(6409):1346–9. doi: 10.1126/science.aau1646
12. Shi H, Wei J, He C. Where, When, and How: Context-Dependent Functions of RNA Methylation Writers, Readers, and Erasers. Mol Cell (2019) 74(4):640–50. doi: 10.1016/j.molcel.2019.04.025
13. Grifoni A, Weiskopf D, Ramirez S, Mateus J, Dan J, Moderbacher C, et al. Targets of T Cell Responses to SARS-CoV-2 Coronavirus in Humans With COVID-19 Disease and Unexposed Individuals. Cell (2020) 181(7):1489–501.e15. doi: 10.1016/j.cell.2020.05.015
14. Peng Y, Mentzer A, Liu G, Yao X, Yin Z, Dong D, et al. Broad and Strong Memory CD4 and CD8 T Cells Induced by SARS-CoV-2 in UK Convalescent Individuals Following COVID-19. Nat Immunol (2020) 21(11):1336–45. doi: 10.1038/s41590-020-0782-6
15. Sokal A, Chappert P, Barba-Spaeth G, Roeser A, Fourati S, Azzaoui I, et al. Maturation and Persistence of the Anti-SARS-CoV-2 Memory B Cell Response. Cell (2021) 184(5):1201–13.e14. doi: 10.1016/j.cell.2021.01.050
16. Song T, Zheng H, Han J, Jin L, Yang X, Liu F, et al. Delayed Severe Cytokine Storm and Immune Cell Infiltration in SARS-CoV-2-Infected Aged Chinese Rhesus Macaques. Zool Res (2020) 41(5):503–16. doi: 10.24272/j.issn.2095-8137.2020.202
17. Li N, Hui H, Bray B, Gonzalez G, Zeller M, Anderson K, et al. METTL3 Regulates Viral M6a RNA Modification and Host Cell Innate Immune Responses During SARS-CoV-2 Infection. Cell Rep (2021) 35(6):109091. doi: 10.1016/j.celrep.2021.109091
18. Liu J, Xu Y, Li K, Ye Q, Zhou H, Sun H, et al. The mA Methylome of SARS-CoV-2 in Host Cells. Cell Res (2021) 31(4):404–14. doi: 10.1038/s41422-020-00465-7
19. Overmyer K, Shishkova E, Miller I, Balnis J, Bernstein M, Peters-Clarke T, et al. Large-Scale Multi-Omic Analysis of COVID-19 Severity. Cell Syst (2021) 12(1):23–40.e7. doi: 10.1016/j.cels.2020.10.003
20. Hänzelmann S, Castelo R, Guinney J. GSVA: Gene Set Variation Analysis for Microarray and RNA-Seq Data. BMC Bioinf (2013) 14:7. doi: 10.1186/1471-2105-14-7
21. Yu G, Wang L, Han Y, He Q. Clusterprofiler: An R Package for Comparing Biological Themes Among Gene Clusters. Omics J Integr Biol (2012) 16(5):284–7. doi: 10.1089/omi.2011.0118
22. Newman A, Liu C, Green M, Gentles A, Feng W, Xu Y, et al. Robust Enumeration of Cell Subsets From Tissue Expression Profiles. Nat Methods (2015) 12(5):453–7. doi: 10.1038/nmeth.3337
23. Sotiriou C, Wirapati P, Loi S, Harris A, Fox S, Smeds J, et al. Gene Expression Profiling in Breast Cancer: Understanding the Molecular Basis of Histologic Grade to Improve Prognosis. J Natl Cancer Inst (2006) 98(4):262–72. doi: 10.1093/jnci/djj052
24. Wilkerson M, Hayes D. ConsensusClusterPlus: A Class Discovery Tool With Confidence Assessments and Item Tracking. Bioinf (Oxford England) (2010) 26(12):1572–3. doi: 10.1093/bioinformatics/btq170
25. Wei J, Alfajaro M, DeWeirdt P, Hanna R, Lu-Culligan W, Cai W, et al. Genome-Wide CRISPR Screens Reveal Host Factors Critical for SARS-CoV-2 Infection. Cell (2021) 184(1):76–91.e13. doi: 10.1016/j.cell.2020.10.028
26. Daniloski Z, Jordan T, Wessels H, Hoagland D, Kasela S, Legut M, et al. Identification of Required Host Factors for SARS-CoV-2 Infection in Human Cells. Cell (2021) 184(1):92–105.e16. doi: 10.1016/j.cell.2020.10.030
27. Cantuti-Castelvetri L, Ojha R, Pedro L, Djannatian M, Franz J, Kuivanen S, et al. Neuropilin-1 Facilitates SARS-CoV-2 Cell Entry and Infectivity. Sci (New York NY) (2020) 370(6518):856–60. doi: 10.1126/science.abd2985
28. Zhou P, Yang X, Wang X, Hu B, Zhang L, Zhang W, et al. A Pneumonia Outbreak Associated With a New Coronavirus of Probable Bat Origin. Nature (2020) 579(7798):270–3. doi: 10.1038/s41586-020-2012-7
29. Hoffmann M, Kleine-Weber H, Schroeder S, Krüger N, Herrler T, Erichsen S, et al. SARS-CoV-2 Cell Entry Depends on ACE2 and TMPRSS2 and Is Blocked by a Clinically Proven Protease Inhibitor. Cell (2020) 181(2):271–80.e8. doi: 10.1016/j.cell.2020.02.052
30. Clausen T, Sandoval D, Spliid C, Pihl J, Perrett H, Painter C, et al. SARS-CoV-2 Infection Depends on Cellular Heparan Sulfate and ACE2. Cell (2020) 183(4):1043–57.e15. doi: 10.1016/j.cell.2020.09.033
31. Zang R, Gomez Castro M, McCune B, Zeng Q, Rothlauf P, Sonnek N, et al. TMPRSS2 and TMPRSS4 Promote SARS-CoV-2 Infection of Human Small Intestinal Enterocytes. Sci Immunol (2020) 5(47):eabc3582. doi: 10.1126/sciimmunol.abc3582
32. Ritchie M, Phipson B, Wu D, Hu Y, Law C, Shi W, et al. Limma Powers Differential Expression Analyses for RNA-Sequencing and Microarray Studies. Nucleic Acids Res (2015) 43(7):e47. doi: 10.1093/nar/gkv007
33. Le Bert N, Tan A, Kunasegaran K, Tham C, Hafezi M, Chia A, et al. SARS-CoV-2-Specific T Cell Immunity in Cases of COVID-19 and SARS, and Uninfected Controls. Nature (2020) 584(7821):457–62. doi: 10.1038/s41586-020-2550-z
34. Braun J, Loyal L, Frentsch M, Wendisch D, Georg P, Kurth F, et al. SARS-CoV-2-Reactive T Cells in Healthy Donors and Patients With COVID-19. Nature (2020) 587(7833):270–4. doi: 10.1038/s41586-020-2598-9
35. Hengeveld P, Khader A, de Bruin L, Geelen I, van Baalen E, Jansen E, et al. Blood Cell Counts and Lymphocyte Subsets of Patients Admitted During the COVID-19 Pandemic: A Prospective Cohort Study. Br J Haematol (2020) 190(4):e201–4. doi: 10.1111/bjh.16983
36. Zheng Z, Zhang L, Cui X, Yu X, Hsu P, Lyu R, et al. Control of Early B Cell Development by the RNA N-Methyladenosine Methylation. Cell Rep (2020) 31(13):107819. doi: 10.1016/j.celrep.2020.107819
37. Li H, Tong J, Zhu S, Batista P, Duffy E, Zhao J, et al. mA mRNA Methylation Controls T Cell Homeostasis by Targeting the IL-7/STAT5/SOCS Pathways. Nature (2017) 548(7667):338–42. doi: 10.1038/nature23450
38. Yao Y, Yang Y, Guo W, Xu L, You M, Zhang Y, et al. METTL3-Dependent mA Modification Programs T Follicular Helper Cell Differentiation. Nat Commun (2021) 12(1):1333. doi: 10.1038/s41467-021-21594-6
39. Goel R, Apostolidis S, Painter M, Mathew D, Pattekar A, Kuthuru O, et al. Distinct Antibody and Memory B Cell Responses in SARS-CoV-2 Naïve and Recovered Individuals Following mRNA Vaccination. Sci Immunol (2021) 6(58):eabi6950. doi: 10.1126/sciimmunol.abi6950
40. Kared H, Redd A, Bloch E, Bonny T, Sumatoh H, Kairi F, et al. SARS-CoV-2-Specific CD8+ T Cell Responses in Convalescent COVID-19 Individuals. J Clin Invest (2021) 131(5):e145476. doi: 10.1172/jci145476.Citedin:Pubmed
41. Essig K, Hu D, Guimaraes J, Alterauge D, Edelmann S, Raj T, et al. Roquin Suppresses the PI3K-mTOR Signaling Pathway to Inhibit T Helper Cell Differentiation and Conversion of Treg to Tfr Cells. Immunity (2017) 47(6):1067–1082.e12. doi: 10.1016/j.immuni.2017.11.008
42. Cortez V, Cervantes-Barragan L, Robinette M, Bando J, Wang Y, Geiger T, et al. Transforming Growth Factor-β Signaling Guides the Differentiation of Innate Lymphoid Cells in Salivary Glands. Immunity (2016) 44(5):1127–39. doi: 10.1016/j.immuni.2016.03.007
43. Chikhale R, Sinha S, Wanjari M, Gurav N, Ayyanar M, Prasad S, et al. Computational Assessment of Saikosaponins as Adjuvant Treatment for COVID-19: Molecular Docking, Dynamics, and Network Pharmacology Analysis. Mol Divers (2021) 1–16. doi: 10.1007/s11030-021-10183-w.Citedin:Pubmed
44. Ji Y, Yin Y, Zhang W. Integrated Bioinformatic Analysis Identifies Networks and Promising Biomarkers for Hepatitis B Virus-Related Hepatocellular Carcinoma. Int J Genomics (2020) 2020:2061024. doi: 10.1155/2020/2061024
45. Zhang Y, Mao D, Roswit W, Jin X, Patel A, Patel D, et al. PARP9-DTX3L Ubiquitin Ligase Targets Host Histone H2BJ and Viral 3C Protease to Enhance Interferon Signaling and Control Viral Infection. Nat Immunol (2015) 16(12):1215–27. doi: 10.1038/ni.3279
46. Gao Q, Yang C, Ren C, Zhang S, Gao X, Jin M, et al. Eukaryotic Translation Elongation Factor 1 Delta Inhibits the Nuclear Import of the Nucleoprotein and PA-PB1 Heterodimer of Influenza A Virus. J Virol (2020) 95(2):e01391–20. doi: 0.1128/JVI.01391-20
47. Bergeret E, Perrin J, Williams M, Grunwald D, Engel E, Thevenon D, et al. TM9SF4 Is Required for Drosophila Cellular Immunity via Cell Adhesion and Phagocytosis. J Cell Sci (2008) 121:3325–34. doi: 10.1242/jcs.030163
48. Smilowitz N, Kunichoff D, Garshick M, Shah B, Pillinger M, Hochman J, et al. C-Reactive Protein and Clinical Outcomes in Patients With COVID-19. Eur Heart J (2021) 42(23):2270–9. doi: 10.1093/eurheartj/ehaa1103
49. Bauer A, Schreinlechner M, Sappler N, Dolejsi T, Tilg H, Aulinger B, et al. Discontinuation Versus Continuation of Renin-Angiotensin-System Inhibitors in COVID-19 (ACEI-COVID): A Prospective, Parallel Group, Randomised, Controlled, Open-Label Trial. Lancet Respir Med (2021). doi: 10.1016/s2213-2600(21)00214-9
Keywords: COVID-19, immune characteristics, m6A methylation modification, protective model, leukocytes
Citation: Qiu X, Hua X, Li Q, Zhou Q and Chen J (2021) m6A Regulator-Mediated Methylation Modification Patterns and Characteristics of Immunity in Blood Leukocytes of COVID-19 Patients. Front. Immunol. 12:774776. doi: 10.3389/fimmu.2021.774776
Received: 13 September 2021; Accepted: 08 November 2021;
Published: 30 November 2021.
Edited by:
Rory de Vries, Erasmus Medical Center, NetherlandsReviewed by:
Zuzana Strizova, University Hospital in Motol, CzechiaJiangbo Wei, University of Chicago, United States
Copyright © 2021 Qiu, Hua, Li, Zhou and Chen. This is an open-access article distributed under the terms of the Creative Commons Attribution License (CC BY). The use, distribution or reproduction in other forums is permitted, provided the original author(s) and the copyright owner(s) are credited and that the original publication in this journal is cited, in accordance with accepted academic practice. No use, distribution or reproduction is permitted which does not comply with these terms.
*Correspondence: Juan Chen, Y2xhZGNoZW5AY3FtdS5lZHUuY24=