 Timothy M. Johanson
 Christine R. Keenan
 Rhys S. Allan
- 1The Walter and Eliza Hall Institute of Medical Research, Parkville, VIC, Australia
- 2Department of Medical Biology, The University of Melbourne, Parkville, VIC, Australia
In the two decades since the invention of laser-based super resolution microscopy this family of technologies has revolutionised the way life is viewed and understood. Its unparalleled resolution, speed, and accessibility makes super resolution imaging particularly useful in examining the highly complex and dynamic immune system. Here we introduce the super resolution technologies and studies that have already fundamentally changed our understanding of a number of central immunological processes and highlight other immunological puzzles only addressable in super resolution.
Introduction
Microscopy has a long history of enabling immunological discoveries. After likely being observed by the ‘father of microscopy’ A. van Leeuwenhoek in 1687 in human saliva (1), the first definitive description of leukocytes came in 1749 when Joseph Lietaud and Jean-Baptiste de Senac observed human “globuli albicantes” and “globules blanc”, respectively (2, 3). Roughly a hundred years later the first suggestions of immune cell function were observed when leukocytes were seen exiting the vasculature of a frog’s tongue in response to injury (4) and ‘attacking’ a rose thorn stuck into a sea star larva (1).
Unbeknownst to these microscopy pioneers their ability to observe microscopic structures was limited not only by the strength of light (be it sun or candle) but also the nature of light itself. When light passes through an aperture, such as a microscope objective, it diffracts. How widely it diffracts is dependent on the size of the aperture and the wavelength of the light. Visible light has wavelengths from 400-700 nm. The smaller the aperture or the longer the wavelength of the light the greater the diffraction. When this diffracted light hits a surface, such as the sample, it forms a ripple like pattern, known as an Airy disc (Figure 1). The size of the Airy disc is dependent on the extent of diffraction, and importantly sets a limit on the resolution of the microscope. Put simply, only illuminated objects that are laterally separated by more than the radius on the disc, or approximately half the wavelength of the illuminating light, can be discerned. This resolution limit is known as the diffraction limit.
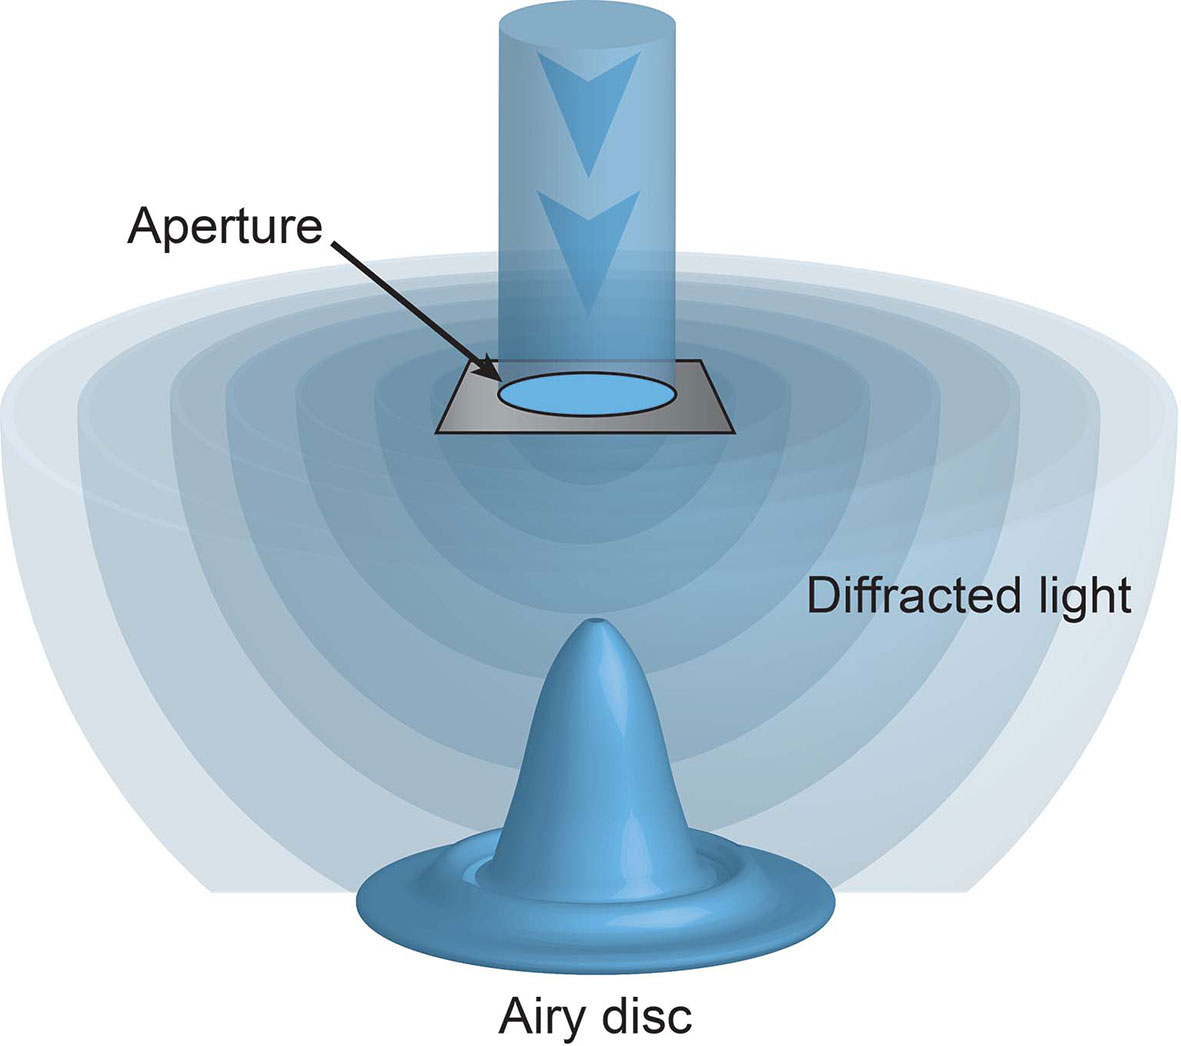
Figure 1 The diffraction limit. Light passing through an aperture diffracts. When hitting a surface this light forms a ripple like pattern of illumination, with a central focus of intensity surrounded by concentric rings, known as an Airy disc. No objects laterally separated by less than the radius of this disc can be discriminated.
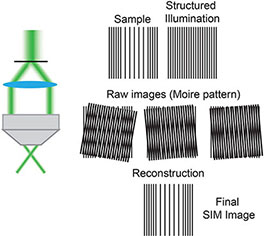
Box 1. Structural Illumination Microscopy (SIM) (5) uses moveable diffraction gratings inserted into the excitation beam path creating a striped pattern of illumination. By acquiring multiple images with this known pattern of structured illumination it is possible to omit out-of-focus signal to create a super resolution image. SIM can be used to image live cells.
The diffraction limit restricted all forms of light microscopy, including laser microscopy (albeit with a shorter and more defined wavelength), for hundreds of years, until the invention of revolutionary super resolution imaging technologies (5, 6). By structuring the excitation light (Box 1) or by using modified laser beams to ‘switch off’ select fluorophores in an illuminated sample (Box 2) these pioneering super resolution technologies were able to break the diffraction limit and increase resolution to ~100 nm. Following these breakthrough technologies has a been procession of Nobel Prize winning super resolution imaging technologies that have improved potential resolution to as little as ~20 nm, not only in fixed samples but in highly dynamic live cells and tissues.
The ability to observe and record the behaviour of immune cells, both individually and in tissues, at super resolution has enabled the interrogation of numerous long-standing cellular immunological questions (7). However, while individual cells have been observable for hundreds of years, it was only the super resolution revolution that allowed the thorough examination of single molecules. It is arguably at this molecular level, at which single RNA transcripts (8, 9), individual gene loci (10), chemokines (11), actin filaments (12) and transcription factors (13), among others, can be visually disentangled, that super resolution imaging holds its greatest utility.
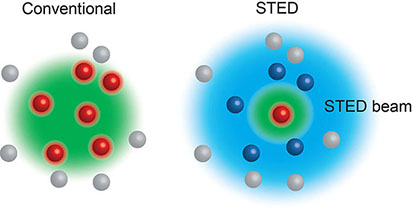
Box 2. Stimulated Emission Depletion (STED) (6) microscopy relies on the interplay between two laser pulses, the first to excite fluorophores at the focal spot, and the second a modified depleting beam that reversibly de-excites any fluorophores surrounding the focal spot. Thus, only the excited fluorophores in the focal spot emit light, allowing features smaller than the diffraction limit to be visualised. STED can be used in live cells.
Here we focus on four central immunological processes; two of which super resolution microscopy has already fundamentally changed the way they are understood (immune cell danger detection and activation) and two which these technologies have the currently unrealised potential to answer key, longstanding molecular immunological questions (recombination and lineage decisions). In doing so we also provide introductions to the technologies that have profoundly altered the way not only the immune system, but all life is seen.
Super Resolution Imaging of Immune Cell Receptors
The ability of immune cells to detect and respond to danger signals is fundamental in immune function. While the receptors involved differ across immune cells types (14) the distribution of these receptors, and other co-stimulatory molecules, is critically important to appropriate activation.
For many years it was thought that receptors, such as B cell receptor (BCR) on B cells, T cell receptor (TCR) on T cells and Toll like receptors (TLRs) on macrophages, were evenly distributed across their respective cell surfaces only to aggregate upon activation (15). However, despite electron microscopy results suggesting the non-random distribution of immunoglobulin molecules on resting B cells (16) as early as 1975, it was not until the advent of super-resolution imaging technologies that it was explicitly shown that many, if not all, receptors cluster within the plasma membrane in the steady state (17–19).
For example, in a seminal work using PALM imaging (Box 3) the TCR and a key T cell signalling adaptor molecule, Linker for Activation of T cells (Lat), were shown to reside in clusters upon the plasma membrane, termed protein islands (21). In more recent technically and visually stunning expansions of the characterisation of TCR distribution it was shown that these TCR islands are found across the whole live T cell membrane in culture (22) and in the lymph node (23).
Using other variants of SMLM (Box 3) other immune signalling molecules have also been shown to form clusters in the steady state including; CD4 and Lck on T cells (24–26), IgM, IgG and IgD on B cells (27–29), IgE on mast cells (30), TLR4 (31–33), signal regulatory protein α, Fc gamma receptor I and II on human macrophages (34), β2 integrins on human neutrophils (35) and NKG2D on NK cells (36).
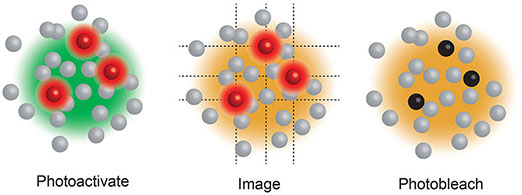
Box 3. Single Molecule Localisation Microscopy (SMLM), including Stochastic Optical Reconstruction Microscopy (STORM) (20) and Photo-Activated Localization Microscopy (PALM) (17), use a low power beam to activate a small proportion of reversibly photoactivatable molecules within an illuminated area before a higher power illuminating beam records the molecules position and photobleaches them. As only a small proportion of the total fluorescent molecules are activated in each cycle the centre of mass of individual molecules can be determined in each image (a process that would be impossible if all molecules fluoresced simultaneously) before being collated into a final super resolution image. These compiled images can achieve ~25 nm resolution. PALM generally use genetically encoded photo-switchable fluorescent proteins, while STORM uses conventional synthetic dyes. Both can be used in live cells.
The majority of these studies revealed not only the pre-activation clustering of these signalling molecules, but a consistent activation induced redistribution of these clusters. Interestingly, evidence from STORM, PALM and FLIM/FRET (Box 4) imaging of T and B cell membranes reveals this redistribution to be a concatenation, but not coalescence, of these clusters (21, 38, 39) (Figure 2). This concatenation of protein islands, as opposed to a complete merging, is thought to play an important regulatory function. As such, it is thought that signalling occurs only at the boundaries of clusters that contain distinct compositions of important signalling molecules. For example, in B cells IgM and CD45 are found together on an island separated from islands containing Lyn and CD19 (40, 41). This is important as Lyn is required for some forms of signalling via IgM (42, 43). Thus, the two islands must come together, and exchange components, during activation, however, if complete coalescence of the islands was allowed dysregulated activation could result.
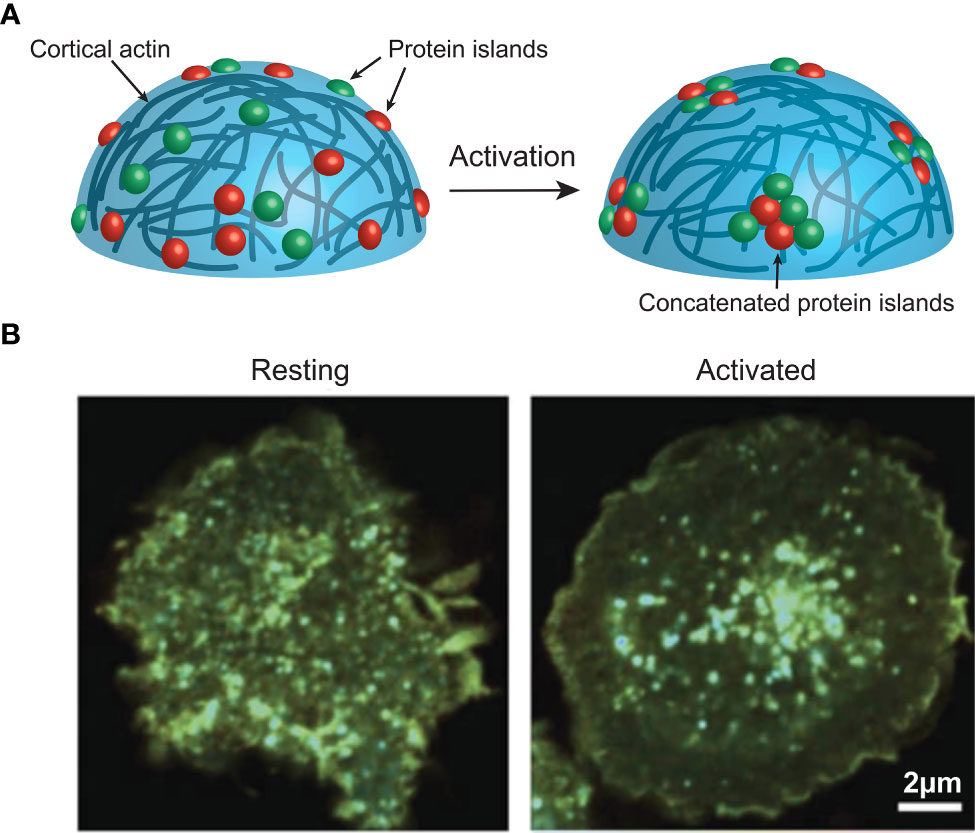
Figure 2 (A) Activation induces actin-mediated concatenation of cell surface protein islands on the surface of immune cells to facilitate signalling. (B) FRET imaging data from Ma et al. (38), showing CD3z clustering on a Jurkat cell before and after activation. Image used under the terms of the Creative Commons licence.
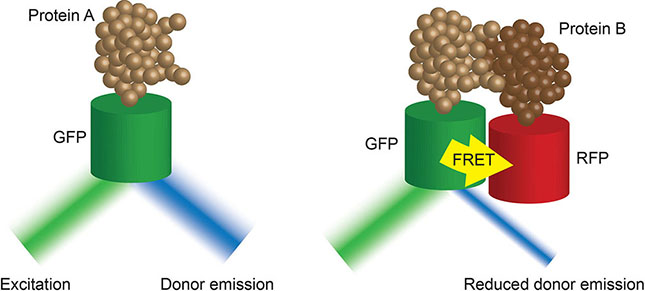
Box 4. Fluorescence-lifetime imaging microscopy (FLIM) (37) images the decay rate of fluorescence of a tagged donor molecule of interest after excitation. This rate of decay is impacted by the proximity of an acceptor molecule. The closer the molecules of interest, the faster the decay. As such, FLIM-FRET techniques provide high temporal resolution of tagged protein-protein interactions in live cells.
It has been known for over a decade that the network of cortical actin just under the cell membrane plays a critical role in the separation of protein islands (44, 45). However, it was the application of super resolution imaging technologies that allowed elucidation of the underlying molecular mechanism of control. As such, STORM imaging has shown that treatment of B cells with an actin-depolymerizing compound (latrunculin A) increases the proximity of the aforementioned IgM and IgD containing islands (28) and the lateral mobility of BCR and CD19 containing islands (27, 46, 47).
Immune Cell Activation at Super Resolution
Once a danger signal is detected, immune cells undergo dramatic cellular and molecular changes in order to play their part in the immune response. In addition to revealing previously unseen mechanisms of immune cell danger detection, super resolution imaging has also added to our understanding of the molecular changes during immune cell activation.
Some immune cells, such as cytotoxic T cells and natural killer (NK) cells, respond to activation with the release of lytic granules at a synapse between them and their target cell. These granules are designed to induce apopotosis in the target cell. Unsurprisingly, given their lethality, the formation, trafficking and release of these modified lysosomes is tightly controlled. The ability of sub-diffraction limit imaging to visually untangle the dense, intricate and highly dynamic network of cortical actin and lytic granules underlying the synapse and the plasma membrane in general has revolutionised our understanding of immune cell killing (48).
For example, in recent years a number of super-resolution imaging technologies, including 3D-SIM (49), STED (50, 51), SMLM and TIRF (Box 5) (53, 54), and Lattice light sheet microscopy (Box 6) (12, 56) have all been used to observe the rapid and intricate movement of actin and lytic granules towards, and within, the immune synapse of both T and NK cells. As such, it was revealed that upon activation the network of actin that normally forms a mesh too dense for lytic granules to traverse dilates or dissolves at the immune synapse allowing microtubule-guided granule release (Figure 3) This process takes approximately one or thirty minutes in T and NK cells, respectively (50, 54, 57).
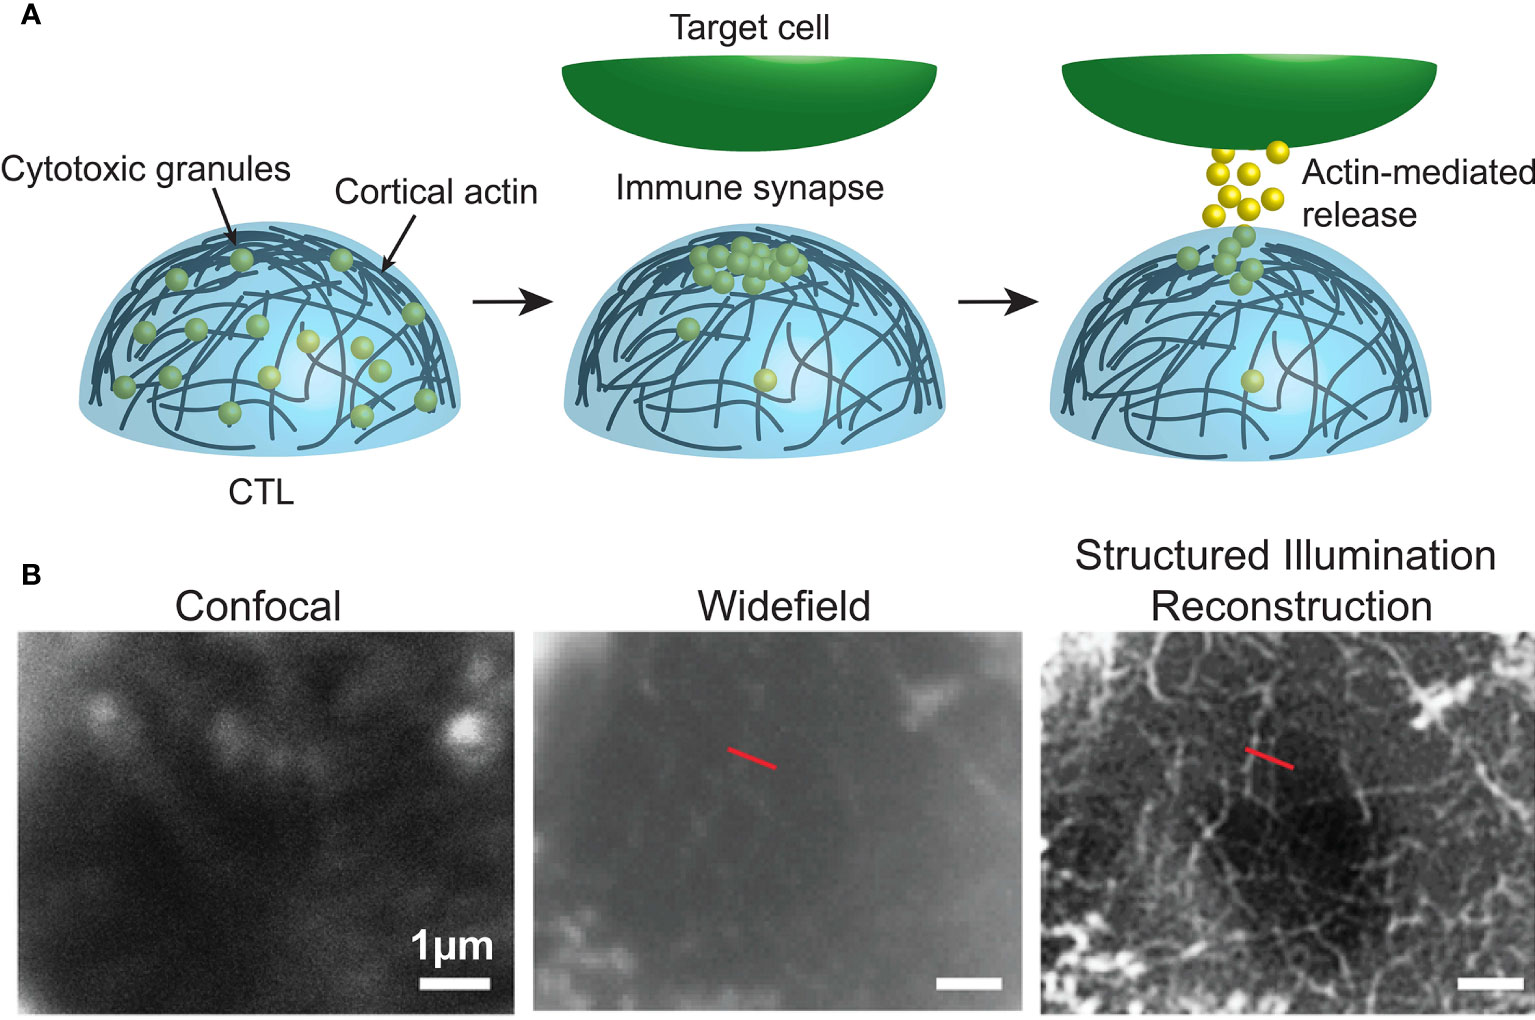
Figure 3 (A) Dynamic cortical actin regulates the accumulation and release of cytotoxic granules at the immune synapse of cytotoxic immune cells. (B) Data from Brown et al. (57), comparing F-actin (white) at human NK cell synapses using confocal, widefield and structured illumination reconstruction imaging. Image used under the terms of the Creative Commons licence.
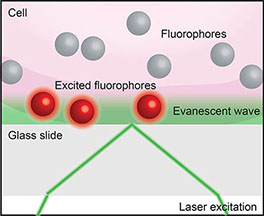
Box 5. Total internal reflection fluorescence microscopy (TIRF). When light encounters the interface of two transparent materials with different refractive indices (such as a live cell and a cover slip, as below), it will most often be both diffracted and reflected. However, at a certain angle of incidence the light will be totally reflected in a phenomenon called total internal reflection. Total internal reflection creates an electromagnetic field that passes through the interface between the two materials to form an evanescent wave. TIRF imaging (52) exploits this evanescence to excite fluorophores only in close proximity to the interface to achieve sub-diffraction limit axial resolution.
Furthermore, not only is the intricate actin network important for facilitating degranulation, it also appears to play an important role in regulating the number of granules released. This control is critically important as it minimises healthy by-stander cell killing (58) and potentially also influences the number of target cells an individual cytotoxic lymphocyte can kill (59). Recent imaging studies have shown that T and NK cells do not release their entire granule payload during initial degranulation. In fact, they may release as little as one tenth of their total granules (60, 61). Actin likely regulates degranulation via two mechanisms; one, it limits the transport of granules to the immune synapse (60) and two, TIRF imaging recently observed the reformation of the dense actin network underlying the immune synapse soon after degranulation, restricting further granule release (12).
While cytotoxic lymphocytes respond to activation with the direct killing of target cells, B lymphocytes direct killing via the mass production of specific antibodies. This requires transformation into ‘antibody factories’, including dramatic increases in cell size, proliferation and RNA synthesis (62). The process also involves the spreading of chromatin from its naïve location, predominantly at the nuclear periphery, to a more dispersed configuration. This chromatin spreading is thought to promote transcription factor binding and gene expression important in the transformation to antibody secreting cells (63, 64).
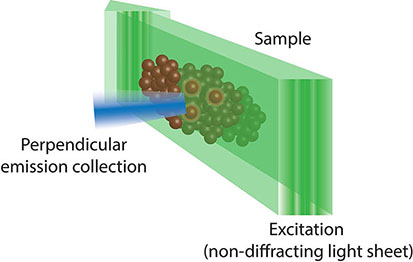
Box 6. Lattice light sheet fluorescence microscopy (55) uses a combination of techniques from light sheet, Bessel beam and structural illumination microscopy (SIM). As such, it uses a two-dimensional lattice of non-diffracting Bessel beam light sheets that are spaced such that they cause destructive interference and removal of the ‘out of field’ illumination which hampers traditional Bessel beam light sheet microscopy. This allows lattice light sheet microscopy to achieve unparalleled resolution and penetrance, while minimising phototoxicity.
While super resolution investigations confirmed chromatin spreading (13, 65), the ability to visualise the chromatin fibre to <20 nm resolution revealed that not only do the fibres spread within the nucleus, they also decompact, meaning there is more accessible DNA between normally tightly compacted nucleosomes. These processes were shown to be regulated independently, and furthermore it was chromatin decompaction, not spreading, that was important in regulating transcription factor binding (13). By inserting a fluorescent Halo-Tag downstream of two transcription factors, CTCF and JunD, almost unimaginably detailed three-dimensional single molecule tracking revealed the binding and diffusion behaviours of these factors during their DNA interrogations. As such, in a naïve B cell JunD collides with DNA roughly 130 times before finding a suitable and accessible binding site. This search time is roughly halved upon B cell activation (13). This was elegantly shown to be independent of chromatin spreading and reliant upon nucleosome decompaction using drug treatment or energy depletion, respectively (13). The dwell or residence times of CTCF determined by single molecule tracking was confirmed using FRAP imaging (Box 7).
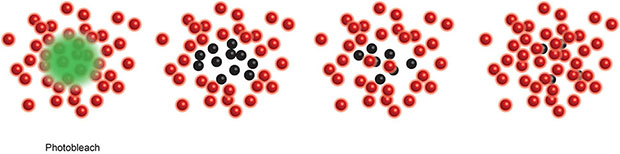
Box 7. Fluorescence recovery after photobleaching (FRAP) (66) measures the recovery of local photodestruction of a tagged molecule via diffusion to determine the molecules dynamics within the local molecular environment.
These studies are examples of how super resolution imaging has already fundamentally changed our understanding of central immunological processes, in this case by revealing the molecular underpinnings of immune cell activation. While earlier technologies did elude to many of these mechanisms, the fact that actin fibres, nucleosomes and indeed protein islands (22) are frequently separated by less that 200 nm means they can only be meaningfully visualised, and thus more completely understood, in super resolution.
The Future of Super Resolution in Molecular Immunology
The works outlined thus far highlight the impact of super resolution imaging on our understanding of immune cell function. While these explorations have already yielded fruit, below we outline two incompletely understood, but essential, molecular immune processes in which super resolution imaging has the potential to answer longstanding questions.
Antigen Receptor Recombination
Recombination of the antigen receptor genes (Igh, Igk and Igl in B cells and Tcrg, Tcrd, Tcrb and Tcra in T cells) is key to generating a wide antigen receptor repertoire. The tightly controlled process involves removal of the intervening DNA between genes from three segment pools, known as variable (V), diversity (D) and joining (J). The result is in an exon that encodes the antigen-binding domain of an antigen receptor. Recombination relies on a series of remarkable genomic manoeuvres, including relocalisation of the antigen receptor gene from the periphery to the centre of the nucleus (67, 68), removal of genomic domain boundaries within the gene (69) and a contraction of the gene to bring linearly distant V regions into close physical proximity with the D-J region for recombination (68, 70–72). These processes have been extensively examined using molecular and genetic manipulations, but also imaging technologies. For example, DNA FISH has been used to quantify the nuclear position and contraction of the Igh locus in B cell progenitors (67).
While these studies have added to our understanding of antigen receptor recombination there are still significant gaps in our knowledge of the process. For example, while locus contraction brings the V region into proximity with the D-J region, how the V region that will ultimately form part of the functional exon is ‘selected’ from numerous candidates within the distal region is unclear. Diffusion fitting a fractional Langevin motion model (73) within the viscoelastic nuclear environment is currently the best explanation of how this process may work (74, 75).
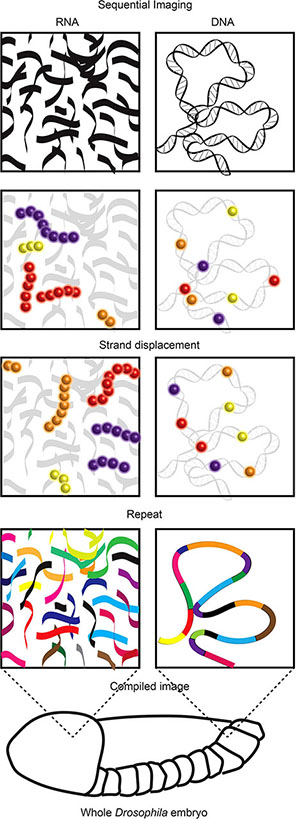
Recent super resolution imaging breakthrough technologies provide an opportunity to reveal the mechanics of this long-standing immunological puzzle. These technologies, including ORCA and Hi-M (Box 8) (80, 81), leverage the development of complex pools of synthetic fluorescently labelled oligonucleotides (OligoPaint) alongside sequential super resolution STORM imaging to reveal the nanoscale configuration of genomic regions. In visually stellar works building on super resolution examinations of chromosome scale genome organisation (83–85), both ORCA and Hi-M have been used to visualise the nanoscale (2-15 kB resolution) organisation of specific genomic regions (up to 700 kB in size) within individual cells of whole Drosophila embryo sections. These works revealed previously undetectable relationships between genome organisation, epigenetic states and transcription (80, 81).
Box 8. While visualisation of total RNA or DNA is relatively trivial, identification of specific RNA species or DNA regions within the vast cellular pool of both is far from it (76). The visualisation of RNA is most frequently used to identify transcriptional activity based upon concentrations of specific RNA species. For many years, RNA Fluorescence In Situ Hybridization (FISH) (77) was the method of choice. However, the number of different RNA species detected was limited by fluorescence spectra. Recent multiplexing technologies resolved this issue using sequential imaging allowing visualisation of over a thousand RNA species in a single cell (8, 9). While FISH requires sample fixation, there are a number of imaging technologies that allow visualisation of RNA in live cells. These utilise small molecule fluorescent dyes (molecular beacons, nanoflares and dye aptamers) or fluorescent proteins fused to RNA aptamer binding proteins (MS2, PP7 or pumilio1) or single stranded RNA-binding Cas9 (rCas9) (78). The aptamer strategies require genetic engineering of the RNA of interest to insert aptamer sequences while beacons, nanoflares and rCas9 bind native RNA species. Similar to RNA visualisation, DNA FISH (79) has traditionally been the method used to view locus position within fixed cells, with the same spectral constraints. Recent technological advances have allowed both sequential imaging in fixed cells [ORCA (80), Hi-M (81)] and imaging DNA in live cells (10, 82). Similar to the multiplexed RNA-FISH technologies the DNA sequential imaging technologies use successive rounds of imaging separated by fluorescent stranddisplacement to reveal the location of, and relationship between, numerous regions of DNA. Imaging DNA regions of interest in live cells currently relies upon the binding of tagged and catalytically dead Cas9 (dCas9) to these loci. This creates challenges in delivering sufficient guide RNAs to target labelled dCas9 to the regions of interest. One recent solution includes the development of molecular assembly strategies that allow the introduction of up to 36 guide RNAs into a single cell providing sufficient guide to visualise non-repetitive DNA regions in live cells (10).
Given the unprecedented resolution, throughput and applicability of these new super resolution technologies it is conceivable that they could be used to examine the nanoscale genome organisation of antigen receptor loci in thousands of adaptive immune cell progenitors of any species. Taking mouse Igh as an example 700 probes would be sufficient to cover the entirety of the expansive 2 million base pair locus at a 3 kb resolution. Given the 113 VH region gene segments are mostly separated from each other by at least 5 kb (86), 3 kb resolution would be sufficient to reveal the location of all VH gene segments, along with the rest of the locus, within thousands of individual cells. While fixation required by sequential imaging prohibits a live view of the recombination process, a compilation analysis from the thousands of single cells could reveal an unparalleled view of the local genomic environment in which recombination occurs (80, 84, 87). This could reveal patterns of order, indicative of stable, consistent position or interactions, or disorder, potentially revealing regions undergoing random diffusion. For example, it could be that locus contraction consistently brings particular regions into physical proximity, relative to all others. Alternatively, it could be that the entire locus diffuses with minimal physical constraints and no discernible patterns of interaction. Either way these breakthrough super resolution technologies could enable a greater understanding of the role of diffusion and physical proximity during recombination.
As for live imaging, the fixation required for ORCA and Hi-M would also obstruct downstream examination of the physiological impacts of the visualised genomic organisation. For example, even if as hypothesised the distal VH gene segments are revealed to contract to, then diffuse near, the D-J region, the ultimately selected segment could not be confirmed within fixed cells. However, here it is worth remembering that the near universal applicability of these technologies mean they can not only expand our understanding of steady state conditions, but also be applied to the genetic and molecular manipulation systems used previously to understand recombination. Thus, perturbations to antigen receptor loci genomic organisation could be re-examined using these novel technologies validating and expanding previous conclusions.
Immune Cell Lineage Decisions
Immune cells make up arguably the most diverse cellular system in complex organisms. This diversity requires numerous lineage decisions as an immune cell differentiates from a haematopoietic stem cell. Be they step-wise and absolute or fluid and continuous (88), these decisions are directed by transcription factors (89). Some of these factors as so influential that the expression of a single transcription factor gene can alter a cells lineage fate (90, 91). The cellular consequences of these lineage decisions have been well explored, in part using imaging (7). However, the molecular events underlying immune cell lineage decisions remain largely unexplored.
Recent application of cutting-edge super resolution imaging technologies in other systems have demonstrated the power of these technologies to reveal molecular insights into transcriptional regulation, and thus potentially lineage decisions. For example, in a recent technical masterpiece single molecule tracking combined with target loci locking microscopy was used to reveal the single molecule resolution, real time kinetics of transcription and its regulators in mouse embryonic stem cells (92). As such, phage genome sequences that can be recognised by fluorescently tagged phage coat proteins were engineered into the 3’ UTR of two pluripotency transcription factor genes (Box 8). This allowed single molecule visualisation of nascent mRNA. In the same cells, RNA polymerase II or other transcriptional regulatory factors (Sox2, Cdk9, Brd4 or Mediator) were fluorescently labelled. This allowed a phenomenally detailed examination of the relationship between the numbers, dynamics and positioning of these factors relative to transcription, revealing hierarchical, highly dynamic (2-10 second turnover) but relatively small clusters (<20 molecules) of all factors at sites of transcription.
As mentioned above single molecule tracking has been previously performed in immune cells (13). However, these experiments were not in the context of lineage decisions or concurrent with transcriptional visualisation. Here we outline experiments applying the visualisation systems used in Drosophila transcriptional regulation to immune cell lineage decisions. While ultimately these experiments could be conducted in genetically engineered primary cells, there are numerous in vitro systems in which immune cells can be induced to make lineage decisions. For example, the monocytic cell line THP-1 can be induced to differentiate into M1 or M2 macrophages by treatment with propidium monoazide (93). Within this system expression of lineage defining transcription factors, such as STAT1, 3 or 6, could be visualised (94). When the expression of these transcription factors is first detected the locus could be target locked and the relationship between transcription and single molecules of select regulatory factors could be examined. This could reveal how single molecules can regulate expression of these lineage defining transcription factors, and thus influence the fate of the immune lineage.
One obvious weakness of this methodology is the inability to visualise regulatory events prior to transcription initiation. Many of these events are likely just as lineage defining as those after transcription begins. As previously outlined, there are a number of technologies that allow visualisation of specific loci in cells (Box 8), however, none have yet been combined with live single molecule tracking of regulatory factors and transcription. Like so many recent molecular technologies one recent breakthrough in visualising loci in live cells utilises catalytically dead Cas9 (dCas9). As such, in a system known as Chimeric Array of gRNA Oligonucleotides (CARGO), numerous guide RNAs are introduced into the cell to guide fluorescently tagged dCas9 to a locus of interest (10) (Box 8). While the presence of dCas9 was shown not to dramatically impact local genome organisation (10), it is likely that dCas9 will obstruct other regulatory factors at sites of interest. Thus, other methods of visualising loci of interest prior to transcription will be required if the regulatory events prior to transcription are to be studied at the nanoscale.
While there is still work to be done, recent developments in super resolution imaging have revealed the behaviours of lineage defining molecules, be it transcriptional regulators or genomic loci, in almost unimaginable detail. If, or perhaps when, they are ultimately applied to immune cells, these single molecule scale technologies will provide an unprecedented view of entire antigen receptor gene loci and potentially allow us to watch as a single transcriptional regulator changes the fate of an entire lineage.
Conclusion
In the two decades since the invention of laser-based super resolution imaging, scientists have used these technologies to continue the long tradition of using microscopy to understand the immune system.
However, while impactful, all of these discoveries have been made using in vitro systems. This is because in vivo super resolution technologies still face major technological hurdles. The solution will likely come by emulating current high-resolution in vivo imaging systems. These high-resolution systems, such as confocal microscopy, have used surgically implanted windows (95, 96) or simply exteriorized, though still living, organs and tissues in reveal important insights into immune cells in vivo. Among many insights, high-resolution imaging has revealed distinct waves of cancer-induced immune cell infiltrates (97) and the role of neutrophils (98, 99), macrophages (100) and dendritic cells (101) in combatting, but also at times inadvertently aiding, cancer progression. Furthermore, the speed of high-resolution imaging technologies has allowed the imaging of interactions between immune cell types in real time. For example, using intravital microscopy in exteriorized lymph nodes of anesthetized mice, Mempel et al. tracked how cytotoxic T cells interacted with antigen-presenting B cells in the presence or absence of regulatory T cells in real time (102). Other examples include interactions between NK cells and dendritic cells (103), macrophages and dendritic cells (104), macrophages and cytotoxic T cells (105), among many others (106).
Finally, and perhaps most clinically relevant, high-resolution in vivo imaging has allowed tracking of the immune cell response to drug treatment. For example, Hawkins et al. imaged the retraction of T cell leukaemia in the calvarium of the mouse skull upon dexamethasone treatment (95), while Lohela et al. imaged the reduction in macrophages and dendritic cells in the mouse mammary gland during anti-colony stimulating factor 1 treatment (107).
Expanding these types of studies to super-resolution imaging has significant further challenges. These include scattering of structured light by dynamic tissues (108) to balancing excitation power to detect nanoscale structures while avoiding lethal phototoxicity. However, new technologies continue to push these boundaries (80, 81), often by combining the strengths of existing systems, such as lattice light sheet microscopy and adaptive optics (109). Currently the financial and technical thresholds of these technologies mean they are not widely available; however, excitingly, it is likely that immunologists will soon be able to use these and other, as yet unimagined, technologies to explore nanoscale structures within living tissues. Thus, the future of super resolution imaging is bright and will continue to shed (structured) light on molecular immunology well into the future.
Author Contributions
TJ, CK and RA wrote the manuscript. All authors contributed to the article and approved the submitted version.
Funding
This work was supported by grants and fellowships from the National Health and Medical Research Council of Australia (TJ #1124081, RA and TJ #1049307, #1100451, CK #1125436). This study was made possible through Victorian State Government Operational Infrastructure Support and Australian Government NHMRC Independent Research Institute Infrastructure Support scheme. The funders had no role in the decision to publish or preparation of the manuscript.
Conflict of Interest
The authors declare that the research was conducted in the absence of any commercial or financial relationships that could be construed as a potential conflict of interest.
Publisher’s Note
All claims expressed in this article are solely those of the authors and do not necessarily represent those of their affiliated organizations, or those of the publisher, the editors and the reviewers. Any product that may be evaluated in this article, or claim that may be made by its manufacturer, is not guaranteed or endorsed by the publisher.
References
3. Senac JB. D. Traite De La Structure Du Coeur, De Son Action, Et De Ses Maladies. France: Jacque Vincent (1749).
4. Waller A. Microscopic Observations on the Perforation of the Capillaries by the Corpuscles of the Blood, and Oil - the Origin of Mucus and Pus-Globules. London Edinburgh Phil Mag J Sci (1847) 29:397–405. doi: 10.1080/14786444608645527
5. Gustafsson MGL. Surpassing the Lateral Resolution Limit by a Factor of Two Using Structured Illumination Microscopy. J Microscopy (2000) 198:82–7. doi: 10.1046/j.1365-2818.2000.00710.x
6. Klar TA, Jakobs S, Dyba M, Egner A, Hell SW. Fluorescence Microscopy With Diffraction Resolution Barrier Broken by Stimulated Emission. Proc Natl Acad Sci (2000) 97:8206–10. doi: 10.1073/pnas.97.15.8206
7. Hawkins ED. Advanced Microscopy and Imaging Techniques in Immunology and Cell Biology. Immunol Cell Biol (2017) 95:499–500. doi: 10.1038/icb.2017.34
8. Xiao L, Guo J. Multiplexed Single-Cell in Situ RNA Analysis by Reiterative Hybridization. Analytical Methods (2015) 7:7290–5. doi: 10.1039/C5AY00500K
9. Chen KH, Boettiger AN, Moffitt JR, Wang S, Zhuang X. RNA Imaging. Spatially Resolved, Highly Multiplexed RNA Profiling in Single Cells. Science (2015) 348:aaa6090. doi: 10.1126/science.aaa6090
10. Gu B, Swigut T, Spencley A, Bauer MR, Chung M, Meyer T, et al. Transcription-Coupled Changes in Nuclear Mobility of Mammalian Cis-Regulatory Elements. Science (2018) 359:1050–5. doi: 10.1126/science.aao3136
11. Miller H, Cosgrove J, Wollman AJM, Taylor E, Zhou Z, O'Toole PJ, et al. High-Speed Single-Molecule Tracking of CXCL13 in the B-Follicle. Front Immunol (2018) 9:1073. doi: 10.3389/fimmu.2018.01073
12. Ritter AT, Kapnick SM, Murugesan S, Schwartzberg PL, Griffiths GM, Lippincott-Schwartz J. Cortical Actin Recovery at the Immunological Synapse Leads to Termination of Lytic Granule Secretion in Cytotoxic T Lymphocytes. Proc Natl Acad Sci USA (2017) 114:E6585–94. doi: 10.1073/pnas.1710751114
13. Kieffer-Kwon KR, Nimura K, Rao SSP, Xu J, Jung S, Pekowska A, et al. Myc Regulates Chromatin Decompaction and Nuclear Architecture During B Cell Activation. Mol Cell (2017) 67:566–78.e510. doi: 10.1016/j.molcel.2017.07.013
14. Mosser DM, Edwards JP. Exploring the Full Spectrum of Macrophage Activation. Nat Rev Immunol (2008) 8:958–69. doi: 10.1038/nri2448
15. Pierce SK, Liu W. The Tipping Points in the Initiation of B Cell Signalling: How Small Changes Make Big Differences. Nat Rev Immunol (2010) 10:767–77. doi: 10.1038/nri2853
16. Abbas AK, Ault KA, Karnovsky MJ, Unanue ER. Non-Random Distribution of Surface Immunoglobulins on Murine B Lymphocytes. J Immunol (1975) 114:1197–204.
17. Betzig E, Patterson GH, Sougrat R, Lindwasser OW, Olenych S, Bonifacino JS, et al. Imaging Intracellular Fluorescent Proteins at Nanometer Resolution. Science (2006) 313:1642–5. doi: 10.1126/science.1127344
18. van Zanten TS, Cambi A, Garcia-Parajo MF. A Nanometer Scale Optical View on the Compartmentalization of Cell Membranes. Biochim Biophys Acta (2010) 1798:777–87. doi: 10.1016/j.bbamem.2009.09.012
19. Stone MB, Shelby SA, Veatch SL. Super-Resolution Microscopy: Shedding Light on the Cellular Plasma Membrane. Chem Rev (2017) 117:7457–77. doi: 10.1021/acs.chemrev.6b00716
20. Rust MJ, Bates M, Zhuang X. Sub-Diffraction-Limit Imaging by Stochastic Optical Reconstruction Microscopy (STORM). Nat Methods (2006) 3:793–5. doi: 10.1038/nmeth929
21. Lillemeier BF, Pfeiffer JR, Surviladze Z, Wilson BS, Davis MM. Plasma Membrane-Associated Proteins Are Clustered Into Islands Attached to the Cytoskeleton. Proc Natl Acad Sci USA (2006) 103:18992–7. doi: 10.1073/pnas.0609009103
22. Carr AR, Ponjavic A, Basu S, McColl J, Santos AM, Davis S, et al. Three-Dimensional Super-Resolution in Eukaryotic Cells Using the Double-Helix Point Spread Function. Biophys J (2017) 112:1444–54. doi: 10.1016/j.bpj.2017.02.023
23. Hu YS, Cang H, Lillemeier BF. Superresolution Imaging Reveals Nanometer- and Micrometer-Scale Spatial Distributions of T-Cell Receptors in Lymph Nodes. Proc Natl Acad Sci (2016) 113:7201–6. doi: 10.1073/pnas.1512331113
24. Rossy J, Owen DM, Williamson DJ, Yang Z, Gaus K. Conformational States of the Kinase Lck Regulate Clustering in Early T Cell Signaling. Nat Immunol (2013) 14:82–9. doi: 10.1038/ni.2488
25. Roh KH, Lillemeier BF, Wang F, Davis MM. The Coreceptor CD4 Is Expressed in Distinct Nanoclusters and Does Not Colocalize With T-Cell Receptor and Active Protein Tyrosine Kinase P56lck. Proc Natl Acad Sci USA (2015) 112:E1604–13. doi: 10.1073/pnas.1503532112
26. Lukes T, Glatzova D, Kvicalova Z, Levet F, Benda A, Letschert S, et al. Quantifying Protein Densities on Cell Membranes Using Super-Resolution Optical Fluctuation Imaging. Nat Commun (2017) 8:1731. doi: 10.1038/s41467-017-01857-x
27. Mattila PK, Feest C, Depoil D, Treanor B, Montaner B, Otipoby KL, et al. The Actin and Tetraspanin Networks Organize Receptor Nanoclusters to Regulate B Cell Receptor-Mediated Signaling. Immunity (2013) 38:461–74. doi: 10.1016/j.immuni.2012.11.019
28. Maity PC, Blount A, Jumaa H, Ronneberger O, Lillemeier BF, Reth M. B Cell Antigen Receptors of the IgM and IgD Classes Are Clustered in Different Protein Islands That Are Altered During B Cell Activation. Sci Signal (2015) 8:ra93. doi: 10.1126/scisignal.2005887
29. Lee J, Sengupta P, Brzostowski J, Lippincott-Schwartz J, Pierce SK. The Nanoscale Spatial Organization of B-Cell Receptors on Immunoglobulin M- and G-Expressing Human B-Cells. Mol Biol Cell (2017) 28:511–23. doi: 10.1091/mbc.E16-06-0452
30. Shelby SA, Holowka D, Baird B, Veatch SL. Distinct Stages of Stimulated FcepsilonRI Receptor Clustering and Immobilization Are Identified Through Superresolution Imaging. Biophys J (2013) 105:2343–54. doi: 10.1016/j.bpj.2013.09.049
31. Aaron JS, Carson BD, Timlin JA. Characterization of Differential Toll-Like Receptor Responses Below the Optical Diffraction Limit. Small (2012) 8:3041–9. doi: 10.1002/smll.201200106
32. Kruger CL, Zeuner MT, Cottrell GS, Widera D, Heilemann M. Quantitative Single-Molecule Imaging of TLR4 Reveals Ligand-Specific Receptor Dimerization. Sci Signal (2017) 10. doi: 10.1126/scisignal.aan1308
33. Neumann J, Ziegler K, Gelleri M, Frohlich-Nowoisky J, Liu F, Bellinghausen I, et al. Nanoscale Distribution of TLR4 on Primary Human Macrophages Stimulated With LPS and ATI. Nanoscale (2019) 11:9769–79. doi: 10.1039/c9nr00943d
34. Lopes FB, Balint S, Valvo S, Felce JH, Hessel EM, Dustin ML, et al. Membrane Nanoclusters of FcgammaRI Segregate From Inhibitory SIRPalpha Upon Activation of Human Macrophages. J Cell Biol (2017) 216:1123–41. doi: 10.1083/jcb.201608094
35. Fan Z, McArdle S, Marki A, Mikulski Z, Gutierrez E, Engelhardt B, et al. Neutrophil Recruitment Limited by High-Affinity Bent Beta2 Integrin Binding Ligand in Cis. Nat Commun (2016) 7:12658. doi: 10.1038/ncomms12658
36. Balint S, Lopes FB, Davis DM. A Nanoscale Reorganization of the IL-15 Receptor Is Triggered by NKG2D in a Ligand-Dependent Manner. Sci Signal (2018) 11. doi: 10.1126/scisignal.aal3606
37. Lakowicz JR, Szmacinski H, Nowaczyk K, Berndt KW, Johnson M. Fluorescence Lifetime Imaging. Anal Biochem (1992) 202:316–30. doi: 10.1016/0003-2697(92)90112-k
38. Ma Y, Pandzic E, Nicovich PR, Yamamoto Y, Kwiatek J, Pageon SV, et al. An Intermolecular FRET Sensor Detects the Dynamics of T Cell Receptor Clustering. Nat Commun (2017) 8:15100. doi: 10.1038/ncomms15100
39. Sherman E, Barr V, Manley S, Patterson G, Balagopalan L, Akpan I, et al. Functional Nanoscale Organization of Signaling Molecules Downstream of the T Cell Antigen Receptor. Immunity (2011) 35:705–20. doi: 10.1016/j.immuni.2011.10.004
40. Klasener K, Maity PC, Hobeika E, Yang J, Reth M. B Cell Activation Involves Nanoscale Receptor Reorganizations and Inside-Out Signaling by Syk. Elife (2014) 3:e02069. doi: 10.7554/eLife.02069
41. Stone MB, Shelby SA, Nunez MF, Wisser K, Veatch SL. Protein Sorting by Lipid Phase-Like Domains Supports Emergent Signaling Function in B Lymphocyte Plasma Membranes. Elife (2017) 6. doi: 10.7554/eLife.19891
42. Avalos AM, Bilate AM, Witte MD, Tai AK, He J, Frushicheva MP, et al. Monovalent Engagement of the BCR Activates Ovalbumin-Specific Transnuclear B Cells. J Exp Med (2014) 211:365–79. doi: 10.1084/jem.20131603
43. Volkmann C, Brings N, Becker M, Hobeika E, Yang J, Reth M. Molecular Requirements of the B-Cell Antigen Receptor for Sensing Monovalent Antigens. EMBO J (2016) 35:2371–81. doi: 10.15252/embj.201694177
44. Kusumi A, Ike H, Nakada C, Murase K, Fujiwara T. Single-Molecule Tracking of Membrane Molecules: Plasma Membrane Compartmentalization and Dynamic Assembly of Raft-Philic Signaling Molecules. Semin Immunol (2005) 17:3–21. doi: 10.1016/j.smim.2004.09.004
45. Gowrishankar K, Ghosh S, Saha S, Mayor S, Rao M. Active Remodeling of Cortical Actin Regulates Spatiotemporal Organization of Cell Surface Molecules. Cell (2012) 149:1353–67. doi: 10.1016/j.cell.2012.05.008
46. Treanor B, Depoil D, Gonzalez-Granja A, Barral P, Weber M, Dushek O, et al. The Membrane Skeleton Controls Diffusion Dynamics and Signaling Through the B Cell Receptor. Immunity (2010) 32:187–99. doi: 10.1016/j.immuni.2009.12.005
47. Freeman SA, Jaumouille V, Choi K, Hsu BE, Wong HS, Abraham L, et al. Toll-Like Receptor Ligands Sensitize B-Cell Receptor Signalling by Reducing Actin-Dependent Spatial Confinement of the Receptor. Nat Commun (2015) 6:6168. doi: 10.1038/ncomms7168
48. Hammer JA, Wang JC, Saeed M, Pedrosa AT. Origin, Organization, Dynamics, and Function of Actin and Actomyosin Networks at the T Cell Immunological Synapse. Annu Rev Immunol (2019) 37:201–24. doi: 10.1146/annurev-immunol-042718-041341
49. Jang JH, Huang Y, Zheng P, Jo MC, Bertolet G, Zhu MX, et al. Imaging of Cell-Cell Communication in a Vertical Orientation Reveals High-Resolution Structure of Immunological Synapse and Novel PD-1 Dynamics. J Immunol (2015) 195:1320–30. doi: 10.4049/jimmunol.1403143
50. Rak GD, Mace EM, Banerjee PP, Svitkina T, Orange JS. Natural Killer Cell Lytic Granule Secretion Occurs Through a Pervasive Actin Network at the Immune Synapse. PloS Biol (2011) 9:e1001151. doi: 10.1371/journal.pbio.1001151
51. Fritzsche M, Fernandes RA, Chang VT, Colin-York H, Clausen MP, Felce JH, et al. Cytoskeletal Actin Dynamics Shape a Ramifying Actin Network Underpinning Immunological Synapse Formation. Sci Adv (2017) 3:e1603032. doi: 10.1126/sciadv.1603032
52. Ambrose EJ. A Surface Contact Microscope for the Study of Cell Movements. Nature (1956) 178:1194. doi: 10.1038/1781194a0
53. Ashdown GW, Burn GL, Williamson DJ, Pandzic E, Peters R, Holden M, et al. Live-Cell Super-Resolution Reveals F-Actin and Plasma Membrane Dynamics at the T Cell Synapse. Biophys J (2017) 112:1703–13. doi: 10.1016/j.bpj.2017.01.038
54. Carisey AF, Mace EM, Saeed MB, Davis DM, Orange JS. Nanoscale Dynamism of Actin Enables Secretory Function in Cytolytic Cells. Curr Biol (2018) 28:489–502.e489. doi: 10.1016/j.cub.2017.12.044
55. Chen BC, Legant WR, Wang K, Shao L, Milkie DE, Davidson MW, et al. Lattice Light-Sheet Microscopy: Imaging Molecules to Embryos at High Spatiotemporal Resolution. Science (2014) 346:1257998. doi: 10.1126/science.1257998
56. Ritter AT, Asano Y, Stinchcombe JC, Dieckmann NM, Chen BC, Gawden-Bone C, et al. Actin Depletion Initiates Events Leading to Granule Secretion at the Immunological Synapse. Immunity (2015) 42:864–76. doi: 10.1016/j.immuni.2015.04.013
57. Brown AC, Oddos S, Dobbie IM, Alakoskela JM, Parton RM, Eissmann P, et al. Remodelling of Cortical Actin Where Lytic Granules Dock at Natural Killer Cell Immune Synapses Revealed by Super-Resolution Microscopy. PloS Biol (2011) 9:e1001152. doi: 10.1371/journal.pbio.1001152
58. Hsu HT, Mace EM, Carisey AF, Viswanath DI, Christakou AE, Wiklund M, et al. NK Cells Converge Lytic Granules to Promote Cytotoxicity and Prevent Bystander Killing. J Cell Biol (2016) 215:875–89. doi: 10.1083/jcb.201604136
59. Bhat R, Watzl C. Serial Killing of Tumor Cells by Human Natural Killer Cells–Enhancement by Therapeutic Antibodies. PloS One (2007) 2:e326. doi: 10.1371/journal.pone.0000326
60. Ming M, Schirra C, Becherer U, Stevens DR, Rettig J. Behavior and Properties of Mature Lytic Granules at the Immunological Synapse of Human Cytotoxic T Lymphocytes. PloS One (2015) 10:e0135994. doi: 10.1371/journal.pone.0135994
61. Gwalani LA, Orange JS. Single Degranulations in NK Cells Can Mediate Target Cell Killing. J Immunol (2018) 200:3231–43. doi: 10.4049/jimmunol.1701500
62. Pogo BG, Allfrey VG, Mirsky AE. RNA Synthesis and Histone Acetylation During the Course of Gene Activation in Lymphocytes. Proc Natl Acad Sci USA (1966) 55:805–12. doi: 10.1073/pnas.55.4.805
63. Fowler T, Garruss AS, Ghosh A, De S, Becker KG, Wood WH, et al. Divergence of Transcriptional Landscape Occurs Early in B Cell Activation. Epigenet Chromatin (2015) 8:20. doi: 10.1186/s13072-015-0012-x
64. Zhang Y, Fear DJ, Willis-Owen SA, Cookson WO, Moffatt MF. Global Gene Regulation During Activation of Immunoglobulin Class Switching in Human B Cells. Sci Rep (2016) 6:37988. doi: 10.1038/srep37988
65. Morrish RB, Hermes M, Metz J, Stone N, Pagliara S, Chahwan R, et al. Single Cell Imaging of Nuclear Architecture Changes. Front Cell Dev Biol (2019) 7:141. doi: 10.3389/fcell.2019.00141
66. Axelrod D, Koppel DE, Schlessinger J, Elson E, Webb WW. Mobility Measurement by Analysis of Fluorescence Photobleaching Recovery Kinetics. Biophys J (1976) 16:1055–69. doi: 10.1016/S0006-3495(76)85755-4
67. Fuxa M, Skok J, Souabni A, Salvagiotto G, Roldan E, Busslinger M. Pax5 Induces V-To-DJ Rearrangements and Locus Contraction of the Immunoglobulin Heavy-Chain Gene. Genes Dev (2004) 18:411–22. doi: 10.1101/gad.291504
68. Kosak ST, Skok JA, Medina KL, Riblet R, Le Beau MM, Fisher AG, et al. Subnuclear Compartmentalization of Immunoglobulin Loci During Lymphocyte Development. Science (2002) 296:158–62. doi: 10.1126/science.1068768
69. Johanson TM, Chan WF, Keenan CR, Allan RS. Genome Organization in Immune Cells: Unique Challenges. Nat Rev Immunol (2019) 19:448–56. doi: 10.1038/s41577-019-0155-2
70. Roldan E, Fuxa M, Chong W, Martinez D, Novatchkova M, Busslinger M, et al. Locus 'Decontraction' and Centromeric Recruitment Contribute to Allelic Exclusion of the Immunoglobulin Heavy-Chain Gene. Nat Immunol (2005) 6:31–41. doi: 10.1038/ni1150
71. Sayegh CE, Jhunjhunwala S, Riblet R, Murre C. Visualization of Looping Involving the Immunoglobulin Heavy-Chain Locus in Developing B Cells. Genes Dev (2005) 19:322–7. doi: 10.1101/gad.1254305
72. Skok JA, Gisler R, Novatchkova M, Farmer D, de Laat W, Busslinger M. Reversible Contraction by Looping of the Tcra and Tcrb Loci in Rearranging Thymocytes. Nat Immunol (2007) 8:378–87. doi: 10.1038/ni1448
73. Lutz E. Fractional Langevin Equation. Phys Rev E (2001) 64:51106. doi: 10.1103/PhysRevE.64.051106
74. Jain S, Ba Z, Zhang Y, Dai HQ, Alt FW. CTCF-Binding Elements Mediate Accessibility of RAG Substrates During Chromatin Scanning. Cell (2018) 174:102–116 e114. doi: 10.1016/j.cell.2018.04.035
75. Lucas JS, Zhang Y, Dudko OK, Murre C. 3D Trajectories Adopted by Coding and Regulatory DNA Elements: First-Passage Times for Genomic Interactions. Cell (2014) 158:339–52. doi: 10.1016/j.cell.2014.05.036
76. Weiss LE, Naor T, Shechtman Y. Observing DNA in Live Cells. Biochem Soc Trans (2018) 46:729–40. doi: 10.1042/BST20170301
77. Bauman JG, Wiegant J, Borst P, van Duijn P. A New Method for Fluorescence Microscopical Localization of Specific DNA Sequences by in Situ Hybridization of Fluorochromelabelled RNA. Exp Cell Res (1980) 128:485–90. doi: 10.1016/0014-4827(80)90087-7
78. Specht EA, Braselmann E, Palmer AE. A Critical and Comparative Review of Fluorescent Tools for Live-Cell Imaging. Annu Rev Physiol (2017) 79:93–117. doi: 10.1146/annurev-physiol-022516-034055
79. Langer-Safer PR, Levine M, Ward DC. Immunological Method for Mapping Genes on Drosophila Polytene Chromosomes. Proc Natl Acad Sci USA (1982) 79:4381–5. doi: 10.1073/pnas.79.14.4381
80. Mateo LJ, Murphy SE, Hafner A, Cinquini IS, Walker CA, Boettiger AN. Visualizing DNA Folding and RNA in Embryos at Single-Cell Resolution. Nature (2019) 568:49–54. doi: 10.1038/s41586-019-1035-4
81. Cardozo Gizzi AM, Cattoni DI, Fiche JB, Espinola SM, Gurgo J, Messina O, et al. Microscopy-Based Chromosome Conformation Capture Enables Simultaneous Visualization of Genome Organization and Transcription in Intact Organisms. Mol Cell (2019) 74:212–22.e215. doi: 10.1016/j.molcel.2019.01.011
82. Chen B, Gilbert LA, Cimini BA, Schnitzbauer J, Zhang W, Li GW, et al. Dynamic Imaging of Genomic Loci in Living Human Cells by an Optimized CRISPR/Cas System. Cell (2013) 155:1479–91. doi: 10.1016/j.cell.2013.12.001
83. Nir G, Farabella I, Perez Estrada C, Ebeling CG, Beliveau BJ, Sasaki HM, et al. Walking Along Chromosomes With Super-Resolution Imaging, Contact Maps, and Integrative Modeling. PloS Genet (2018) 14:e1007872. doi: 10.1371/journal.pgen.1007872
84. Bintu B, Mateo LJ, Su JH, Sinnott-Armstrong NA, Parker M, Kinrot S, et al. Super-Resolution Chromatin Tracing Reveals Domains and Cooperative Interactions in Single Cells. Science (2018) 362(6413):eaau1783. doi: 10.1126/science.aau1783
85. Wang S, Su JH, Beliveau BJ, Bintu B, Moffitt JR, Wu CT, et al. Spatial Organization of Chromatin Domains and Compartments in Single Chromosomes. Science (2016) 353:598–602. doi: 10.1126/science.aaf8084
86. Proudhon C, Hao B, Raviram R, Chaumeil J, Skok JA. Long-Range Regulation of V(D)J Recombination. Adv Immunol (2015) 128:123–82. doi: 10.1016/bs.ai.2015.07.003
87. Finn EH, Pegoraro G, Brandao HB, Valton AL, Oomen ME, Dekker J, et al. Extensive Heterogeneity and Intrinsic Variation in Spatial Genome Organization. Cell (2019) 176:1502–15.e1510. doi: 10.1016/j.cell.2019.01.020
88. Brown G, Ceredig R. Cell Lineage Choice During Haematopoiesis: A Commemorative Issue in Honor of Professor Antonius Rolink. MDPI AG (2018).
89. Stadhouders R, Filion GJ, Graf T. Transcription Factors and 3D Genome Conformation in Cell-Fate Decisions. Nature (2019) 569:345–54. doi: 10.1038/s41586-019-1182-7
90. Rothenberg EV. The Chromatin Landscape and Transcription Factors in T Cell Programming. Trends Immunol (2014) 35:195–204. doi: 10.1016/j.it.2014.03.001
91. Nutt SL, Taubenheim N, Hasbold J, Corcoran LM, Hodgkin PD. The Genetic Network Controlling Plasma Cell Differentiation. Semin Immunol (2011) 23:341–9. doi: 10.1016/j.smim.2011.08.010
92. Li J, Dong A, Saydaminova K, Chang H, Wang G, Ochiai H, et al. Single-Molecule Nanoscopy Elucidates RNA Polymerase II Transcription at Single Genes in Live Cells. Cell (2019) 178:491–506.e428. doi: 10.1016/j.cell.2019.05.029
93. Gatto F, Cagliani R, Catelani T, Guarnieri D, Moglianetti M, Pompa PP, et al. PMA-Induced THP-1 Macrophage Differentiation Is Not Impaired by Citrate-Coated Platinum Nanoparticles. Nanomaterials (Basel) (2017) 7(10):332. doi: 10.3390/nano7100332
94. Li H, Jiang T, Li MQ, Zheng XL, Zhao GJ. Transcriptional Regulation of Macrophages Polarization by MicroRNAs. Front Immunol (2018) 9:1175. doi: 10.3389/fimmu.2018.01175
95. Hawkins ED, Duarte D, Akinduro O, Khorshed RA, Passaro D, Nowicka M, et al. T-Cell Acute Leukaemia Exhibits Dynamic Interactions With Bone Marrow Microenvironments. Nature (2016) 538:518–22. doi: 10.1038/nature19801
96. Schietinger A, Arina A, Liu RB, Wells S, Huang J, Engels B, et al. Longitudinal Confocal Microscopy Imaging of Solid Tumor Destruction Following Adoptive T Cell Transfer. Oncoimmunology (2013) 2:e26677. doi: 10.4161/onci.26677
97. Headley MB, Bins A, Nip A, Roberts EW, Looney MR, Gerard A, et al. Visualization of Immediate Immune Responses to Pioneer Metastatic Cells in the Lung. Nature (2016) 531:513–7. doi: 10.1038/nature16985
98. Cools-Lartigue J, Spicer J, McDonald B, Gowing S, Chow S, Giannias B, et al. Neutrophil Extracellular Traps Sequester Circulating Tumor Cells and Promote Metastasis. J Clin Invest (2013) 123(8):3446–58. doi: 10.1172/JCI67484
99. Spicer JD, McDonald B, Cools-Lartigue JJ, Chow SC, Giannias B, Kubes P, et al. Neutrophils Promote Liver Metastasis via Mac-1-Mediated Interactions With Circulating Tumor Cells. Cancer Res (2012) 72:3919–27. doi: 10.1158/0008-5472.CAN-11-2393
100. Harney AS, Arwert EN, Entenberg D, Wang Y, Guo P, Qian BZ, et al. Real-Time Imaging Reveals Local, Transient Vascular Permeability, and Tumor Cell Intravasation Stimulated by TIE2hi Macrophage-Derived VEGFA. Cancer Discov (2015) 5:932–43. doi: 10.1158/2159-8290.CD-15-0012
101. Roberts EW, Broz ML, Binnewies M, Headley MB, Nelson AE, Wolf DM, et al. Critical Role for CD103(+)/CD141(+) Dendritic Cells Bearing CCR7 for Tumor Antigen Trafficking and Priming of T Cell Immunity in Melanoma. Cancer Cell (2016) 30:324–36. doi: 10.1016/j.ccell.2016.06.003
102. Mempel TR, Pittet MJ, Khazaie K, Weninger W, Weissleder R, von Boehmer H, et al. Regulatory T Cells Reversibly Suppress Cytotoxic T Cell Function Independent of Effector Differentiation. Immunity (2006) 25:129–41. doi: 10.1016/j.immuni.2006.04.015
103. Mingozzi F, Spreafico R, Gorletta T, Cigni C, Di Gioia M, Caccia M, et al. Prolonged Contact With Dendritic Cells Turns Lymph Node-Resident NK Cells Into Anti-Tumor Effectors. EMBO Mol Med (2016) 8:1039–51. doi: 10.15252/emmm.201506164
104. Moalli F, Proulx ST, Schwendener R, Detmar M, Schlapbach C, Stein JV. Intravital and Whole-Organ Imaging Reveals Capture of Melanoma-Derived Antigen by Lymph Node Subcapsular Macrophages Leading to Widespread Deposition on Follicular Dendritic Cells. Front Immunol (2015) 6:114. doi: 10.3389/fimmu.2015.00114
105. Mrass P, Takano H, Ng LG, Daxini S, Lasaro MO, Iparraguirre A, et al. Random Migration Precedes Stable Target Cell Interactions of Tumor-Infiltrating T Cells. J Exp Med (2006) 203:2749–61. doi: 10.1084/jem.20060710
106. Torcellan T, Stolp J, Chtanova T. Imaging Sheds Light on Immune Cell Migration and Function in Cancer. Front Immunol (2017) 8:309. doi: 10.3389/fimmu.2017.00309
107. Lohela M, Casbon AJ, Olow A, Bonham L, Branstetter D, Weng N, et al. Intravital Imaging Reveals Distinct Responses of Depleting Dynamic Tumor-Associated Macrophage and Dendritic Cell Subpopulations. Proc Natl Acad Sci USA (2014) 111:E5086–95. doi: 10.1073/pnas.1419899111
108. Vicidomini G, Bianchini P, Diaspro A. STED Super-Resolved Microscopy. Nat Methods (2018) 15:173–82. doi: 10.1038/nmeth.4593
Keywords: super resolution microscopy, immune cells, immune cell activation, recombination, single molecule microscopy
Citation: Johanson TM, Keenan CR and Allan RS (2021) Shedding Structured Light on Molecular Immunity: The Past, Present and Future of Immune Cell Super Resolution Microscopy. Front. Immunol. 12:754200. doi: 10.3389/fimmu.2021.754200
Received: 06 August 2021; Accepted: 23 November 2021;
Published: 15 December 2021.
Edited by:
Greetje Vande Velde, KU Leuven, BelgiumCopyright © 2021 Johanson, Keenan and Allan. This is an open-access article distributed under the terms of the Creative Commons Attribution License (CC BY). The use, distribution or reproduction in other forums is permitted, provided the original author(s) and the copyright owner(s) are credited and that the original publication in this journal is cited, in accordance with accepted academic practice. No use, distribution or reproduction is permitted which does not comply with these terms.
*Correspondence: Timothy M. Johanson, am9oYW5zb25Ad2VoaS5lZHUuYXU=