 Duncan Kirby1Baljyot Parmar1Sepehr Fathi1Sagar Marwah2Chitra R. Nayak1,3†Vera Cherepanov4Sonya MacParland2Jordan J. Feld5Grégoire Altan-Bonnet6Anton Zilman1,7*
- 1Department of Physics, University of Toronto, Toronto, ON, Canada
- 2Ajmera Family Transplant Centre, Toronto General Research Institute, Departments of Laboratory Medicine and Pathobiology and Immunology, University of Toronto, Toronto, ON, Canada
- 3Department of Physics, Tuskegee University, Tuskegee, AL, United States
- 4Sandra Rotman Centre for Global Health, Toronto General Research Institute, University of Toronto, Toronto, ON, Canada
- 5Toronto Centre for Liver Disease, University Health Network, Toronto, ON, Canada
- 6Immunodynamics Group, Laboratory of Integrative Cancer Immunology, Center for Cancer Research (CCR), National Cancer Institute (NCI), Bethesda, MD, United States
- 7Institute for Biomedical Engineering, University of Toronto, Toronto, ON, Canada
The Type I Interferon family of cytokines all act through the same cell surface receptor and induce phosphorylation of the same subset of response regulators of the STAT family. Despite their shared receptor, different Type I Interferons have different functions during immune response to infection. In particular, they differ in the potency of their induced anti-viral and anti-proliferative responses in target cells. It remains not fully understood how these functional differences can arise in a ligand-specific manner both at the level of STAT phosphorylation and the downstream function. We use a minimal computational model of Type I Interferon signaling, focusing on Interferon-α and Interferon-β. We validate the model with quantitative experimental data to identify the key determinants of specificity and functional plasticity in Type I Interferon signaling. We investigate different mechanisms of signal discrimination, and how multiple system components such as binding affinity, receptor expression levels and their variability, receptor internalization, short-term negative feedback by SOCS1 protein, and differential receptor expression play together to ensure ligand specificity on the level of STAT phosphorylation. Based on these results, we propose phenomenological functional mappings from STAT activation to downstream anti-viral and anti-proliferative activity to investigate differential signal processing steps downstream of STAT phosphorylation. We find that the negative feedback by the protein USP18, which enhances differences in signaling between Interferons via ligand-dependent refractoriness, can give rise to functional plasticity in Interferon-α and Interferon-β signaling, and explore other factors that control functional plasticity. Beyond Type I Interferon signaling, our results have a broad applicability to questions of signaling specificity and functional plasticity in signaling systems with multiple ligands acting through a bottleneck of a small number of shared receptors.
Introduction
Specificity in molecular signaling networks is essential for cells to respond appropriately to changes in their environment. In one important example - an immune response to infection - signal specificity is crucial to ensure the correct cellular responses in immune and other cell types. In a common view of receptor signaling, specificity is encoded in the strength of ligand-receptor binding resulting from the details of molecular ligand-receptor interactions (1). A high affinity ligand typically produces a stronger response while a weak affinity ligand produces little response. In this picture of receptor signaling, each receptor binds its cognate ligand with a much higher affinity than any other ligand to produce an intracellular response uniquely specific to that receptor-ligand pair (2).
However, in many signaling pathways multiple ligands can act through overlapping sets of receptors or downstream intracellular signaling molecules, and yet induce distinct cellular responses. Overlapping components between signal pathways is known as crosstalk, and this feature has been observed in cytokine signaling through the Jak/STAT pathway, the TGF superfamily of ligands acting through the SMAD pathway, a variety of ligands acting through the NF-κB pathway, and others (3–8). These examples challenge the idea of specificity based purely on ligand-receptor binding pairs because the same level of receptor occupancy can be achieved by either a low concentration of a high affinity ligand or by a high concentration of a low affinity ligand (9). The ability of a signaling pathway to generate distinct cellular responses in the presence of crosstalk has been termed functional plasticity (10, 11). Crosstalk without distinct cellular responses generates redundancy between ligands, which may be useful for other reasons (12).
In this paper we focus on the following question: how can functional plasticity arise in systems where ligands act through the same receptor? This is an extreme form of crosstalk since ligands necessarily activate the same set of downstream intracellular molecules.
Examples of such crosstalk include biased agonism in G-protein coupled receptors, and chemokine and cytokine signaling in the immune system (8, 10, 13–15). We use the prototypical example of the Type I Interferon (IFN) family of cytokines to study ligand crosstalk through a shared receptor (Figure 1A) (16–18). Less extreme forms of cross-talk may be found, for example, in the partial overlap of types of STATs activated by other cytokines in Jak/STAT signaling (19, 20). In this work, we focus on the Type I IFN signaling because – beyond its fundamental biological importance – the bottleneck of completely overlapping receptors and proximal signaling factors activated by functionally distinct cytokines makes it a good system to study signal specificity.
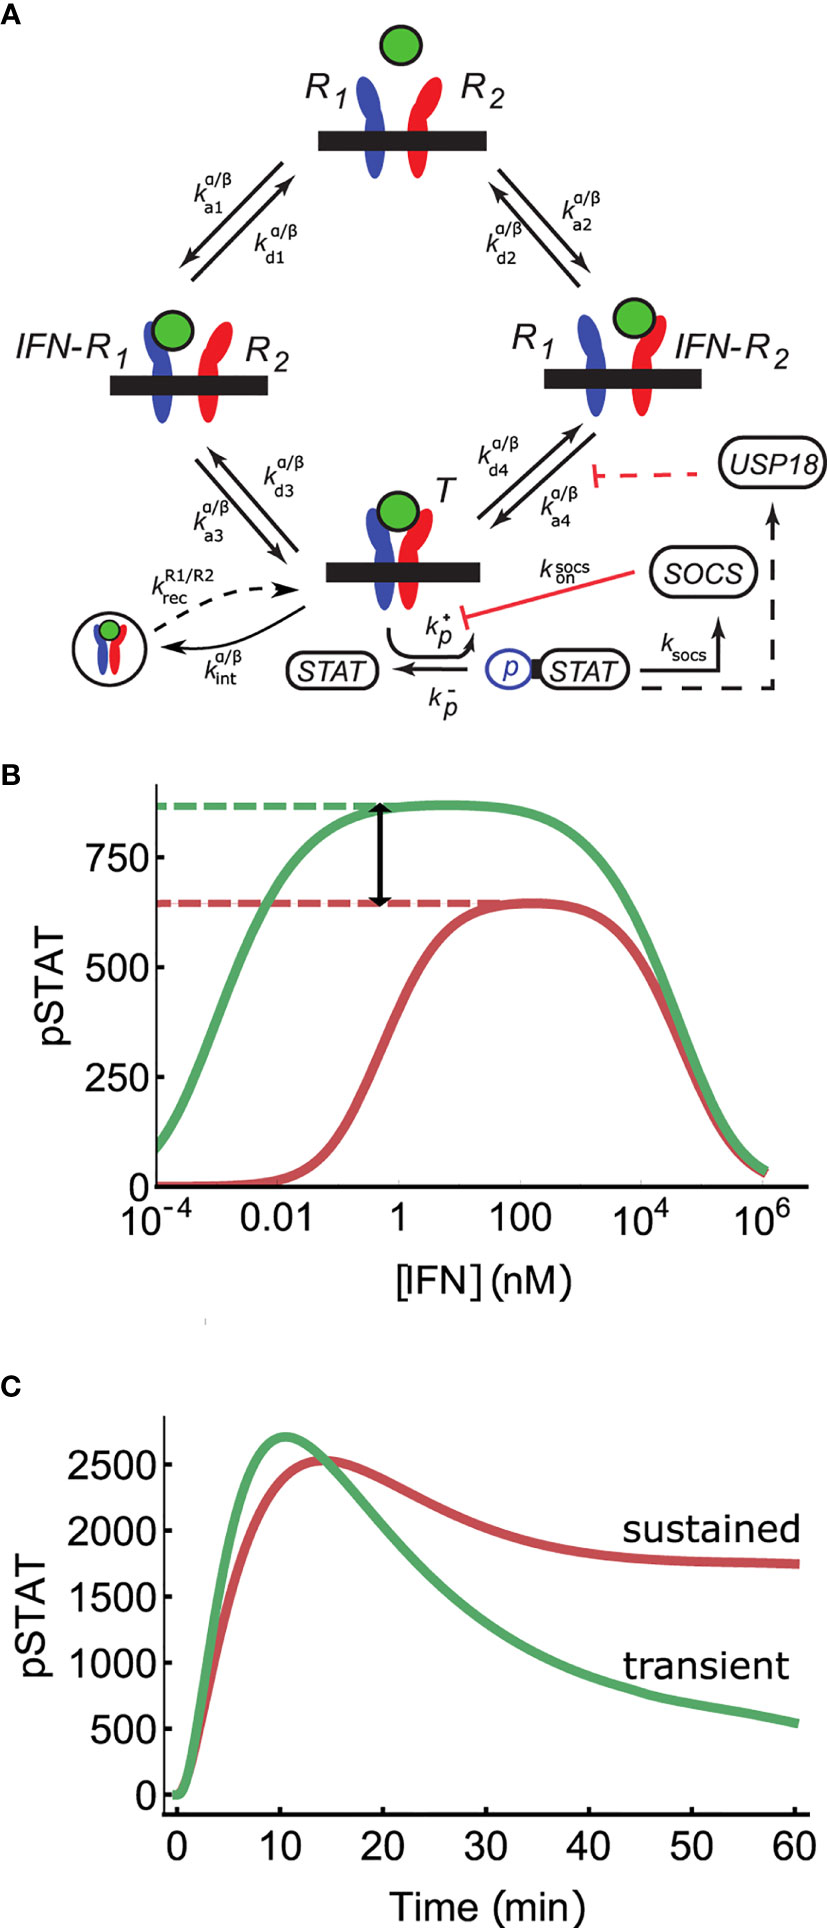
Figure 1 Mechanisms of signal discrimination. (A) Interferon induced receptor dimerization can occur via two paths. In the first, an IFN molecule (green circle) binds IFNAR1 (R1 in the diagram), and IFNAR2 subsequently associates with the binary IFN-R1 complex, leading to the formation of the ternary complex T. In the second pathway, the sequence of the association events is reversed. The multi-step process of STAT phosphorylation is combined into an aggregate rate kp, as are all steps leading to SOCS1 production in rate ksocs. SOCS1 binds to IFNAR1 independent of whether or not IFNAR1 is bound by IFN, and inhibits phosphorylation of STAT, with rate ksocs on. USP18 is modeled as pre-bound to IFNAR2 (i.e., before IFN stimulation) and reduces IFNAR1 recruitment into the ternary complex by increasing k-4 (see Long Time Deactivation via USP18 Regulates Receptor Complex Stability to Achieve Absolute Discrimination). (B) Absolute discrimination encodes signal identity through differences in the maximum response amplitude for weaker binding IFNα2 (red) compared to stronger binding IFNβ (green) even for saturating doses ([IFN] >Keff). Thus, if the pSTAT response is greater than this threshold (red dashed line) the signal is unambiguously identified as belonging to IFNβ. The region of absolute discrimination is indicated by black arrow. (C) Time course discrimination differentiates ligands based on, for example, sustained (red, IFNα2) versus transient (green, IFNβ) pSTAT levels.
Type I IFN signaling is an essential component of the early innate immune response to viral infections, and recently the IFN anti-viral response has received a great deal of attention due to its role during COVID-19 infection and other viral infections (21–26). IFN signaling is also important in other diseases including a number of cancers and multiple sclerosis (16, 27). Different IFNs are known to play different roles in the immune response to infection as well as in other diseases, and different IFN subtypes are targeted in clinical applications (8, 10, 28, 29). These many roles, and their varying significance among IFN subtypes, make Type I IFN signaling an important model to study crosstalk between functionally distinct ligands acting through the same receptor.
As a brief overview, the Type I IFN family of signaling molecules is composed of thirteen subtypes of IFN-α, IFN-β, IFN-ϵ, IFN-κ and IFN-ω (29). All these cytokines act through the same Type I IFN receptor and induce expression of Interferon Stimulated Genes (ISGs). These ISGs drive diverse functions, with anti-viral and anti-proliferative cellular assays traditionally being used to classify functional differences between ligands, although the phenotypes resulting from ISG induction are diverse and the division of ISGs into these classes is not strictly binary (30–32).
The Type I IFN receptor is composed of two subunits, IFNAR1 and IFNAR2 (17) (see Figure 1A). The cytoplasmic domain of IFNAR2 is constitutively bound by the tyrosine kinase Jak1, while IFNAR1 is pre-associated with Tyk2 (29). When an IFN molecule binds to the extracellular domain of one or the other of these receptor subunits, the bound complex then recruits the remaining receptor subunit via binding to the IFN molecule. Once this ternary complex is formed, the proteins known as Signal Transducer and Activator of Transcription (STAT) 1 and STAT2 are recruited to the receptor complex. These STATs are phosphorylated and dimerize to form a pSTAT1-pSTAT2 heterodimer (See Figure 1A). The exact order and molecular details of STAT recruitment, phosphorylation, and dimerization are not fully known (11). This dimer binds IRF9, another transcription factor, and the resulting complex is imported to the nucleus to activate transcription of a variety of IFN regulated genes. Phosphorylation of additional STATs (e.g. STAT3 and STAT5) and alternate STAT dimers (e.g. STAT1 homodimers) have also been reported, although functional roles distinct from pSTAT1-pSTAT2 dimers have yet to be assigned to these complexes (29, 33).
IFNβ and IFNα2 are commonly chosen IFN subtypes to study signaling crosstalk because they are well separated in terms of their anti-proliferative and anti-viral activities (11, 18, 34, 35). Specifically, while anti-viral potencies are similar between all Type I IFNs, IFNβ elicits a much stronger anti-proliferative response compared to IFNα2 both in terms of the concentration required for half-maximal inhibition (its IC50, which is a few picomolar for IFNβ compared to nanomolar for IFNα2) and in terms of the maximal anti-proliferative response (although this difference varies across cell types) (10, 11, 34–39).
These differences in anti-proliferative and anti-viral potencies might naturally be assumed to arise from differences in the induced pSTAT response. Unfortunately, in many cases only the relative pSTAT responses (39, 40), or only the pSTAT EC50 (38, 41), or only semi-quantitative measures of the pSTAT response (10, 34–36, 42) are reported. It is therefore difficult to determine with certainty if differences in the pSTAT response consistently explain differences in anti-viral and anti-proliferative potencies between IFNs. However, most factors which have been suggested to play a role in the emergence of functional plasticity in Type I IFN signaling regulate the pSTAT response.
The primary factor differentiating IFNs is their affinity for the receptor subunits (18, 39, 40, 43–45). Previous studies have reported that, in human cells, IFNβ binds the IFNAR2 subunit much stronger than IFNα2 (10). Furthermore, mutation studies have demonstrated that much of the functional difference between these two IFNs can be recovered by IFNα2 mutants which bind the IFNAR2 subunit with a similar strength to wild-type IFNβ (38). However, ligand affinity cannot be the only important factor for functional plasticity since the anti-viral and anti-proliferative potencies of different IFN subtypes scale differently with ligand affinity (29).
Other factors have also been shown to be influential in tuning the functional differences between IFNs. These include differential expression of the receptor subunits on the cell surface (35, 37), differential receptor internalization induced by IFN stimulation (36, 38, 39, 46, 47), negative feedback on the signaling system by upregulation of the protein Suppressor of Cytokine Signaling (SOCS) 1 in response to IFN stimulation (48, 49), and response refractoriness via upregulated expression of the inhibitory protein USP18 (10, 46, 48, 50–52). How all these factors act in concert to regulate specificity is still not clear (11, 29).
Signaling systems with crosstalk must decouple ligand concentration from ligand affinity in the downstream response if functional plasticity is to be achieved. We refer to such a decoupling as absolute discrimination (53, 54). In systems with absolute discrimination, functional differences can only be partially compensated by changes in ligand concentration. We briefly outline possible biological mechanisms to achieve absolute discrimination.
Amplitude-based absolute discrimination encodes ligand affinity into the magnitude of receptor outputs via affinity-dependent saturation of the receptor (see Figure 1B). This means that there is a threshold level of receptor activation which only sufficiently high affinity ligands can surpass, even at high ligand concentrations. Cellular responses that require receptor activation above this threshold are consequently specific to high affinity ligands. One proposed mechanism for affinity-dependent receptor saturation relies on the non-monotonic nature of the dose-response curve of dimeric receptors (53, 55). Kinetic proofreading and its enhanced version know as adaptive sorting, studied in the context of T cell receptor sensing, also demonstrate affinity-dependent saturation (54, 56). These mechanisms are therefore capable of amplitude-based absolute discrimination of signals.
Another mechanism for decoupling ligand concentration from ligand affinity is based on time course discrimination, which separates signals based on differences in the temporal pattern of receptor activity. One commonly considered mechanism is to differentiate transient from sustained receptor activation (Figure 1C). Time course discrimination has been proposed in ERK and NF-κB signaling as well as in responses to metabolic and environmental stressors (57–60).
A third mechanism for absolute discrimination is combinatorial encoding, where different ligands induce different compositions of receptor outputs (60, 61). This mechanism appears to be most useful for decomposition of mixtures of ligands, a signal processing problem which is not treated here. For this reason, combinatorial encoding remains outside the scope of this investigation and will be addressed in future work.
In this paper we address how functional plasticity can arise in Type I IFN signaling, where many cytokines act through the same receptor. We present a model of Type I IFN signaling which incorporates the essential factors previously suggested to be important for signal specificity. Using measurements of the pSTAT response in primary mouse B cells stimulated with IFNα2 or IFNβ as well as previously published results, we validate our model at the level of the receptor activation and the downstream STAT response. We quantify differences in the pSTAT response between IFNα2 and IFNβ and clarify the differing roles of various feedback factors. We find that negative feedback by the protein USP18, which enhances differences in signaling between IFNα2 and IFNβ, can achieve amplitude-based absolute discrimination. Finally, we develop phenomenological models to demonstrate how functional plasticity in anti-viral and anti-proliferative activity can arise from this mechanism.
Methods
Experimental Methods
Single cell suspensions of mouse splenocytes were prepared as follows. Spleens were harvested from 4-month-old female C57BL/6J mice (Strain 00064 from Jackson Laboratory, Bangor ME) and mechanically dissociated with a sterile syringe plunger. We performed a 1 min ACK lysis to remove any red blood cells. Splenocytes were then washed in PBS and exposed to a solution of 0.1M glycine in PBS (with adjusted pH at 4.0) for 1min on ice, followed by 2 washes with complete medium. Cells were then rested in complete medium for 2 hours at 37°C.
Cells were then exposed to a serial dilution of IFN-α2 or IFN-β (R&D systems, Minneapolis MN) in complete medium and incubated for varied amounts of times. At each time point, ice-cold 4% paraformaldehyde solution was added to the reaction culture (for a final concentration of 1.6% paraformaldehyde) and cells were left in fixative for 15min on ice. Cells were then spun, their supernatants were discarded, and cells were then permeabilized with a 15-min incubation in 90% methanol on ice. Cells were then washed twice with FACS buffer (4% FBS in PBS + 0.1% sodium azide) and stained with primary anti-phospho-STAT1 (clone 58D6 from Cell Signaling Technologies, Danveres MA) for 30min at room temperature. Cells were then washed once with FACS and stained with a cocktail of antibodies against surface markers and Fab anti-Rabbit secondary antibody (see Table S1) for 30min at room temperature. Cells were then washed once with FACS buffer and resuspended in FACS buffer with DAPI (1µMol) and acquired on a 20-channel Fortessa cytometer (BD Biosciences). Single cell gating for live CD19+ B cells and levels of phosphorylated STAT1 were exported as geometric mean for further analysis (Figures S1, S2).
Mathematical Methods
Figure 1A illustrates a streamlined model of IFN which includes receptor assembly, STAT phosphorylation, receptor internalization, and SOCS1 inhibition. The model aggregates various biochemical sub-steps, such as STAT association and dissociation with active receptor complexes, into single-step reactions. Since only pSTAT1 was measured experimentally, our model does not describe STAT1-STAT2 dimers explicitly but rather uses a single STAT variable which can be phosphorylated to an active pSTAT form. Since the JAK kinases are constitutively bound to their corresponding receptor subunits, we do not model them explicitly and instead consider the ternary complex to phosphorylate STAT to pSTAT (28). A more detailed model which explicitly models additional biochemical steps is presented in the SI and yields similar predictions for the pSTAT response (Figure S3), indicating that the minimal model of Figure 1 encapsulates the salient features of the signaling network. We include basal and IFN-induced receptor internalization in our model as well as recycling of the receptor subunits back to the cell surface, assuming that the internalized ligand is degraded (36). The model includes negative feedback by SOCS1, which is produced downstream of pSTAT and binds IFNAR1 to block STAT phosphorylation. It is known that IFNAR1 and IFNAR2 surface expression levels vary between cells, and in practice we found it necessary to model this variation using a log-normal distribution of expression levels for IFNAR1 and IFNAR2 (62). All model predictions are made by taking 30 samples from these receptor distributions and averaging the predicted pSTAT responses. This is a simple way to model heterogeneity of receptor expression, a factor we explore more in depth below.
The complete mathematical description of our model using a system of ordinary differential equations (ODEs) is provided in Tables S2, S3 and is solved numerically using the PySB python package (63). We used ligand-receptor binding and unbinding rates measured for human IFNs and applied detailed balance to obtain in-membrane rates (see Table S2) (10, 38). A global scale factor of 1.5 was applied to convert the number of pSTAT molecules predicted by the model into units of MFI measured by experiment. Estimates of the values of model parameters which have not been directly measured were obtained using the systems biology package PyDREAM to perform Markov Chain Monte Carlo (MCMC) simulations (Figure S4) (64). The mean absolute error (MAE) between the data and the average prediction of our best fit model is 40%. A bootstrap analysis of the fitting procedure using an 80-20 train-test split of our experimental data yielded a similar MAE across bootstrap batches, further validating our parameter fit and demonstrating the robustness of the fitting procedure.
To fit the phenomenological models of anti-viral and anti-proliferative activity to the data in Section Proximal Receptor Signaling Maps to Biological Activity, we used standard nonlinear function fitting procedures provided by the scipy Python package which are based on the Trust Region Reflective algorithm. The fitting procedure for Eq. 5-6 yielded a root mean square error of 11%.
Many aspects of IFN signaling are captured by the relatively simple equilibrium description of receptor complex formation obtained from the steady state of our ODE model, providing qualitative insight into how various components of this system affect signaling dynamics. The equilibrium solution for the number of active ternary complexes formed in response to a ligand can be found by solving the chemical kinetic equations along with the detailed balance condition K1K3 = K2K4 (see below), where K1 and K2 are the equilibrium dissociation constants for IFN binding to each of IFNAR1 and IFNAR2, and K4 and K3 are the in-membrane dissociation constants for recruitment of IFNAR1 and IFNAR2 respectively to the ternary complex (see Figure 1A) (53). The result is an expression for the equilibrium number of ternary complexes (53, 65):
where Ξ(I)=1+K4RT(I+K2)(I+K1)I K1, I is the extracellular IFN concentration, Δ=RT1−RT2 is the difference between the (two-dimensional) cell surface densities of R1 (IFNAR1) and R2 (IFNAR2), RT=RT1+RT2 is the total surface density of receptors of both types. The detailed balance condition arises from the fundamental physics relating the dissociation constants to the binding energies of the ligand with the receptor subunits, E1 and E2. In the simplest case, K1=1ve−E1kT and K2=1ve−E2kT, where v is a small volume roughly proportional to the average volume of the reacting molecules; for three-dimensional binding affinities, it is customary to set v = 1M–1 ≈ 1.75nm3 (1, 66). The in-membrane affinities K3 and K4 obey the same physics; in the ideal case where the ligand binding to one of the subunits does not affect its binding to the other one, K4=1ae−E1kT and K3=1ae−E2kT where a is the average area of the reacting molecules (67). The detailed balance condition also holds for more complicated dependencies of the dissociation constants on the molecular interaction energies as long as the binding-unbinding reactions involved in the receptor dimerization do not require direct input of metabolic energy (68).
The ternary complex dose-response curve is a non-monotonic function of the ligand concentration. The maximal response Tmax is attained at Im=√K1K2. Crucially, weak affinity ligands saturate to a lower maximum receptor activity than high affinity ligands. At concentrations below the maximal response, the dose-response curve can be approximated with a Michaelis-Menten type function:
where Keff is the effective equilibrium dissociation constant of ternary complex formation, with Keff given by:
where D=RTK4+1+10X12+X+3RTK4√B2−1+(Δ/RT)2,B=1+(K4/RT)(1+√X)2 and X = K2/K1. It is important to note that Equations (1-3) predict contours of constant Keff and Tmax as a function of receptor binding strengths, as shown in Figure 2A.
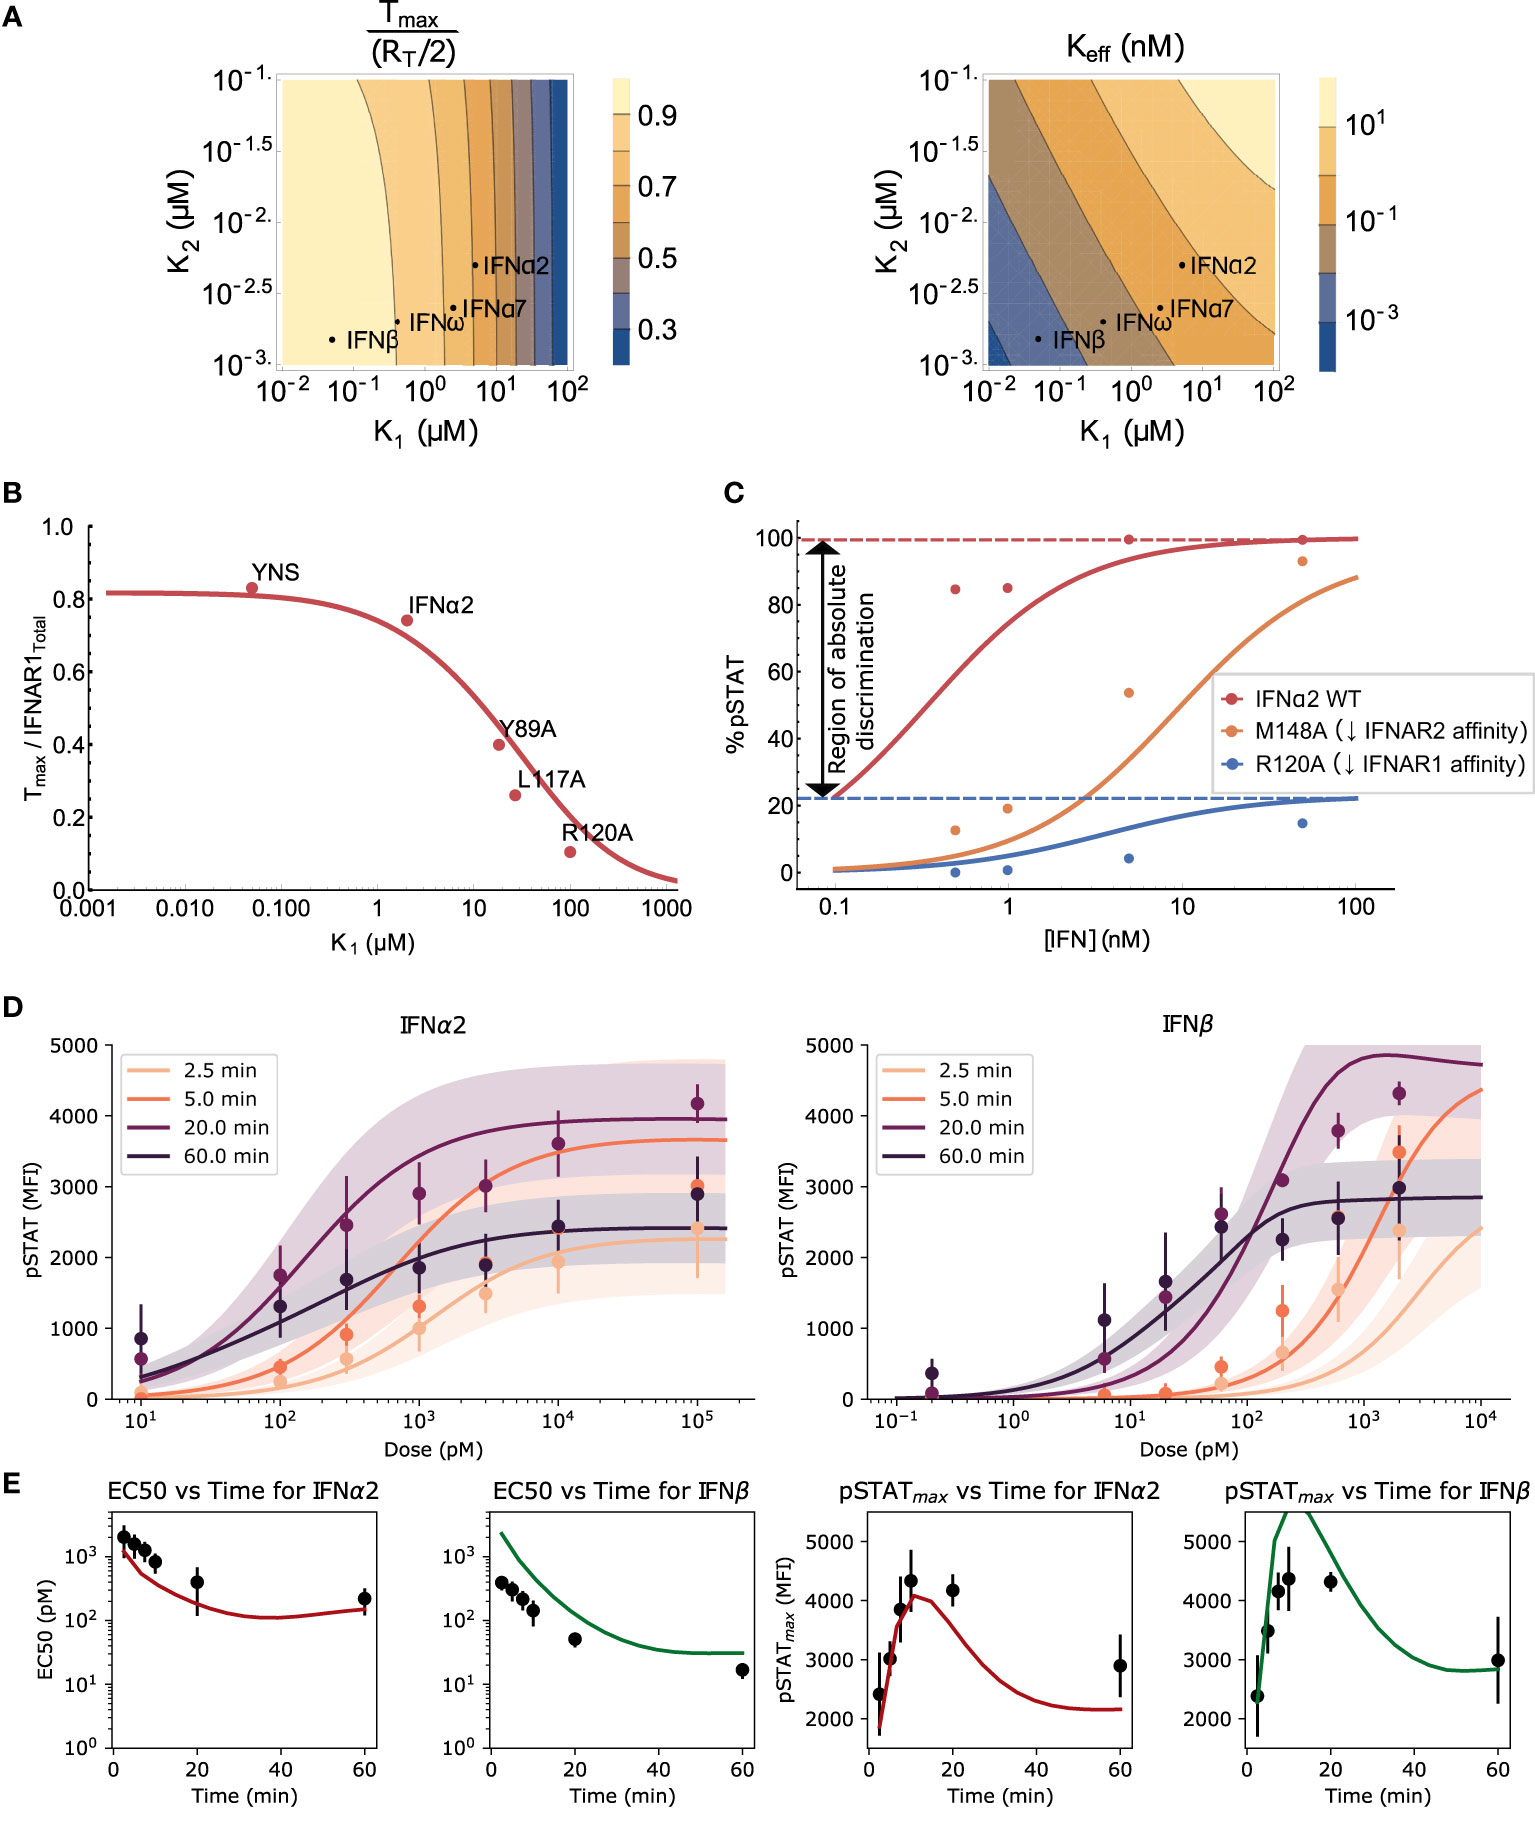
Figure 2 Validation of the model and the effects of ligand affinity on response specificity. (A) The theoretically predicted values of Tmax and Keff as functions of binding affinities, maintaining detailed balance (see Mathematical Methods). Tmax is normalized to be between 0 and 1, with Δ = 0 in both plots. Both Tmax and Keff are sensitive to changes in K1 but only Keff is sensitive to changes in K2 in the regime of interest. (B) The Tmax normalized by total IFNAR1 for different IFNα2 mutants was measured directly in (10). Varying IFNAR1 binding affinity in Eq. 1 (red curve) explains observed differences in Tmax (points). (C) pSTAT1 Western blot band intensities (points) measured in (10) for wild-type (WT) IFNα2 and the IFNα2 mutants R120A and M148A. The effect of the mutations on the dose-response curve are recapitulated by the equilibrium model (Eq. 4) using a 60-fold (R120A) and 50-fold (M148A) change in K1 (and the corresponding change in K4) or K2 (and K3), respectively. Kinetic parameters (Kp, ST, A) match those used in the ODE model presented in (D), and affinities from (10). (D) The experimental data from mouse B cells (points with error bars) and simulated (solid lines) dose response curves for IFNα2 and IFNβ at different stimulation durations. Each dose-response curve is the average model prediction with a one standard-deviation envelope, representing 30 samples from the fitted log-normal distribution of IFNAR1 and IFNAR2 expression. Additional timepoints shown in Figure S2. (E) The EC50 (left) and maximal response (right) computed from the data (black points with std. dev. shown) and the model (solid line).
The product of the dissociation constants K1 × K2 has been empirically observed to correlate well with Keff for a wide range of IFNs (39). This product is therefore expected to be approximately proportional to related biological IC50 values and other quantities related to Keff, although there is a systematic bias in using K1 × K2 in place of Keff (see also Figure S5).
Ternary complex formation leads to the production of phosphorylated STAT1-STAT2 dimers at rate k+p, which are constitutively de-phosphorylated at rate k−p. In the limit that intracellular STAT equilibrates with the active receptor complexes faster than STAT is phosphorylated, the equilibrium copy number of pSTAT1-pSTAT2 dimers is well approximated by a Michaelis-Menten equation:
where ST is the total number of STAT molecules in the cell, Kp=k−p/k+p, and A is the cell surface area. Thus, the maximal magnitude of the pSTAT response is pSTATmax=STTmaxTmax+Kp/A and the half-maximal response of pSTAT is pSTAT EC50 = Keff /(1 + TmaxA/Kp). Unlike the effective affinity of the receptor binding Keff, the EC50 of the pSTAT response explicitly depends on the cell area and not only on the surface densities of the receptor sub-units.
Results
Validation of the Model and the Effects of Ligand Affinity on Response Specificity
To validate our model at the level of receptor assembly (Equation 1), we compared the predicted number of ternary complexes for a variety of IFNα2 mutants to previously reported measurements that used single-molecule tracking of receptor subunits, as reported in (10). IFNAR1 affinity has been shown to be the main differentiating factor between these IFNs (39, 43, 69). We demonstrate in Figure 2B that differences in the level of maximum ternary complex formation between IFNs are well explained in our model of receptor assembly using only the differences in IFNAR1 binding strength between these IFNs [i.e., holding IFNAR2 binding strength constant at the measured IFNα2 wild type level (38)]. This agreement between the model and data for a wide variety of affinity-altering mutations of the IFN molecule demonstrates that our model captures the essential features of receptor assembly kinetics in Type I IFN signaling.
Further model validation is provided by looking at the effect of two mutations to IFNα2 on the pSTAT dose-response curve. The mutants IFNα2-R120A and IFNα2-M148A have reduced affinities for IFNAR1 and IFNAR2 respectively and have been used to explore the dependence of the pSTAT response on IFN-receptor binding strength (10). Mutations of the IFN ligand alter the binding energy and therefore the dissociation rates of all reactions involving IFN-receptor interaction due to the detailed balance condition described above. In particular, reduction in IFNAR1 affinity alters both K1 and K4, and a reduction in IFNAR2 affinity alters K2 and K3 (see Mathematical Methods). The IFNα2-R120A ligand, with a 60-fold reduced affinity for IFNAR1, was shown to alter both pSTATmax and the pSTAT EC50 while the IFNα2-M148A ligand, with a 50-fold reduced affinity for IFNAR2, only affected the pSTAT EC50. In Figure 2C we show that our equilibrium model recapitulates the effect of these changes in binding energy on the pSTAT dose-response curves. The difference in the effects of these two mutations is not surprising considering we already showed in Figure 2A that, in the range of K1 and K2 affinities observed for Type I IFNs, Tmax – and therefore pSTATmax – is largely insensitive to changes in IFNAR2 affinity while Keff – and therefore pSTAT EC50 – is sensitive to both IFNAR1 and IFNAR2 affinity. The difference in pSTATmax between IFNα2 and IFNα2-R120A, shown in Figure 2C, demonstrates that ligand affinity is sufficient to enable amplitude-based absolute discrimination. This effect has also been observed in other signaling pathways (55, 70, 71). Additionally, the results in Figures 2A–C suggest that pSTATmax and the pSTAT EC50 can be tuned independently by ligand binding strengths. We will return to this point in the Discussion.
We next focused on the pSTAT response to IFNα2 and IFNβ in particular, explicitly including the effects of short-term and long-term negative feedbacks in order to capture changes in the response over time. To this end, we fit the free parameters of our ODE model (the rates of STAT phosphorylation/dephosphorylation, of SOCS1 production, of receptor internalization, and receptor subunit expression levels, summarized in Table S3) to our measurements of primary mouse B cell response to IFN stimulation (see Methods for details). Figure 2D shows that our model can be fit closely to our experimental data. The MCMC fitting did not tightly constrain the free model parameters, which is to be expected due to “sloppiness” observed in most systems biology models as a result of multiple compensatory feedbacks in these systems (72, 73).
Both the EC50 and pSTATmax of the pSTAT dose-response curve depend on the stimulation time but converge at long times to steady state values for each IFN, and the values predicted by the ODE model are in agreement with the experimentally determined ones (Figure 2E). Interestingly, we do not observe a significant difference in the pSTATmax between IFNα2 and IFNβ. This is somewhat surprising because there is a noticeable difference in the expected Tmax between these IFNs (as shown in Figures 2A, B), and furthermore our equilibrium model naïvely predicts an approximately 15% lower pSTATmax according to Eq. 4, for reasonable choices of parameters (RT = 2000 subunits, A = 450 μm2, affinities and Kp from Table S3). The fold-change in pSTATmax between IFNs can be estimated from Equation 4 as
For large Kp/A, the difference in response is expected to be the same as the difference in Tmax. In contrast, for small Kp/A no difference in pSTATmax is expected despite a difference in Tmax. As we will show below, additional factors besides the cell surface area and phosphorylation constant (A and Kp) also affect the difference in pSTATmax. We note here that the lack of a region of absolute discrimination between IFNα2-induced and IFNβ-induced pSTAT response in our experimental results in primary mouse B cells is consistent with some of the measurements performed in a variety of human cell types exposed to IFNα2 and IFNα2-YNS, an IFNβ mimic (39). On the other hand, there are also reports of differences in maximal pSTAT response between IFN subtypes in other settings (35, 39, 42). This is reasonable since different cell types have different values for Kp, A, and other feedback rates which may tune the difference in pSTATmax. Thus, in the sections below we explore additional factors besides ligand affinity which can regulate the pSTAT response and allow for functional plasticity.
Receptor Expression Levels Can Regulate Signaling Specificity
Receptor density on the cell surface has been suggested as an important factor affecting the specificity of response (35, 74, 75). As shown in Figure 3A, the theoretically predicted separation between pSTATmax for ligands of different affinities (i.e., the region of absolute discrimination) remains nearly constant except at very low receptor expression levels – because the dominant effect of a change in the number of the surface receptors is the overall increase in the number of ternary complexes. For this reason, total receptor expression is not expected to affect amplitude-based absolute discrimination.
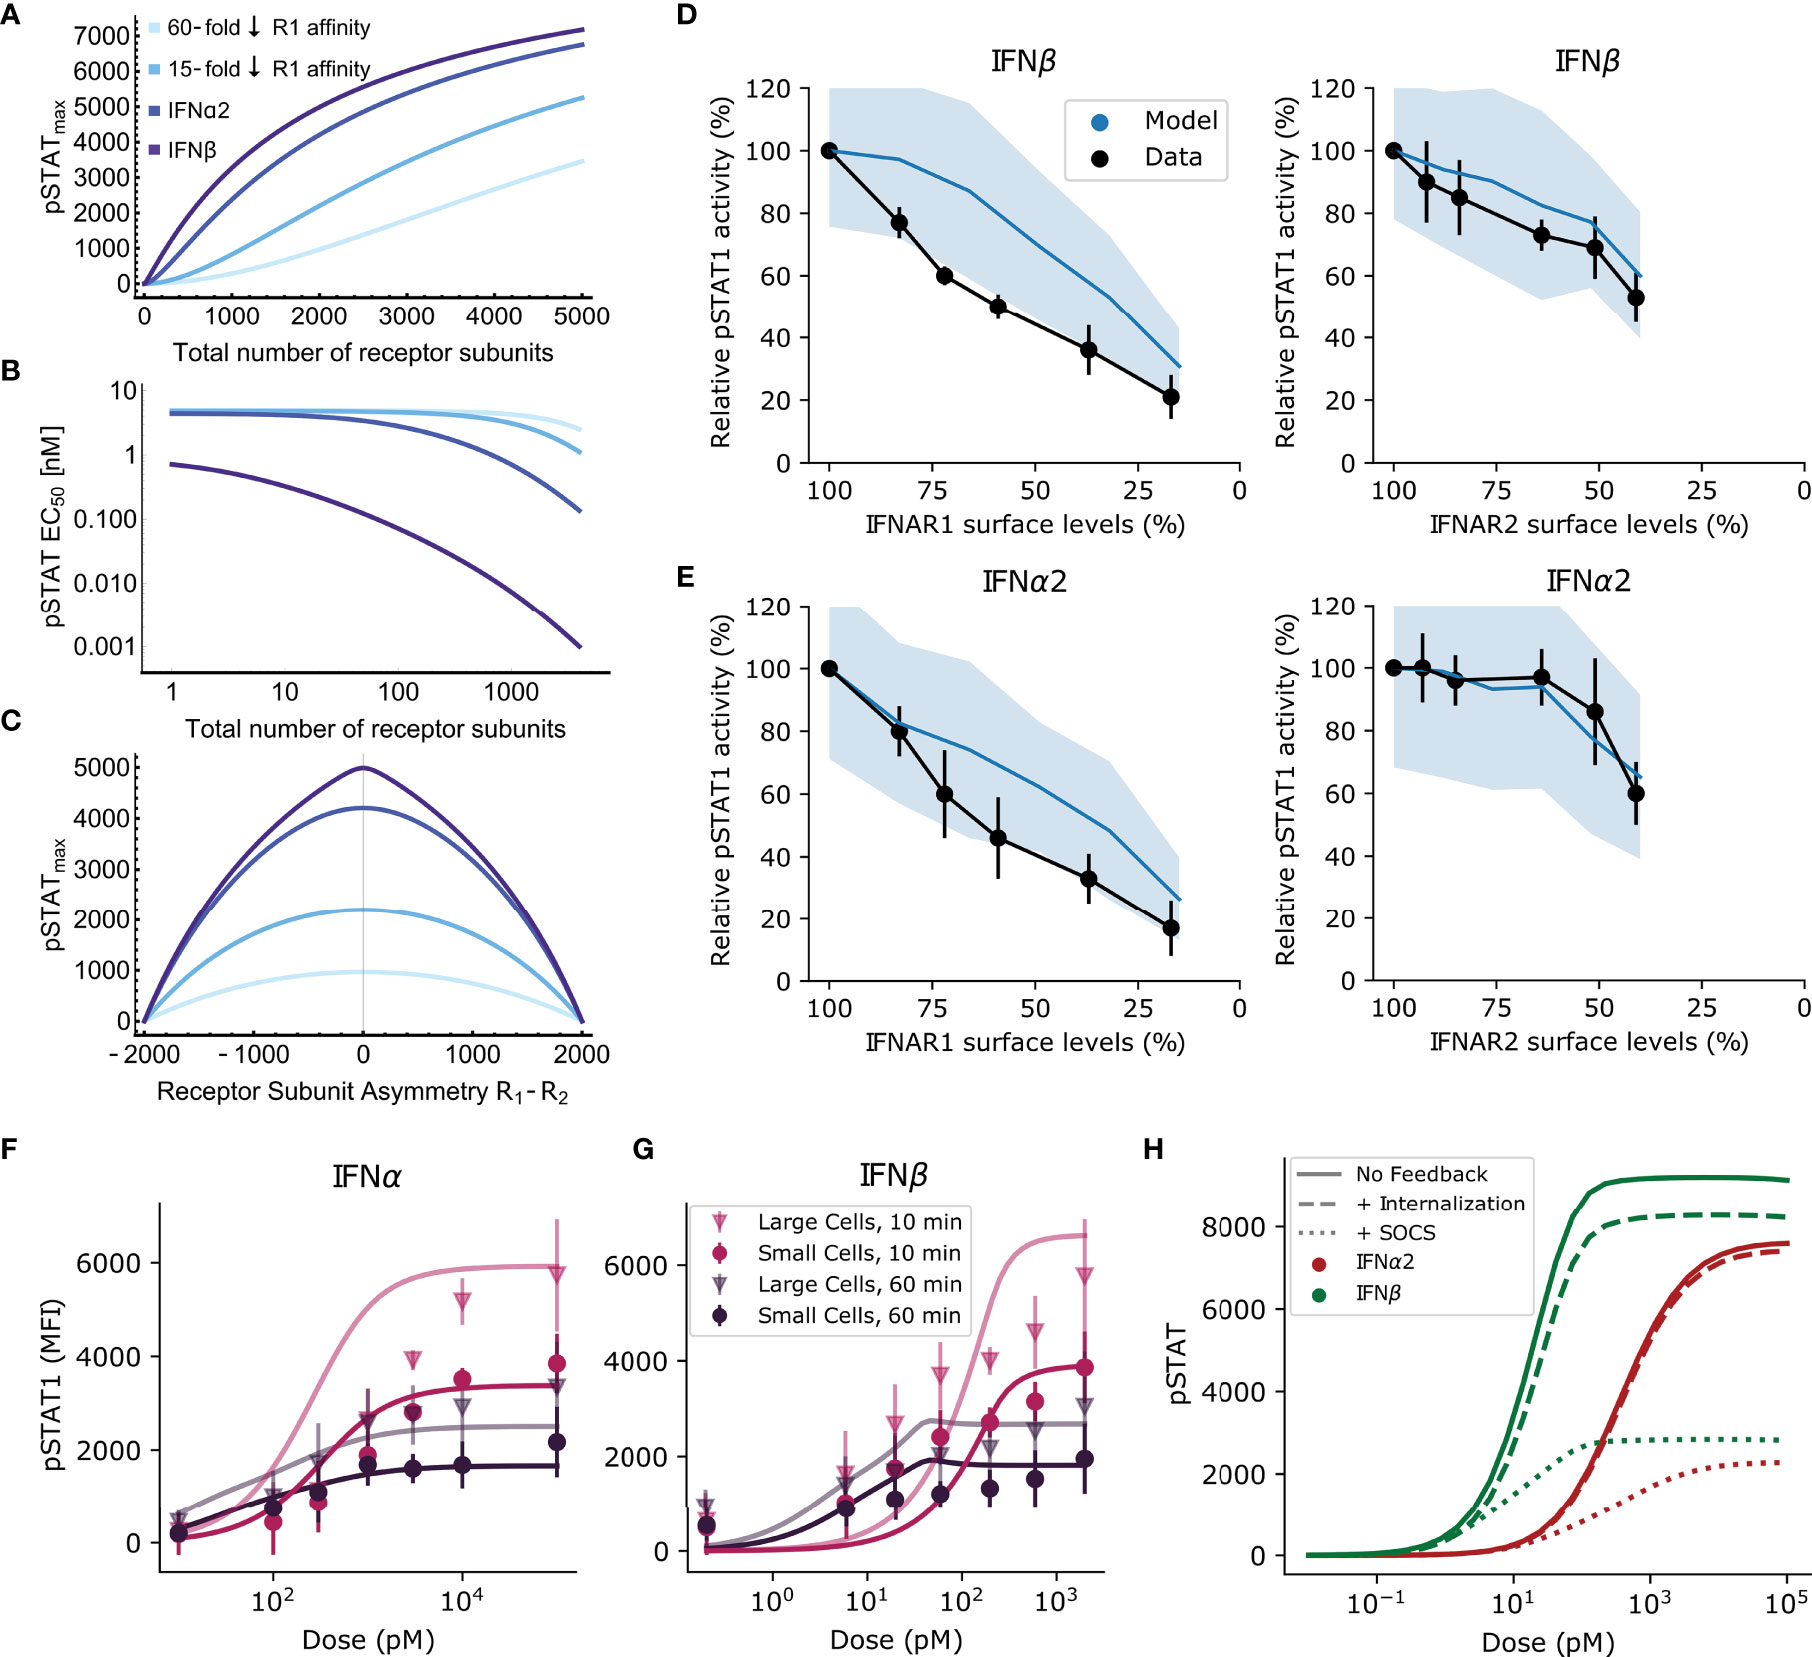
Figure 3 Receptor expression levels can regulate signal specificity. (A, B) The equilibrium model predicts how pSTATmax (A) and pSTAT EC50 (B) vary with the total number of receptor subunits on the cell surface. From violet to lightest blue, lines correspond to high affinity IFNβ, lower affinity IFNα2, and IFNα2 mutants with 15-fold and 60-fold lower IFNAR1 affinity, respectively (see text). (C) The dependence of the response on the difference in expression of R1 and R2 subunits for each of the IFN subtypes from A&B. The results in (A–C) are similar for the computational model (not shown); see text. (D, E) pSTAT1 levels following siRNA transfection to knockdown IFNAR1 or IFNAR2 and subsequent stimulation for 45 minutes with 200 pM of IFN. Black: Western blot band intensity measurements; Blue: predicted response from model. Responses are normalized by maximum response. Model uses measured human IFN affinities and mean receptor density between 0.1 and 1 molec. μm-2, consistent with measurements for WISH cells (10). (F, G) Points: Experimental flow cytometry data from mouse B cells with one std. dev. Lines: simulated average pSTAT responses for IFNα2 (F) and IFNβ (G) using the same model parameters as . More copies of IFNAR are expressed in large cells, but no significant difference between the maximum pSTAT response to IFNα2 and IFNβ is observed. (H) Solid lines: simulated pSTAT dose-response curve at 60 minutes without any negative feedback (i.e., setting SOCS1 binding and receptor internalization rates to zero). Dotted lines: the effect of SOCS1. Dashed lines: the effect of receptor internalization. In both cases the dose-response curve is diminished by these negative feedbacks. The difference in pSTATmax between IFNα2 (red) and IFNβ (green) remains constant with the action of SOCS1 inhibition while the difference between IFNα2 and IFNβ is diminished by receptor internalization.
By contrast, as shown in Figure 3B, the theoretically predicted pSTAT EC50 decreases monotonically with increasing total number of receptor subunits and can shift by several orders of magnitude over a biologically realistic range of receptor expression levels [e.g. 102 versus 103 copies, (18)]. This suggests that modulation of total IFNAR1 and IFNAR2 expression levels could make a cell preclude weaker binding IFNs from activating downstream responses that require high intracellular pSTAT levels. This is conceptually similar to absolute discrimination but without complete decoupling of ligand concentration from the pSTAT response. For physiological numbers of receptor subunits (e.g., ~103 total receptor subunits), preventing a high pSTAT-dependent response to IFNα2 would require IFN concentrations to remain well below 1 nM at all times. Note, however, that this does not provide discrimination between two distinct ligands requiring different cellular responses because the weaker binding ligand is effectively never detected. Rather, this effect could provide a way of selectively responding only to high affinity ligands as a function of receptor expression levels. This could be used to selectively target specific cell types, a point we return to in the Discussion.
Figure 3C shows that asymmetric expression of IFNAR1 and IFNAR2 is predicted to be an important factor controlling the difference in response for different ligands. The greatest degree of separation in pSTATmax is achieved for equal levels of IFNAR1 and IFNAR2, and this separation decreases monotonically and symmetrically for a growing imbalance in expression levels. The symmetry in the effect of expression imbalance may seem counter-intuitive given that IFNAR1 affinity is the major discriminant between IFN subtypes. However, Eq. 1 shows that the response only depends on IFNAR1 abundance relative to IFNAR2 abundance (i.e., through the terms RT and Δ), so the separation in pSTATmax between different IFNs remains nearly constant unless an imbalance between IFNAR1 and IFNAR2 is introduced.
Although we could not directly probe the effect of tuning receptor subunit expression on the pSTAT response in primary mouse B cells, this effect has been measured in WISH cells by siRNA knockdown experiments (45). In Figures 3D, E we compare the measured and simulated pSTAT1 response after siRNA transfection and subsequent treatment with either IFNβ analog IFNα2-YNS or IFNα2. Both model and data exhibit a reduction in pSTAT level that varies approximately linearly with the reduction in IFNAR1 levels for both IFNs. In comparison, the reduction in pSTAT is lower at equivalent levels of IFNAR2 knockdown in both model and experiment. The good agreement between our model and data, especially considering the difference in cell type between the siRNA experiments and those used to parameterize our model, demonstrates that our computational model captures essential factors regulating IFN signaling.
To further investigate the dependence of pSTATmax and pSTAT EC50 on the receptor subunit numbers, we used the cell size as a proxy for the receptor number. We grouped B cells from our flow cytometry experiments by their forward scatter size as a proxy for cell size. Cells in the top 20th percentile in forward scatter (i.e., large cells) were experimentally observed to have a greater pSTAT MFI in response to both IFNs compared with those in the bottom 80th percentile (Figures 3F, G). To compare experimental data with our model quantitatively, we varied the cell size in our model while keeping the surface concentration of receptor subunits and the cytoplasmic concentration of STAT molecules constant (76). The experimentally observed separation in the pSTATmax in small and large cells was explained in our model by assuming fixed effective cell radii of 6.5 μm and 8 μm (corresponding to roughly two-fold difference in the cell volume) for the small and large cells respectively. These cell groups may correspond to cells in different phases of the cell cycle or other factors which affect cell size (77). Importantly, none of the rate constants for the biochemical reactions in our model needed to be adjusted from our original fitting procedure (in Figure 2D).
The Role of Negative Feedbacks in Signal Specificity
Both receptor internalization and feedback by SOCS1 have been discussed in the literature as factors relevant for functional plasticity (36, 38, 39, 46–49). Our computational model allows us to compare the role of these two short-term feedback mechanisms in Type I IFN signaling. Since both receptor internalization and SOCS1 upregulation happen rapidly in response to IFN stimulation, there may be partial redundancy in their roles as negative feedback mechanisms (36, 78).
It has been shown that the rate of receptor internalization may be significantly increased in response to IFN stimulation and that this effect is much stronger in response to IFNβ than to IFNα2 (36, 39). These works additionally showed that the rates at which IFNAR1 and IFNAR2 are recycled back to the cell surface may also differ. As a result, each IFN induces a ligand-specific change in the levels of IFNAR1 and IFNAR2 present on the cell surface post-stimulation. This suggests that receptor internalization could be a mechanism for regulating functional plasticity, since receptor expression asymmetry is expected to affect signal separation by amplitude-based absolute discrimination (Section Receptor Expression Levels Can Regulate Signaling Specificity and Figure 3C). In contrast to receptor internalization, SOCS1 inhibits Tyk2 phosphorylation of STAT1, reducing the number of ternary complexes which are actively phosphorylating STAT. We expect this to have a similar effect to reducing total receptor expression, which was predicted not to regulate signal specificity (Section Receptor Expression Levels Can Regulate Signaling Specificity, Figures 3A, B).
To test if receptor internalization and SOCS1 play non-redundant roles in regulating response specificity, we used our computational model to query how these feedbacks each regulate the course of the pSTAT response. In Figure 3H we plot the predicted dose response curve for IFN signaling without SOCS1 or receptor internalization. By then looking at the isolated effect of SOCS1, we find that both the IFNα2 and IFNβ dose-response curves are reduced by similar amounts by the action of SOCS1. The difference in pSTATmax between IFNs remains proportionally the same because SOCS1 inhibits STAT phosphorylation rather than ternary complex formation, so that feedback on the system is not dependent on ligand identity. This suggests that SOCS1 does not play a role in the emergence of functional plasticity via amplitude-based signal discrimination.
In contrast to the effect of SOCS1, the effect of receptor internalization on the difference in pSTATmax between IFNs could be significant for amplitude-based signal discrimination. This can be seen in Figure 3H by comparing the response predicted by our computational model without any feedback to that with internalization. Receptor internalization rates can play a role in the emergence of functional plasticity because they are specific to the type of bound IFN. It has been reported that receptor internalization is greater for IFNβ than IFNα2, and the parameter fitting procedure for our ODE model also yielded greater receptor downregulation in response to IFNβ than IFNα2 (36). Since in the absence of feedback the pSTATmax of the dose-response curve at 60 minutes is predicted by our ODE model to be greater for IFNβ than IFNα2 (see Figure 3H), and since receptor internalization decreases each pSTAT dose-response curve, greater receptor internalization following IFNβ stimulation effectively acts to reduce the difference in pSTATmax between these IFNs. In particular, faster IFNAR2 recycling in response to IFNα2 relative to IFNβ [as has been reported in (36)] diminishes the difference in pSTATmax which might occur due to differences in receptor affinity. This means that receptor internalization may decrease the specificity of the pSTAT response in Type I IFN signaling. This effect is not an inherent property of receptor internalization, but rather is the result of the particular internalization rates observed in the Type I IFN system. These results also demonstrate that SOCS1 and receptor internalization have non-redundant roles as feedback mechanisms in Type I IFN signaling.
No Evidence of Time-Course Signal Discrimination
Although we have not observed evidence of amplitude-based absolute discrimination in the pSTAT dose-response curves, absolute discrimination based on the time course of Type I IFN signaling must also be considered. The most common type of time course signal discrimination is based on distinguishing transient from sustained signaling dynamics (57–59), although more complicated inference is possible (79, 80). We investigate time course discrimination as a possible mechanism for distinguishing IFNα2 from IFNβ by comparing early and late time levels of pSTAT. A sustained response exhibits similar pSTAT levels at both early and late times, while a transient response exhibits a different (usually diminished) pSTAT level at late times relative to early times. In Figure 4A we show that the character (transient or sustained) of the pSTAT response in our experiments appears to depend more on the concentration of IFN rather than the IFN identity, with a sustained response for low concentrations and a transient response for high concentrations. However, in either concentration regime, both IFNs seem to follow the same pattern, which suggests that the ligand discrimination does not occur via time course discrimination.
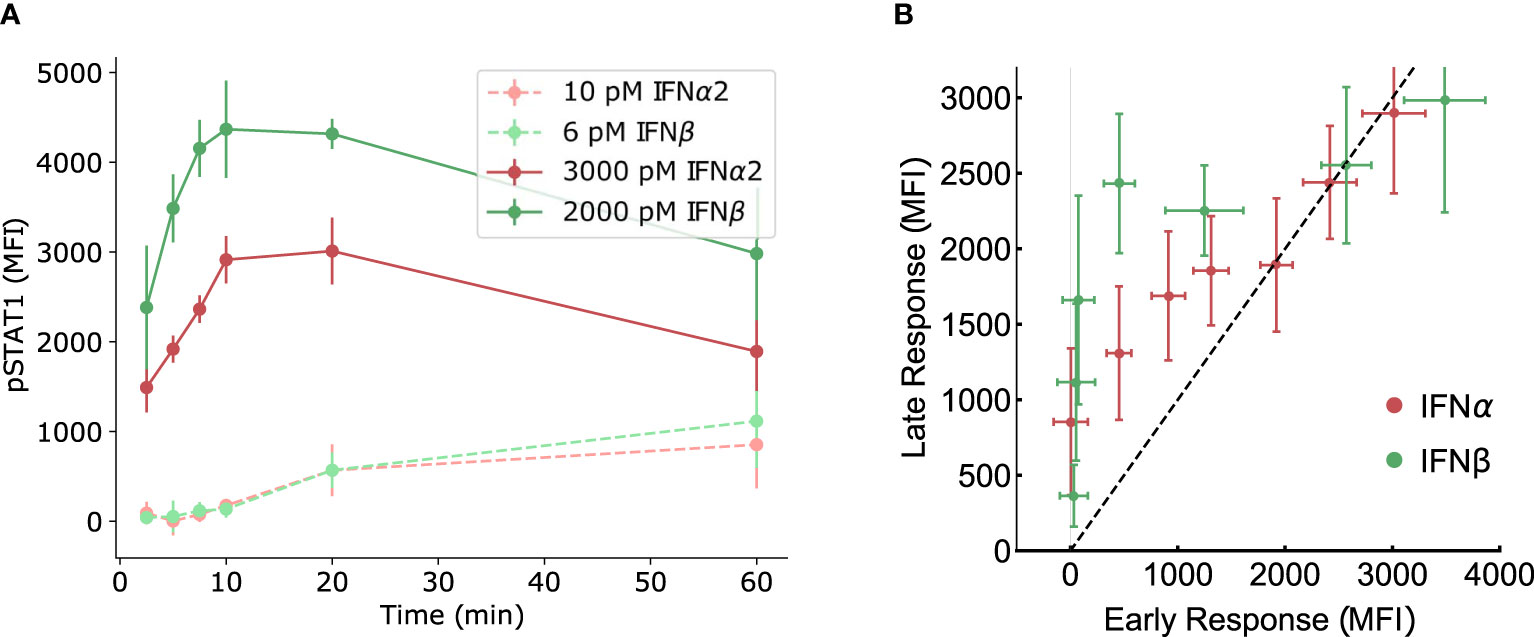
Figure 4 No evidence of time-course signal discrimination. (A) The same experimentally measured data from mouse B cells presented in Figure 2D is re-plotted here as time courses for IFNα2 and IFNβ at comparably low (~101 pM) and high (~103 pM) doses. There is no apparent difference in the character (transient versus sustained) responses between IFN subtypes in either concentration regime. (B) The measured pSTAT response at early (5 minutes) and late (60 minutes) times, at equal concentrations, are plotted with the early-time response on the horizontal axis and late-time response on the vertical axis. A sustained response would produce points on the diagonal (black dashed line) while a transient response would produce points away from the diagonal. The points are not separable as transient versus sustained response based on the type of IFN, within the error bars.
To investigate further, in Figure 4B we re-plot our pSTAT measurements in mouse B cells with the response at early times on the horizontal axis and the response at late times on the vertical axis (at different IFN concentrations). A sustained response would produce points on the diagonal (i.e., the line pSTATearly = pSTATlate) in such a plot, while a transient response would produce points away from the diagonal. Ligand discrimination would present itself in such a plot as a separability of points based on ligand identity. However, as Figure 4B shows, the data points corresponding to two different IFNs are not distinguishable (within the error bars) except perhaps for a narrow window of intermediate concentrations. Thus, we conclude that time course discrimination is unlikely to be important for response specificity in Type I IFN signaling although further studies might be required.
Long Time Deactivation via USP18 Regulates Receptor Complex Stability to Achieve Absolute Discrimination
Our results thus far suggest that functional plasticity in Type I IFN signaling does not arise from absolute discrimination of the initial pSTAT response within the first 60 minutes. However, differential refractoriness in the pSTAT response mediated by the protein USP18 offers another potential mechanism to achieve absolute discrimination (52, 81). It has been established that the upregulation of USP18 in response to Type I IFN stimulation over the course of 24-48 hours leads to somewhere between a 15- and 60-fold increase in the in-membrane dissociation rate of IFNAR1 from the ternary complex, with the magnitude of this effect varying between cell types (10, 81). Inhibition by USP18 leads to significantly reduced response to further IFN stimulation, which is relevant for clinical uses of Type I IFN (10, 42, 81). Importantly, IFNα2 typically exhibits much greater refractoriness than IFNβ at equivalent doses, although the degree of deactivation can be partially compensated by increasing the stimulation dose (42, 46). It is therefore possible that differential signaling mediated by USP18 over long timescales could lead to ligand specific differences in the pSTATmax, enabling absolute discrimination between the two ligands.
Since the action of USP18 occurs on the intracellular domain of the receptor, its effects are represented in the model via a change in K4, the in-membrane dissociation constant of IFNAR1 binding to the binary complex IFN : IFNAR2 (see Mathematical Methods). Figure 5A shows that the experimentally observed decrease in the numbers of ternary complexes in cells primed with IFN compared with unprimed cells can be accounted for by a 15-fold increase in K4 (10). Crucially, the USP18-induced change in the in-membrane dissociation constant K4 not only shifts the dose response curve towards higher concentrations but also decreases the plateau saturation level pSTATmax, raising the possibility of amplitude-based absolute discrimination. The model also reproduces the effect of USP18 refractoriness on the mutant IFNα2-M148A, as shown in Figure 5B. The agreement between the model and the data validates the simple approach of modeling the presence of USP18 indirectly as a shift in K4, at least for high expression levels of USP18.
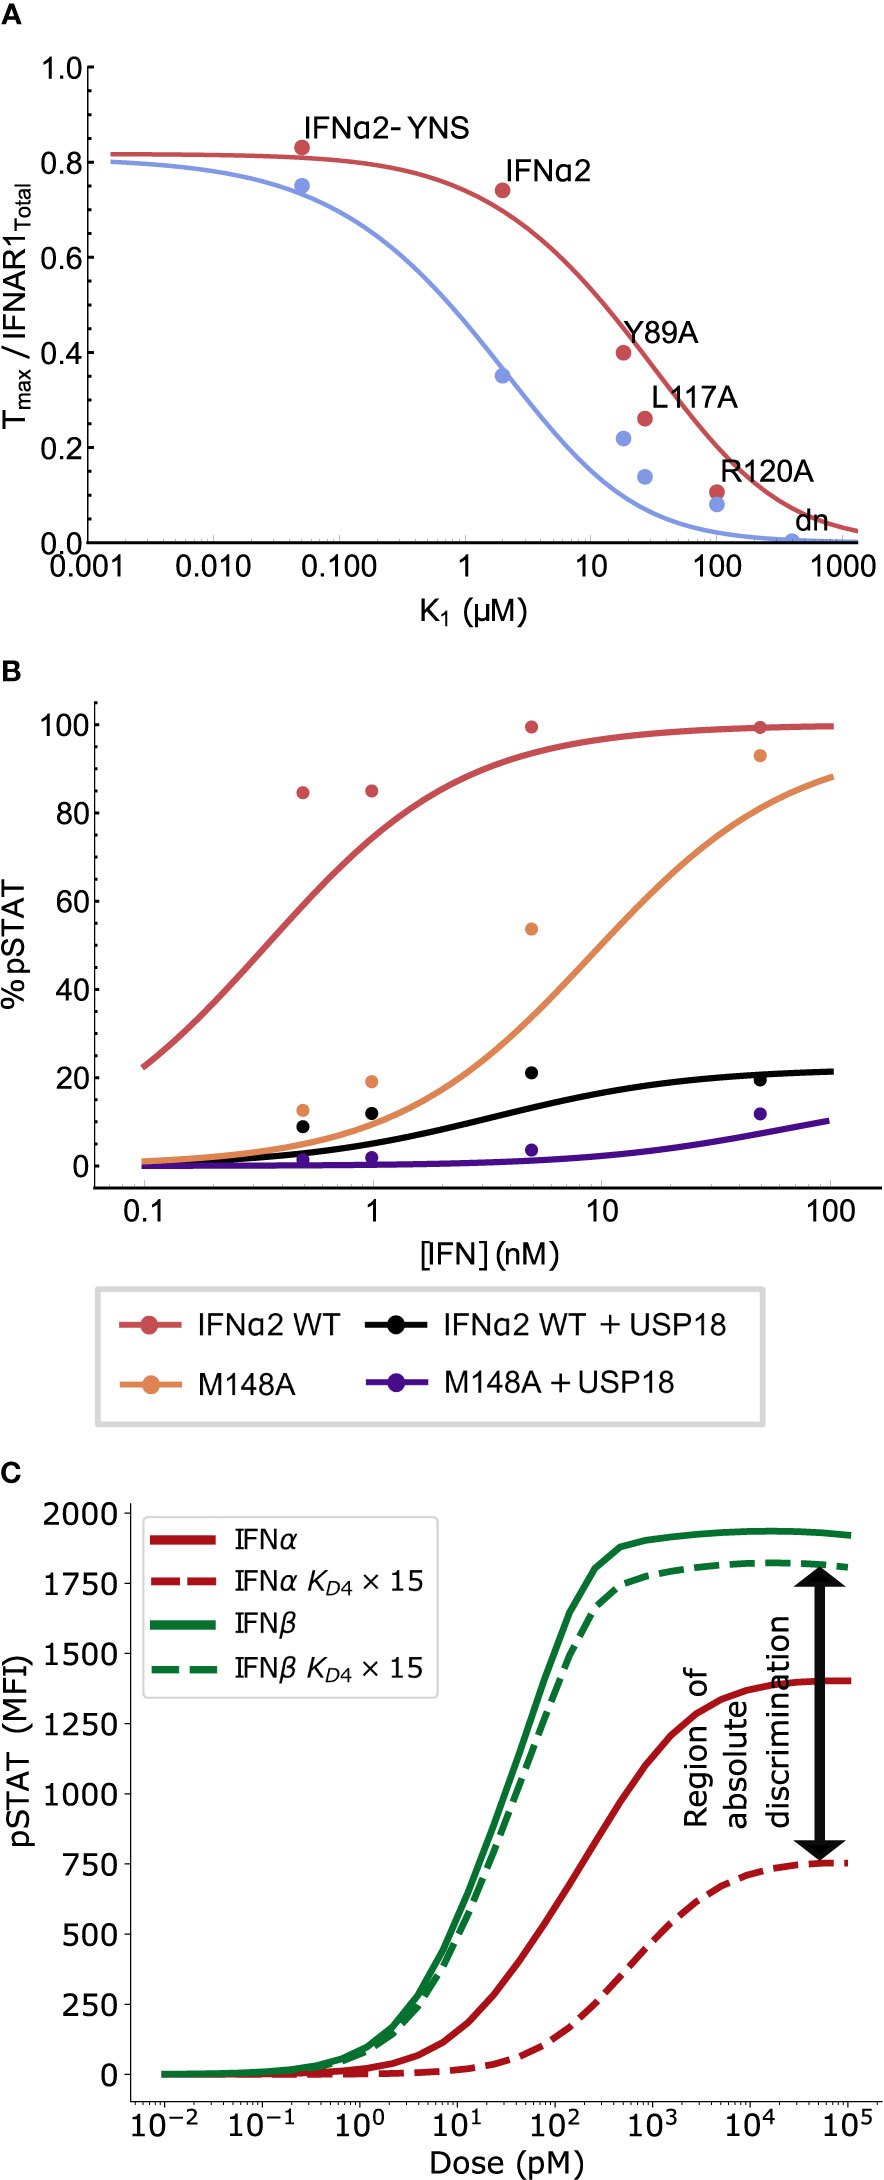
Figure 5 Long time deactivation via USP18 regulates receptor complex stability to achieve absolute discrimination. (A) Measurements reproduced from (10) of ternary complex formation in un-primed cells (red, also see Figure 2A) and cells primed with IFN to express USP18 (blue). Primed cells were observed to form fewer ternary complexes relative to unprimed cells. This reduction can be explained by a 15-fold increase in K4 in our analytic model (blue curve, produced from Equation 1); see text. (B) pSTAT1 Western blot band intensities for wild-type (WT) IFNα2 with and without USP18 expression, and IFNα2-M148A with USP18 expression are reproduced from (10). USP18 inhibition was modeled by a 60-fold increase in K4 in Eq. 4 (lines); see text. (C) The simulated effect of USP18 on the pSTAT response at 60 minutes for IFNα2 (red) versus IFNβ (green). Solid lines show the un-primed response while dashed lines show the effect of a 15-fold increase in dissociation rate, consistent with the effect of USP18 (reported to be between 15- to 60-fold change depending on cell type). The differential refractoriness of IFNα2 as compared to IFNβ greatly enhances the region of absolute discrimination (difference in pSTATmax).
Interestingly, comparison of Figure 2C with Figure 5B shows that the effect of USP18 (which only alters K4) on the pSTAT dose-response curve is recapitulated by the IFNα2-R120A mutant that has lower binding strength to IFNAR1 (which alters both K1 and K4), as was first described in (10). The similarity of these two perturbations on the dose-response curve indicates that ternary complex formation is highly sensitive to the rate of in-membrane receptor subunit association.
We further examined how USP18 may affect the ligand discrimination specifically between IFNα2 and IFNβ, as shown in Figure 5C, using our computational model. It demonstrates that the action of USP18 is predicted to reduce the amplitude of the IFNα2 dose-response curve much more than the corresponding amplitude of the IFNβ dose-response, in agreement with previously reported experimental results (42) and our own experimental analysis (not shown). The reason for this differential refractoriness is that the high affinity of IFNβ for IFNAR1 still allows formation of ternary complexes even in the presence of USP18, which is not the case for IFNα2 due to its lower affinity to IFNAR1. Most importantly, this differential effect of USP18 increases the separation in pSTATmax values between the two interferons and leads to the emergence of a region of absolute discrimination, which is expected to be apparent at long times (10-48 hours) when sufficient USP18 has accumulated in the cell. This fact will be important for the potential explanation of the differences in the anti-viral and anti-proliferative activities in Section Proximal Receptor Signaling Maps to Biological Activity.
Proximal Receptor Signaling Maps to Biological Activity
Interestingly, the time scale for USP18 upregulation is similar to that for the emergence of anti-proliferative activity (~24 hours) (11, 48, 82). By contrast, anti-viral genes are typically upregulated very quickly (less than 8 hours) in response to IFN stimulation, regardless of IFN subtype (11, 83). Motivated by this observation, we now discuss how differential signaling at the level of pSTAT may be translated into differences in physiological activity, focusing on the hypothesis that the differential activity may be linked to the regulation of differential pSTAT response by USP18 mentioned in the last section and Figure 5.
A multitude of signaling reactions and gene expression downstream of receptor signaling are involved in anti-viral and anti-proliferative responses. Not all of these reactions are known, making detailed modeling of these processes unfeasible. Rather, in this paper we use phenomenological mappings that translate the pSTAT response into anti-viral and anti-proliferative activity, as measured by common experimental functional assays, to gain insights into the emergence of functional plasticity based on the specificity of the receptor and STAT phosphorylation levels (38–40). Despite substantial variability in the results of anti-viral and anti-proliferative assays between different studies, our conclusions remain qualitatively robust across cell types and experimental variation.
Our aim is to capture the following notable features distinguishing anti-viral and anti-proliferative activity. First, the anti-viral IC50 (the IFN concentration required for half-maximal anti-viral activity) is substantially lower than the pSTAT EC50 [Figure 6A (left)]; this is not the case for anti-proliferative activity [Figure 6A (right)] (38, 39). Second, complete inhibition of viral replication is achievable by all IFN subtypes that have been investigated while the maximum inhibition of cell proliferation differs between IFN subtypes by as much as ~20% (38–40).
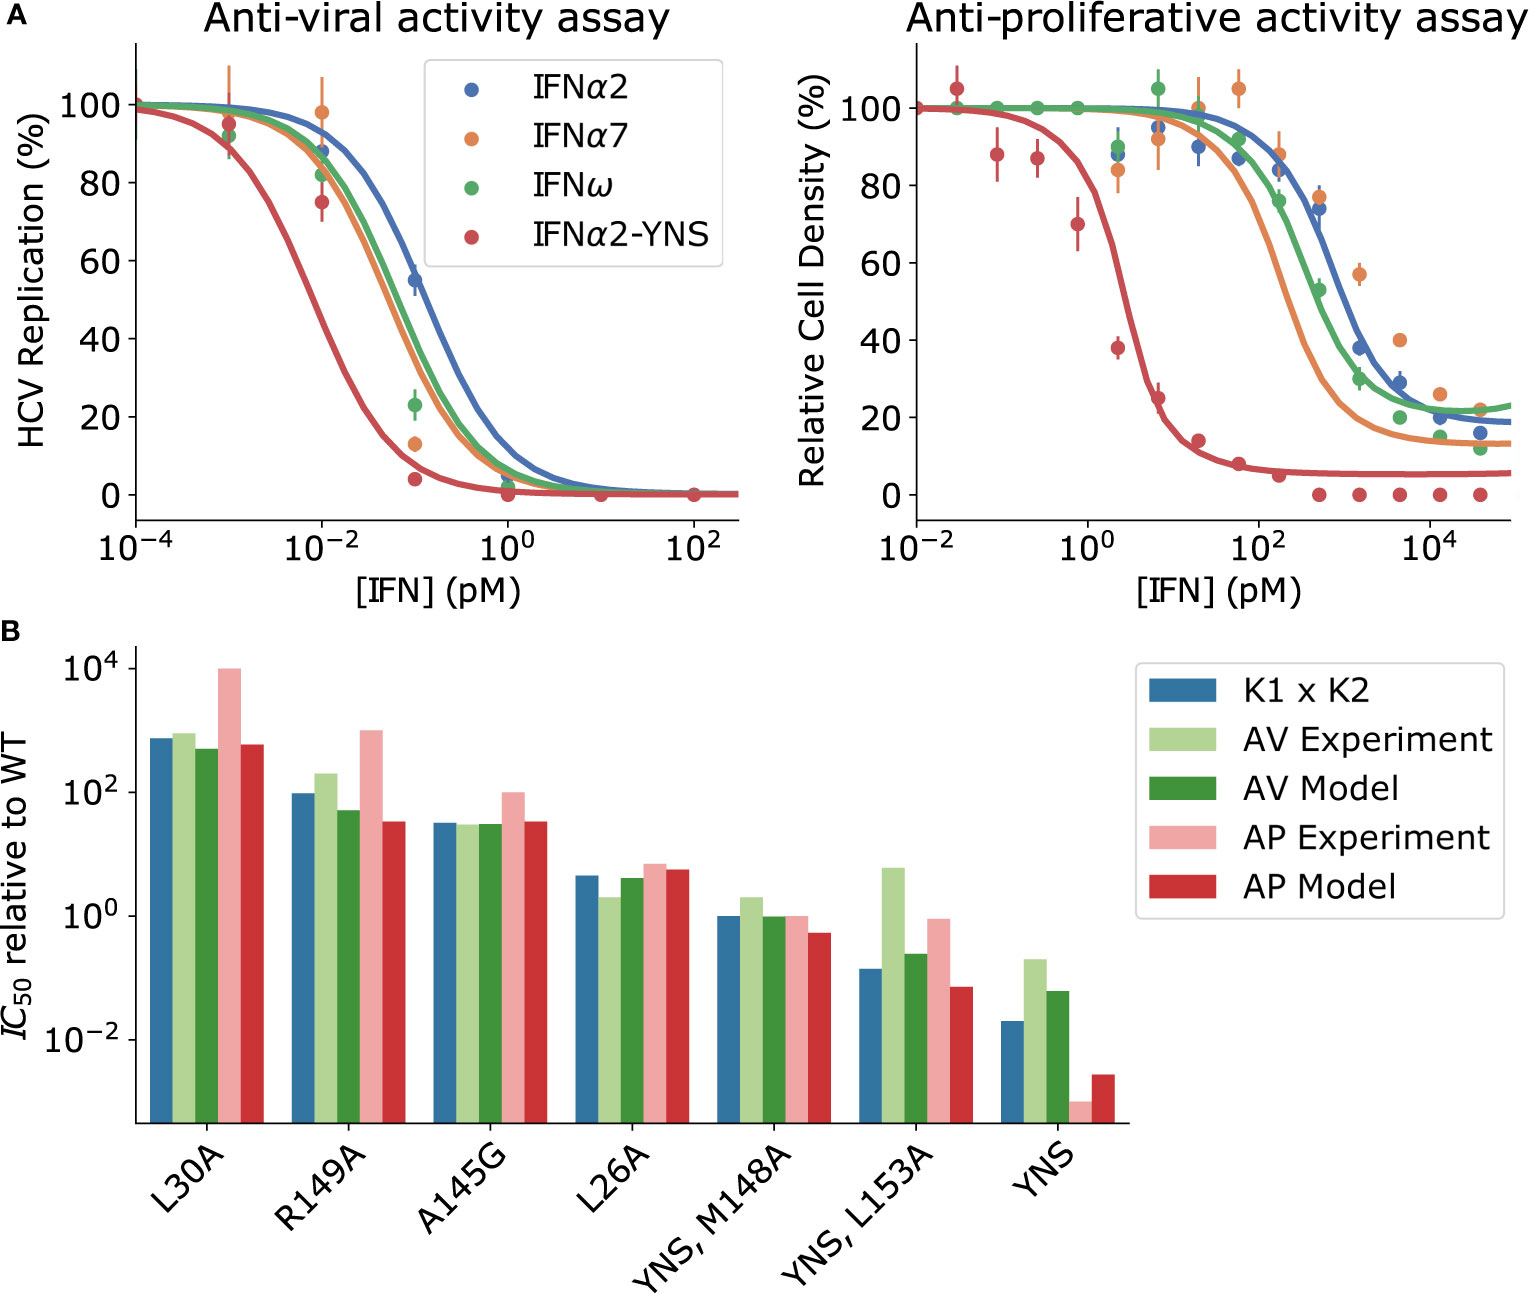
Figure 6 Proximal receptor signaling maps to biological activity. (A) Points: measurements of biological activity from (39). Lines: phenomenological mapping (Eq. 5-6). IFNα2-YNS is frequently used as an IFNβ mimic because it has a similar affinity for IFNAR1 and IFNAR2 as wild-type IFNβ. The antiviral activity was measured experimentally as the percentage of HCV-infected cells, while anti-proliferative activity was measured as the percentage of cells remaining alive after IFN stimulation for 48 hours. In both assays, maximal biological activity corresponds to minimal replication/cell density. (B) The anti-viral (AV) IC50 (green) and anti-proliferative (AP) IC50 (red) measured for a selection of IFNα2 mutants is compared with the predicted IC50’s from Equations 5 and 6 respectively. The product of IFNAR1 and IFNAR2 dissociation constants for each IFN subtype is shown in blue, and is a good phenomenological approximation to IC50; see Mathematical Methods.
The observed discrepancy between the IC50 of the anti-viral response and the pSTAT EC50 indicates that the components of the JAK-STAT pathway downstream of pSTAT that mediate anti-viral gene transcription require very little pSTAT to become activated. We found that despite its unusual properties, the dependence of the anti-viral response on the pSTAT levels can be reproduced by a simple Michaelis-Menten type dependence:
where pSTAT(IFN) is the intracellular concentration of pSTAT as a function of the extracellular IFN concentration, and KM is the effective Michaelis-Menten constant for the intra-cellular processes leading to anti-viral activity. As shown in Figure 6A, anti-viral activity described by Eq. 5 saturates at much lower IFN concentrations than the corresponding pSTAT dose-response curve (c.f. Figure 2D) for sufficiently small KM (i.e., KM~pM); we used KM = 0.8pM in Figure 6A.
The anti-viral IC50 can be found by substituting Eq. 4 for the pSTAT response into Eq. 5 and solving for the IFN concentration which gives half-maximal activity. In the limit of KM/[ST] ≪1, the IC50 is proportional to (pSTAT EC50) × KM/[ST], recalling that [ST] is the concentration of intracellular STAT (our model used [ST] = 0.7 nM). It follows from this proportionality that a small KM guarantees that the anti-viral IC50 is lower than the pSTAT EC50. This also explains why the anti-viral IC50 in this regime is essentially the same for all IFNs because differences in pSTAT EC50 between IFNs are also shrunk by the factor KM/[ST].
We now turn to anti-proliferative activity. A phenomenological mapping for anti-proliferative activity must preserve differences in maximal anti-proliferative response between IFN subtypes, as apparent in the high concentration regime of Figure 6A (right), as well as the difference in the anti-proliferative IC50 between IFNβ and the other IFN subtypes [also Figure 6A (right)]. These differences between IFNs are only observed in anti-proliferative assays, not anti-viral assays. Since the anti-proliferative activity emerges on longer time scales we include the effect of USP18 on the pSTAT response, denoted as pSTATprimed(IFN) (29, 31, 52). Unlike the anti-viral response that could be modeled by a single Michaelis-Menten type function, the anti-proliferative response required a more complex function of the following form to explain the data in Figure 6B:
where γ1 and γ2 are phenomenological Hill coefficients and KM1, KM2 are the effective anti-viral EC50’s for each contributing term. Fitting Eq. 6 to the data, using our model of pSTAT induction presented in Section Validation of the Model and the Effects of Ligand Affinity on Response Specificity and measured IFN binding affinities (39), results in the best fit parameter values KM1 = 72 pM, KM2 = 158 pM, γ1 = 0.9, γ2 = 3.7. For sufficiently large values of KM1 and KM2 – on the order of 100 pM – differential refractoriness expressed in the different saturation levels between the strong binding IFNα2-YNS and the weaker binding variants results in the differential saturation of anti-proliferative activity at high concentrations in Figure 6A (right). Thus, absolute discrimination on the pSTAT level shown in Figure 5C translates into functional plasticity on the level of anti-viral and anti-proliferative responses. This result is robust to variation in the parameters of Eq. 5-6, not simply the result of a choosing specific parameter values.
To demonstrate the robustness of our phenomenological mappings, in Figure 6B we compare the predicted IC50 values of both the anti-viral and anti-proliferative responses to previously reported measurements for several IFNα2 mutants spanning four orders of magnitude in Keff (39). We find that our phenomenological models semi-quantitatively recapitulate both anti-viral and anti-proliferative IC50’s for most IFNs, although agreement was somewhat worse for the quadruple mutant IFNα2-YNS-L153A as well as for the weakest binding IFNs IFNα2-L30A and IFNα2-R149A. The product K1 × K2 using affinities measured for each IFN is provided in Figure 6B for context, and provides a good estimate of each IC50 other than the high affinity mutant IFNα2-YNS (39). This quantity has been used as an approximation for Keff in previous work, and we show in Figure S5 that this approximation is reasonable for a realistic range of K1 and K2. The advantage of our phenomenological mappings is that they can predict the biological activity at any concentration, and the maximal biological activities, for each IFN subtype; the quantity K1 × K2 alone cannot provide such estimates.
The order of magnitude difference between KMi for anti-proliferative activity (~100 pM as obtained from the best fit values for Eq. 6) and KM for anti-viral activity (less than 1 pM), as well as the Hill coefficients greater than 1 in Eq. 6, suggest that different molecular processes are responsible for the activation of these two types of cellular response. We return to this point in the Discussion.
Discussion
Different Type I IFN subtypes induce distinct cellular responses despite the fact that all Type I IFNs bind to the same receptor. This functional plasticity arises from a combination of biophysical and dynamic factors and is at least partially decoupled from ligand concentration, indicating the presence of absolute discrimination in this signaling system (29, 38–40). In this paper we have presented a model of Type I IFN signaling validated with previously published and our own experimental data in a variety of cell types. This model accurately captures signaling dynamics both at the level of receptor assembly and at the level of pSTAT induction. Our validated model demonstrates that many molecular details of this system can be aggregated into single step reactions with effective rate constants, increasing interpretability without losing predictive power. Predictions of the model are in agreement with a more detailed model, further indicating that our coarse-grained minimal model that subsumes many molecular details into effective parameters is sufficient to capture the dynamics of the pSTAT response and the emergence of functional plasticity.
The main objective in this paper – beyond producing a realistic and generalizable model of Type I IFN signaling - was to investigate the mechanisms of ligand discrimination (among several primary candidates) that can explain functional plasticity in Type I IFN signaling (Sections No Evidence of Time-Course Signal Discrimination; Long Time Deactivation via USP18 Regulates Receptor Complex Stability to Achieve Absolute Discrimination). The first candidate mechanism considered was amplitude-based absolute discrimination, which encodes ligand identity in the saturation magnitude of the downstream response and enables functional plasticity by thresholding activity based on the level of response (53). The second candidate mechanism, time-course discrimination, achieves functional plasticity by conditioning the cellular response on the temporal pattern of signaling activity in response to different ligands (59). A third mechanism, combinatorial encoding, was not studied in this work (6, 61). The three mechanisms are not mutually exclusive. For example, amplitude discrimination which emerges only at late times in the signaling dynamics is conceptually related to time course discrimination by distinguishing transient from sustained responses. However, each mechanism focuses on a different aspects of signal processing: specificity across concentrations, or through time.
We showed that a difference in the ligand binding strength can theoretically generate amplitude-based absolute discrimination by inducing a difference in pSTATmax, and indeed this has been observed for the mutant IFNα2-R120A and in other signaling pathways (Section Validation of the Model and the Effects of Ligand Affinity on Response Specificity). However, no region of absolute discrimination was observed between IFNα2 and IFNβ in experiments. In practice, specificity in Type I IFN signaling appears to emerge primarily due to the action of the long-time negative feedback protein USP18 which is expressed in response to IFN stimulation. USP18 effectively increases the in-membrane dissociation of ternary complex, and the much weaker receptor binding strength of IFNα2 as compared to IFNβ leads to a greater inhibitory effect on the IFNα2 response, thus generating a difference in the pSTATmax between these IFNs (Section Long Time Deactivation via USP18 Regulates Receptor Complex Stability to Achieve Absolute Discrimination).
We also used our model of Type I IFN signaling as a basis for a phenomenological understanding of both anti-viral and anti-proliferative activities across the entire spectrum of IFN binding affinities. In Section Proximal Receptor Signaling Maps to Biological Activity we showed that a Michaelis-Menten function with a KM of only a few picomolar maps the pSTAT response to anti-viral activity for several IFNs, which suggests that maximal anti-viral gene transcription requires only a few copies of pSTAT. A small KM is also consistent with observations that all IFN subtypes can completely block viral replication, because in this case even the weakest binding IFNs can induce enough pSTAT to reach saturation in Eq. 5.
In contrast to the KM of anti-viral activity, the larger KM1 and KM2 used in our anti-proliferative phenomenological mapping requires a greater accumulation of pSTAT to saturate the functional response. Differences in the maximal anti-proliferative activity between IFNs then arise due to differences in their pSTATmax amplified by USP18 inhibition. This suggests that USP18 may provide a mechanism for cells to differentially regulate their anti-proliferative activity, without altering their potential for an anti-viral response. Furthermore, a Hill coefficient greater than one suggests molecular cooperativity or other complex regulation of anti-proliferative activity downstream of pSTAT (84, 85). Our phenomenological models point to different intracellular signal processing for anti-viral functions as compared to anti-proliferative functions, consistent with previous suggestions (32, 86).
Combinatorial encoding is an alternative mechanism for absolute discrimination, not investigated here, in which the set of signaling components involved encode the ligand identity and enable a specific response (87, 88). This mechanism is particularly effective for responding differently to different combinations of extracellular ligands (6, 89, 90), but can also be used to achieve absolute discrimination in crosstalk signaling systems (61). Reports of functional roles for pSTAT1 homodimers and complexes involving pSTAT3 or pSTAT5 may indicate combinatorial encoding, and future investigation may reveal additional complexities in signal processing for Type I IFNs (39, 82, 86).
We showed in Sections Receptor Expression Levels Can Regulate Signaling Specificity; The Role of Negative Feedbacks in Signal Specificity that differences in pSTATmax can be tuned by a variety of feedbacks. There is evidence that receptor internalization and recycling rates differ between cell types, so it is possible that receptor internalization is an important factor differentiating the response to IFN stimulation in different cell types (36). Additionally, we noted that total receptor expression could be regulated to ensure that some cell types only exhibit responses associated with high affinity IFNs. Other feedbacks we did not consider here include signaling from endocytosed receptor complexes and hypersensitization of the pSTAT response with low level IFN pre-stimulation (11, 36, 81). Feedback from ISG upregulation at longer timescales such as a reduction in IFNAR1 surface levels or activity of Tyk2 can be studied in our framework in a similar fashion to feedback by SOCS1, USP18, or receptor internalization studied in this work (Sections Receptor Expression Levels Can Regulate Signaling Specificity; The Role of Negative Feedbacks in Signal Specificity; Long Time Deactivation via USP18 Regulates Receptor Complex Stability to Achieve Absolute Discrimination), and will be investigated in future work. While we did not find it necessary to model these effects to explain the emergence of functional plasticity, such mechanisms may play (possibly redundant) roles in some cell types. Whether or not signal processing of Type I IFNs differs between cell types is an interesting but open question.
Finally, our models for Type I IFN signaling can be used as a framework for engineering functional properties of IFNs for improved clinical use. For example, refractoriness to repeated IFN treatment can be a serious challenge for clinical applications (42, 81). Our results suggest that a non-refractory version of IFNα2 could be engineered with a similar pSTAT1 EC50 to the wild type IFN by increasing the IFNAR1 affinity and simultaneously decreasing IFNAR2 affinity. More generally, the approach presented here provides a broadly applicable framework for studying response specificity in systems involving crosstalk downstream of the receptor or combinatorial sensing of cytokine mixtures.
Data Availability Statement
The original contributions presented in the study are included in the article/Supplementary Material. Further inquiries can be directed to the corresponding author.
Ethics Statement
The animal study was reviewed and approved by the institutional animal care and use committee (IACUC) of the National Cancer Institute (Bethesda MD, USA).
Author Contributions
AZ, GA-B, JF, and SMac were responsible for conceptualization, funding acquisition, supervision, resources, and project administration. All authors contributed to methodology and investigation. DK was responsible for formal analysis, visualization, software, methodology, validation. DK and AZ wrote the paper. All authors contributed to the article and approved the submitted version.
Funding
AZ acknowledges the support of Natural Sciences and Engineering Research Council (NSERC) of Canada through the Discovery Grant (RGPIN 402591). DK acknowledges the support of the PGS-D Graduate Fellowship from NSERC. GAB acknowledges support from the Intramural Research Program of the National Institutes of Health (USA).
Conflict of Interest
The authors declare that the research was conducted in the absence of any commercial or financial relationships that could be construed as a potential conflict of interest.
Publisher’s Note
All claims expressed in this article are solely those of the authors and do not necessarily represent those of their affiliated organizations, or those of the publisher, the editors and the reviewers. Any product that may be evaluated in this article, or claim that may be made by its manufacturer, is not guaranteed or endorsed by the publisher.
Acknowledgments
The authors are indebted to all the colleagues in the field for illuminating discussions. JF is the incumbent of the R. Phelan Chair in Translational Liver Research.
Supplementary Material
The Supplementary Material for this article can be found online at: https://www.frontiersin.org/articles/10.3389/fimmu.2021.748423/full#supplementary-material
References
2. Costa-Pereira AP, Tininini S, Strobl B, Alonzi T, Schlaak JF, Is'harc H, et al. Mutational Switch of an IL-6 Response to an Interferon-γ-Like Response. Proc Natl Acad Sci USA (2002) 99:8043–7. doi: 10.1073/pnas.122236099
3. Garbers C, Hermanns HM, Schaper F, Müller-Newen G, Grötzinger J, Rose-John S, et al. Plasticity and Cross-Talk of Interleukin 6-Type Cytokines. Cytokine Growth Factor Rev (2012) 23:85–97. doi: 10.1016/j.cytogfr.2012.04.001
4. Basak S, Hoffmann A. Crosstalk via the NF-kappaB Signaling System. Cytokine Growth Factor Rev (2008) 19:187–97. doi: 10.1016/j.cytogfr.2008.04.005
5. Rawlings JS, Rosler KM, Harrison DA. The JAK/STAT Signaling Pathway. J Cell Sci (2004) 117:1281–3. doi: 10.1242/jcs.00963
6. Antebi YE, Linton JM, Klumpe H, Bintu B, Gong M, Su C, et al. Combinatorial Signal Perception in the BMP Pathway. Cell (2017) 170:1184–5. doi: 10.1016/j.cell.2017.08.015
7. Kotenko SV, Langer JA. Full House: 12 Receptors for 27 Cytokines. Int Immunopharmacol (2004) 4:593–608. doi: 10.1016/j.intimp.2004.01.003
8. Moraga I, Spangler J, Mendoza JLJL, Garcia KC. Multifarious Determinants of Cytokine Receptor Signaling Specificity. Adv Immunol (2014) 121:1–39. doi: 10.1016/B978-0-12-800100-4.00001-5
9. Kinzer-Ursem TL, Sutton KL, Waller A, Omann GM, Linderman JJ. Multiple Receptor States Are Required to Describe Both Kinetic Binding and Activation of Neutrophils via N-Formyl Peptide Receptor Ligands. Cell Signal (2006) 18(10):1732–47. doi: 10.1016/j.cellsig.2006.01.014
10. Wilmes S, Beutel O, Li Z, Francois-Newton V, Richter CP, Janning D, et al. Receptor Dimerization Dynamics as a Regulatory Valve for Plasticity of Type I Interferon Signaling. J Cell Biol (2015) 209:579–93. doi: 10.1083/jcb.201412049
11. Schreiber G, Piehler J. The Molecular Basis for Functional Plasticity in Type I Interferon Signaling. Trends Immunol (2015) 36:139–49. doi: 10.1016/j.it.2015.01.002
12. Thompson GL, Canals M, Poole DP. Biological Redundancy of Endogenous GPCR Ligands in the Gut and the Potential for Endogenous Functional Selectivity. Front Pharmacol (2014) 5:1–24. doi: 10.3389/fphar.2014.00262
13. Ozaki K, Leonard WJ. Cytokine and Cytokine Receptor Pleiotropy and Redundancy. J Biol Chem (2002) 277:29355–8. doi: 10.1074/jbc.R200003200
14. Wootten D, Christopoulos A, Marti-Solano M, Babu MM, Sexton PM. Mechanisms of Signalling and Biased Agonism in G Protein-Coupled Receptors. Nat Rev Mol Cell Biol (2018) 19:638–53. doi: 10.1038/s41580-018-0049-3
15. Salanga CL, O’Hayre M, Handel T. Modulation of Chemokine Receptor Activity Through Dimerization and Crosstalk. Cell Mol Life Sci (2009) 66:1370–86. doi: 10.1007/s00018-008-8666-1
16. Borden EC. Interferons α and β in Cancer: Therapeutic Opportunities From New Insights. Nat Rev Drug Discov (2019) 18:219–34. doi: 10.1038/s41573-018-0011-2
17. Fish EN, Platanias LC. Interferon Receptor Signaling in Malignancy: A Network of Cellular Pathways Defining Biological Outcomes. Mol Cancer Res (2014) 12:1691–703. doi: 10.1158/1541-7786.MCR-14-0450
18. Piehler J, Thomas C, Garcia KC, Schreiber G. Structural and Dynamic Determinants of Type I Interferon Receptor Assembly and Their Functional Interpretation. Immunol Rev (2012) 250:317–34. doi: 10.1111/imr.12001
19. Delgoffe GM, Vignali DAA. STAT Heterodimers in Immunity. Jak-Stat (2013) 2:e23060. doi: 10.4161/jkst.23060
20. Altan-Bonnet G, Mukherjee R. Cytokine-Mediated Communication: A Quantitative Appraisal of Immune Complexity. Nat Rev Immunol (2019) 19:205–17. doi: 10.1038/s41577-019-0131-x
21. Hadjadj J, Yatim N, Barnabei L, Corneau A, Boussier J, Smith N, et al. Impaired Type I Interferon Activity and Inflammatory Responses in Severe COVID-19 Patients. Science (2020) 369(6504):718–24. doi: 10.1126/science.abc6027
22. Spiegel M, Pichlmair A, Martinez-Sobrido L, Cros J, Garcia-Sastre A, Haller O, et al. Inhibition of Beta Interferon Induction by Severe Acute Respiratory Syndrome Coronavirus Suggests a Two-Step Model for Activation of Interferon Regulatory Factor 3. J Virol (2005) 79:2079–86. doi: 10.1128/JVI.79.4.2079-2086.2005
23. Haller O, Kochs G, Weber F. The Interferon Response Circuit: Induction and Suppression by Pathogenic Viruses. Virology (2006) 344:119–30. doi: 10.1016/j.virol.2005.09.024
24. Blanco-Melo D, Nilsson-Payant BE, Liu WC, Uhl S, Hoagland D, Møller R, et al. Imbalanced Host Response to SARS-CoV-2 Drives Development of COVID-19. Cell (2020) 181:1036–1045.e9. doi: 10.1016/j.cell.2020.04.026
25. García-Sastre A. Ten Strategies of Interferon Evasion by Viruses. Cell Host Microbe (2017) 22:176–84. doi: 10.1016/j.chom.2017.07.012
26. Hoagland DA, Møller R, Uhl SA, Oishi K, Frere J, Golynker I, et al. Leveraging the Antiviral Type I Interferon System as a First Line of Defense Against SARS-CoV-2 Pathogenicity. Immunity (2021) 54(3):557–70.e5. doi: 10.1016/j.immuni.2021.01.017
27. Borden EC, Sen GC, Uze G, Silverman RH, Ransohoff RM, Foster GR, et al. Interferons at Age 50: Past, Current and Future Impact on Biomedicine. Nat Rev Drug Discov (2007) 6:975–90. doi: 10.1038/nrd2422
28. Platanias LC, Fish EN. Signaling Pathways Activated by Interferons. Exp Hematol (1999) 27:1583–92. doi: 10.1016/S0301-472X(99)00109-5
29. Schreiber G. The Molecular Basis for Differential Type I Interferon Signaling. J Biol Chem (2017) 292:7285–94. doi: 10.1074/jbc.R116.774562
30. Bogdan C. The Function of Type I Interferons in Antimicrobial Immunity. Curr Opin Immunol (2000) 12:419–24. doi: 10.1016/S0952-7915(00)00111-4
31. Bolen CR, Ding S, Robek MD, Kleinstein SH. Dynamic Expression Profiling of Type I and Type III Interferon-Stimulated Hepatocytes Reveals a Stable Hierarchy of Gene Expression. Hepatology (2014) 59:1262–72. doi: 10.1002/hep.26657
32. Mostafavi S, Yoshida H, Moodley D, Leboité H, Rothamel K, Raj T, et al. Parsing the Interferon Transcriptional Network and Its Disease Associations. Cell (2016) 164:564–78. doi: 10.1016/j.cell.2015.12.032
33. Brierley MM, Fish EN. Stats: Multifaceted Regulators of Transcription. J Interf Cytokine Res (2005) 25:733–44. doi: 10.1089/jir.2005.25.733
34. Damdinsuren B, Nagano H, Wada H, Kondo M, Ota H, Nakamura M, et al. Stronger Growth-Inhibitory Effect of Interferon (IFN)-β Compared to IFN-α Is Mediated by IFN Signaling Pathway in Hepatocellular Carcinoma Cells. Int J Oncol (2007) 30:201–8. doi: 10.3892/ijo.30.1.201
35. Moraga I, Harari D, Schreiber G, Uzé G, Pellegrini S. Receptor Density Is Key to the Alpha2/Beta Interferon Differential Activities. Mol Cell Biol (2009) 29:4778–87. doi: 10.1128/MCB.01808-08
36. Marijanovic Z, Ragimbeau J, van der Heyden J, Uzé G, Pellegrini S. Comparable Potency of Ifnα2 and Ifnβ on Immediate JAK/STAT Activation But Differential Down-Regulation of IFNAR2. Biochem J (2007) 407:141–51. doi: 10.1042/BJ20070605
37. Severa M, Remoli ME, Giacomini E, Ragimbeau J, Lande R, Uzé G, et al. Differential Responsiveness to IFN-Alpha and IFN-Beta of Human Mature DC Through Modulation of IFNAR Expression. J Leukoc Biol (2006) 79:1286–94. doi: 10.1189/jlb.1205742
38. Jaitin DA, Roisman LC, Jaks E, Gavutis M, Piehler J, Van der Heyden J, et al. Inquiring Into the Differential Action of Interferons (IFNs): An IFN-α2 Mutant With Enhanced Affinity to IFNAR1 Is Functionally Similar to IFN-β. Mol Cell Biol (2006) 26:1888–97. doi: 10.1128/MCB.26.5.1888-1897.2006
39. Thomas C, Moraga I, Levin D, Krutzik PO, Podoplelova Y, Trejo A, et al. Structural Linkage Between Ligand Discrimination and Receptor Activation by Type I Interferons. Cell (2011) 146:621–32. doi: 10.1016/j.cell.2011.06.048
40. Jaks E, Gavutis M, Uzé G, Martal J, Piehler J. Differential Receptor Subunit Affinities of Type I Interferons Govern Differential Signal Activation. J Mol Biol (2007) 366:525–39. doi: 10.1016/j.jmb.2006.11.053
41. Lavoie TB, Kalie E, Crisafulli-Cabatu S, Abramovich R, DiGioia G, Moolchan K, et al. Binding and Activity of All Human Alpha Interferon Subtypes. Cytokine (2011) 56:282–9. doi: 10.1016/j.cyto.2011.07.019
42. Makowska Z, Duong FH, Trincucci G, Tough DF, Heim MH. Interferon-β and Interferon-λ Signaling Is Not Affected by Interferon-Induced Refractoriness to Interferon-α In Vivo. Hepatology (2011) 53:1154–63. doi: 10.1002/hep.24189
43. Pan M, Kalie E, Scaglione BJ, Raveche ES, Schreiber G, Langer JA, et al. Mutation of the IFNAR-1 Receptor Binding Site of Human IFN-Alpha2 Generates Type I IFN Competitive Antagonists. Biochemistry (2008) 47:12018–27. doi: 10.1021/bi801588g
44. Kalie E, Jaitin DA, Podoplelova Y, Piehler J, Schreiber G. The Stability of the Ternary Interferon-Receptor Complex Rather Than the Affinity to the Individual Subunits Dictates Differential Biological Activities. J Biol Chem (2008) 283:32925–36. doi: 10.1074/jbc.M806019200
45. Levin D, Harari D, Schreiber G. Stochastic Receptor Expression Determines Cell Fate Upon Interferon Treatment. Mol Cell Biol (2011) 31:3252–66. doi: 10.1128/MCB.05251-11
46. Francois-Newton V, de Freitas Almeida GM, Payelle-Brogard B, Monneron D, Pichard-Garcia L, Piehler J, et al. USP18-Based Negative Feedback Control Is Induced by Type I and Type III Interferons and Specifically Inactivates Interferon α Response. PloS One (2011) 6(7):e22200. doi: 10.1371/journal.pone.0022200
47. Sistigu A, Yamazaki T, Vacchelli E, Chaba K, Enot DP, Adam J, et al. Cancer Cell-Autonomous Contribution of Type I Interferon Signaling to the Efficacy of Chemotherapy. Nat Med (2014) 20:1301–9. doi: 10.1038/nm.3708
48. Sarasin-Filipowicz M, Wang X, Yan M, Duong FHT, Poli V, Hilton DJ, et al. Alpha Interferon Induces Long-Lasting Refractoriness of JAK-STAT Signaling in the Mouse Liver Through Induction of USP18/UBP43. Mol Cell Biol (2009) 29:4841–51. doi: 10.1128/MCB.00224-09
49. Piganis RAR, De Weerd NA, Gould JA, Schindler CW, Mansell A, Nicholson SE, et al. Suppressor of Cytokine Signaling (SOCS) 1 Inhibits Type I Interferon (IFN) Signaling via the Interferon α Receptor (IFNAR1)-Associated Tyrosine Kinase Tyk2. J Biol Chem (2011) 286:33811–8. doi: 10.1074/jbc.M111.270207
50. Malakhova OA, Kim KI, Luo JK, Zou W, Kumar KGS, Fuchs SY, et al. UBP43 Is a Novel Regulator of Interferon Signaling Independent of Its ISG15 Isopeptidase Activity. EMBO J (2006) 25:2358–67. doi: 10.1038/sj.emboj.7601149
51. Santin I, Moore F, Grieco FA, Marchetti P, Brancolini C, Eizirik D, et al. USP18 Is a Key Regulator of the Interferon-Driven Gene Network Modulating Pancreatic Beta Cell Inflammation and Apoptosis. Cell Death Dis (2012) 3:e419–11. doi: 10.1038/cddis.2012.158
52. Francois-Newton V, Livingstone M, Payelle-Brogard B, Uzé G, Pellegrini S. USP18 Establishes the Transcriptional and Anti-Proliferative Interferon α/β Differential. Biochem J (2012) 446:509–16. doi: 10.1042/BJ20120541
53. Fathi S, Nayak CR, Feld JJ, Zilman AG. Absolute Ligand Discrimination by Dimeric Signaling Receptors. Biophys J (2016) 111:917–20. doi: 10.1016/j.bpj.2016.07.029
54. François P, Altan-Bonnet G. The Case for Absolute Ligand Discrimination: Modeling Information Processing and Decision by Immune T Cells. J Stat Phys (2016) 162:1130–52. doi: 10.1007/s10955-015-1444-1
55. Moraga I, Wernig G, Wilmes S, Gryshkova V, Richter CP, Hong W-J, et al. Tuning Cytokine Receptor Signaling by Re-Orienting Dimer Geometry With Surrogate Ligands. Cell (2015) 160:1196–208. doi: 10.1016/j.cell.2015.02.011
56. Mckeithan TW. Kinetic Proofreading in T-Cell Receptor Signal Transduction. Immunology (1995) 92:5042–6. doi: 10.1073/pnas.92.11.5042
57. Freed DM, Bessman NJ, Kiyatkin A, Salazar-Cavazos E, Byrne PO, Moore JO, et al. EGFR Ligands Differentially Stabilize Receptor Dimers to Specify Signaling Kinetics. Cell (2017) 171:683–695.e18. doi: 10.1016/j.cell.2017.09.017
58. Kholodenko BN, Hancock JF, Kolch W. Signalling Ballet in Space and Time. Nat Rev Mol Cell Biol (2010) 11:414–26. doi: 10.1038/nrm2901
59. Purvis JE, Lahav G. Encoding and Decoding Cellular Information Through Signaling Dynamics. Cell (2013) 152:945–56. doi: 10.1016/j.cell.2013.02.005
60. Minas G, Woodcock DJ, Ashall L, Harper C, White MRH, Rand DA, et al. Multiplexing Information Flow Through Dynamic Signalling Systems. PloS Comput Biol (2020) 16(8):e1008076. doi: 10.1371/journal.pcbi.1008076
61. Kirby D, Rothschild J, Smart M, Zilman A. Pleiotropy Enables Specific and Accurate Signaling in the Presence of Ligand Cross Talk. Phys Rev E (2021) 103:42401. doi: 10.1103/PhysRevE.103.042401
62. De Weerd NA, Nguyen T. The Interferons and Their Receptors-Distribution and Regulation. Immunol Cell Biol (2012) 90:483–91. doi: 10.1038/icb.2012.9
63. Lopez CF, Muhlich JL, Bachman JA, Sorger PK. Programming Biological Models in Python Using PySB. Mol Syst Biol (2013) 9:1–19. doi: 10.1038/msb.2013.1
64. Shockley EM, Vrugt JA, Lopez CF. PyDREAM: High-Dimensional Parameter Inference for Biological Models in Python. Bioinformatics (2018) 34:695–7. doi: 10.1093/bioinformatics/btx626
65. Lauffenburger DA, Linderman J. Receptors: Models for Binding, Trafficking, and Signaling. New York:Oxford University Press (1993).
66. Nelson DL, Lehninger AL, Cox MM. Principles of Biochemistry. 5th. New York:W H Freeman & Co (2008).
67. Bell G. Models for the Specific Adhesion of Cells to Cells. Sci (80-.) (1978) 200:618–27. doi: 10.1126/science.347575
68. Yang J, Hlavacek WS. Scaffold-Mediated Nucleation of Protein Signaling Complexes: Elementary Principles. Math Biosci (2011) 232:164–73. doi: 10.1016/j.mbs.2011.06.003
69. Roisman LC, Jaitin DA, Baker DP, Schreiber G. Mutational Analysis of the IFNAR1 Binding Site on Ifnα2 Reveals the Architecture of a Weak Ligand-Receptor Binding-Site. J Mol Biol (2005) 353:271–81. doi: 10.1016/j.jmb.2005.08.042
70. Moraga I, Richter D, Wilmes S, Winkelmann H, Jude K, Thomas C, et al. Instructive Roles for Cytokine-Receptor Binding Parameters in Determining Signaling and Functional Potency. Sci Signal (2015) 8:1–17. doi: 10.1126/scisignal.aab2677
71. Unal E, Ozdemir MA, King DS, Moraga I, Ulirsch JC, Yuan D, et al. Functional Selectivity in Cytokine Signaling Revealed Through a Pathogenic EPO Mutation. Cell (2017) 168:1053–64.e15. doi: 10.1016/j.cell.2017.02.026
72. Gutenkunst RN, Waterfall JJ, Casey FP, Brown KS, Myers CR, Sethna JP, et al. Universally Sloppy Parameter Sensitivities in Systems Biology Models. PloS Comput Biol (2007) 3:1871–8. doi: 10.1371/journal.pcbi.0030189
73. Brown KS, Sethna JP. Statistical Mechanical Approaches to Models With Many Poorly Known Parameters. Phys Rev E - Stat Physics Plasmas Fluids Relat Interdiscip Top (2003) 68:9. doi: 10.1103/PhysRevE.68.021904
74. Wagner TC, Velichko S, Chesney SK, Biroc S, Harde D, Vogel D, et al. Interferon Receptor Expression Regulates the Antiproliferative Effects of Interferons on Cancer Cells and Solid Tumors. Int J Cancer (2004) 111:32–42. doi: 10.1002/ijc.20236
75. Booy S, van Eijck CHJ, Dogan F, van Koetsveld PM, Hofland LJ. Influence of Type-I Interferon Receptor Expression Level on the Response to Type-I Interferons in Human Pancreatic Cancer Cells. J Cell Mol Med (2014) 18:492–502. doi: 10.1111/jcmm.12200
76. Lundberg E, Gry M, Oksvold P, Kononen J, Andersson-Svahn H, Pontén F, et al. The Correlation Between Cellular Size and Protein Expression Levels - Normalization for Global Protein Profiling. J Proteomics (2008) 71:448–60. doi: 10.1016/j.jprot.2008.06.014
77. Monroe JG, Cambier JC. Sorting of B Lymphoblasts Based Upon Cell Diameter Provides Cell Populations Enriched in Different Stages of Cell Cycle. J Immunol Methods (1983) 63:45–56. doi: 10.1016/0022-1759(83)90208-9
78. Fenner JE, Starr R, Cornish AL, Zhang JG, Metcalf D, Schreiber RD, et al. Suppressor of Cytokine Signaling 1 Regulates the Immune Response to Infection by a Unique Inhibition of Type I Interferon Activity. Nat Immunol (2006) 7:33–9. doi: 10.1038/ni1287
79. Jetka T, Nienałtowski K, Winarski T, Błoński S, Komorowski M. Information-Theoretic Analysis of Multivariate Single-Cell Signaling Responses. PloS Comput Biol (2019) 15:1–23. doi: 10.1371/journal.pcbi.1007132
80. Chatterjee MS, Purvis JE, Brass LF, Diamond SL. Pairwise Agonist Scanning Predicts Cellular Signaling Responses to Combinatorial Stimuli. Nat Biotechnol (2010) 28:727–32. doi: 10.1038/nbt.1642
81. Kok F, Rosenblatt M, Teusel M, Nizharadze T, Magalhães VG, Dächert C, et al. Disentangling Molecular Mechanisms Regulating Sensitization of Interferon Alpha Signal Transduction. Mol Syst Biol (2020) 16:1–32. doi: 10.15252/msb.20198955
82. Urin V, Shemesh M, Schreiber G. CRISPR/Cas9-Based Knockout Strategy Elucidates Components Essential for Type 1 Interferon Signaling in Human HeLa Cells. J Mol Biol (2019) 431:3324–38. doi: 10.1016/j.jmb.2019.06.007
83. Maiwald T, Schneider A, Busch H, Sahle S, Gretz N, Weiss TS, et al. Combining Theoretical Analysis and Experimental Data Generation Reveals IRF9 as a Crucial Factor for Accelerating Interferon-α Induced Early Antiviral Signalling. FEBS J (2010) 277:4741–54. doi: 10.1111/j.1742-4658.2010.07880.x
84. Marzen S, Garcia HG, Phillips R. Statistical Mechanics of Monod-Wyman-Changeux (MWC) Models. J Mol Biol (2013) 425:1433–60. doi: 10.1016/j.jmb.2013.03.013
85. Cattoni DI, Chara O, Kaufman SB, Flecha FLG. Cooperativity in Binding Processes: New Insights From Phenomenological Modeling. PloS One (2015) 10:1–14. doi: 10.1371/journal.pone.0146043
86. Mesev EV, LeDesma RA, Ploss A, Decoding type I. And III Interferon Signalling During Viral Infection. Nat Microbiol (2019) 4:914–24. doi: 10.1038/s41564-019-0421-x
87. Li P, Elowitz MB. Communication Codes in Developmental Signaling Pathways. Dev (2019) 146:1–12. doi: 10.1242/dev.170977
88. Lucarelli P, Schilling M, Kreutz C, Vlasov A, Boehm ME, Iwamoto N, et al. Resolving the Combinatorial Complexity of Smad Protein Complex Formation and Its Link to Gene Expression. Cell Syst (2018) 6:75–89.e11. doi: 10.1016/j.cels.2017.11.010
89. Cappuccio A, Zollinger R, Schenk M, Walczak A, Servant N, Barillot E, et al. Combinatorial Code Governing Cellular Responses to Complex Stimuli. Nat Commun (2015) 6:6847. doi: 10.1038/ncomms7847
Keywords: type I interferon (IFN) signaling, functional plasticity, signal processing, cellular decision making, ligand specificity
Citation: Kirby D, Parmar B, Fathi S, Marwah S, Nayak CR, Cherepanov V, MacParland S, Feld JJ, Altan-Bonnet G and Zilman A (2021) Determinants of Ligand Specificity and Functional Plasticity in Type I Interferon Signaling. Front. Immunol. 12:748423. doi: 10.3389/fimmu.2021.748423
Received: 27 July 2021; Accepted: 14 September 2021;
Published: 07 October 2021.
Edited by:
Alexander Hoffmann, University of California, Los Angeles, United StatesReviewed by:
Gideon Schreiber, Weizmann Institute of Science, IsraelVeronika Zarnitsyna, Emory University, United States
Copyright © 2021 Kirby, Parmar, Fathi, Marwah, Nayak, Cherepanov, MacParland, Feld, Altan-Bonnet and Zilman. This is an open-access article distributed under the terms of the Creative Commons Attribution License (CC BY). The use, distribution or reproduction in other forums is permitted, provided the original author(s) and the copyright owner(s) are credited and that the original publication in this journal is cited, in accordance with accepted academic practice. No use, distribution or reproduction is permitted which does not comply with these terms.
*Correspondence: Anton Zilman, zilmana@physics.utoronto.ca
†Present address:Chitra R. Nayak, Department of Physics, Tuskegee University, Tuskegee, AL, United States