
95% of researchers rate our articles as excellent or good
Learn more about the work of our research integrity team to safeguard the quality of each article we publish.
Find out more
ORIGINAL RESEARCH article
Front. Immunol. , 21 December 2021
Sec. Autoimmune and Autoinflammatory Disorders
Volume 12 - 2021 | https://doi.org/10.3389/fimmu.2021.742080
This article is part of the Research Topic Towards Precision Medicine for Immune-Mediated Disorders: Advances in Using Big Data and Artificial Intelligence to Understand Heterogeneity in Inflammatory Responses View all 19 articles
 Xuanfu Chen1
 Lingjuan Jiang2
 Wei Han3
 Xiaoyin Bai1
 Gechong Ruan1
 Mingyue Guo1
 Runing Zhou1
 Haozheng Liang1
 Hong Yang1*
 Jiaming Qian1
Infliximab (IFX) is an effective medication for ulcerative colitis (UC) patients. However, one-third of UC patients show primary non-response (PNR) to IFX. Our study analyzed three Gene Expression Omnibus (GEO) datasets and used the RobustRankAggreg (RRA) algorithm to assist in identifying differentially expressed genes (DEGs) between IFX responders and non-responders. Then, an artificial intelligence (AI) technology, artificial neural network (ANN) analysis, was applied to validate the predictive value of the selected genes. The results showed that the combination of CDX2, CHP2, HSD11B2, RANK, NOX4, and VDR is a good predictor of patients’ response to IFX therapy. The range of repeated overall area under the receiver-operating characteristic curve (AUC) was 0.850 ± 0.103. Moreover, we used an independent GEO dataset to further verify the value of the six DEGs in predicting PNR to IFX, which has a range of overall AUC of 0.759 ± 0.065. Since protein detection did not require fresh tissue and can avoid multiple biopsies, our study tried to discover whether the key information, analyzed by RNA levels, is suitable for protein detection. Therefore, immunohistochemistry (IHC) staining of colonic biopsy tissues from UC patients treated with IFX and a receiver-operating characteristic (ROC) analysis were used to further explore the clinical application value of the six DEGs at the protein level. The IHC staining of colon tissues from UC patients confirmed that VDR and RANK are significantly associated with IFX efficacy. Total IHC scores lower than 5 for VDR and lower than 7 for RANK had an AUC of 0.828 (95% CI: 0.665–0.991, p = 0.013) in predicting PNR to IFX. Collectively, we identified a predictive RNA model for PNR to IFX and explored an immune-related protein model based on the RNA model, including VDR and RANK, as a predictor of IFX non-response, and determined the cutoff value. The result showed a connection between the RNA and protein model, and both two models were available. However, the composite signature of VDR and RANK is more conducive to clinical application, which could be used to guide the preselection of patients who might benefit from pharmacological treatment in the future.
Ulcerative colitis (UC) is a chronic relapsing inflammatory disease of the colonic mucosa. UC is a relapsing disease requiring long-term management throughout life. The mainstay therapies for UC include 5-aminosalicylates, glucocorticoids, immunosuppressants, and biologic agents (1, 2). Biologic drugs, including antitumor necrosis factor (TNF)-α agents, anti-integrin drugs (vedolizumab), Janus kinase inhibitors (tofacitinib), and interleukin-12/23 antibodies (ustekinumab) (3), have driven UC therapy to a new era. The anti-TNF-α agent infliximab (IFX) is the oldest and most widely used biologic agent.
A meta-analysis showed that IFX was the highest-ranking biologic agent for the induction of clinical remission (OR 4.10, 95% CI: 2.58–6.52) and mucosal healing in moderate to severe UC (4, 5). However, according to previous studies, nearly one-third of UC patients show primary non-response (PNR). Moreover, studies have shown that other biologic agents have a higher failure rate in patients who previously failed to respond to IFX treatment than in those who are naïve to anti-TNF treatment (6, 7). Furthermore, the time PNR patients spend on IFX therapy can delay treatment, increase the risk of disease aggravation, and increase the economic burden of UC. Therefore, it is crucial to distinguish between PNR and effective responses to IFX treatment. Predictions of non-responses to IFX can assist the accurate selection of patients who could experience a clinical benefit and avoid potential adverse effects and unnecessary financial investment. Thus, an approach to identify markers from common, accessible samples, such as tissue biopsies or blood samples, is needed.
Previous studies have demonstrated that the therapeutic response depends on clinical factors, serum markers, and host genetics. Brandse et al. found that a high baseline serum level of C-reactive protein (CRP) was associated with lower serum concentrations of IFX, leading to non-response (8). Arias et al. identified a panel of serum markers (pANCA, CRP, and albumin) as independent predictors of the long-term outcome following IFX therapy in UC patients (9). Nevertheless, these indexes mainly related to disease activity and imperfectly predicted the primary therapeutic response to IFX (10). Burke et al. showed that genetic polymorphisms have predictive value for PNR to anti-TNF therapy in UC patients (11). Moreover, a high pretreatment expression of oncostatin M (OSM) was associated with anti-TNF resistance (12). However, the signatures of anti-TNF non-response mentioned above need further external clinical validation.
In the present study, we aimed to identify the specific markers underlying the PNR to IFX using combined datasets. Due to the expense of RNA sequencing, the RNA-seq dataset was small, and we used the bootstrapping method to randomly resample (13, 14). The first step to developing a predictor for clinical application is to find a repeatable result. We used an artificial intelligence (AI) technology, artificial neural network (ANN) analysis, to validate whether these data might be useful in estimating PNR. We repeated this process multiple times to validate the results. Moreover, we used another independent RNA dataset to confirm the result. Furthermore, an immunohistochemistry staining of colon tissue from UC patients who underwent IFX therapy was performed to explore the clinical application at the protein level. Ultimately, the findings of this work provide a greater understanding of which patients might receive therapeutic benefit from IFX therapy.
This study acquired clinical data and mRNA expression profiles of colon tissue from adult patients with UC from the Gene Expression Omnibus (GEO) database (https://www.ncbi.nlm.nih.gov/geo/). By using the keywords “ulcerative colitis” or “UC” and “IFX” or “infliximab,” a total of eight series associated with UC treated by IFX were identified. After review, we selected three datasets (GSE12251, GSE16879, and GSE23597) containing the therapeutic efficacy of different dosages of IFX (15–18) as a discovery cohort. The platform used for the three datasets was the GPL570 [HG-U133_Plus_2] Affymetrix Human Genome U133 Plus 2.0 Array. The selected patients all underwent colonoscopy, and biopsies of the diseased colon were performed before IFX therapy. Since the most commonly used dose of IFX in the clinic is 5 mg/kg and to maintain consistency among the three datasets, we selected patients who received a 5-mg/kg dose of IFX from the three datasets. Finally, 25 UC patients who responded to the first IFX treatment and 25 UC patients who exhibited PNR were included. The response was assessed in week 8 in the GSE12251 and GSE23597 datasets after the first infliximab treatment, and in weeks 4–6 in the GSE16879 dataset. The response definition was complete mucosal healing with a Mayo endoscopic subscore of 0 or 1 and a histological score of 0 or 1. An independent cohort from GEO (GSE73661) was used for further validation, which contained eight primary IFX responders and 15 non-responders. The response was assessed in weeks 4–6 in the GSE73661 dataset. The platform of the GSE73661 dataset was the GPL6244 [HuGene-1_0-st].
The pre-IFX-therapy-sequencing data of the obtained patients were extracted from the GSE12251, GSE16879, and GSE23597 datasets. UC patients who responded or did not respond to a 5-mg/kg dose of IFX at the first follow-up were selected and divided into the response group and PNR group. The limma R package (http://www.bioconductor.org/) was used to filter the Differentially Expressed Genes (DEGs) in each dataset. The same analysis was done in the validation cohort, the GSE73661 dataset. DEGs were defined as both an adjusted p-value < 0.05 and |log fold change (logFC)| > 0.5. The TXT files of all DEGs of the discovery datasets were sorted by logFC and saved for the subsequent integration analysis.
The three TXT files of all DEGs sorted by logFC were aggregated using the RobustRankAggreg (RRA) R package (https://CRAN.R-project.org/package=RobustRa-nkAggreg). The aggregated DEGs from all datasets, including upregulated and downregulated DEGs, were saved for subsequent analysis.
We selected aggregated upregulated and downregulated genes with a p-value lower than 0.05. Then, we ranked the genes by the logFC in order from the largest to the smallest. We reviewed the significant protein-coding DEGs and sorted out the genes expression in the alimentary tract through NCBI (https://www.ncbi.nlm.nih.gov/). We then reviewed published papers to determine genes which associate with immune activities to construct a list of proteins linked to the efficacy of IFX. Subsequently, we used the GSE16879 dataset, which contained sequencing data before and after IFX therapy, to determine the relationship between the selected protein-coding genes and IFX. Since the fewer indicators included, the higher the economic benefits obtained, we tried to find a better combination of DEGs.
The subjects in the response group and PNR group were resampled by the “bootstrap” method. The dataset was randomly resampled to 250 by the proportion of the two groups (with replacement, i.e., when an item is sampled, it is immediately returned) (13). The samples from the resampling were analyzed by an ANN to show the efficiency of the model. To confirm the stability of the model, we repeated the resampling and ANN analysis 500 times. The process was also performed by shielding one input randomly. The range of area under the receiver-operating characteristic curve (AUC) was calculated. The same analysis parameters of ANN were used to verify the prediction ability of the selected DEGs in the validation dataset.
Patients with UC receiving IFX monotherapy were enrolled from 2017 to 2020 at the Peking Union Medical College Hospital (PUMCH). Twenty-four UC patients were selected. The diagnostic criteria were based on the third European Crohn’s and Colitis Organization (ECCO) consensus guideline for UC and the 2018 Chinese consensus for inflammatory bowel disease (19, 20). We evaluated their clinical data at baseline, week 6, and week 14 after therapy. The response to IFX in week 6 was defined as a decrease in the partial Mayo score (Mayo score without endoscopy) of at least three points and at least 30% compared with the baseline data (21). A response in week 14 was defined as a decrease in the Mayo score of at least three points and at least 30% less than the baseline value, and the rectal bleeding score should decrease by more than 1 point or be equal to 0 or 1 point. The colonoscopic biopsies before the first IFX treatment of these patients were used for the immunohistochemistry (IHC) staining to verify the effectiveness of the obtained genes at the protein level. All colonic biopsy samples and clinical data of the patients used in this study were carried out with the approval of the Peking Union Medical College Hospital and the Chinese Academy Medical Science Ethics Committee (S-K1142).
We performed IHC staining off of the target proteins in formalin-fixed, paraffin-embedded colon tissues. The antigens were retrieved by boiling the samples for 10 min in 10 mM citrate (pH 6.0) or EDTA antigen repair solution (pH 9.0) (ZSGB-BIO). The slides were stained with rabbit monoclonal antibodies (Cell Signaling) and then incubated with a peroxidase-conjugated secondary antibody. Finally, the signals were visualized with diaminobenzidine (DAB) peroxidase substrate kit (Servicebio).
A flowchart of the IHC scoring and analysis is shown in Figure 1. The IHC staining was semiquantitatively evaluated by rating both the extent and intensity. First, we randomly selected 10 visual fields (×40) under a light microscope and counted 100 cells in each visual field. Then, we rated the extent as the proportion of positive cells on a scale from 0 to 4 as follows: 0, <1%; 1, 1% to 25%; 2, 26% to 50%; 3, 51% to 75%; and 4, ≥76%. Moreover, the intensity of the immunoreactivity (IR) was rated on a scale from 0 to 3 as follows: 0, no IR; 1, weak IR; 2, moderate IR; and 3, strong IR (Table 1) (22). We defined the IHC score of each protein as the mean value of the extent or intensity score in each visual field. The IHC scoring was analyzed independently by two gastroenterologists who were blinded to the patients’ response to IFX.
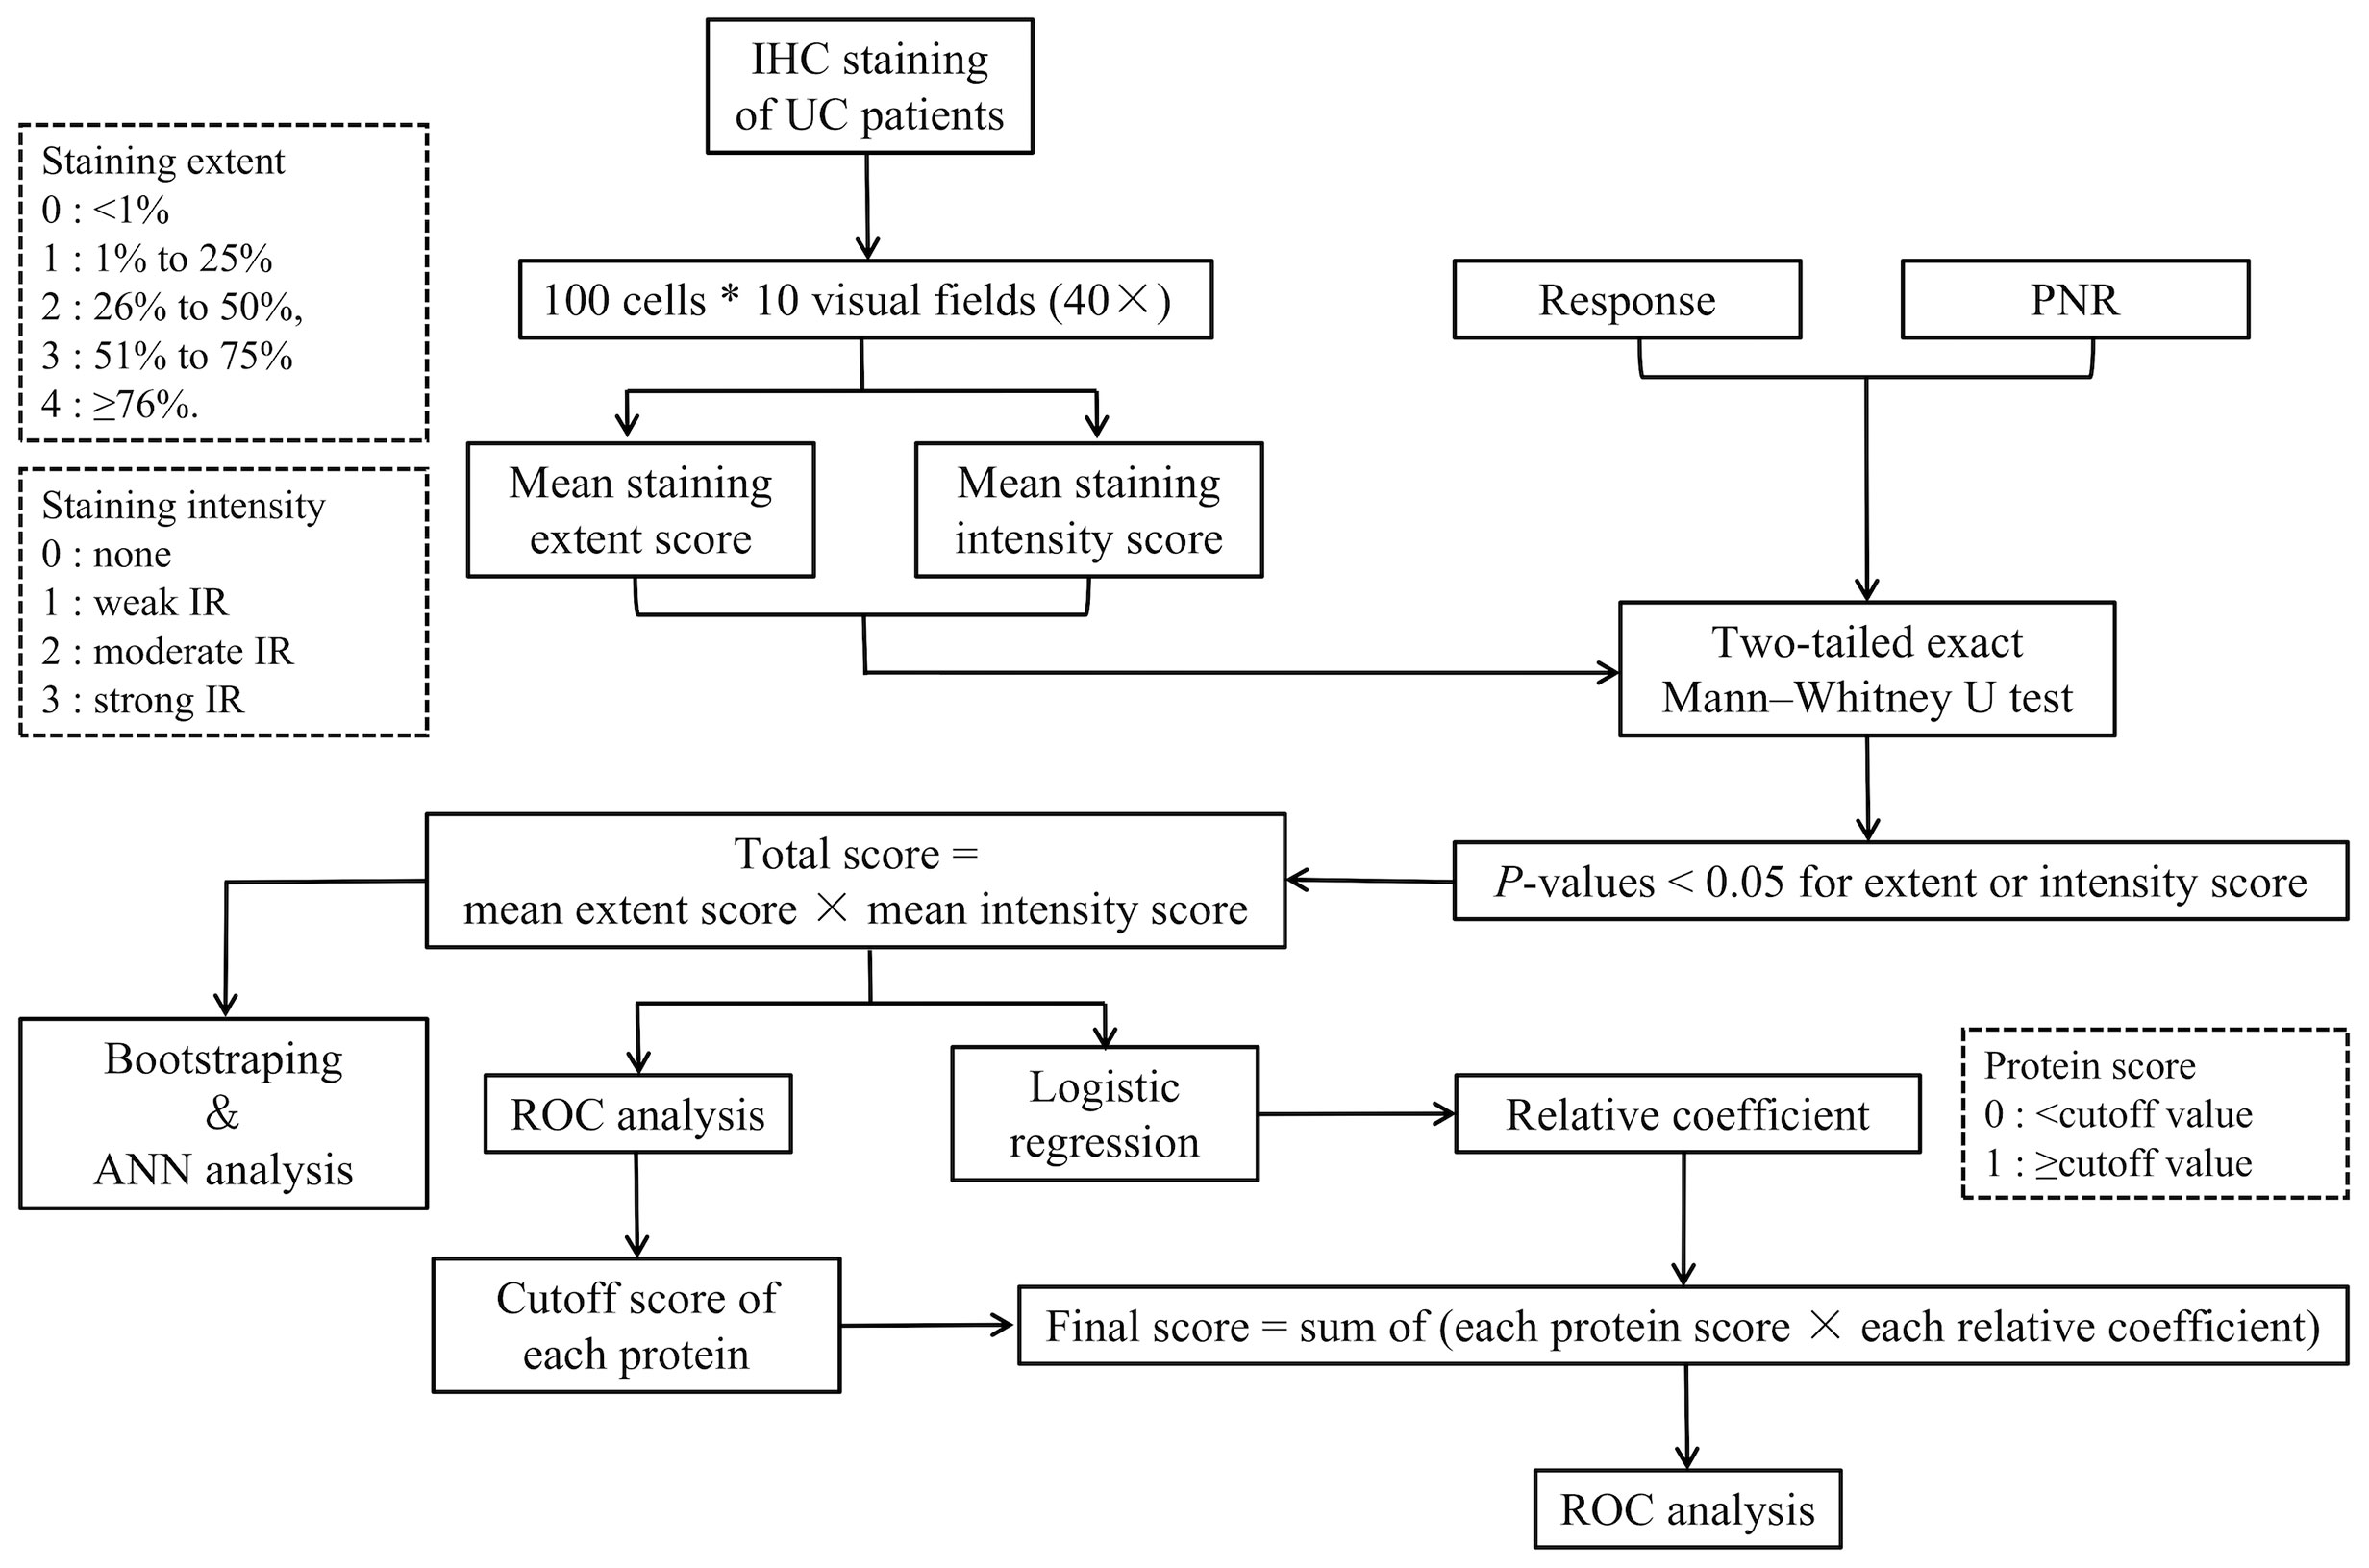
Figure 1 Flowchart of the IHC scoring and analysis. IHC, immunohistochemistry; PNR, primary non-response; ANN analysis, artificial neural network analysis; ROC, receiver-operating characteristic.
Additionally, we used a two-tailed exact Mann–Whitney U test (non-parametric) to compare the IHC score between the responders and non-responders. Any variable with a p-values lower than 0.05 in its extent or intensity scores was included in the multivariate analysis. Then, we defined the total score of each subject as the product of the mean extent and intensity score of each protein as follows:
Moreover, we used the bootstrap method and an ANN analysis to show the efficiency of the combination of the selected proteins in predicting IFX efficacy. The resampling and ANN analysis process were repeated 500 times. The range of AUCs was calculated to measure the results of ANN analysis of the proteins in predicting the therapeutic effect of IFX in week 6 and week 14.
To achieve the threshold of distinction between a response and PNR, we divided the cutoff value of the total IHC score of each included protein by an ROC analysis. Moreover, the protein score was defined as 1 when the total IHC score was greater than or equal to the cutoff value and 0 when the total IHC score was lower than the cutoff value. Then, we used a logistic regression to calculate the relative coefficient of the IHC score of the proteins. We divided the regression coefficient of the other variables by the minimum regression coefficient and rounded the result to obtain the score of each variable. The product of the relative coefficient and protein score was obtained, and the sum of the products was defined as the final predictive score. An ROC curve was plotted to estimate the value of the selected proteins in predicting the therapeutic effect of IFX.
Non-parametric analyses were used to estimate the differences between the IFX response and non-response groups. The statistical tests were two-tailed and described in the figure legends. ROC curves were used to test the prediction value. All p-values less than 0.05 were considered significant. All analyses and the graph creation were performed in SPSS (version 25.0, IBM Corporation, Chicago, USA), R software (version 3.5.2, R Foundation for Statistical Computing, Vienna, Austria), and MATLAB (R2019a, MathWorks, USA).
According to the inclusion criteria for the sequencing data before 5 mg/kg IFX therapy, we extracted UC patients who were primary IFX responders or non-responders from the GSE12251, GSE16879, and GSE23597 datasets. The GSE12251 dataset included four responders and seven non-responders, the GSE16879 dataset contained eight responders and 16 non-responders, and the GSE23597 dataset included 13 responders and two non-responders (Table 2). The DEGs were screened using the limma R package (adjusted p-value < 0.05 and |logFC| > 0.5). The GSE12251 dataset contained 2,335 DEGs, including 1,346 upregulated genes and 989 downregulated genes. Furthermore, 934 upregulated genes and 852 downregulated genes were included in the GSE16879 dataset, resulting in a total of 1,786 DEGs in this dataset. Finally, the GSE23597 dataset contained 3,497 DEGs, including 1,390 upregulated genes and 2,107 downregulated genes. The DEGs in the three datasets are shown in Table 3 and Figure 2.

Figure 2 DEGs between responders and non-responders in each dataset shown in volcano plots. (A) Volcano plot of the GSE12251 dataset; (B) volcano plot of the GSE16879 dataset; and (C) volcano plot of the GSE23597 dataset. The red dots represented upregulated genes based on a p-value < 0.05 and logFC > 0.5; the green dots represented downregulated genes based on a p-value < 0.05 and logFC<-0.5; the black spots represented genes with no significant difference in expression. DEGs, differentially expressed genes; logFC, log-fold change.
The aggregated DEGs were screened by the RRA package (p-value < 0.05, |logFC| > 0.5). This method was based on the RRA algorithm in which each gene in each dataset was randomly arranged. If a gene ranked higher in all datasets, the associated p-value was lower, indicating that the possibility of this gene being a DEG was greater in all datasets. Using the RRA method, 624 integrated DEGs were identified, consisting of 18 upregulated genes and 606 downregulated genes. We selected the aggregated upregulated and downregulated DEGs by an associated p-value lower than 0.05, ranked the logFC in order from the largest to the smallest, identified the protein-coding genes, and determined the gene expression in the gastrointestinal tract by NCBI. Among the upregulated genes, those with low expression in the normal gastrointestinal tract were selected, while among the downregulated genes, those with high expression in the normal gastrointestinal tract were selected. We then reviewed published papers to consider proteins linked to immune or inflammatory processes. Ultimately, five downregulated proteins associated with PNR, including CDX2, CHP2, HSD11B2, RANK, and VDR, were selected; one upregulated protein, NOX4, was chosen. Furthermore, we used the GSE16879 dataset, which contained RNA sequencing data both before and after IFX treatment, to determine the relationship between the selected DEGs and IFX therapy. We found that 1) the non-responders to IFX tended to have a lower pretreatment expression of the downregulated DEGs compared with the responders; 2) the posttreatment expression of the downregulated DEGs displayed a trend of increases in the responders; and 3) the expression of the downregulated DEGs after treatment in those who responded to IFX was higher than that in those who did not respond to IFX. This phenomenon was the opposite in the upregulated DEG NOX4 (Figure 3). Thus, the following six proteins were ultimately selected for the construction of the predictive model of IFX efficacy: CDX2, CHP2, HSD11B2, RANK, NOX4, and VDR (Figure 4). CDX2, CHP2, HSD11B2, RANK, and VDR showed decreased expression in the non-responders, while NOX4 showed increased expression.
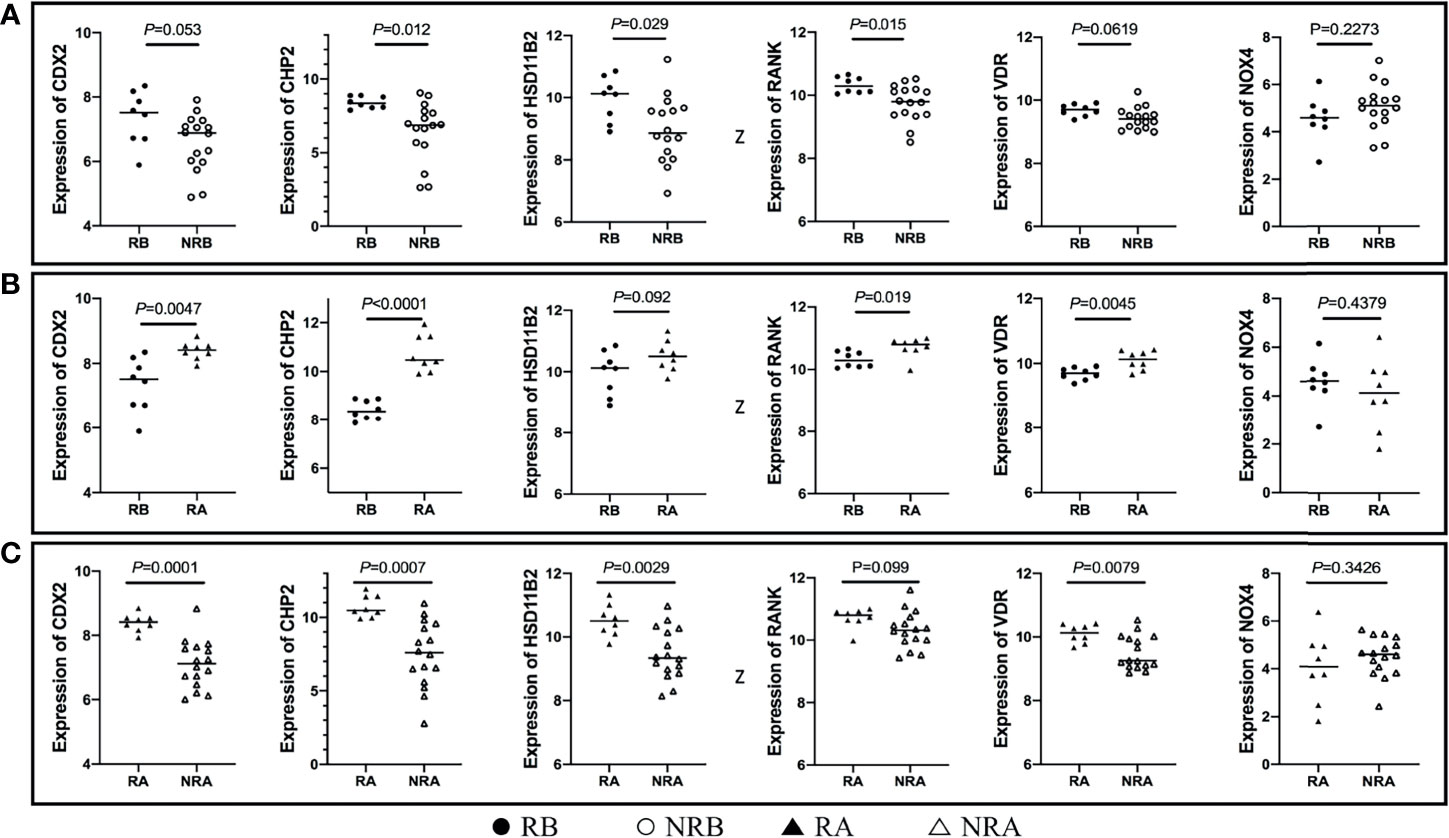
Figure 3 DEG expression in different stages of IFX treatment. (A) The non-responders of IFX tended to have a lower pretreatment expression of the downregulated DEGs compared with the responders, and NOX4 displayed the opposite results; (B) the posttreatment expression of the downregulated DEGs exhibited a trend of increases in the responders, and NOX4 exhibited the opposite results; (C) the expression of the downregulated DEGs after treatment in those who responded to IFX was higher than that those who did not respond to IFX, and NOX4 exhibited the opposite results. DEGs, differentially expressed genes; IFX, infliximab; RB, sequencing data of responders before IFX therapy; NRB, sequencing data of non-responders before IFX therapy; RA, sequencing data of responders after IFX therapy; NRA, sequencing data of non-responders after IFX therapy.
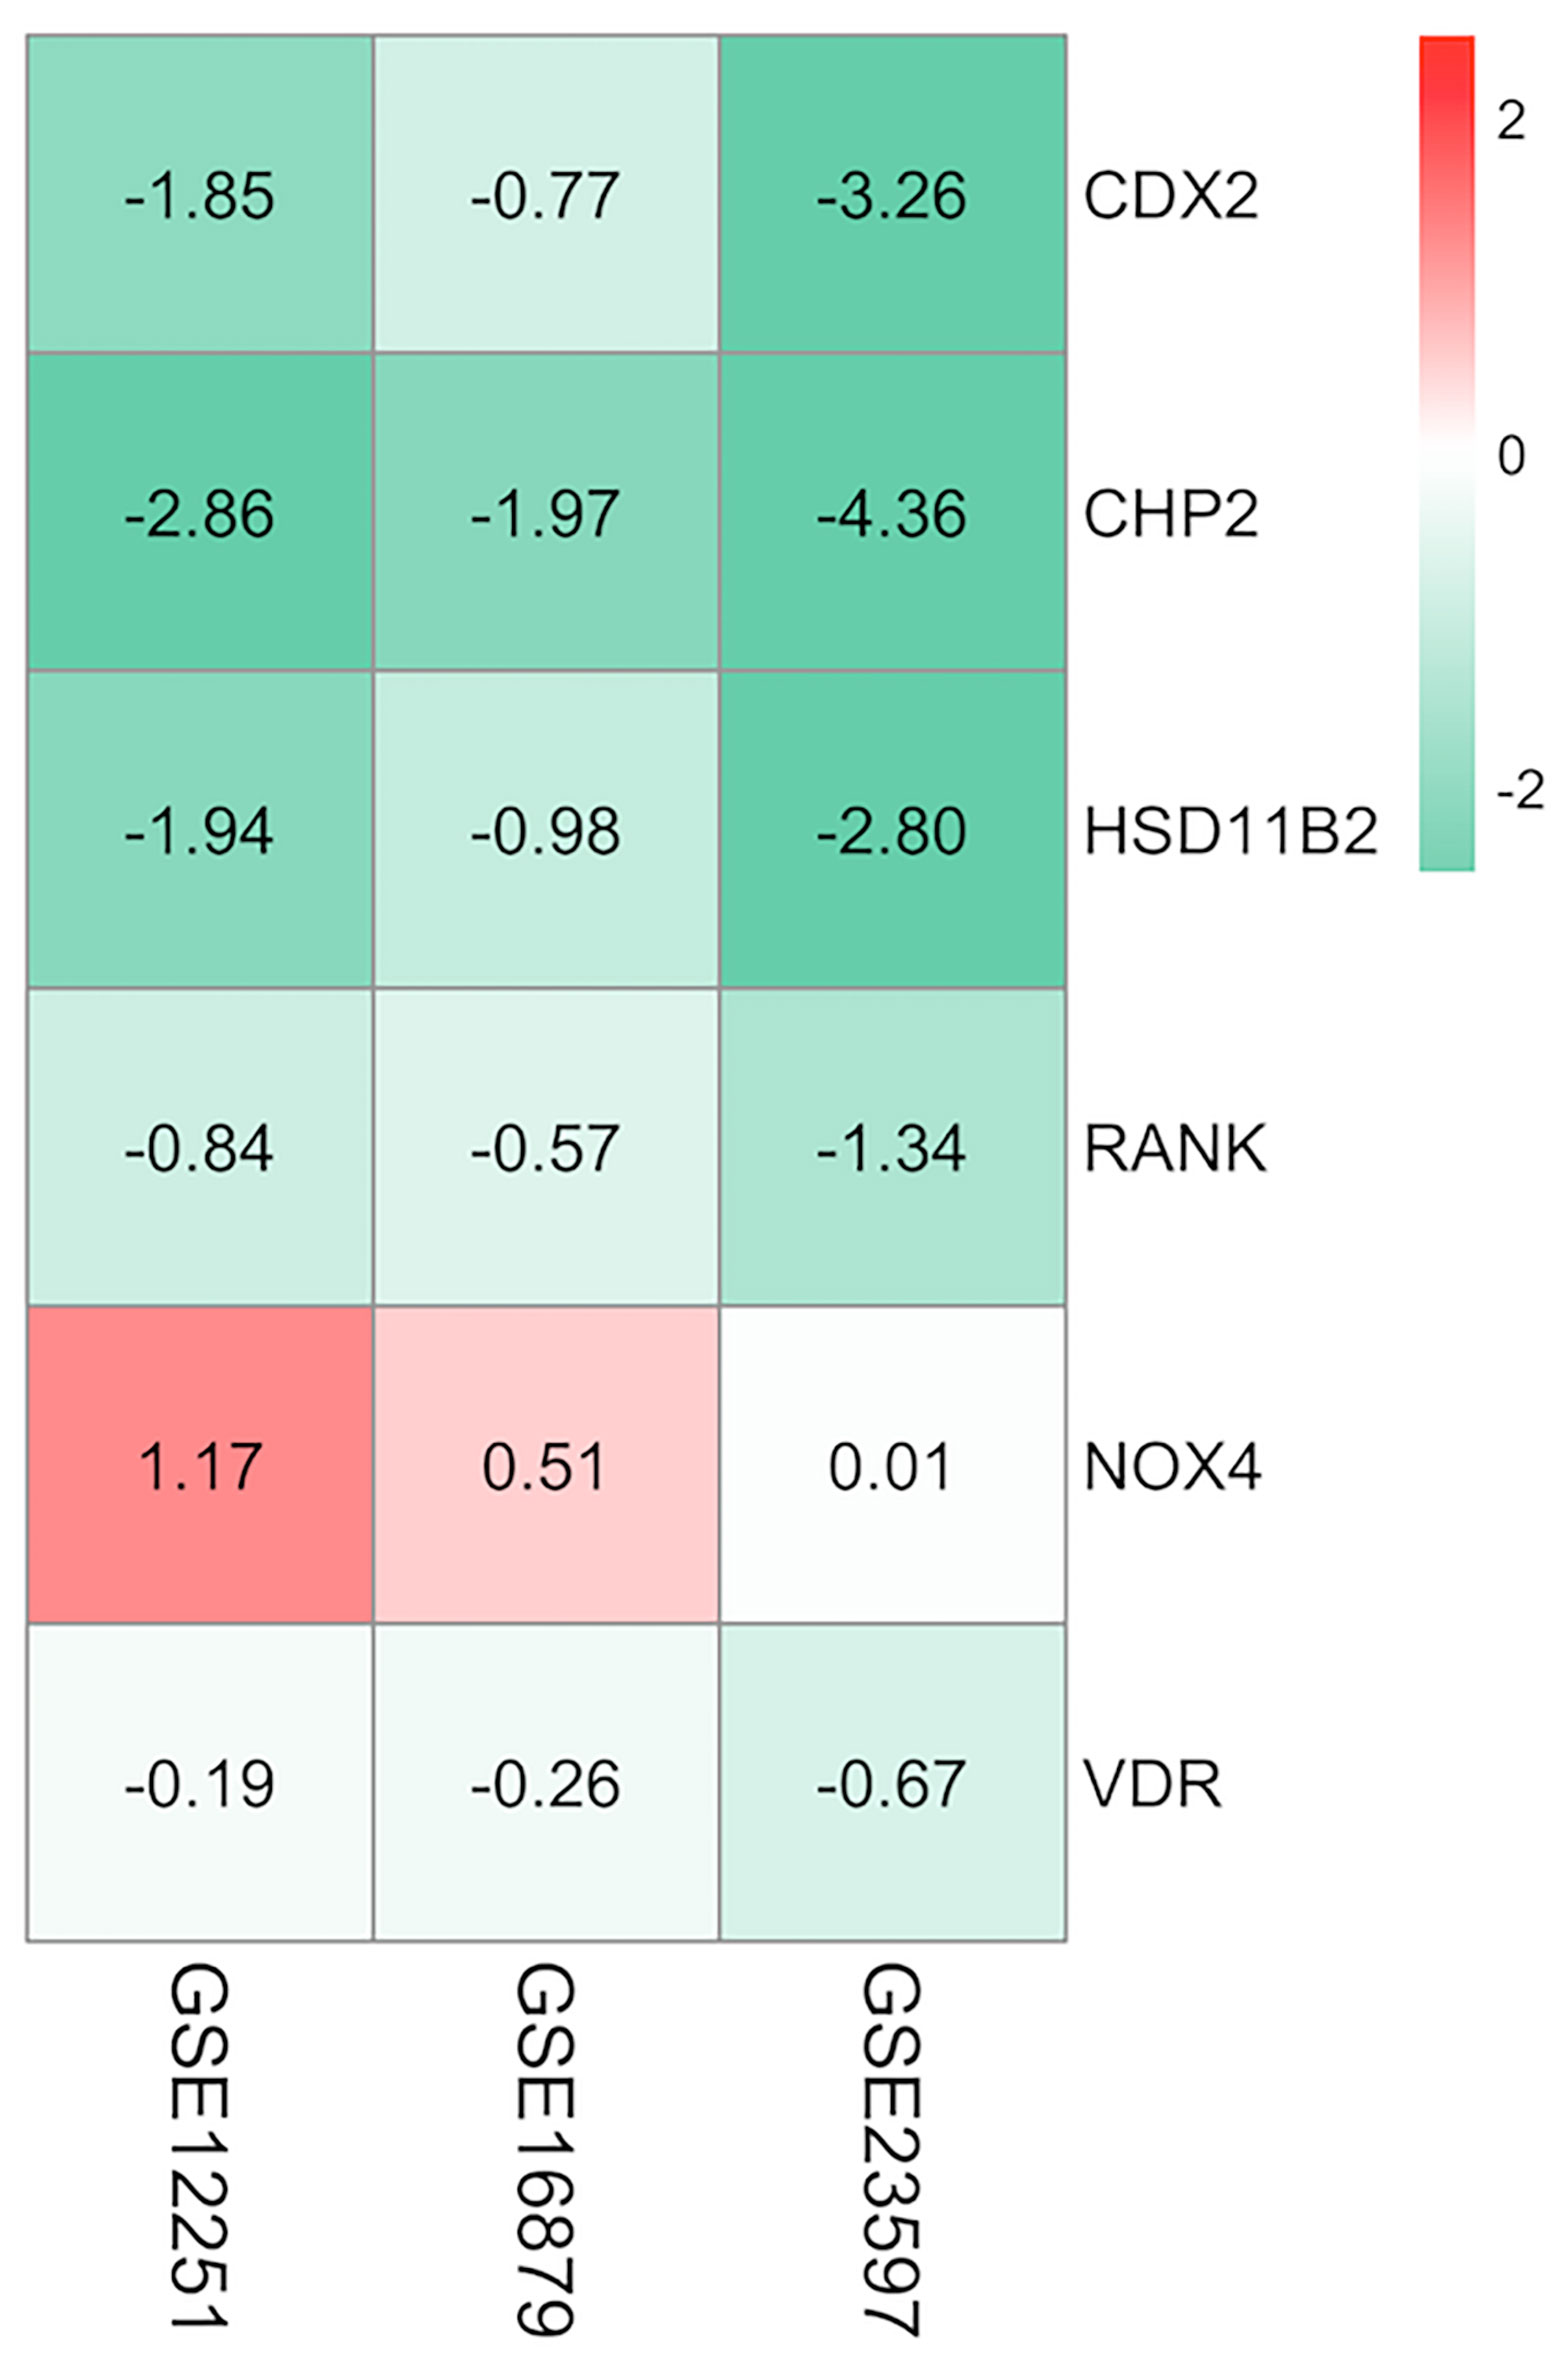
Figure 4 Heatmap of the selected proteins. CDX2, CHP2, HSD11B2, RANK, and VDR displayed decreased expression, while NOX4 displayed increased expression; the red color represented logFC > 0, the green color represented logFC < 0 and the value in the box represented the logFC value. logFC, log fold change.
We used the bootstrap method to randomly resample the response group (n = 25) and PNR group (n = 25) and enlarge the sample size to 250 in proportion of the two groups. Bootstrapping can reduce heterogeneity in different sample populations and avoid the problem of sample reduction caused by cross validation. Then, we used the resampled dataset to perform an ANN analysis (23, 24). The ANN analysis weighed the importance of the selected proteins, thus predicting the effect on achieving response to IFX therapy. Based on the collection of connected units, ANN loosely mimics neurons in the real brain. Each connection works as synapses in a biological brain. ANN can convey signals from one artificial neuron to another. Then, artificial neurons that receive signals can transmit these signals and signal additional artificial neurons connected to them. In typical ANN applications, the signals at a connection between artificial neurons are actual numbers and the outputs of each artificial neuron are calculated by a non-linear function of the sum of its inputs. Artificial neurons and their connections have a weight that adjusts as learning proceeds. The weight enhances or reduces the power of the signals at a connection in the ANN. ANN incorporates a system of interconnections based on simple mathematical models associated with learning algorithms. ANN consists of a four-layer (one input layer, two hidden layers, and one output layer) feedforward analysis. To develop the ANN, cases were randomly assigned to a training set (70%), test set (15%), and verification set (15%) through a generator of random numbers in our study. Backpropagation of error was applied as a learning rule by the online training method. The synaptic weights were calculated after each training data record.
As the more included the indicators, the higher economic burden for application, we tried different combinations of DEGs to find a better small protein combination. We performed the resampling and ANN analysis 500 times by selecting all integrated DEGs, top 300, top 100, top 50, and the six selected DEGs. The process was also performed by shielding one input randomly based on the six selected DEGs. The range of the repeated overall AUC of the six selected DEGs was 0.850 ± 0.103, which was similar to the different combination of the top DEGs (Figure 5A and Supplementary Table 1) and was slightly higher than that of the shielding-one-DEG model based on the six selected DEGs (Figure 5B and Table 4). The results showed that the six-DEG model had good economic benefits and performed better in predicting the IFX response. The repeated results demonstrated that the model was stable. We also performed an ANN analysis in the independent GEO dataset (GSE73661). The results showed that the range of repeated overall AUC was 0.759 ± 0.065, indicating that the model was feasible.
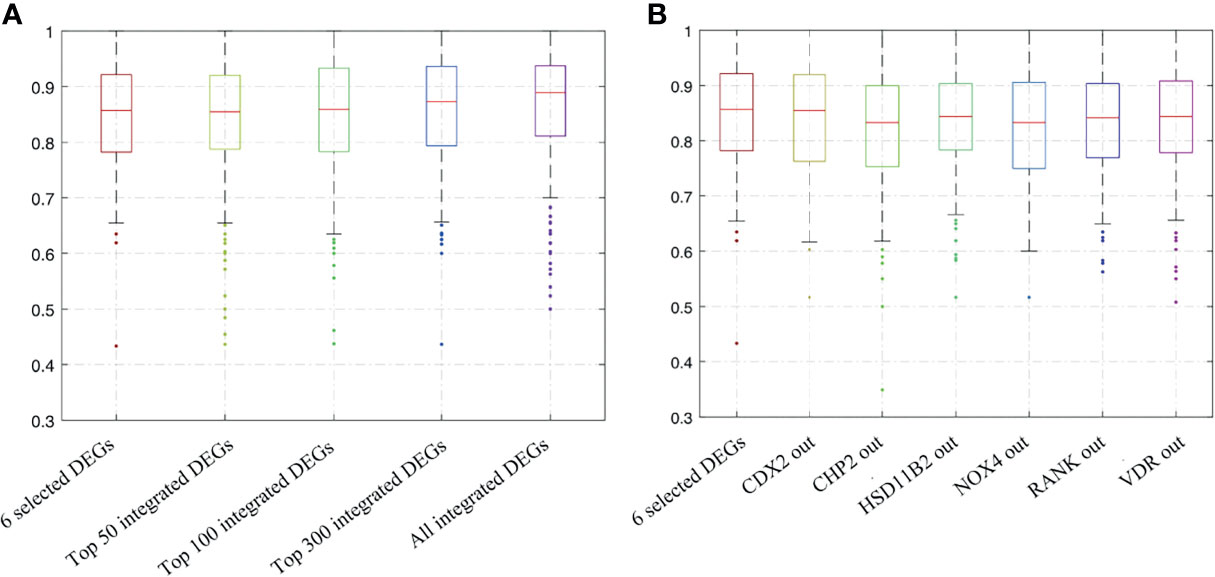
Figure 5 Bootstrapping and ANN analysis results of the top DEGs, the six selected DEGs, and shielding of one DEG randomly based on the latter. (A) Analysis results of all integrated DEGs, top 300, top 100, top 50, and the six selected DEGs; (B) analysis results of shielding of one input randomly based on the six selected DEGs. ANN analysis, artificial neural network analysis; DEGs, differentially expressed genes.
Biopsies are usually taken for pathological examination when UC patients undergo colonoscopy in the clinic. IHC analysis of clinical residual paraffin sections can avoid multiple biopsies and reduce the examination cost and time of patients. Thus, we tried to discover whether the key information, analyzed by RNA levels, is suitable for protein level detection. We used IHC analysis to explore the protein expression based on the selected DEGs and find clinical application predictors. Twenty-four UC patients were recruited from 2017 to 2020 at the Peking Union Medical College Hospital. Among these patients, 70.8% (n = 17) clinically responded to IFX treatment by week 6, and 29.2% (n = 7) did not. In addition, 54.17% (n = 13) of the patients achieved therapeutic benefits by week 14, while 45.83% (n = 11) did not. The proteins predicting IFX efficacy were evaluated by IHC scoring (Figure 6) without knowledge of the clinical data. After the analysis, CHP2, HSD11B2, RANK, and VDR were found to have reduced mean IHC extent and intensity scores in the non-response group, and NOX4 had increased scores, which is consistent with the results of the analysis of the GEO datasets, while CDX2 had a limited difference between the groups. VDR and RANK statistically significantly differed between the two groups in terms of the intensity scores (p-value <0.05), and VDR showed a trend-level difference in terms of the extent scores (p-value = 0.065) (Tables 5, 6). These two proteins were selected for further analysis.
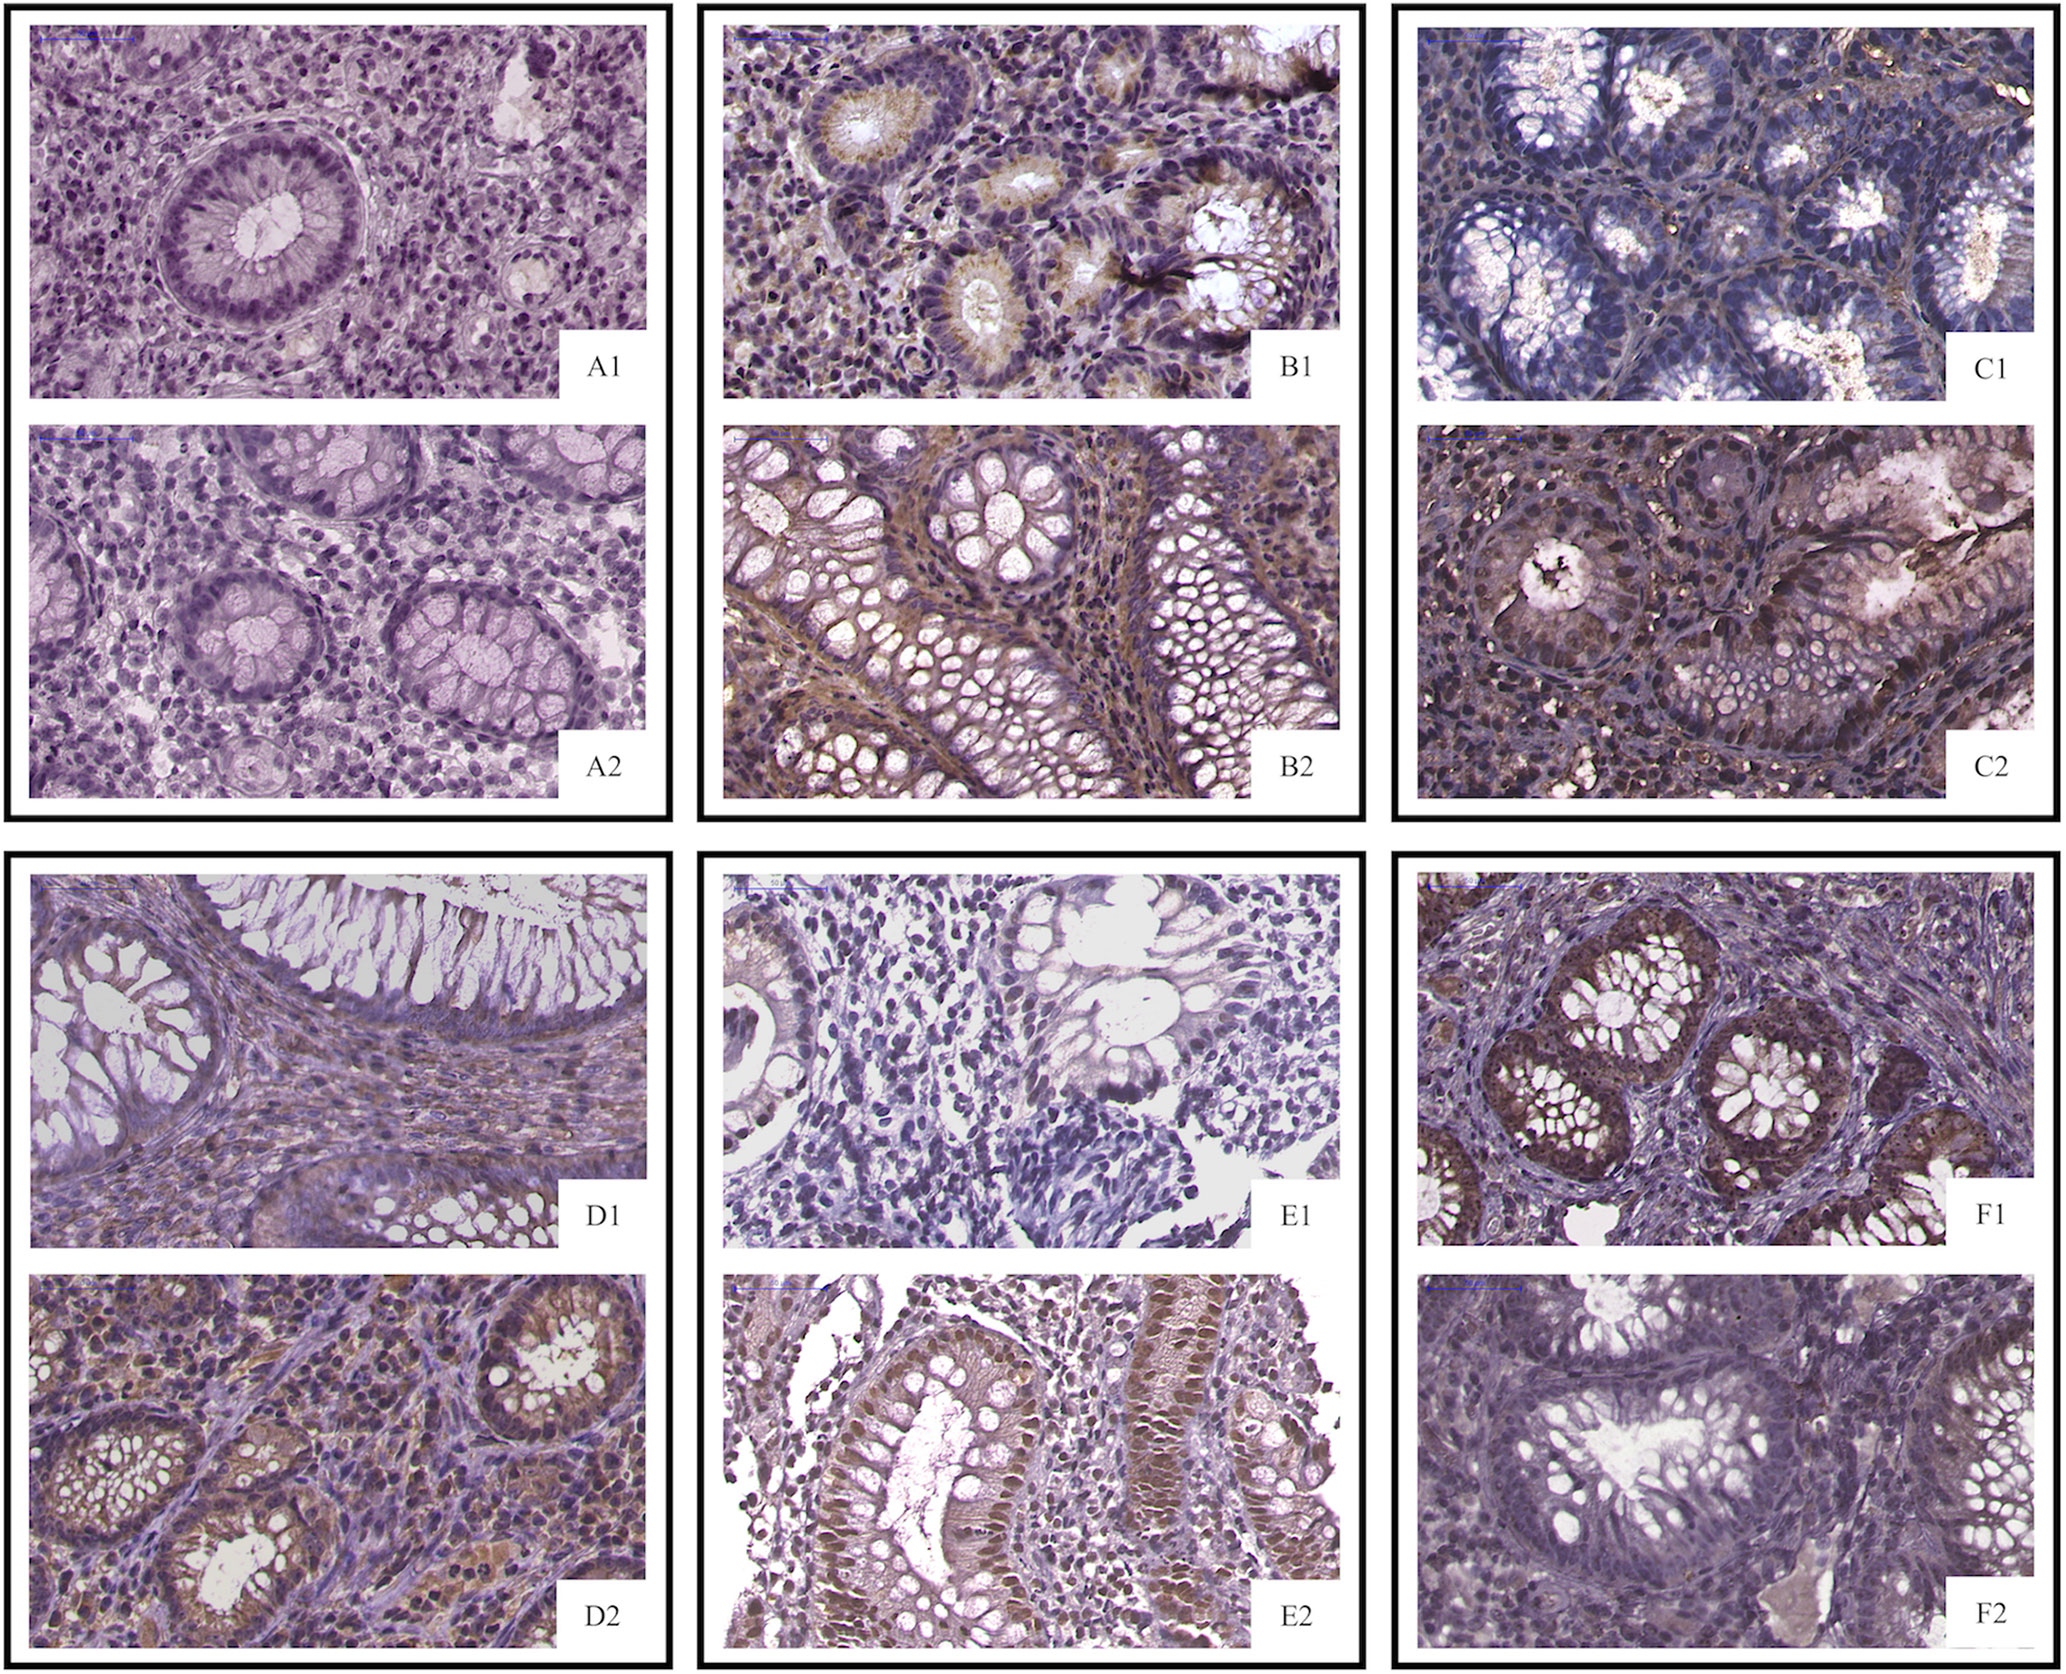
Figure 6 IHC staining of selected proteins. (A1, PNR; A2, response) CDX2 did not differ between the primary IFX non-responders and responders; (B1, PNR; B2, response) CHP2 (C1, PNR; C2, response), HSD11B2 (D1, PNR; D2, response), RANK (E1, PNR; E2, response), and VDR staining was decreased in the primary non-responders, while NOX4 (F1, PNR; F2, response) was increased in the non-responders. PNR, primary non-response.
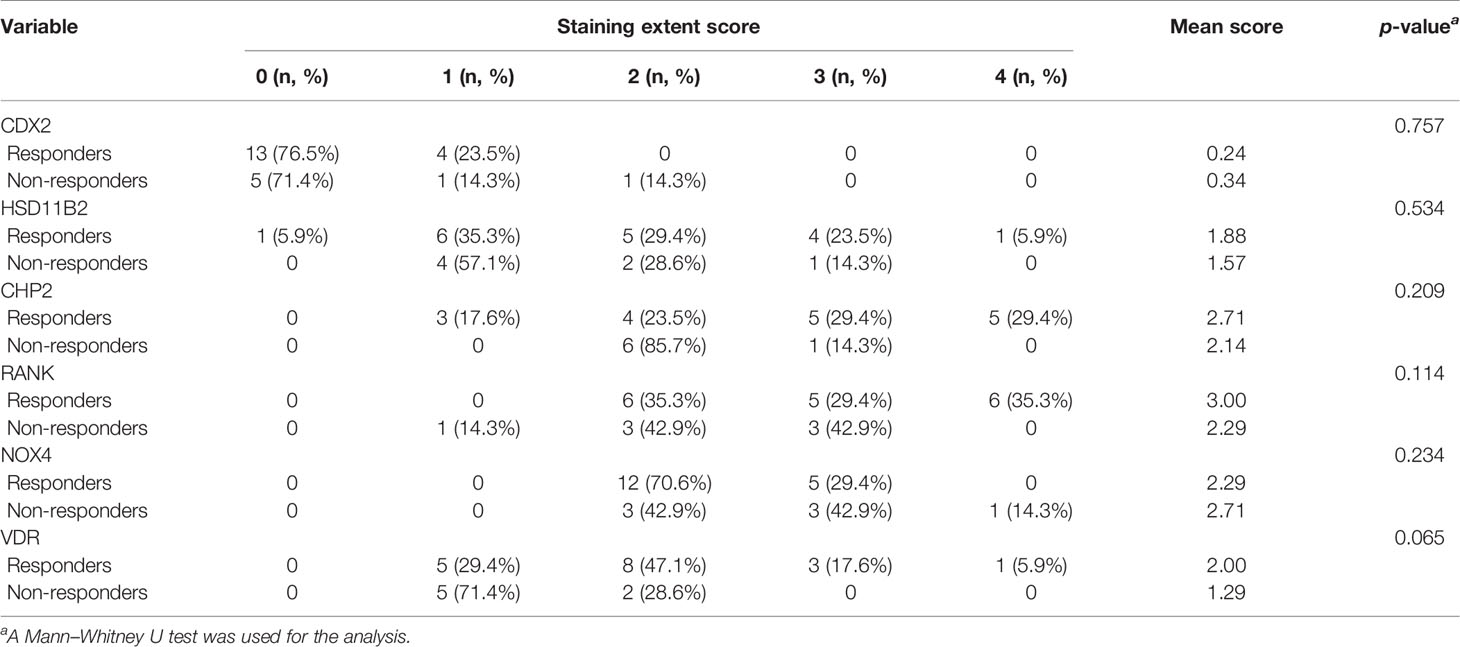
Table 5 The extent of the staining of IFX efficacy-predicting proteins in colonic biopsies from UC patients.
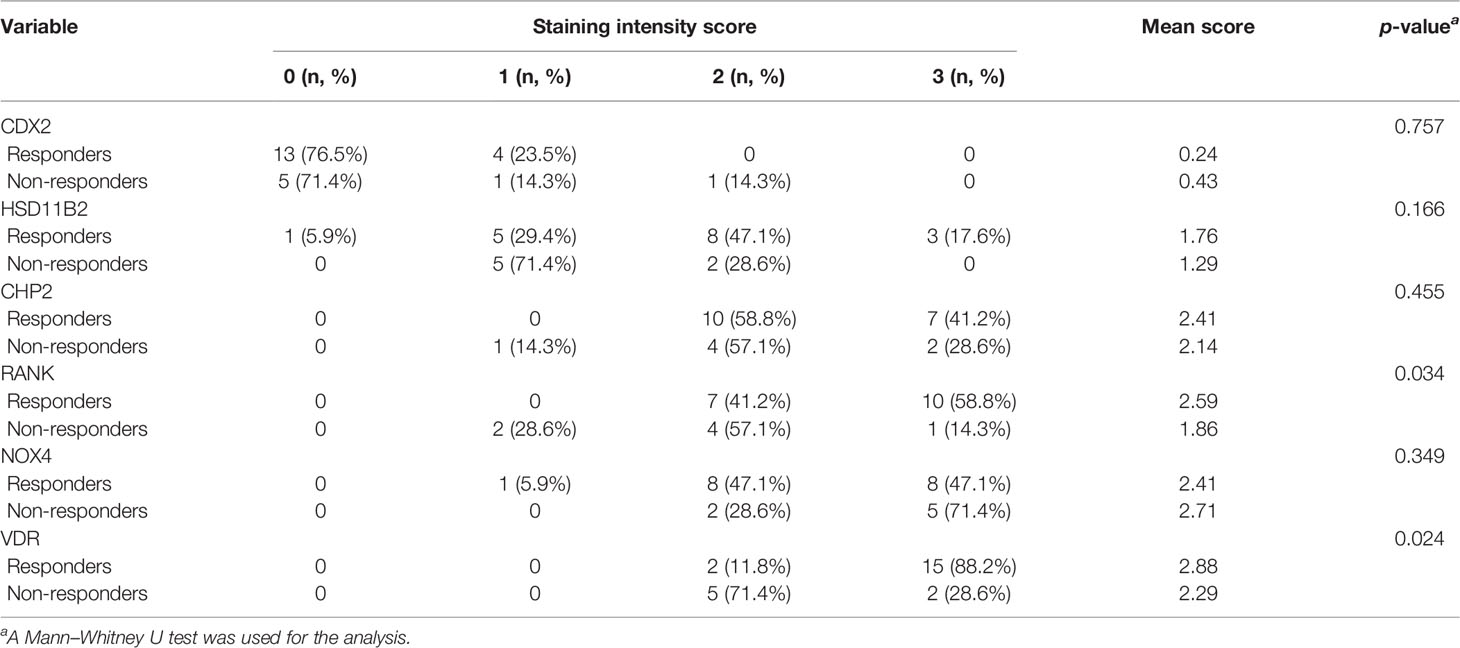
Table 6 The intensity of the staining of IFX efficacy-predicting proteins in colonic biopsies from UC patients.
We used the bootstrap method and an ANN analysis of VDR and RANK and repeated the analysis process 500 times. The AUC performed well in predicting the effect of IFX therapy. The range of repeated overall AUC was 0.837 ± 0.152 in predicting IFX efficacy in week 6 and was 0.776 ± 0.162 in predicting IFX efficacy in week 14 (Figure 7 and Supplementary Table 2).
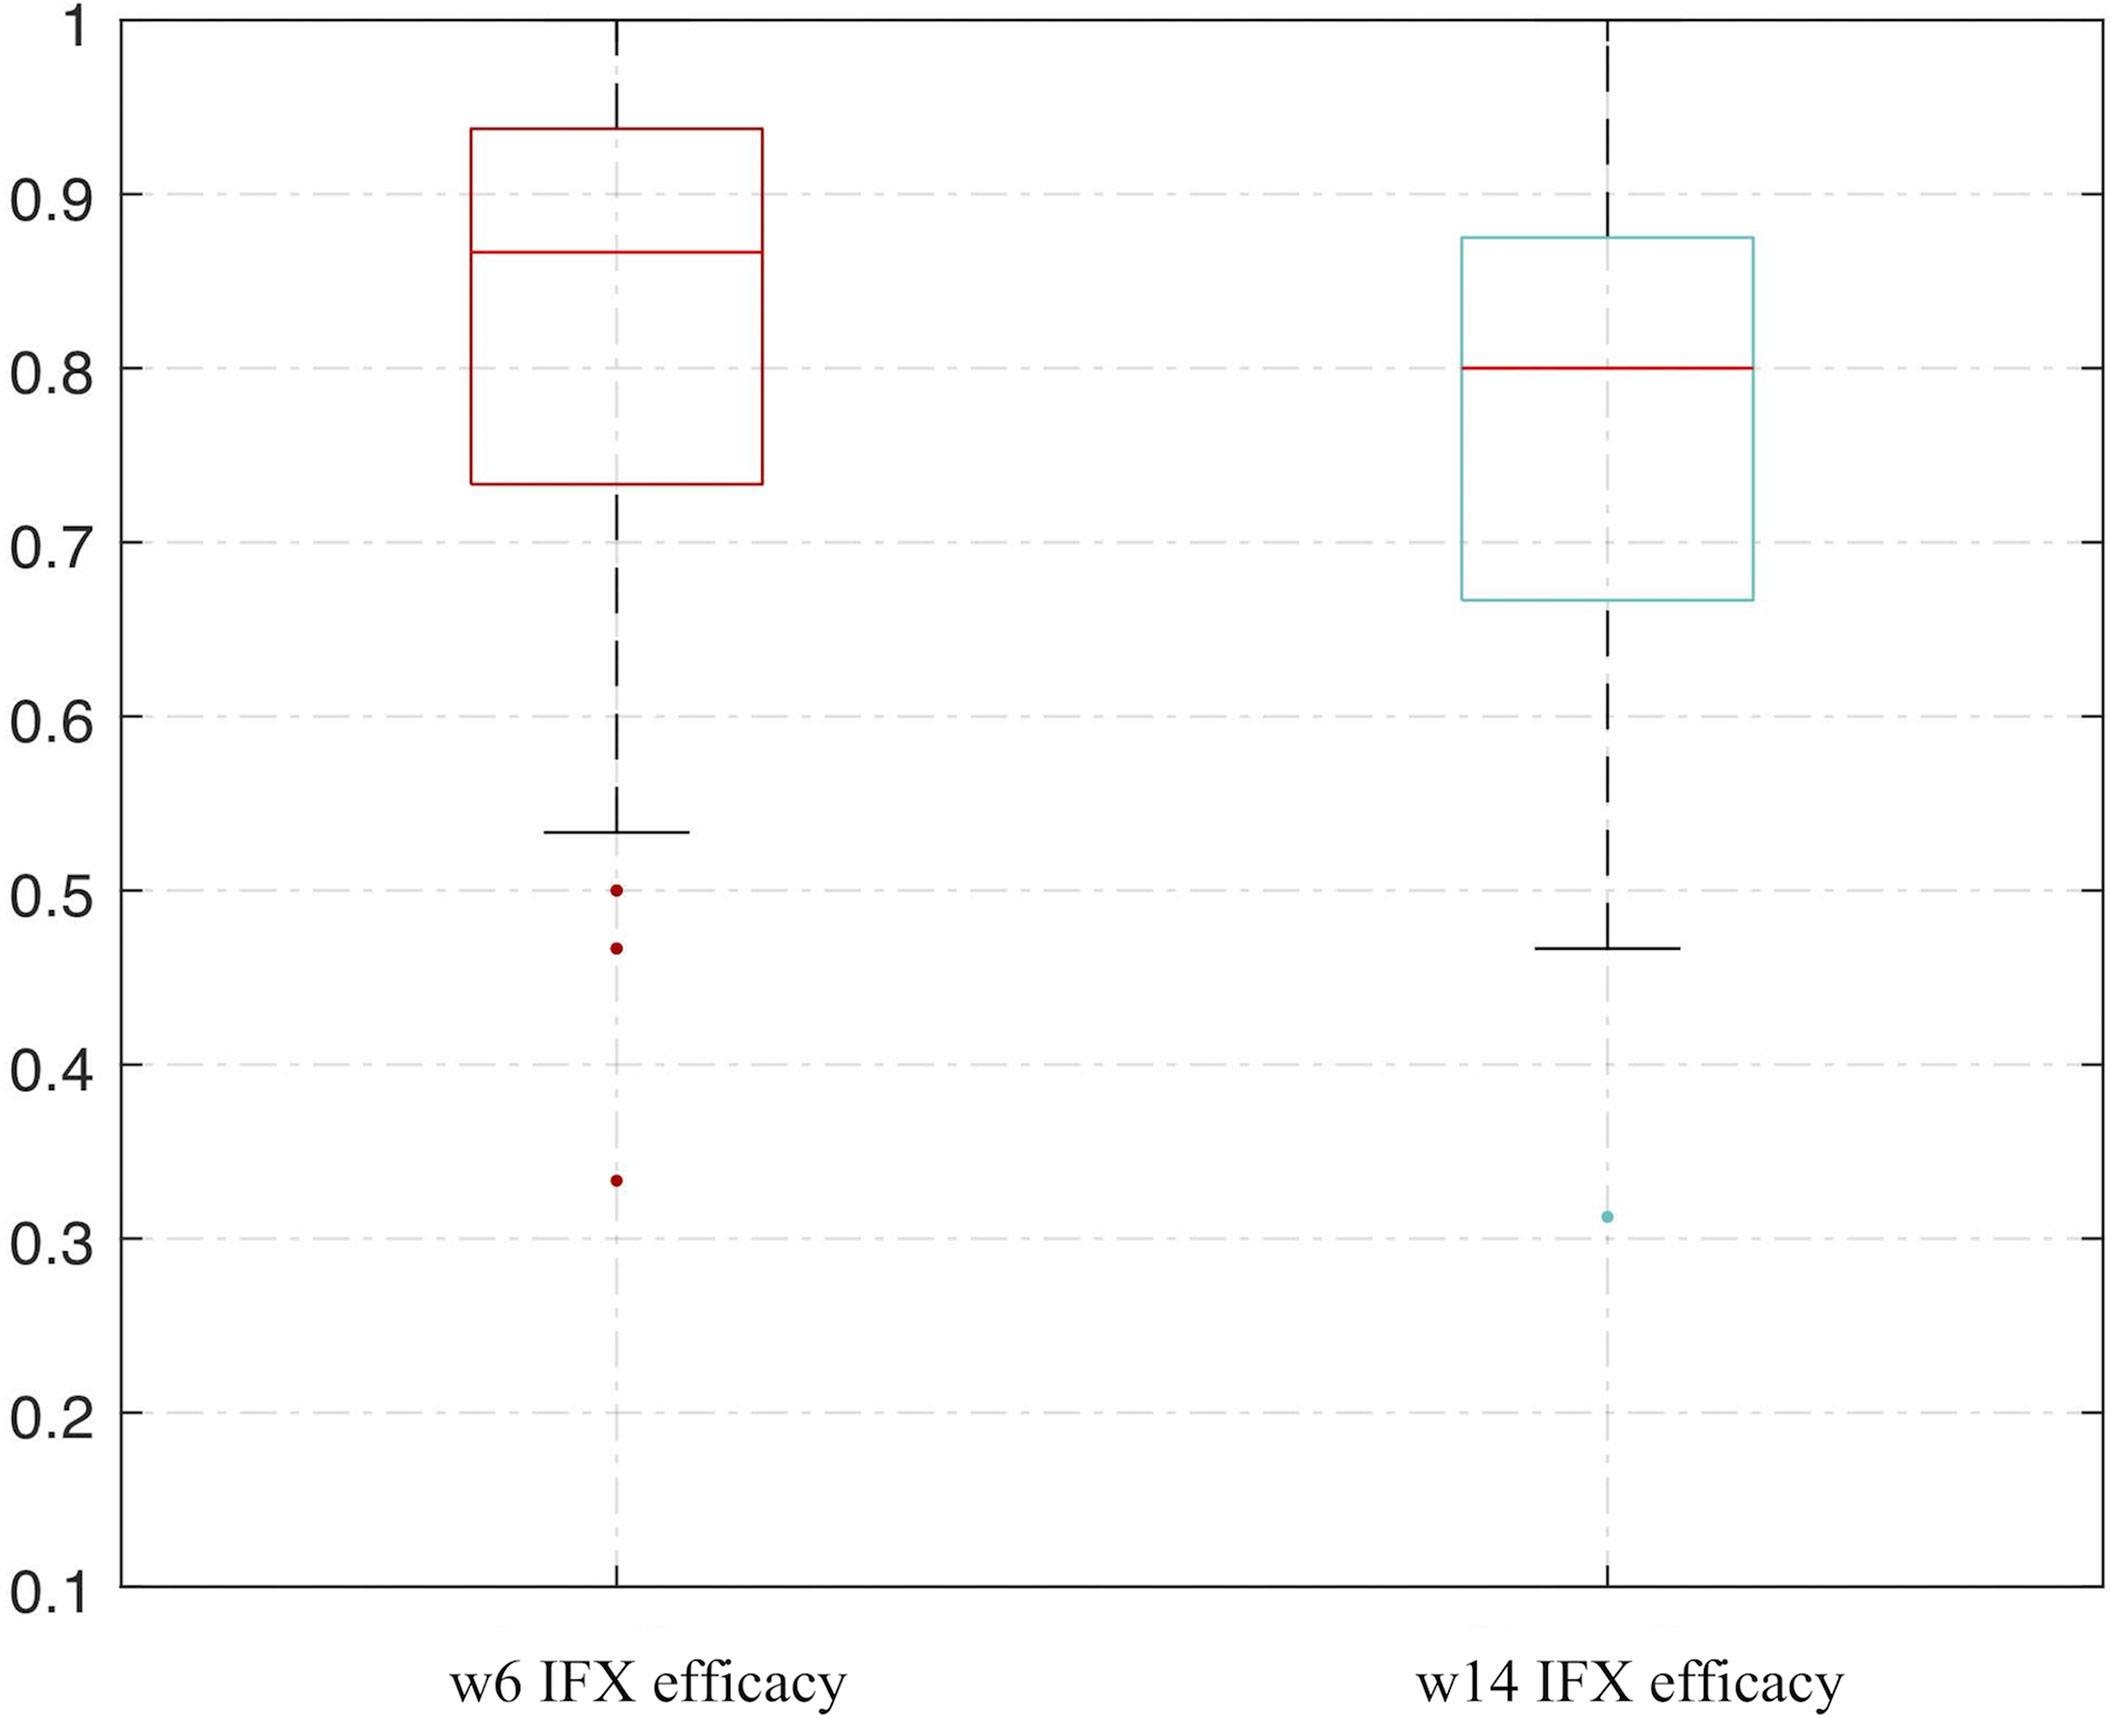
Figure 7 Bootstrapping and ANN analysis results of VDR and RANK in predicting IFX efficacy in week 6 and week 14. ANN analysis, artificial neural network analysis; IFX, infliximab.
To determine the cutoff values for VDR and RANK, we used an ROC analysis. Ultimately, the cutoff value of the total IHC score was 5 for VDR and 7 for RANK. In addition, the logistic regression analysis showed that the regressive equation was as follows:
Therefore, the relative coefficient of VDR was 2, and that of RANK was 1. The final score of each sample was two times the protein score of VDR plus the protein score of RANK. The ROC curve was plotted to estimate the predictive value of the final score for IFX efficacy. The results showed that the final score had an IFX effective prediction value of 0.828 (95% CI: 0.665–0.991, p-value = 0.013) in week 6 (Figure 8A), with a sensitivity of 82.4% and a specificity of 71.4%. This finding indicates that total IHC scores less than 5 for VDR and less than 7 for RANK have good predictive value for primary non-response to IFX in patients with UC. The AUC was 0.759 (95% CI: 0.565–0.953, p-value = 0.032) in week 14 (Figure 8B), with a sensitivity of 69.2% and a specificity of 72.7%.
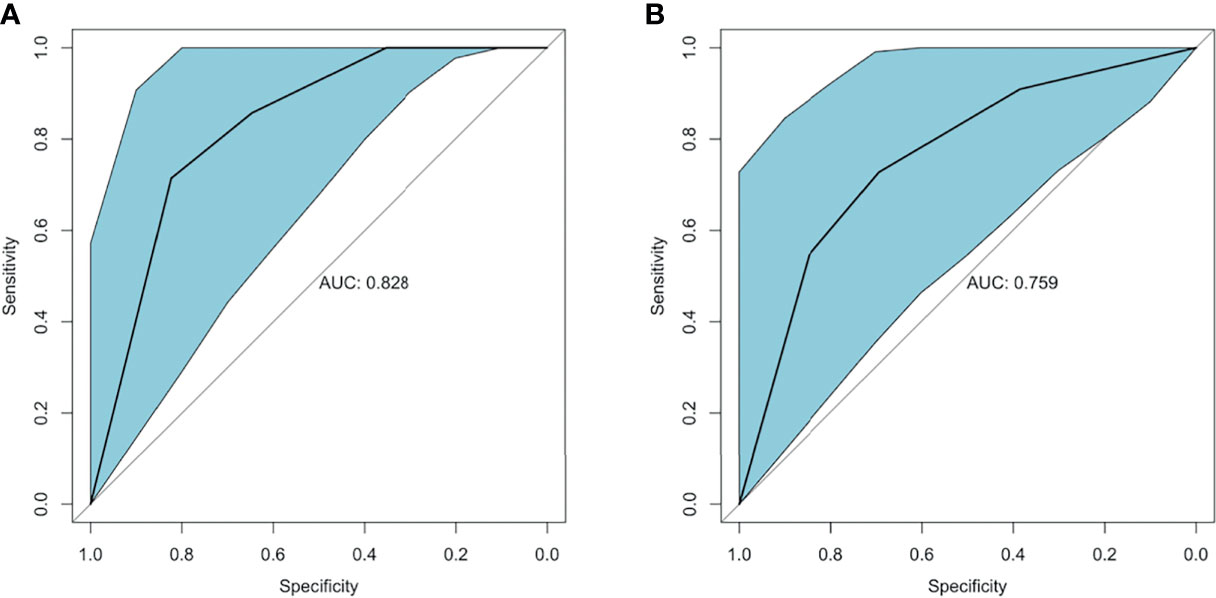
Figure 8 ROC curve of VDR and RANK in predicting IFX efficacy in week 6 and week 14. (A) The AUC of the estimation 6 weeks after IFX treatment was 0.828. (B) The AUC of the estimation 14 weeks after IFX treatment was 0.759. ROC, receiver-operating characteristic; AUC, area under the receiver-operating characteristic curve; IFX, infliximab.
Precision medicine is becoming a hot topic in the medical literature in general, with oncology studies leading the way (25, 26). The most common strategy underlying all precision medicine is that distinct patient characteristics are used to tailor the therapeutic tactics, with the help of biomarker profiles (27). Our study extracted DEGs from a publicly available database and identified several gene signatures of patients diagnosed with UC with primary non-response to IFX based on the RRA algorithm, gastrointestinal expression, and previous studies, including CDX2, CHP2, HSD11B2, RANK, NOX4, and VDR. We used the bootstrap method and an ANN analysis to confirm that the markers were repeatable for clinical application. Moreover, an independent GEO cohort was used to verify the result. We also used samples from UC patients to explore the protein expression based on the selected DEGs. The result showed a connection between the RNA and protein model, and both two models were available, but the protein model is more reliable and more conducive to clinical application. Finally, total IHC scores less than 5 for VDR and less than 7 for RANK jointly achieved an AUC of 0.828 (95% CI: 0.665–0.991, p-value = 0.013) in predicting PNR to IFX. The ANN analysis further confirmed these results.
UC is a chronic inflammatory disease with an increasing incidence worldwide, affecting more than 1 million individuals in Western countries and many more globally (1, 28). UC carries a life-long risk of morbidity, especially in the moderate-to-severe disease stage. Thus far, an increasing number of biologics agents have been used for UC treatment in the clinic, including IFX, vedolizumab, adalimumab, and ustekinumab. The application of biological agents benefits patients in many aspects (3, 29). Previous studies have shown that biological agents are more effective than traditional medications in terms of short-term response (OR = 4.01, 95% CI 3.08–5.23), long-term remission (OR = 2.80, 95% CI = 1.89–4.14), severe UC rescue, and colectomy rate reduction (29.2% versus 58.3%; p = 0.017) (21, 30–32). A meta-analysis showed that IFX was the most effective agent at inducing remission in biologic-naive patients with moderate to severe UC (33).
Nevertheless, treatment resistance remains a tremendous clinical challenge for UC patients. As the most cost-effective biologic (34), IFX shows significant curative efficacy, but close to one-third of UC patients are primary non-responders to this drug. Moreover, prior exposure to IFX may decrease the efficacy of other biologics (6, 7, 35). As IFX is most widely used in patients with moderate to severe UC, the failure of this drug as a first-line therapy could delay the onset of effective treatment. Therefore, personalized therapy for UC and predictive methods of individual response to IFX therapy are urgently needed (10). Our research responds to this pressing need and is expected to yield practical benefits in precision medicine for UC.
Six protein-coding genes predicting IFX efficacy were initially included in our study. Mostly those in the previous studies are clinical indicators, which predict IFX efficacy by responding to disease activity of UC (8, 9). Our study focuses more on predicting primary unresponsiveness than other clinical indicators and might reveal the mechanism of IFX therapeutic effects from the molecular level or pathway. Since protein expression is not always correlated with mRNA expression and protein level detection does not require fresh tissue and can avoid multiple biopsies, we used IHC to further explore the protein expression results in another dataset.
The protein-coding genes involved are strongly correlated with changes in the immune-based response and different immune cell types, including macrophages, dendritic cells (DCs), and T cells. CDX2, a transcription factor, has been shown to have a decreased expression in UC (36), play an essential role in intestinal homeostasis, and act as a context-dependent tumor suppressor in colorectal cancer. The deletion of CDX2 from the intestinal epithelium in mice leads to macrophage infiltration, causing chronic inflammatory responses (37). However, CDX2 did not revert to normal in CD patients treated with anti-TNF-α biologics (38). In our study, CDX2 did not differ between the groups by IHC. The biological function of CHP2 remains largely unknown. Guo-Dong Li et al. found that CHP2 can increase the nuclear presence of nuclear factor of activated T cells (NFATc3) and enhance activated T cell activity (39). In particular, T helper (Th) 2-mediated inflammation plays a role in UC (40). NFATs can cooperate with various transcription factors to form transcriptional complexes and integrate signaling pathways to change transcriptional patterns (41, 42). HSD11B2 and NOX4 are enriched in the hypoxia response. Tissue hypoxia, which decreases HSD11B2 and increases NOX4 expression, occurs in chronic inflammatory conditions, such as IBD. Van Welden et al. suggested that hypoxia of the colonic mucosa activates hypoxia inducible factors (HIFs) and the regulation of nuclear factor κB (NF-κB) (43). Yu et al. found that HIF-1α was upregulated in UC patients and positively related to disease progression (44). Therefore, colonic tissue hypoxia and hypoxia-induced signaling may be detection and therapeutic targets in UC (43). The reduction in HSD11B2 and the increase in NOX4 suggest a higher hypoxia response, which regulates inflammatory and immune processes and results in a complex hypoxia-immune-based microenvironment. Despite the expression of CDX2, CHP2, HSD11B2, and NOX4 related to IFX therapy and coping with inflammatory activity, their protein expression did not show a difference in the validation cohort. This finding might account for the different disease complexities and activities of UC patients between the public datasets and our enrolled subjects. We did not include these proteins in the protein prediction model.
Regarding the ultimately involved proteins, several reports from our group and others have highlighted the importance of VDR, a receptor of vitamin D, in UC. The colonic expression of VDR was inversely associated with disease activity in UC (45). Moreover, in our previous research, 25[OH]D3 levels were negatively correlated with the disease severity of UC (r = -0.371, p < 0.001) (46). A study by Shirwaikar Thomas et al. showed that in IBD patients, those with active endoscopic inflammation have a lower vitamin D level than those in remission (47). Furthermore, low pretreatment serum 25[OH]D predicted vedolizumab failure in patients with IBD (48).
UC results from T helper (Th) 2-mediated inflammation, leading to the possibility that inhibitors of Th2 cytokines might be helpful in the treatment of UC (49, 50). Vitamin D has been shown to inhibit the proliferation of T cells from patients with active UC (51), which might reduce Th2 cell-induced inflammation. Furthermore, the levels of Th2 cells were higher in anti-TNF-non-responders in UC (52). A study by Song et al. demonstrated that VDR restricts Th2-biased inflammation in the heart (53). Therefore, the reduction in VDR in colonic tissue might correlate with a strengthening of Th2-mediated inflammation and anti-TNF non-response. Bingning et al. showed that VDR activation performs a solid anti-inflammatory function in macrophages and ameliorates insulin resistance (54). VDR signaling in macrophages suppresses NF-κB activity and reduces inflammatory factor interactions (55). VDR also regulates the function of Paneth cells in releasing antimicrobial peptides to modulate the innate immune process. Thus, the regulation of VDR on immune cells might improve intestinal inflammation, leading to disease activity.
Receptor activator of nuclear factor κB (RANK), also known as TNFRSF11A, is a member of the TNF receptor superfamily. The interactions between RANK and its ligand (RANKL) regulate T cell/DC communications, DC survival, and naive T cell proliferation (56, 57). Previous studies have shown that UC is characterized by an increase in activated T cells and T-regulatory cells and a decrease in naive T-cells (58, 59). DCs monitor the surrounding microenvironment, sample antigens, and induce tolerance or incite a host defense proinflammatory response in UC (60). Therefore, a reduction in RANK might lead to an imbalance in the immune microenvironment by affecting DCs and T cells, thereby inducing UC activity.
Collectively, our study demonstrates that total IHC scores less than 5 for VDR and less than 7 for RANK were associated with non-response to IFX. The diminished expression of VDR and RANK may account for the immune-related changes in the intestinal microenvironment and reduce anti-inflammatory factors, leading to an increase in disease activity. Meanwhile, the modulation of different immune cell populations and inflammatory processes may lower anti-inflammatory cell types and weaken the immune response. Therefore, IFX may not be sufficiently robust to address this complicated inflammatory status, resulting in an inadequate therapeutic effect.
Our study has several strengths. First, we obtained transcriptome data from public datasets for the integration analysis, which is the premise of precision medicine. Second, the resampling method was used to expand the data, and then an ANN analysis was used for internal verification and prediction. We repeated the analysis process many times to show the stability of the model, forming a foundation for clinical application in the prediction of PNR. The significant proteins are readily tested in practice and are convenient for clinical application. In addition, we verified the validity of the protein profiles by IHC staining of colonic tissues from UC patients treated with IFX in our hospital. In previous studies, clinical factors, serum markers, and host genetics were demonstrated to play a role in the therapeutic response but did not accurately predict PNR. The secondary validation process in our study demonstrated that the clinical application of the immune-related signatures of primary IFX non-response in UC patients is repeatable. Furthermore, the time point of the response assessment was 6 to 8 weeks after the first IFX treatment in the GEO datasets and our enrolled subjects. A previous study showed that early measurement could better predict future remission and, thus, possibly benefit decision making (61).
Our research is not without limitations. To maintain consistency with the GEO databases, the clinical Mayo score 6–8 weeks after IFX treatment was used as the assessment when the recruited UC patients did not have endoscopy data. Thus, our study showed evidence of consistency and presented early predictive value even when an endoscopic evaluation was unavailable. However, our method may miss some patients whose endoscopic response is better or worse than their clinical response, which could increase the false-positive rate or the false-negative rate of the external verification. To reduce this bias, we also estimated the therapeutic efficacy in week 14 (Figure 5B), which included an endoscopic score. The signatures also showed good predictive value, with an AUC of 0.759. Although we identified the thresholds for VDR and RANK in predicting IFX efficacy, the results showed minor differences and overlap to some extent to distinguish responders and non-responders. However, our study provides preliminary data for using proteins to predict IFX efficacy. In the future, other more sensitive protein identification methods, such as electrical detection methodologies, might be developed for the precision treatment in the clinical practice (62). Furthermore, the percentage of non-responding patients in week 14 was higher than that in week 6, indicating that early assessment is preferable as an aid for decision making. Nevertheless, large-scale prospective studies are needed to correct this limitation.
In conclusion, this study found that total IHC scores less than 5 for VDR and less than 7 for RANK were good immune-based protein signatures of PNR to anti-TNF treatment in UC patients. Applying this panel in clinical practice could help clinicians identify likely IFX non-responders before initiating therapy. Nevertheless, the practical advantage of such a tailored approach needs to be confirmed in the future.
The original contributions presented in the study are included in the article/Supplementary Material. Further inquiries can be directed to the corresponding author.
The studies involving human participants were reviewed and approved by the Peking Union Medical College Hospital and the Chinese Academy Medical Science Ethics Committee (S-K1142). Written informed consent for participation was not required for this study in accordance with the national legislation and the institutional requirements.
XC and HY conceptualized and designed the research. XC carried out the data analysis. XC and RZ carried out the experimental procedures. HY and JQ oversaw the study and provided financial support. This manuscript was reviewed and revised by LJ, WH, XB, GR, MG, and HL. All authors contributed to the article and approved the submitted version.
This work was funded by the National Natural Science Foundation of China (No. 81570505 and No. 81970495), the Natural Science Foundation of Beijing Municipality (No. 7202161), the Health Research & Special Projects Grant of China (No. 201002020 and No. 201502005), the Peking Union Medical College Postgraduate Innovation Fund (No. 2019-1002-71), and the National Clinical Specialty Projects along with the CAMS Innovation Fund for Medical Sciences (No. 2021-1-I2M-001).
The authors declare that the research was conducted in the absence of any commercial or financial relationships that could be construed as a potential conflict of interest.
All claims expressed in this article are solely those of the authors and do not necessarily represent those of their affiliated organizations, or those of the publisher, the editors and the reviewers. Any product that may be evaluated in this article, or claim that may be made by its manufacturer, is not guaranteed or endorsed by the publisher.
The Supplementary Material for this article can be found online at: https://www.frontiersin.org/articles/10.3389/fimmu.2021.742080/full#supplementary-material
1. Rubin DT, Ananthakrishnan AN, Siegel CA, Sauer BG, Long MD. ACG Clinical Guideline: Ulcerative Colitis in Adults. Am J Gastroenterol (2019) 114(3):384–413. doi: 10.14309/ajg.0000000000000152
2. Feuerstein JD, Isaacs KL, Schneider Y, Siddique SM, Falck-Ytter Y, Singh S, et al. AGA Clinical Practice Guidelines on the Management of Moderate to Severe Ulcerative Colitis. Gastroenterology (2020) 158(5):1450–61. doi: 10.1053/j.gastro.2020.01.006
3. Sands BE, Sandborn WJ, Panaccione R, O'Brien CD, Zhang H, Johanns J, et al. Ustekinumab as Induction and Maintenance Therapy for Ulcerative Colitis. N Engl J Med (2019) 381(13):1201–14. doi: 10.1056/NEJMoa1900750
4. Singh S, Fumery M, Sandborn WJ, Murad MH. Systematic Review With Network Meta-Analysis: First- and Second-Line Pharmacotherapy for Moderate-Severe Ulcerative Colitis. Aliment Pharmacol Ther (2018) 47(2):162–75. doi: 10.1111/apt.14422
5. Danese S, Fiorino G, Peyrin-Biroulet L, Lucenteforte E, Virgili G, Moja L, et al. Biological Agents for Moderately to Severely Active Ulcerative Colitis: A Systematic Review and Network Meta-Analysis. Ann Intern Med (2014) 160(10):704–11. doi: 10.7326/M13-2403
6. Favale A, Onali S, Caprioli F, Pugliese D, Armuzzi A, Macaluso FS, et al. Comparative Efficacy of Vedolizumab and Adalimumab in Ulcerative Colitis Patients Previously Treated With Infliximab. Inflamm Bowel Dis (2019) 25(11):1805–12. doi: 10.1093/ibd/izz057
7. Kopylov U, Verstockt B, Biedermann L, Sebastian S, Pugliese D, Sonnenberg E, et al. Effectiveness and Safety of Vedolizumab in Anti-TNF-Naïve Patients With Inflammatory Bowel Disease-A Multicenter Retrospective European Study. Inflamm Bowel Dis (2018) 24(11):2442–51. doi: 10.1093/ibd/izy155
8. Brandse JF, Mathôt RA, van der Kleij D, Rispens T, Ashruf Y, Jansen JM, et al. Pharmacokinetic Features and Presence of Antidrug Antibodies Associate With Response to Infliximab Induction Therapy in Patients With Moderate to Severe Ulcerative Colitis. Clin Gastroenterol Hepatol (2016) 14(2):251–8.e1-2. doi: 10.1016/j.cgh.2015.10.029
9. Arias MT, Vande Casteele N, Vermeire S, de Buck van Overstraeten A, Billiet T, Baert F, et al. A Panel to Predict Long-Term Outcome of Infliximab Therapy for Patients With Ulcerative Colitis. Clin Gastroenterol Hepatol (2015) 13(3):531–8. doi: 10.1016/j.cgh.2014.07.055
10. Denson LA, Curran M, McGovern DPB, Koltun WA, Duerr RH, Kim SC, et al. Challenges in IBD Research: Precision Medicine. Inflamm Bowel Dis (2019) 25(Suppl 2):S31–9. doi: 10.1093/ibd/izz078
11. Burke KE, Khalili H, Garber JJ, Haritunians T, McGovern DPB, Xavier RJ, et al. Genetic Markers Predict Primary Nonresponse and Durable Response to Anti-Tumor Necrosis Factor Therapy in Ulcerative Colitis. Inflamm Bowel Dis (2018) 24(8):1840–8. doi: 10.1093/ibd/izy083
12. West NR, Hegazy AN, Owens BMJ, Bullers SJ, Linggi B, Buonocore S, et al. Oncostatin M Drives Intestinal Inflammation and Predicts Response to Tumor Necrosis Factor-Neutralizing Therapy in Patients With Inflammatory Bowel Disease. Nat Med (2017) 23(5):579–89. doi: 10.1038/nm.4307
13. Henderson AR. The Bootstrap: A Technique for Data-Driven Statistics. Using Computer-Intensive Analyses to Explore Experimental Data. Clin Chim Acta (2005) 359(1-2):1–26. doi: 10.1016/j.cccn.2005.04.002
14. Al Seesi S, Tiagueu YT, Zelikovsky A, Măndoiu II. Bootstrap-Based Differential Gene Expression Analysis for RNA-Seq Data With and Without Replicates. BMC Genomics (2014) 15(Suppl 8):S2. doi: 10.1186/1471-2164-15-S8-S2
15. Arijs I, Li K, Toedter G, Quintens R, Van Lommel L, Van Steen K, et al. Mucosal Gene Signatures to Predict Response to Infliximab in Patients With Ulcerative Colitis. Gut (2009) 58(12):1612–9. doi: 10.1136/gut.2009.178665
16. Arijs I, De Hertogh G, Lemaire K, Quintens R, Van Lommel L, Van Steen K, et al. Mucosal Gene Expression of Antimicrobial Peptides in Inflammatory Bowel Disease Before and After First Infliximab Treatment. PloS One (2009) 4(11):e7984. doi: 10.1371/journal.pone.0007984
17. Toedter G, Li K, Marano C, Ma K, Sague S, Huang CC, et al. Gene Expression Profiling and Response Signatures Associated With Differential Responses to Infliximab Treatment in Ulcerative Colitis. Am J Gastroenterol (2011) 106(7):1272–80. doi: 10.1038/ajg.2011.83
18. Pavlidis S, Monast C, Loza MJ, Branigan P, Chung KF, Adcock IM, et al. I_MDS: An Inflammatory Bowel Disease Molecular Activity Score to Classify Patients With Differing Disease-Driving Pathways and Therapeutic Response to Anti-TNF Treatment. PloS Comput Biol (2019) 15(4):e1006951. doi: 10.1371/journal.pcbi.1006951
19. Inflammatory Bowel Disease Group, Chinese Society of Gastroenterology, Chinese Medical Association. Chinese Consensus on Diagnosis and Treatment of Inflammatory Bowel Disease (Beijing, 2018). J Dig Dis (2021) 22(6):298–317. doi: 10.1111/1751-2980.12994
20. Magro F, Gionchetti P, Eliakim R, Ardizzone S, Armuzzi A, Barreiro-de Acosta M, et al. Third European Evidence-Based Consensus on Diagnosis and Management of Ulcerative Colitis. Part 1: Definitions, Diagnosis, Extra-Intestinal Manifestations, Pregnancy, Cancer Surveillance, Surgery, and Ileo-Anal Pouch Disorders. J Crohns Colitis (2017) 11(6):649–70. doi: 10.1093/ecco-jcc/jjx008
21. Moss AC, Farrell RJ. Infliximab for Induction and Maintenance Therapy for Ulcerative Colitis. Gastroenterology (2006) 131(5):1649–51. doi: 10.1053/j.gastro.2006.09.039
22. Conner JR, Hirsch MS, Jo VY. Hnf1β and S100A1 are Useful Biomarkers for Distinguishing Renal Oncocytoma and Chromophobe Renal Cell Carcinoma in FNA and Core Needle Biopsies. Cancer Cytopathol (2015) 123(5):298–305. doi: 10.1002/cncy.21530
23. LeCun Y, Bengio Y, Hinton G. Deep Learning. Nature (2015) 521(7553):436–44. doi: 10.1038/nature14539
24. Indini A, Di Guardo L, Cimminiello C, De Braud F, Del Vecchio M. Artificial Intelligence Estimates the Importance of Baseline Factors in Predicting Response to Anti-PD1 in Metastatic Melanoma. Am J Clin Oncol (2019) 42(8):643–8. doi: 10.1097/COC.0000000000000566
25. Hirsch FR, Scagliotti GV, Mulshine JL, Kwon R, Curran WJ Jr, Wu YL, et al. Lung Cancer: Current Therapies and New Targeted Treatments. Lancet (2017) 389(10066):299–311. doi: 10.1016/S0140-6736(16)30958-8
26. Johnson TM. Perspective on Precision Medicine in Oncology. Pharmacotherapy (2017) 37(9):988–9. doi: 10.1002/phar.1975
27. König IR, Fuchs O, Hansen G, von Mutius E, Kopp MV. What is Precision Medicine? Eur Respir J (2017) 50(4):1700391. doi: 10.1183/13993003.00391-2017
28. Ng SC, Shi HY, Hamidi N, Underwood FE, Tang W, Benchimol EI, et al. Worldwide Incidence and Prevalence of Inflammatory Bowel Disease in the 21st Century: A Systematic Review of Population-Based Studies. Lancet (2017) 390(10114):2769–78. doi: 10.1016/S0140-6736(17)32448-0
29. Feagan BG, Rutgeerts P, Sands BE, Hanauer S, Colombel JF, Sandborn WJ, et al. Vedolizumab as Induction and Maintenance Therapy for Ulcerative Colitis. N Engl J Med (2013) 369(8):699–710. doi: 10.1056/NEJMoa1215734
30. Sandborn WJ, Rutgeerts P, Feagan BG, Reinisch W, Olson A, Johanns J, et al. Colectomy Rate Comparison After Treatment of Ulcerative Colitis With Placebo or Infliximab. Gastroenterology (2009) 137(4):1250–520. doi: 10.1053/j.gastro.2009.06.061
31. Guo C, Wu K, Liang X, Liang Y, Li R. Infliximab Clinically Treating Ulcerative Colitis: A Systematic Review and Meta-Analysis. Pharmacol Res (2019) 148:104455. doi: 10.1016/j.phrs.2019.104455
32. Järnerot G, Hertervig E, Friis-Liby I, Blomquist L, Karlén P, Grännö C, et al. Infliximab as Rescue Therapy in Severe to Moderately Severe Ulcerative Colitis: A Randomized, Placebo-Controlled Study. Gastroenterology (2005) 128(7):1805–11. doi: 10.1053/j.gastro.2005.03.003
33. Singh S, Murad MH, Fumery M, Dulai PS, Sandborn WJ. First- and Second-Line Pharmacotherapies for Patients With Moderate to Severely Active Ulcerative Colitis: An Updated Network Meta-Analysis. Clin Gastroenterol Hepatol (2020) 18(10):2179–2191.e6. doi: 10.1016/j.cgh.2020.01.008
34. Petryszyn P, Ekk-Cierniakowski P, Zurakowski G. Infliximab, Adalimumab, Golimumab, Vedolizumab and Tofacitinib in Moderate to Severe Ulcerative Colitis: Comparative Cost-Effectiveness Study in Poland. Therap Adv Gastroenterol (2020) 13:1756284820941179. doi: 10.1177/1756284820941179
35. Welty M, Mesana L, Padhiar A, Naessens D, Diels J, van Sanden S, et al. Efficacy of Ustekinumab vs. Advanced Therapies for the Treatment of Moderately to Severely Active Ulcerative Colitis: A Systematic Review and Network Meta-Analysis. Curr Med Res Opin (2020) 36(4):595–606. doi: 10.1080/03007995.2020.1716701
37. Chewchuk S, Jahan S, Lohnes D. Cdx2 Regulates Immune Cell Infiltration in the Intestine. Sci Rep (2021) 11(1):15841. doi: 10.1038/s41598-021-95412-w
38. Younes M, Rahimi E, DuPont AW, Ly CJ, Ertan A. Anti-TNF-α Biologics Do Not Reverse CDX2 Downregulation in Patients With Crohn's Disease. Ann Clin Lab Sci (2020) 50(2):172–4.
39. Li GD, Zhang X, Li R, Wang YD, Wang YL, Han KJ, et al. CHP2 Activates the Calcineurin/Nuclear Factor of Activated T Cells Signaling Pathway and Enhances the Oncogenic Potential of HEK293 Cells. J Biol Chem (2008) 283(47):32660–8. doi: 10.1074/jbc.M806684200
40. Geremia A, Biancheri P, Allan P, Corazza GR, Di Sabatino A. Innate and Adaptive Immunity in Inflammatory Bowel Disease. Autoimmun Rev (2014) 13(1):3–10. doi: 10.1016/j.autrev.2013.06.004
41. Wu Y, Borde M, Heissmeyer V, Feuerer M, Lapan AD, Stroud JC, et al. FOXP3 Controls Regulatory T Cell Function Through Cooperation With NFAT. Cell (2006) 126(2):375–87. doi: 10.1016/j.cell.2006.05.042
42. Smith-Garvin JE, Koretzky GA, Jordan MS. T Cell Activation. Annu Rev Immunol (2009) 27:591–619. doi: 10.1146/annurev.immunol.021908.132706
43. Van Welden S, Selfridge AC, Hindryckx P. Intestinal Hypoxia and Hypoxia-Induced Signalling as Therapeutic Targets for IBD. Nat Rev Gastroenterol Hepatol (2017) 14(10):596–611. doi: 10.1038/nrgastro.2017.101
44. Yu S, Li B, Hao J, Shi X, Ge J, Xu H. Correlation of Hypoxia-Inducible Facto-1α and C-Reactive Protein With Disease Evaluation in Patients With Ulcerative Colitis. Am J Transl Res (2020) 12(12):7826–35.
45. Wang HQ, Zhang WH, Wang YQ, Geng XP, Wang MW, Fan YY, et al. Colonic Vitamin D Receptor Expression Is Inversely Associated With Disease Activity and Jumonji Domain-Containing 3 in Active Ulcerative Colitis. World J Gastroenterol (2020) 26(46):7352–66. doi: 10.3748/wjg.v26.i46.7352
46. Tan B, Li P, Lv H, Li Y, Wang O, Xing XP, et al. Vitamin D Levels and Bone Metabolism in Chinese Adult Patients With Inflammatory Bowel Disease. J Dig Dis (2014) 15(3):116–23. doi: 10.1111/1751-2980.12118
47. Shirwaikar Thomas A, Criss ZK, Shroyer NF, Abraham BP. Vitamin D Receptor Gene Single Nucleotide Polymorphisms and Association With Vitamin D Levels and Endoscopic Disease Activity in Inflammatory Bowel Disease Patients: A Pilot Study. Inflamm Bowel Dis (2021) 27(8):1263–9. doi: 10.1093/ibd/izaa292
48. Gubatan J, Rubin SJS, Bai L, Haileselassie Y, Levitte S, Balabanis T, et al. Vitamin D Is Associated With α4β7+ Immunophenotypes and Predicts Vedolizumab Therapy Failure in Patients With Inflammatory Bowel Disease. J Crohns Colitis (2021) 28:jjab114. doi: 10.1093/ecco-jcc/jjab114
49. Kobayashi T, Siegmund B, Le Berre C, Wei SC, Ferrante M, Shen B, et al. Ulcerative Colitis. Nat Rev Dis Primers (2020) 6(1):74. doi: 10.1038/s41572-020-0205-x
50. Bouma G, Strober W. The Immunological and Genetic Basis of Inflammatory Bowel Disease. Nat Rev Immunol (2003) 3(7):521–33. doi: 10.1038/nri1132
51. Stio M, Bonanomi AG, d'Albasio G, Treves C. Suppressive Effect of 1,25-Dihydroxyvitamin D3 and Its Analogues EB 1089 and KH 1060 on T Lymphocyte Proliferation in Active Ulcerative Colitis. Biochem Pharmacol (2001) 61(3):365–71. doi: 10.1016/s0006-2952(00)00564-5
52. Dulic S, Toldi G, Sava F, Kovács L, Molnár T, Milassin Á, et al. Specific T-Cell Subsets Can Predict the Efficacy of Anti-TNF Treatment in Inflammatory Bowel Diseases. Arch Immunol Ther Exp (Warsz) (2020) 68(2):12. doi: 10.1007/s00005-020-00575-5
53. Song J, Chen X, Cheng L, Rao M, Chen K, Zhang N, et al. D Receptor Restricts T Helper 2-Biased Inflammation in the Heart. Cardiovasc Res (2018) 114(6):870–9. doi: 10.1093/cvr/cvy034
54. Dong B, Zhou Y, Wang W, Scott J, Kim K, Sun Z, et al. Vitamin D Receptor Activation in Liver Macrophages Ameliorates Hepatic Inflammation, Steatosis, and Insulin Resistance in Mice. Hepatology (2020) 71(5):1559–74. doi: 10.1002/hep.30937
55. Na YR, Stakenborg M, Seok SH, Matteoli G. Macrophages in Intestinal Inflammation and Resolution: A Potential Therapeutic Target in IBD. Nat Rev Gastroenterol Hepatol (2019) 16(9):531–43. doi: 10.1038/s41575-019-0172-4
56. Theill LE, Boyle WJ, Penninger JM. RANK-L and RANK: T Cells, Bone Loss, and Mammalian Evolution. Annu Rev Immunol (2002) 20:795–823. doi: 10.1146/annurev.immunol.20.100301.064753
57. Anderson DM, Maraskovsky E, Billingsley WL, Dougall WC, Tometsko ME, Roux ER, et al. A Homologue of the TNF Receptor and its Ligand Enhance T-Cell Growth and Dendritic-Cell Function. Nature (1997) 390(6656):175–9. doi: 10.1038/36593
58. Rabe H, Malmquist M, Barkman C, Östman S, Gjertsson I, Saalman R, et al. Distinct Patterns of Naive, Activated and Memory T and B Cells in Blood of Patients With Ulcerative Colitis or Crohn's Disease. Clin Exp Immunol (2019) 197(1):111–29. doi: 10.1111/cei.13294
59. Mitsialis V, Wall S, Liu P, Ordovas-Montanes J, Parmet T, Vukovic M, et al. Single-Cell Analyses of Colon and Blood Reveal Distinct Immune Cell Signatures of Ulcerative Colitis and Crohn's Disease. Gastroenterology (2020) 159(2):591–608.e10. doi: 10.1053/j.gastro.2020.04.074
60. de Souza HS, Fiocchi C. Immunopathogenesis of IBD: Current State of the Art. Nat Rev Gastroenterol Hepatol (2016) 13(1):13–27. doi: 10.1038/nrgastro.2015.186
61. Beswick L, Rosella O, Rosella G, Headon B, Sparrow MP, Gibson PR, et al. Exploration of Predictive Biomarkers of Early Infliximab Response in Acute Severe Colitis: A Prospective Pilot Study. J Crohns Colitis (2018) 12(3):289–97. doi: 10.1093/ecco-jcc/jjx146
Keywords: infliximab, ulcerative colitis, artificial neural network analysis, prediction, primary non-response
Citation: Chen X, Jiang L, Han W, Bai X, Ruan G, Guo M, Zhou R, Liang H, Yang H and Qian J (2021) Artificial Neural Network Analysis-Based Immune-Related Signatures of Primary Non-Response to Infliximab in Patients With Ulcerative Colitis. Front. Immunol. 12:742080. doi: 10.3389/fimmu.2021.742080
Received: 15 July 2021; Accepted: 10 November 2021;
Published: 21 December 2021.
Edited by:
Xu-jie Zhou, Peking University First Hospital, ChinaReviewed by:
Carlo Chizzolini, Université de Genève, SwitzerlandCopyright © 2021 Chen, Jiang, Han, Bai, Ruan, Guo, Zhou, Liang, Yang and Qian. This is an open-access article distributed under the terms of the Creative Commons Attribution License (CC BY). The use, distribution or reproduction in other forums is permitted, provided the original author(s) and the copyright owner(s) are credited and that the original publication in this journal is cited, in accordance with accepted academic practice. No use, distribution or reproduction is permitted which does not comply with these terms.
*Correspondence: Hong Yang, WWFuZ2hAcHVtY2guY24=
Disclaimer: All claims expressed in this article are solely those of the authors and do not necessarily represent those of their affiliated organizations, or those of the publisher, the editors and the reviewers. Any product that may be evaluated in this article or claim that may be made by its manufacturer is not guaranteed or endorsed by the publisher.
Research integrity at Frontiers

Learn more about the work of our research integrity team to safeguard the quality of each article we publish.