 Mengyu Sun
 Meng Xie
 Tongyue Zhang
 Yijun Wang
 Wenjie Huang
 Limin Xia
95% of researchers rate our articles as excellent or good
Learn more about the work of our research integrity team to safeguard the quality of each article we publish.
Find out more
ORIGINAL RESEARCH article
Front. Immunol. , 20 September 2021
Sec. Cancer Immunity and Immunotherapy
Volume 12 - 2021 | https://doi.org/10.3389/fimmu.2021.739768
This article is part of the Research Topic Manipulating the Immunological Tumor Microenvironment View all 57 articles
Recent studies have shown that RNA N6-methyladenosine (m6A) modification plays an important part in tumorigenesis and immune-related biological processes. However, the comprehensive landscape of immune cell infiltration characteristics in the tumor microenvironment (TME) mediated by m6A methylation modification in pancreatic cancer has not yet been elucidated. Based on consensus clustering algorithm, we identified two m6A modification subtypes and then determined two m6A-related gene subtypes among 434 pancreatic cancer samples. The TME characteristics of the identified gene subtypes were highly consistent with the immune-hot phenotype and the immune-cold phenotype respectively. According to the m6A score extracted from the m6A-related signature genes, patients can be divided into high and low m6A score groups. The low score group displayed a better prognosis and relatively strong immune infiltration. Further analysis showed that low m6A score correlated with lower tumor mutation burden and PD-L1 expression, and indicated a better response to immunotherapy. In general, m6A methylation modification is closely related to the diversity and complexity of immune infiltration in TME. Evaluating the m6A modification pattern and immune infiltration characteristics of individual tumors can help deepen our understanding of the tumor microenvironment landscape and promote a more effective clinical practice of immunotherapy.
More than 160 RNA modifications including N7-methylguanine (m7G), N6-methyladenosine (m6A), and N5-methylcytosine (m5C) have been identified. These modifications play a significant role in regulating RNA fate (1). In eukaryotes, m6A is regarded as the most important and abundant mRNA modification, accounting for more than 80% of all RNA methylation modifications (2). It is now clear that m6A methylation exists in almost all types of RNA, including coding RNA and non-coding RNA (3). The m6A modification is catalyzed by RNA methyltransferases such as METTL3, METTL14, METTL16, WTAP, VIRMA, ZC3H13, RBM15, and RBM15B (writers), while the modification is removed by demethylases such as FTO and ALKBH5 (erasers). In addition, modifications can be recognized by m6A binding proteins, such as YTHDC1/2, YTHDF1/2/3, HNRNPC, FMR1, LRPPRC, HNRNPA2B1, IGFBP1/2/3, and RBMX (readers) (4–6). A growing body of evidence shows that m6A regulators are involved in vital biological processes and are dynamically regulated in many physiological and pathological processes (7–9). Abnormal expression and genetic alterations of m6A regulators are closely related to events such as developmental defects, metabolic disorders, abnormal immune regulation, and tumor progression (10, 11). A comprehensive understanding of potential m6A regulators’ expression perturbation and genetic variation under cancer heterogeneity will facilitate the identification of therapeutic targets based on RNA methylation (12, 13).
Pancreatic cancer (PC) is a highly lethal malignant tumor, which is also one of the leading causes of cancer death worldwide (14). In the past 25 years, its global burden has more than doubled (15). With the in-depth comprehending of pathology, the diversity and complexity of tumor microenvironment have been increasingly understood, and immune cell subgroups which intimately involved in tumor genesis, metastasis and treatment are gradually recognized (16–19). Tumor microenvironment (TME) has been found to play an important role in ineffective treatment and poor prognosis of pancreatic cancer. Many molecules and related signal transduction pathways in the microenvironment can promote cancer metastasis or immunosuppression. A variety of soluble immunosuppressive molecules and immunosuppressive cells can lead to the disorder of immune effector cells, thus forming a unique immunosuppressive environment for pancreatic cancer (20). Increasing research focuses on whether the components of TME (including acellular matrix, pancreatic stellate cells, immune cells and soluble factors) can be used as effective targets for PC therapy (21). Recently, immune checkpoint inhibitors and chimeric antigen receptor T (CAR-T) cell therapy have become popular immunotherapies related to TME in pancreatic cancer (22, 23). However, whether these therapies can bring clinical benefits remains to be fully studied. A comprehensive understanding of the characteristics of the tumor microenvironment in PC will make a beneficial contribution to the research of immunotherapy and provide new insights for basic and clinical applications.
An increasing number of studies have confirmed the close correlation between TME infiltrating immune cells and m6A modification, which could not be completely explained by the mechanism of RNA degradation. According to the study of Liu et al. (24), FTO enhances protein expression by regulating the m6A modification of JUNB and CEBPB genes, thereby promoting tumor glycolysis and inhibiting T cell effects. The FTO inhibitor Dac51 can inhibit FTO-mediated demethylation, inhibit the glycolytic ability of tumor cells, increase T cell infiltration, and have a synergistic effect with anti-PD-L1 therapy. The study of Han et al. (25) showed that YTHDF1 recognizes and binds to the transcript encoding lysosomal protein modified by m6A, increases the translation of lysosomal cathepsin in dendritic cells (DC), while inhibition of cathepsin can significantly increase the ability of cross-presenting antigen of dendritic cells. The absence of YTHDF1 in DC can enhance the cross-presentation of tumor antigens and the cross-priming of CD8+ T cells, thereby increasing the anti-tumor response of CD8+ T cells and enhancing the therapeutic effect of PD-L1 checkpoint blockade. It has been reported that cytotoxic tumor-infiltrating CD8+ T cell is increased in METTL3 or METTL14 deficient tumor. Depletion of METTL3 and METTL14 can inhibit m6A modification and enhance the response to anti-PD-1 therapy in colorectal cancer and melanoma (26). However, the above studies have focused on one or two m6A regulators and immune cell types, while tumor formation and suppression are the results of the highly synergistic effects of multiple regulatory factors. Therefore, the comprehensive analysis of the infiltration characteristics of tumor microenvironment mediated by m6A regulator is helpful to promote the cognition of tumor immune regulation.
At present, there are widely accepted molecular subtypes in pancreatic cancer, such as two tumor-specific subtypes and stromal subtypes identified by Moffitt et al. and purity Independent Subtyping of Tumors (PurIST) developed by Rashid et al. (27, 28). These classifications may mainly be concerned with the components of the tumor at the pathological level and show good clinical value. We aimed to identify new subtypes from the m6A methylation modification direction and construct scores to supplement the existing clinical variable information, and correlate these analyses with the tumor microenvironment. Meng et al. have proposed an m6A-related mRNA signature, which can play a good prognostic predictive effect in pancreatic cancer (29). However, their study divided groups based on the existence of alterations (mutation and/or CNV) of m6A-related genes, and then identified differentially expressed genes for model construction. According to previous studies (30), data including gene expression profile, somatic mutation, and DNA methylation information can be used to identify the primary sites and origins of tumors, but the accuracy of gene expression data is the highest, especially in pancreatic cancer. Since gene expression data may provide more clinical value, this study identified subtypes based on m6A regulator gene expression to mine more accurate clinical subtypes and prognostic indicators.
In this study, we integrated the transcriptome information of 434 pancreatic cancer samples from five independent cohorts, comprehensively evaluated m6A modification patterns, and correlated the characteristics of immune cell infiltration in TME. Through the unsupervised clustering method, we identified two different m6A modification subtypes and defined two m6A-related gene subtypes. We found that distinct subgroups were accompanied with different immune cell infiltration characteristics. In addition, we constructed a scoring scheme to quantify individual m6A modification patterns, and predicted the prognosis and response to immunosuppressive therapy based on the score. Our findings indicate that m6A modification is closely related to TME immune cell infiltration, and can be used as a favorable predictor of prognosis and immunotherapy in pancreatic cancer.
The workflow of this study was shown in Figure S1. The expression profile data and clinical information of pancreatic cancer samples were obtained from the Cancer Genome Atlas (TCGA, RRID : SCR_003193, https://tcga-data.nci.nih.gov/tcga/) and Gene-Expression Omnibus (GEO, RRID : SCR_005012, https://www.ncbi.nlm.nih.gov/geo/) database. This study collected 5 independent PC cohorts (TCGA-PAAD, GSE28735, GSE57495, GSE62452, GSE85916) for further analysis. RNA sequencing data in TCGA (FPKM format) were downloaded and transformed into TPMs (transcripts per kilobase million). We download the normalized matrix file in GEO, and applied ComBat algorithm in the R package SVA to eliminate batch effects between different GEO data sets. The survival status and survival time of the samples were extracted from the clinical information of the 5 PC cohorts. Data with follow-up time less than 31 days and duplicate data were excluded. Somatic mutation data was collected from the TCGA database. The copy number variation data (CNV) of TCGA-PAAD was downloaded from the UCSC Xena database (http://xena.ucsc.edu/).
We searched the relevant literature on m6A methylation modification to identify recognized m6A regulators for subsequent analysis. A total of 23 m6A regulators were included, including 8 writers (METTL3, METTL14, METTL16, WTAP, VIRMA, ZC3H13, RBM15, and RBM15B), 13 readers (YTHDC1, YTHDC2, YTHDF1, YTHDF2, YTHDF3, HNRNPC, FMR1, LRPPRC, HNRNPA2B1, IGFBP1, IGFBP2, IGFBP3, and RBMX), and 2 erasers (FTO and ALKBH5). Unsupervised clustering analysis was performed to identify different m6A methylation modification subtypes according to the expression of 23 m6A regulators, and patients were classified for further analysis. The number of clusters (K) and their stability were determined by the consensus clustering algorithm. Li et al. (31) tested four methods for finding K: the cumulative distribution function (CDF), the proportional change in the area under the CDF curve upon an increase of K (Δ(K)), GAP-PC (32) and CLEST (33). They found that CDF was able to reveal the correct K, as the CDF curve was flat only for the true K, reflecting a perfectly or near-perfectly stable partitioning of the samples at the correct K. So we took the K corresponding to the flattest CDF curve as the determined number of clusters. The R package consusclusterplus was utilized to perform the above steps (34).
The R package CIBERSORT was used to quantify the infiltration of different immune cells in PC samples from five cohorts. Leukocyte signature matrix (LM22) contains 547 reference genes, which can be used to distinguish 22 human immune cell phenotypes, including various types of T cells, B cells, NK cells, plasma cells, and myeloid subgroups. CIBERSORT is a deconvolution algorithm, which can calculate the proportion of different types of cells in the sample based on LM22 (35). The ESTIMATE algorithm infers the cell density and tumor purity of the tumor based on the transcriptome profile of the sample (36). Tumor tissue with rich immune cell infiltration indicates a higher immune score and lower tumor purity. The R package ESTIMATE was used to evaluate the immune and stromal content (immune and stromal score) in each sample.
Previous consensus clustering algorithms divided patients into two different m6A modification subtypes based on the expression of 23 m6A regulators. R package Limma was used to identify DEGs between the two m6A modification clusters with adjusted P value < 0.05.
GO (Gene Ontology) is a crucial bioinformatics tool for annotating and analyzing the biological functions of genes, including MF (molecular function), BP (biological processes), and CC (cellular components). As a database resource, KEGG (Kyoto Encyclopedia of Genes and Genomes) is mainly used to understand the high-level functions and values of biological systems from molecular-level information. To get annotation information and explore the biological functions of the above DEGs, GO and KEGG enrichment analyses were accomplished using clusterProfiler package with a cutoff of p-value < 0.05 and q-value < 0.05.
To quantify the modification pattern of m6A in individual PC patients, we used principal component analysis (PCA) to construct the m6A scoring scheme. Firstly, univariate Cox regression model was performed on DEGs identified between different m6A modification clusters, and the genes with significant prognosis effect were selected for clustering samples and constructing m6A score. The patients were divided into several groups for further analysis. The number and stability of gene clusters were determined by consensus clustering algorithm. Subsequently, principal component analysis was used to construct the m6A-related gene signature, and principal component 1 and principal component 2 were extracted as signature scores. This method focuses the score on the set with the largest block of strongly related or anti-related genes, while reducing the contribution of genes that are not tracked with other set members. Besides, the PCA algorithm can effectively achieve data dimensionality reduction and largely retain the information of the original data. We used a method similar to GGI (37, 38) to define the m6A score: where i is the expression of final genes related to the m6A phenotype.
To verify the reliability and clinical application value of m6A score, the receiver operating characteristic (ROC) curves of 1-, 3-, and 5-year were drawn. We first drew the ROC curve based on all samples. Then, the ROC curve was drawn solely in the TCGA-PAAD cohort, and the prognostic prediction performance of m6A score and other clinical indicators were compared. Univariate and multivariate Cox regression analyses were used to evaluate the correlation between the patient’s m6A score, clinical variables, and prognosis to determine whether the score can be used as an independent prognostic indicator of pancreatic cancer. P < 0.05 indicated that the difference was statistically significant. The results were shown in the forest diagram. Next, 8 indicators (age, gender, grade, stage, stage_T, stage_N, stage_M, and m6A score) were used to construct a nomogram to personally predict the 1-year, 3-year, and 5-year survival rates of patients. The ROC curve was drawn to show the predictive performance of the nomogram. The R packages survival, survminer, timeROC, rms, and regplot are used for calculation and graph drawing.
We calculated the copy number increase or loss frequency of 23 m6A regulators in the TCGA-PAAD cohort, and used the R package Rcircos to draw a copy number variation map of m6A regulators on human chromosomes. To determine the tumor mutation burden (TMB), we counted the total number of non-synonymous mutations in the TCGA-PAAD cohort. R package maftools was used to plot the oncoprint of gene mutation.
Immunophenoscore (IPS) is a favorable factor to predict the efficacy of anti-CTLA-4 and anti-PD-1 regimens, which can quantify the determinants of tumor immunogenicity and show the characteristics of tumor immune landscape (39). The score is calculated based on four categories of immune-related genes, including MHC molecules (MHC), immunomodulators (CP), effector cells (EC), and suppressor cells (SC). IPS of samples in TCGA-PAAD were downloaded from the online platform The Cancer Immunome Atlas (TCIA, RRID : SCR_014508, https://tcia.at/home) for further analysis.
All statistical analysis and graph drawing were completed by R-4.0.3. The Wilcoxon rank-sum test was used for comparison between two groups. Kaplan-Meier survival analysis and univariate Cox regression model were performed to calculate the relationship between m6A regulators and prognosis. According to the correlation between m6A score and patient survival, R package Survminer was used to repeatedly test all possible cut-off points to obtain the largest rank statistic, and the patients were divided into high and low m6A score groups based on the largest selected log-rank statistic. The Kaplan-Meier method was utilized to draw the survival curve for prognostic analysis, and the log-rank test was used to determine the significance of the difference. Spearman correlation analysis and distance correlation analysis were applied for the correlation test. All heat maps were generated by R package pheatmap. All statistical P value were two-tailed, and P < 0.05 was statistically significant.
In this study, 23 m6A regulators were identified, including 8 writers, 13 readers, and 2 erasers. We first calculated the incidence of somatic mutations in PC. Among 158 tumor samples, a total of 120 cases (75.95%) had genetic alterations, of which TP53 and KRAS mutations were the most frequent with more than 50% (Figure 1A). However, the mutation frequency of 23 m6A regulators was pretty low, genetic alterations occurred in only 5 (3.16%) samples (Figure 1B). We further analyzed the relationship between TP53 and KRAS mutations and the expression of m6A regulators. There were differences in the expression of multiple m6A regulators between the wild group and mutant group (Supplementary Figures 3, 4). Analysis of copy number variation of 23 m6A regulators showed that CNV mutations were common in PC. VIRMA, HNRNPA2B1, IGFBP1, IGFBP3, YTHDF3, and YTHDF1 had widespread CNV amplification. However, METTL16, WTAP, ALKBH5, YTHDF2, and RBM15B showed extensive CNV deletions (Figure 1C). The location of CNV changes on the chromosome was illustrated in Figure 1D. Kaplan-Meier survival analysis showed that 15 m6A regulators were correlated with the prognosis of PC patients (Supplementary Figure 2). Univariate Cox regression model revealed the prognostic value of 23 m6A regulators in PC patients (Supplementary Table 1). As shown in Figure 1E, the network presents a comprehensive landscape of the interactions, connection, and prognostic significance of m6A regulators in PC. The results indicated that writers, readers, and erasers have a significant correlation in expression. The cross-talk among them probably plays an essential role in the formation of different m6A modification patterns, and might be related to the occurrence and development of cancer. In addition, we implemented CIBERSORT and ESTIMATE algorithms to quantify the activity or enrichment level of immune cells in pancreatic cancer tissues. The correlation coefficient heatmap was used to display a general landscape of immune cell interactions in the tumor microenvironment (Figure 1F).
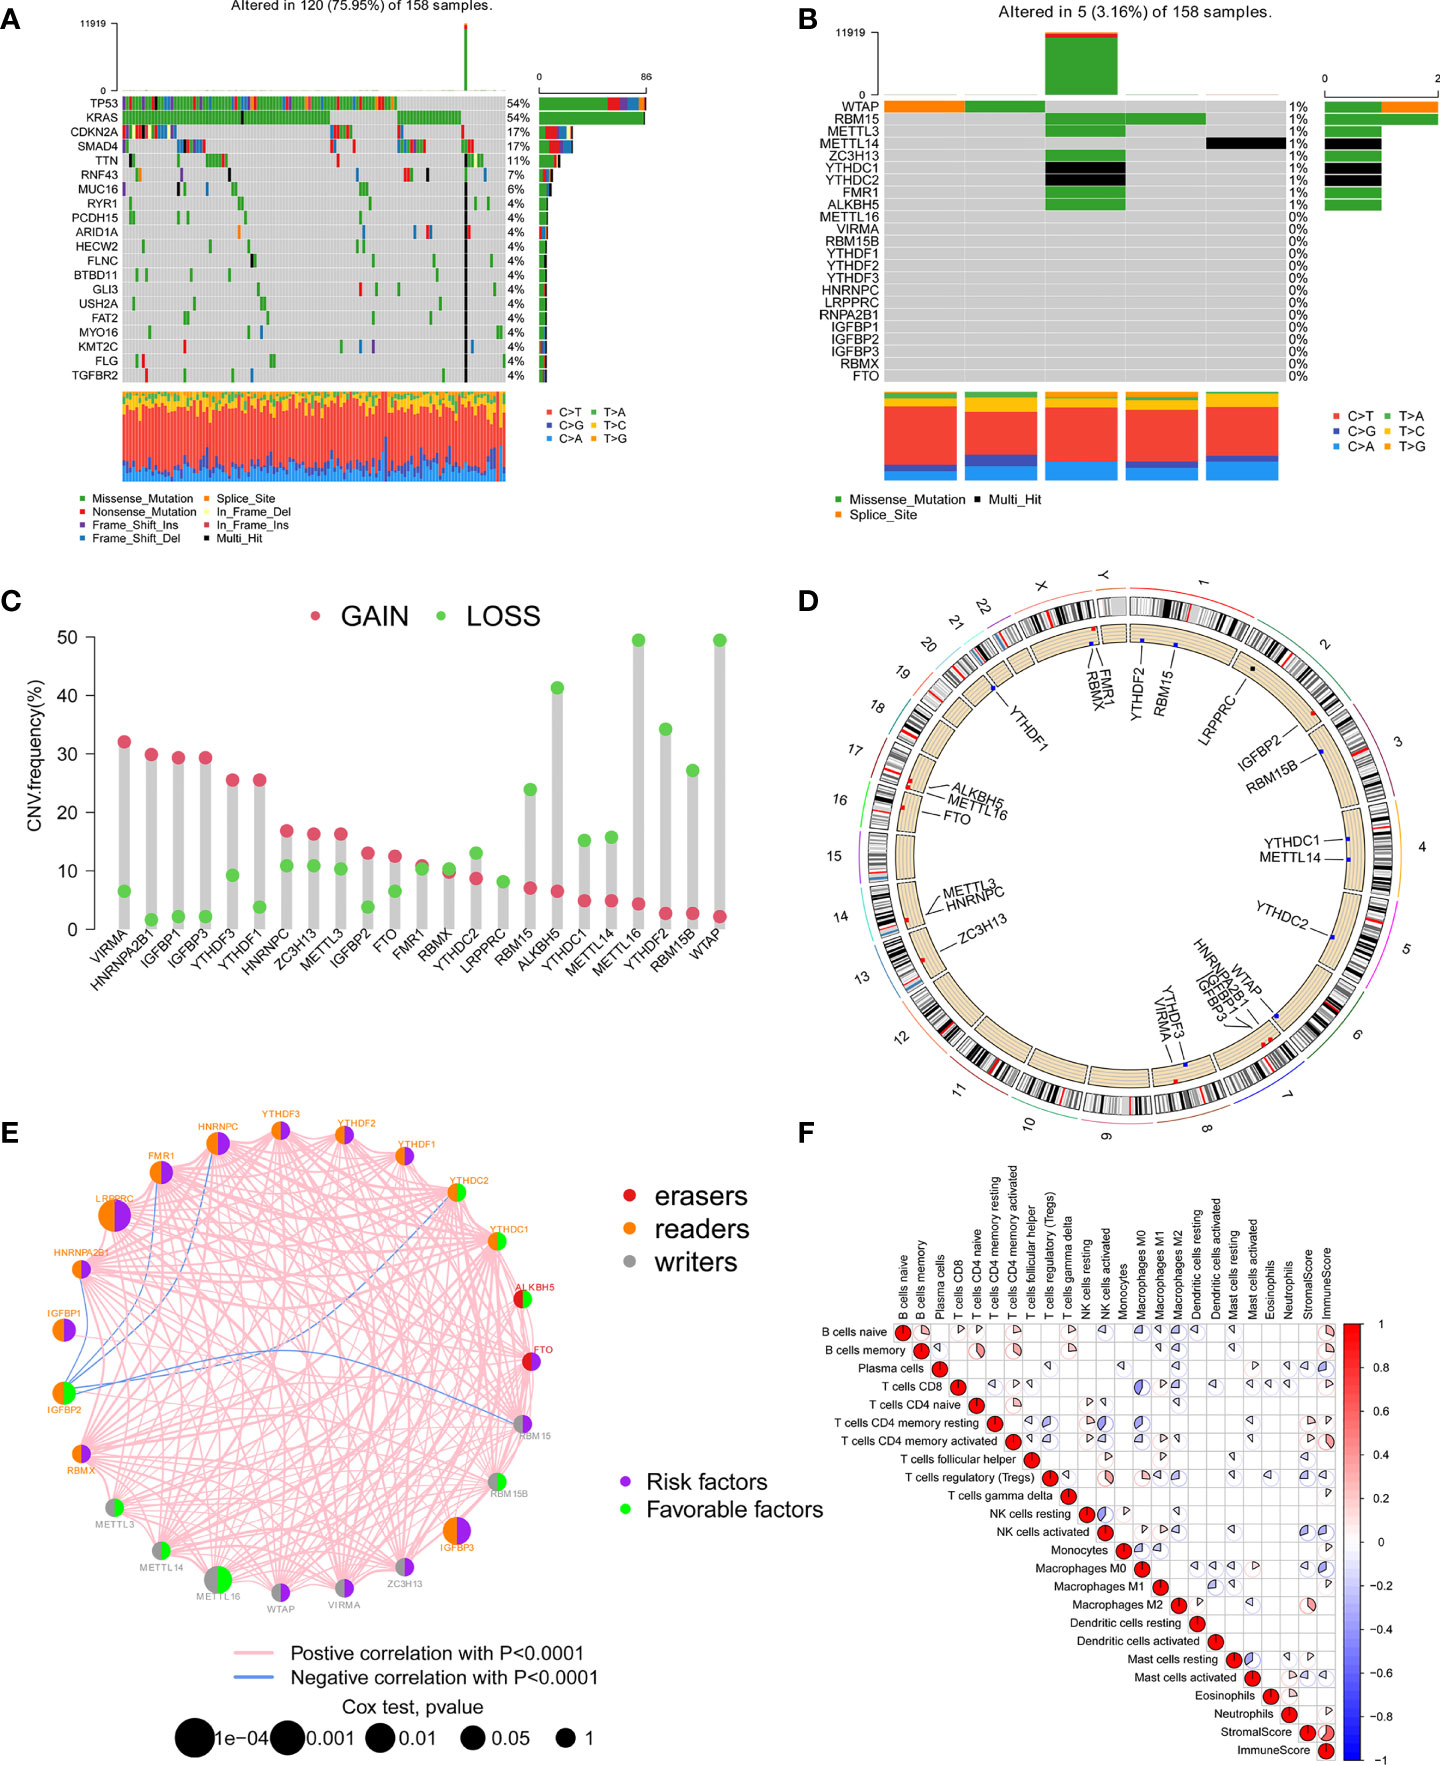
Figure 1 The landscape of genetic variation, immune infiltration, and prognosis of m6A regulators. (A) The top 20 genes with the highest mutation frequency in the TCGA-PAAD cohort. The main types of mutations were missense mutations. (B) Mutations of 23 m6A regulators in the TCGA-PAAD cohort. (C) The CNV mutation frequency of 23 m6A regulators in the TCGA-PAAD cohort. Each column indicated the frequency of mutations. Amplification frequency, red dot; missing frequency, green dot. (D) The location of CNV changes of 23 m6A regulators on the chromosome. (E) The interaction of 23 m6A regulators and their prognostic significance in 5 independent PC cohorts. The three types of m6A regulatory genes were represented by different colors. Erasers, red; Readers, orange; Writers, grey. The size of the circle represented the prognostic effect of each m6A regulator, and was adjusted according to the p-value. Prognostic risk factors, purple; prognostic protective factors, green. (F) Cellular interaction of the tumor-infiltrating immune cell types.
Based on the expression of 23 m6A regulators, the R package ConensusClusterPlus was used to qualitatively classify patients with different m6A modification subtypes. Through the consensus clustering algorithm, two different m6A modification subtypes were finally identified, including 294 cases in subtype A and 140 cases in subtype B (Figures 2A–D and Supplementary Table 2). We named these two subtypes m6A cluster A and m6A cluster B, showed the expression of 23 m6A regulators in the two modified subtypes by heatmap (Figure 2E). The expression levels of 23 m6A regulators between the two m6A clusters were also compared and shown in Figure 2F. To explore the internal biological changes under different m6A modification modes, we compared the composition of immune cells in TME. The result showed that m6A cluster A was characterized by higher infiltration of memory B cells and activated memory CD4+ T cells. In m6A cluster B, the infiltration of activated NK cells, M0 macrophages, and Neutrophils were significantly increased (Figure 2G). To reveal the potential biomolecular characteristics of different m6A modified phenotypes, R package LIMMA was used for differential expression analysis to determine the transcriptome differences between two subtypes. We identified 1159 differentially expressed genes and annotated DEG with R package clusterProfiler. Figures 2H, I summarized the significant biological processes of DEG enrichment, such as glucose metabolism, glycolysis, HIF-1 signaling pathway, Hippo signaling pathway, and TGF-β signaling pathway. These results suggested that the m6A methylation modification may involve in tumor metabolism and immune regulation, and was closely related to tumor genesis and progression. Supplementary Tables 3, 4 provides detailed descriptions.
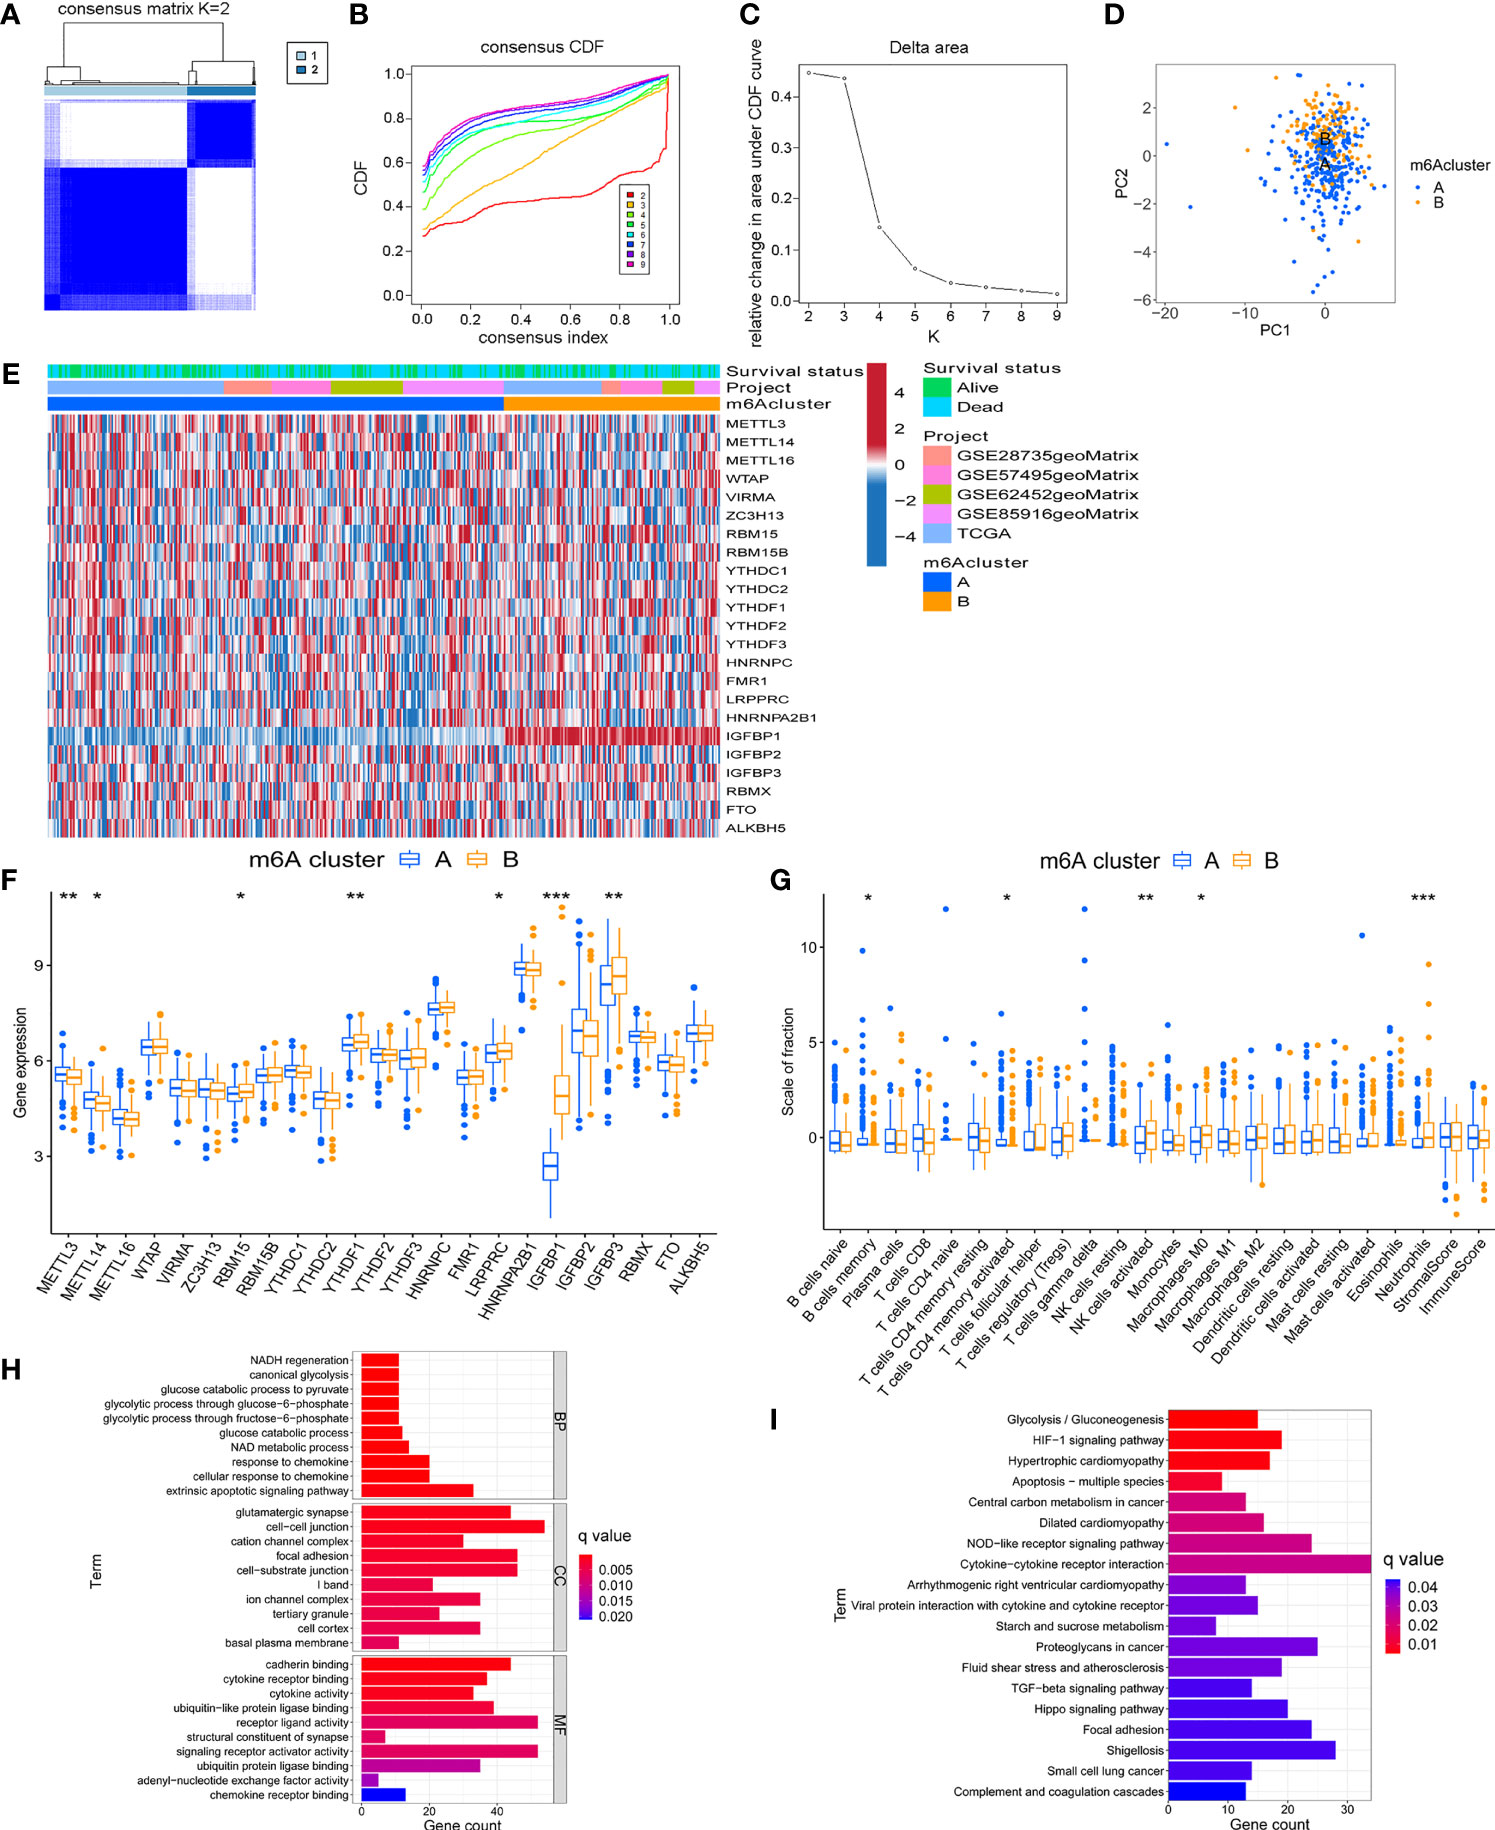
Figure 2 Identification of m6A methylation modification subtypes. (A) Heat map of sample clustering under k = 2 in 5 independent PC cohorts. (B) Consensus clustering cumulative distribution function (CDF) with the number of subtypes k = 2 to 9. (C) The relative change of the area under the CDF curve of k = 2 to 9. (D) Principal component analysis of the expression profiles of 23 m6A regulators to distinguish two determined m6A clusters. (E) Unsupervised clustering of 23 m6A regulators in two m6A clusters. (F) Differences in the expression of 23 m6A regulators between distinct m6A clusters. (G) TME immune-infiltrating characteristics and transcriptome traits of two m6A clusters. (H) GO enrichment pathway of differentially expressed genes between two m6A clusters. (I) KEGG enrichment pathway of differentially expressed genes between two m6A clusters. ***P < 0.001; **P < 0.01; *P < 0.05.
Although the consensus clustering algorithm based on 23 m6A regulators classified PC patients into two subtypes, potential genetic changes and prognostic correlations in these phenotypes were not very clear. We performed univariate COX regression analysis on the 1159 DEGs between the previously identified m6A clusters, and obtained 719 survival-related genes which were named m6A-related signature genes (Supplementary Table 5). Based on representative m6A-related signature genes, we adopted unsupervised cluster analysis and identified two stable transcriptome phenotypes, which were defined as gene cluster A and gene cluster B (Figures 3A–C). In addition, we explored the prognostic significance of gene subtypes by integrating transcriptome and survival information. Through Kaplan-Meier analysis and log-rank test, gene cluster B showed a better prognosis (P < 0.001, Figure 3D). The heatmap showed the transcriptome profile of 719 m6A-related signature genes in two gene clusters (Figure 3E). The expression levels of 23 m6A regulators between the two m6A-related gene clusters were also compared. Significant differences in the expression of m6A regulators were observed, which was consistent with the expected result of m6A modification patterns (Figure 3F). Previous studies have shown that the immune system may produce favorable or unfavorable consequences, which may manifest as pro-tumor or anti-tumor activity. Monocytes and anti-tumor lymphocyte subsets such as CD8+ T cells, memory CD4+ T cells, and naive B cells had a higher level of infiltration in gene cluster B, while activated NK cells and mast cells infiltrated more abundantly in gene cluster A (Figure 3G). The immune and stromal score based on the ESTIMATE algorithm indicated that the infiltration of immune cells and stromal components in gene cluster B was higher. Therefore, we speculate that the abundant immune cell infiltration in gene cluster B forms an effective anti-tumor immune response.
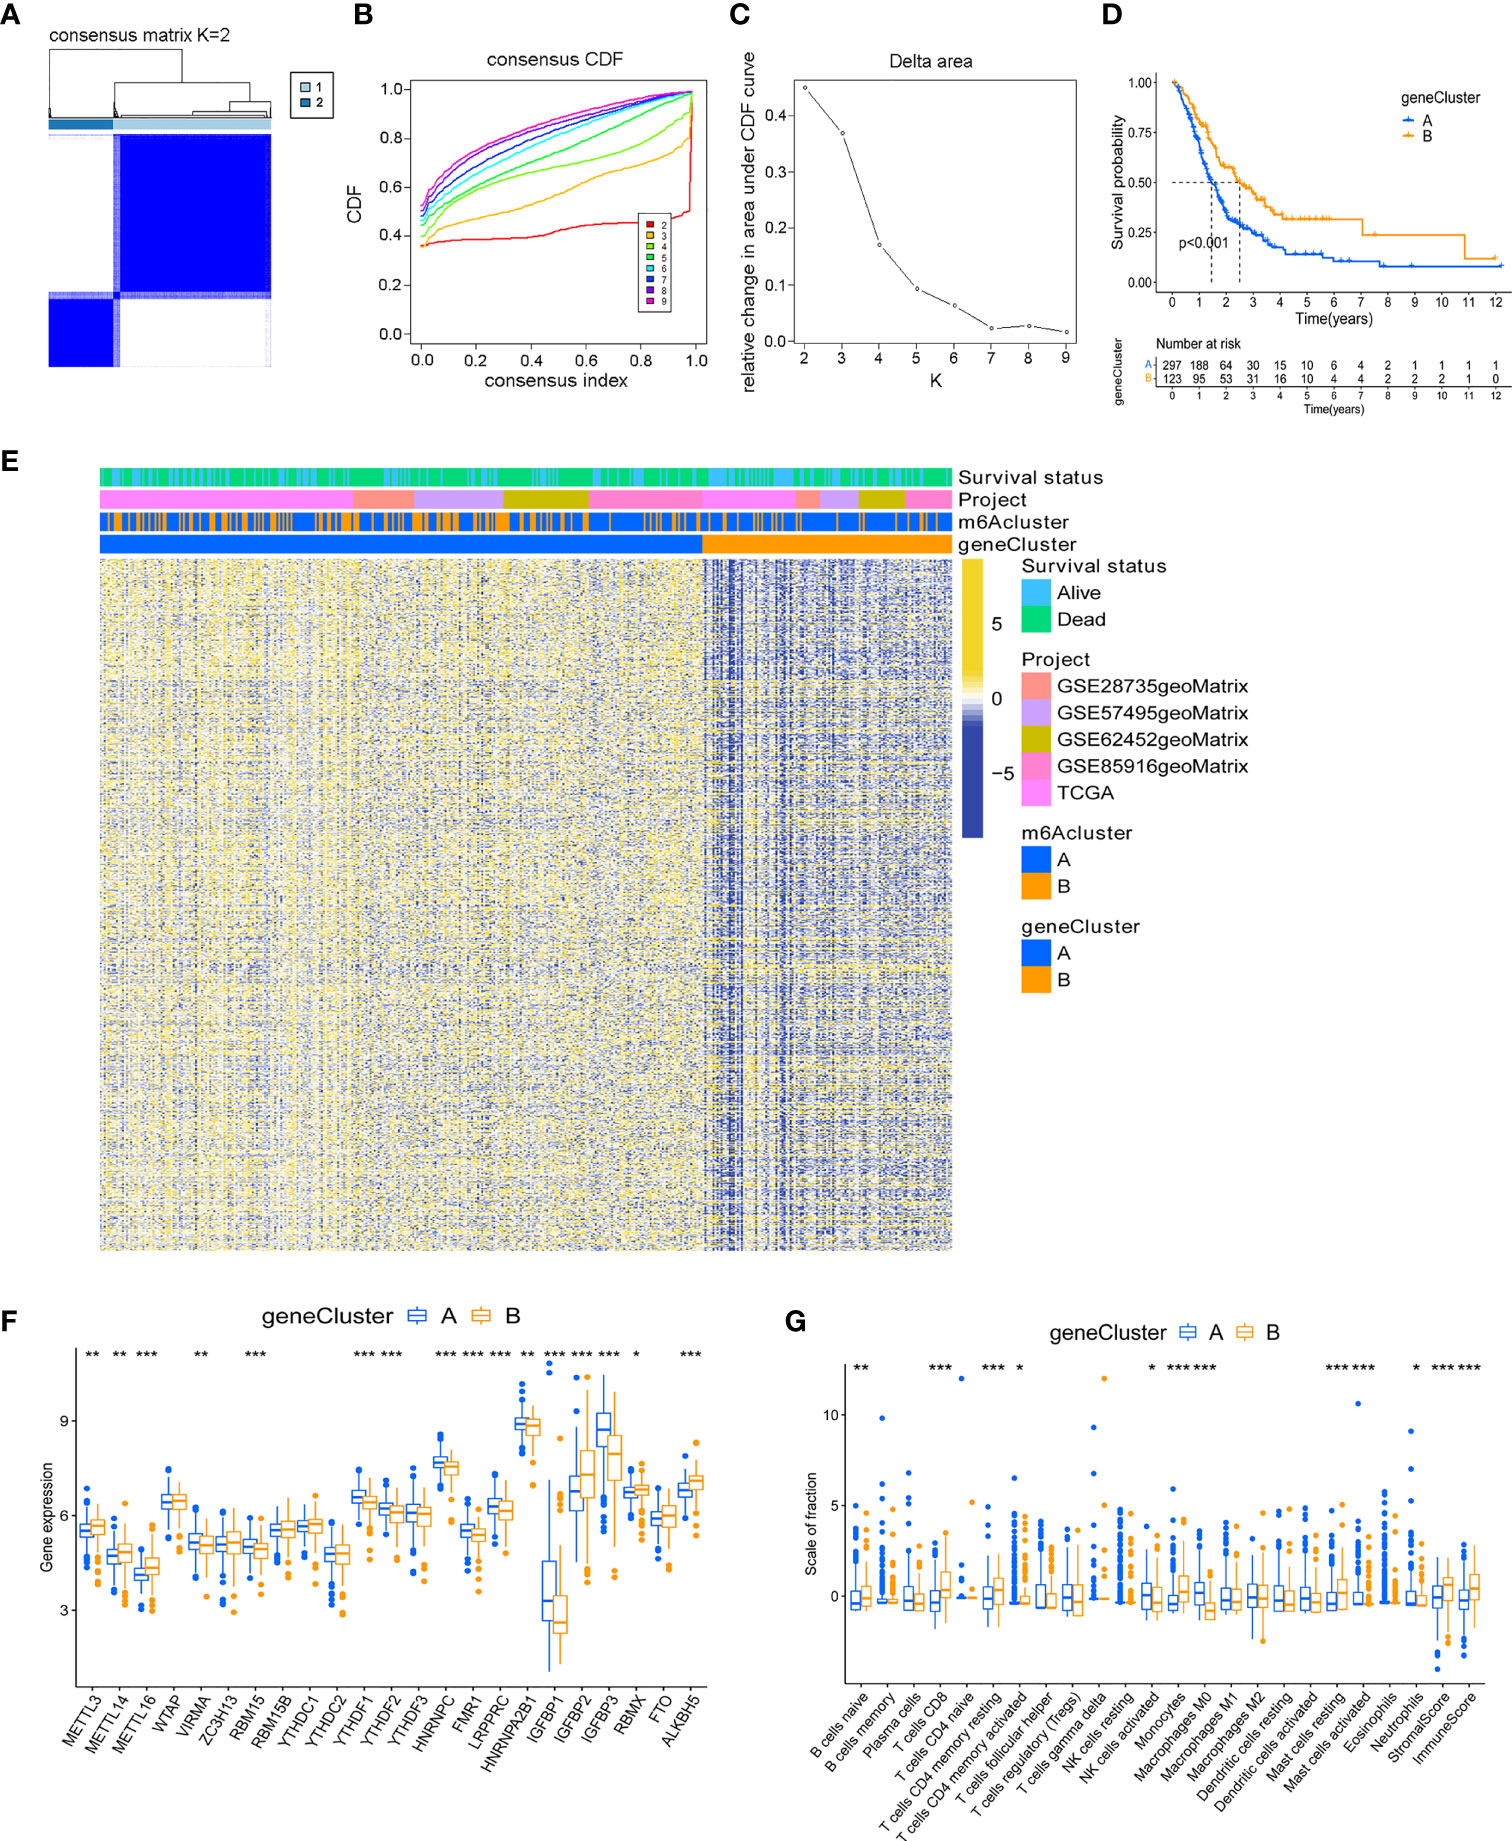
Figure 3 Identification of m6A-related gene subtypes. (A) Heat map of sample clustering under k = 2 in 5 independent PC cohorts. (B) Consensus clustering cumulative distribution function (CDF) with the number of subtypes k = 2 to 9. (C) The relative change of the area under the CDF curve of k = 2 to 9. (D) Survival analysis of patients in two m6A-related gene clusters. (E) Unsupervised clustering of m6A related signature genes. (F) Differences in the expression of 23 m6A regulators between distinct gene clusters. (G) TME immune-infiltrating characteristics and transcriptome traits of two m6A-related gene clusters. ***P < 0.001; **P < 0.01; *P < 0.05.
Although the above results demonstrated the role of m6A methylation modification in the regulation of immune cell infiltration and prognosis, these analyses cannot accurately predict the m6A methylation modification pattern in a single tumor patient. To obtain a quantitative index of the m6A modification landscape of PC patients, we extracted the scores of principal component 1 and principal component 2 for calculating the final m6A score. Figure 4A showed that patients’ m6A score in m6A cluster A was lower than m6A cluster B, and Figure 4B depicted that the m6A score in gene cluster B was lower than that in gene cluster A. We drew an alluvial diagram to display the process of m6A score construction (Figure 4C). Subsequent analysis revealed the prognostic significance of m6A score. According to Figure 4D, the patients’ survival rate (41% vs. 23%) in the m6A low score group was much higher than that in the high score group. The overall average m6A score of the surviving patients was lower than that of the dead patients (Figure 4E, P = 0.0025). Kaplan-Meier survival analysis showed that the prognosis of patients in the low m6A score group was significantly better (Figure 4F, P < 0.001).
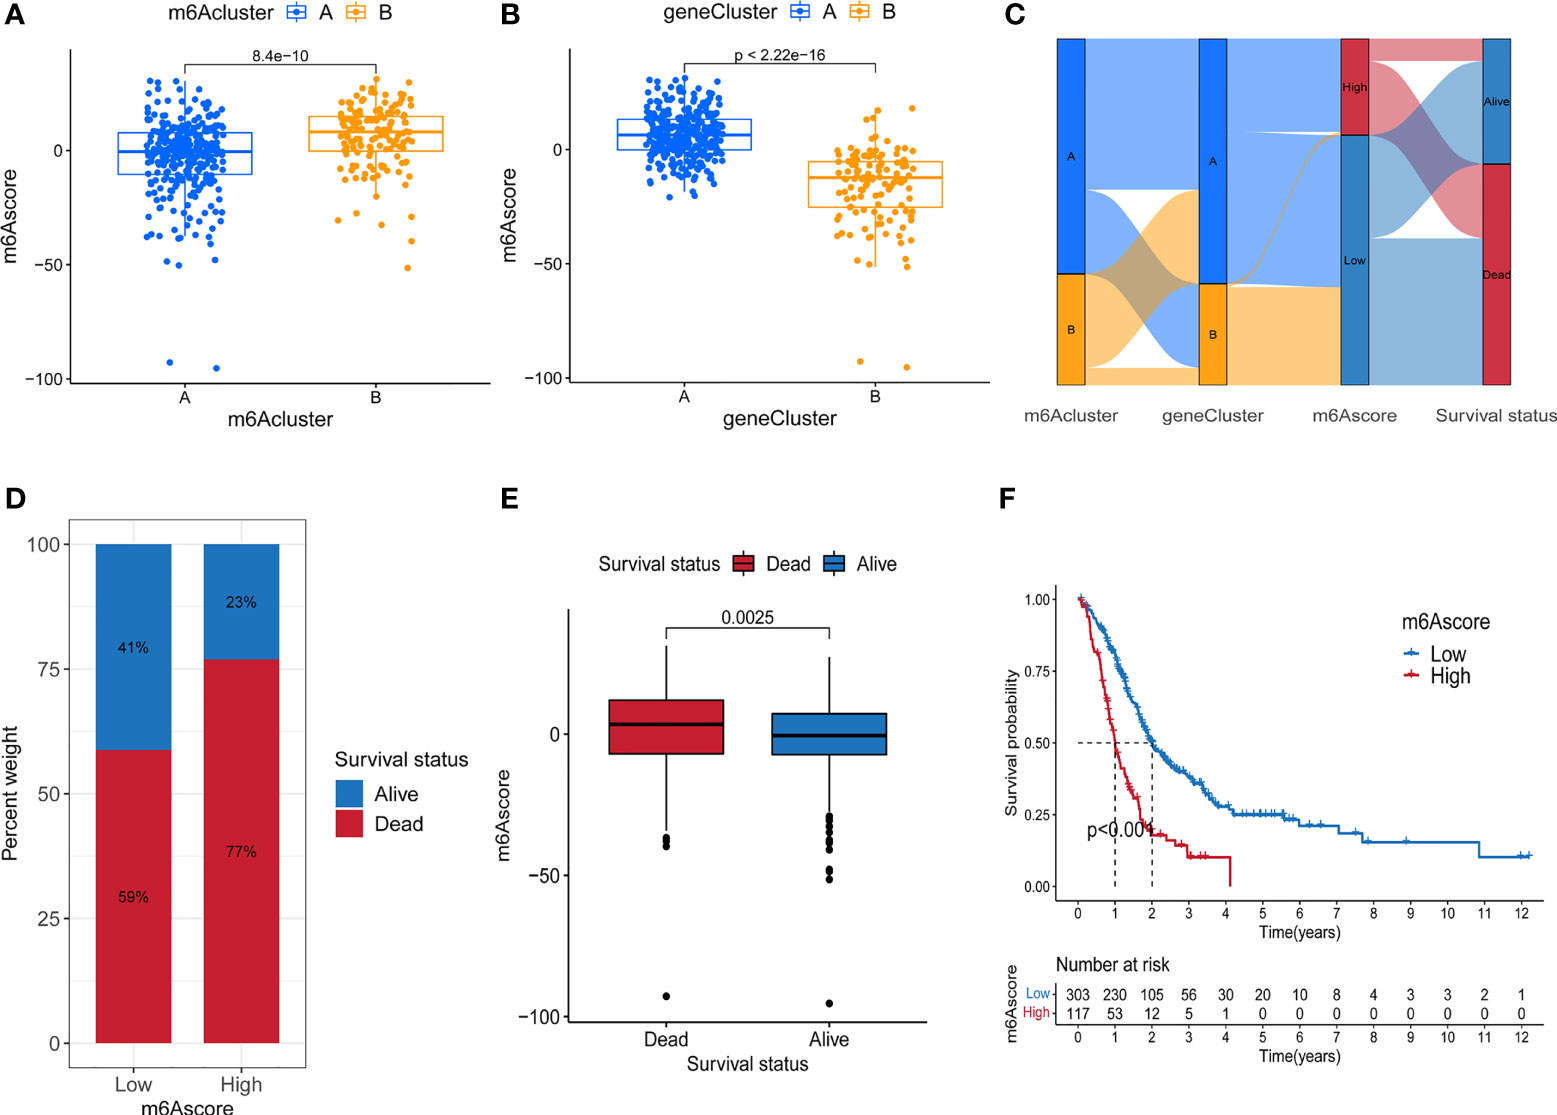
Figure 4 Construction of m6A score. (A) Difference of m6A score between two m6A methylation modification subtypes. (B) Difference of m6A score between two m6A-related gene subtypes. (C) Alluvial diagram containing m6A cluster, gene cluster, m6A score and survival changes. (D) The proportion of survival and death in high and low m6A score group. (E) Comparison of m6A scores between surviving and dead patients. (F) Survival analysis of high and low m6A score groups.
To verify the m6A score, the 1-, 3-, and 5-year ROC curves were drawn, and the value of the area under curve (AUC) of the m6A score was calculated. The results showed that the AUC values of all three curves were around 0.65 both in total samples (Figure 5A) and TCGA-PAAD cohort (Figure 5B). We also compared the 1-year ROC curve with other clinical characteristics in TCGA-PAAD cohort, and m6A score had the most considerable AUC value (Figure 5C). Univariate Cox regression analysis showed that age (p = 0.012, HR = 1.027, 95%CI [1.006-1.049]), grade (p = 0.026, HR = 1.392, 95%CI [1.041-1.862]) and m6A score (p = 0.002, HR = 1.022, 95%CI [1.008-1.037]) were considered statistically significant (Figure 5D). Multivariate Cox regression analysis showed age (p = 0.012, HR = 1.028, 95%CI [1.006-1.050]) and m6A score (p = 0.005, HR = 1.021, 95%CI [1.006-1.036]) were independent prognostic predictors (Figure 5E). By integrating multiple clinical indicators, the nomogram can be an effective tool for quantitatively assessing individual risks in the clinical environment. We constructed a nomogram to predict patients’ OS at 1-, 3-, and 5-year. Taking a random sample as an example, the total score of the patient was 340, the probability of survival time less than 1-, 3-, and 5-year were 0.123, 0.452, and 0.563, respectively (Figure 5F). The ROC curve was used to evaluate the predictive performance of the nomogram. The AUC values of 1-, 3-, and 5-year ROC curves were 0.718, 0.800, and 0.792, respectively (Figure 5G). The results showed that m6A score could be used as a new effective clinical predictor and can be combined with other clinical variables to improve the prognosis of patients with pancreatic cancer.
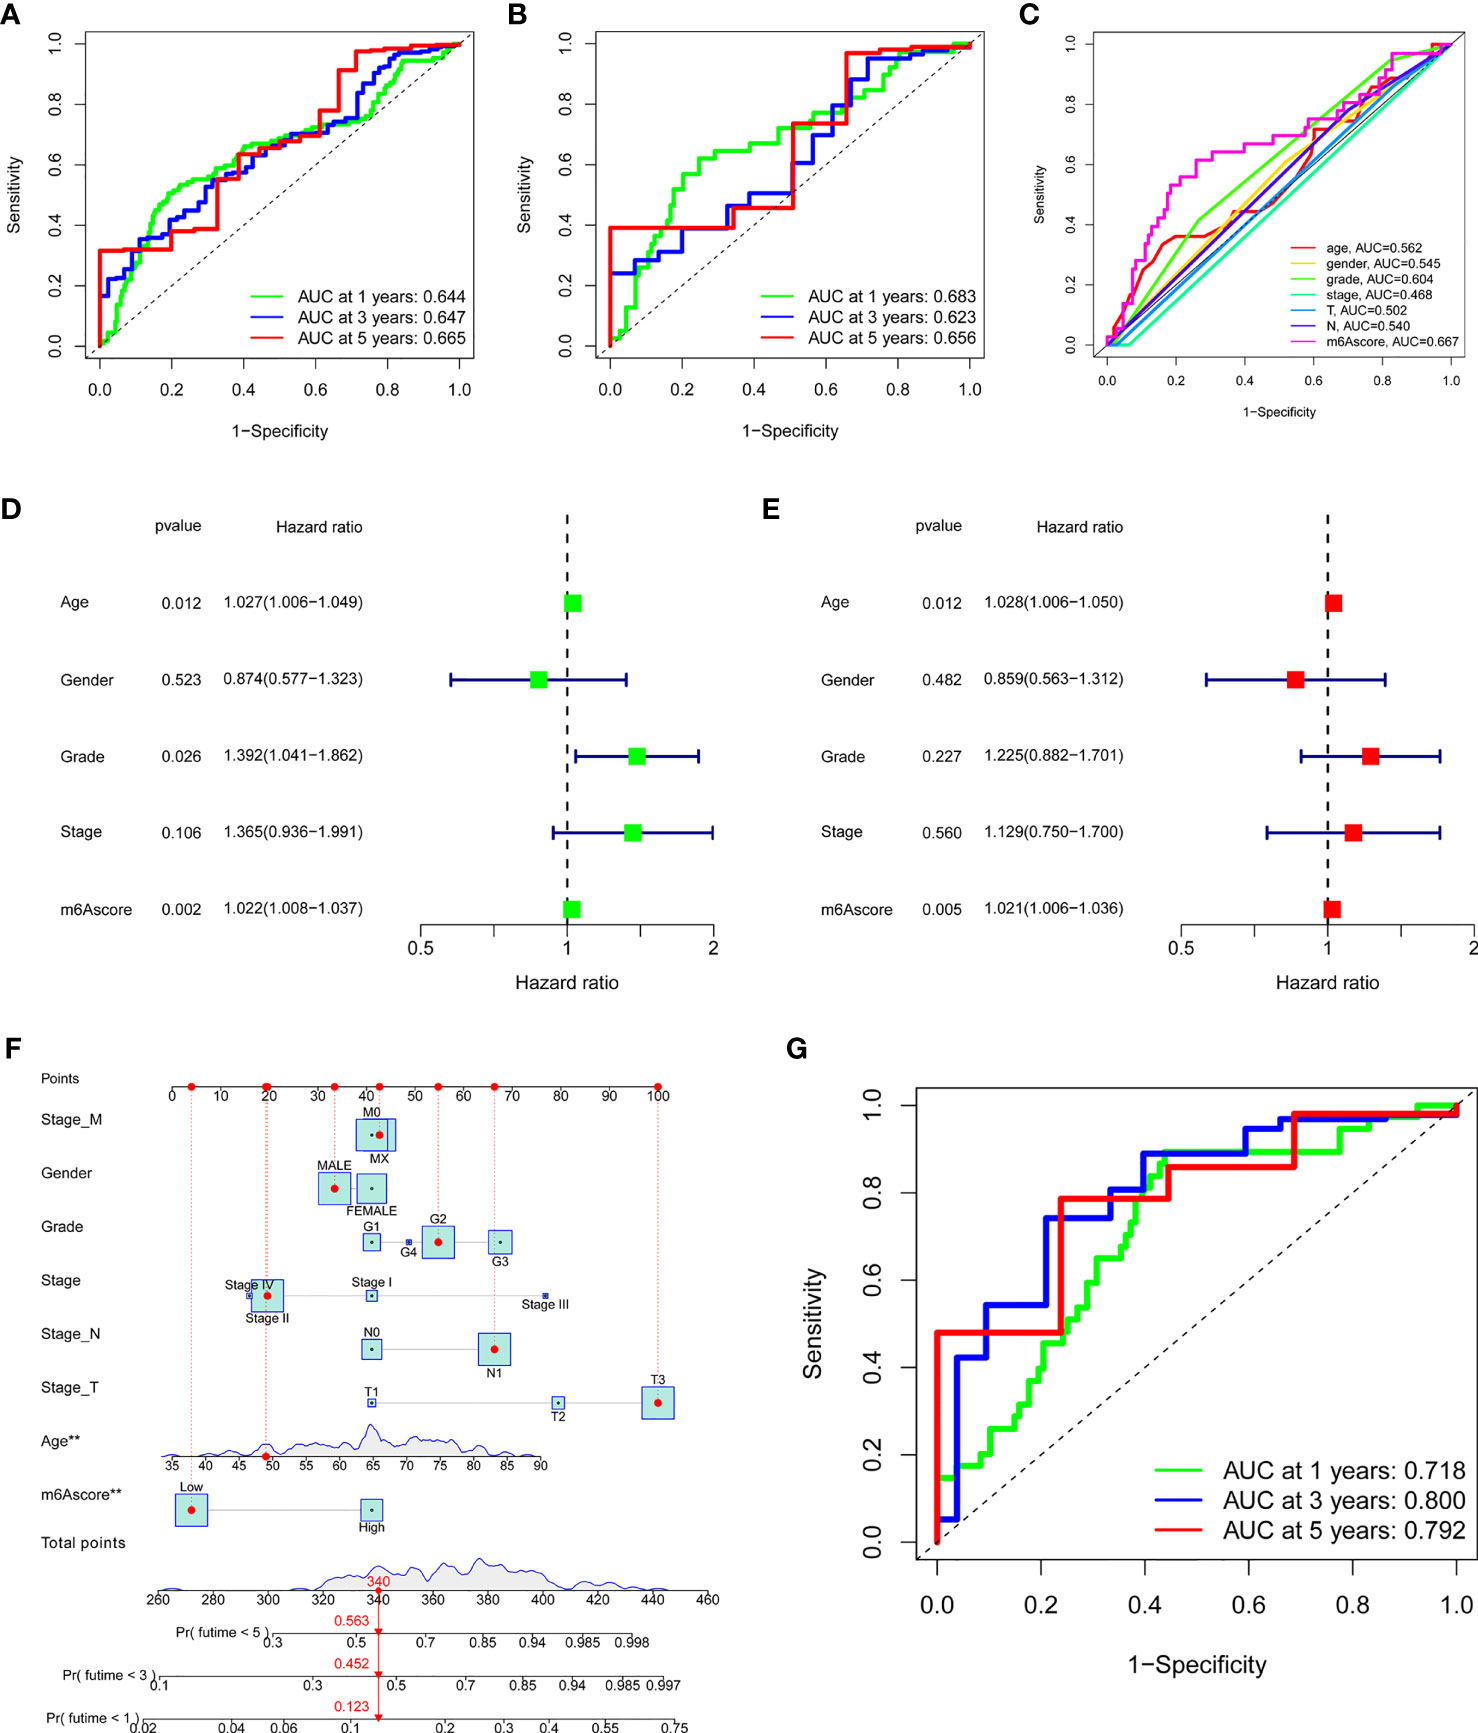
Figure 5 Validation and application of the m6A score in the clinical evaluation. (A) The AUC values of the 1-year, 3-year, and 5-year ROC curves of m6A score in all samples. (B) The AUC values of the 1-year, 3-year, and 5-year ROC curves of m6A score in the TCGA-PAAD cohort. (C) The comparation of 1-year ROC curve with other clinical characteristics in the TCGA-PAAD cohort. (D) Univariate COX regression analysis showed that age, grade, and m6A score were considered statistically significant. (E) Multivariate Cox regression analysis showed age and m6A score were independent prognostic predictors. (F) The nomogram to predict the probability of 1-year, 3-year, and 5-year survival rate. (G) The AUC values of the 1-year, 3-year, and 5-year ROC curves of the nomogram. ***P < 0.001; **P < 0.01; *P < 0.05.
Previous studies have shown that tumor mutation burden may be an emerging and potential tumor marker, which can assist in the selection of patients for immune checkpoint therapy. In view of the important clinical significance of TMB, we tried to explore the inner link between TMB and m6A score to clarify the genetic imprint of each m6A score subgroup. Correlation analysis showed a significant and positive association between m6A score and TBM (Spearman coefficient: R = 0.18, P = 0.032; Figure 6A). Next, we divided patients into two subgroups based on TBM. As shown in Figure 6B, we found that patients with low TMB showed better overall survival than patients with high TMB. Next, we evaluated the synergy of these scores in the prognostic stratification of PC. Survival analysis demonstrated that TBM status did not affect predictions based on m6A score, and the low m6A score group always showed a survival advantage (Figure 6C). In addition, we analyzed the somatic mutation landscape in the high and low m6A score groups, and found that the high m6A score group had a higher mutation rate (93.48%) than the low score group (70.65%). According to the results (Figures 6D, E), both KRAS (74% vs. 46%) and TP53 (78% vs. 43%) had a higher somatic mutation rate in the high m6A score group, which may be related to the poor prognosis of high m6A score group. These data can more comprehensively describe the impact of m6A score on genomic variation, and may provide new ideas for studying the potential interaction between m6A methylation modification and somatic mutation.
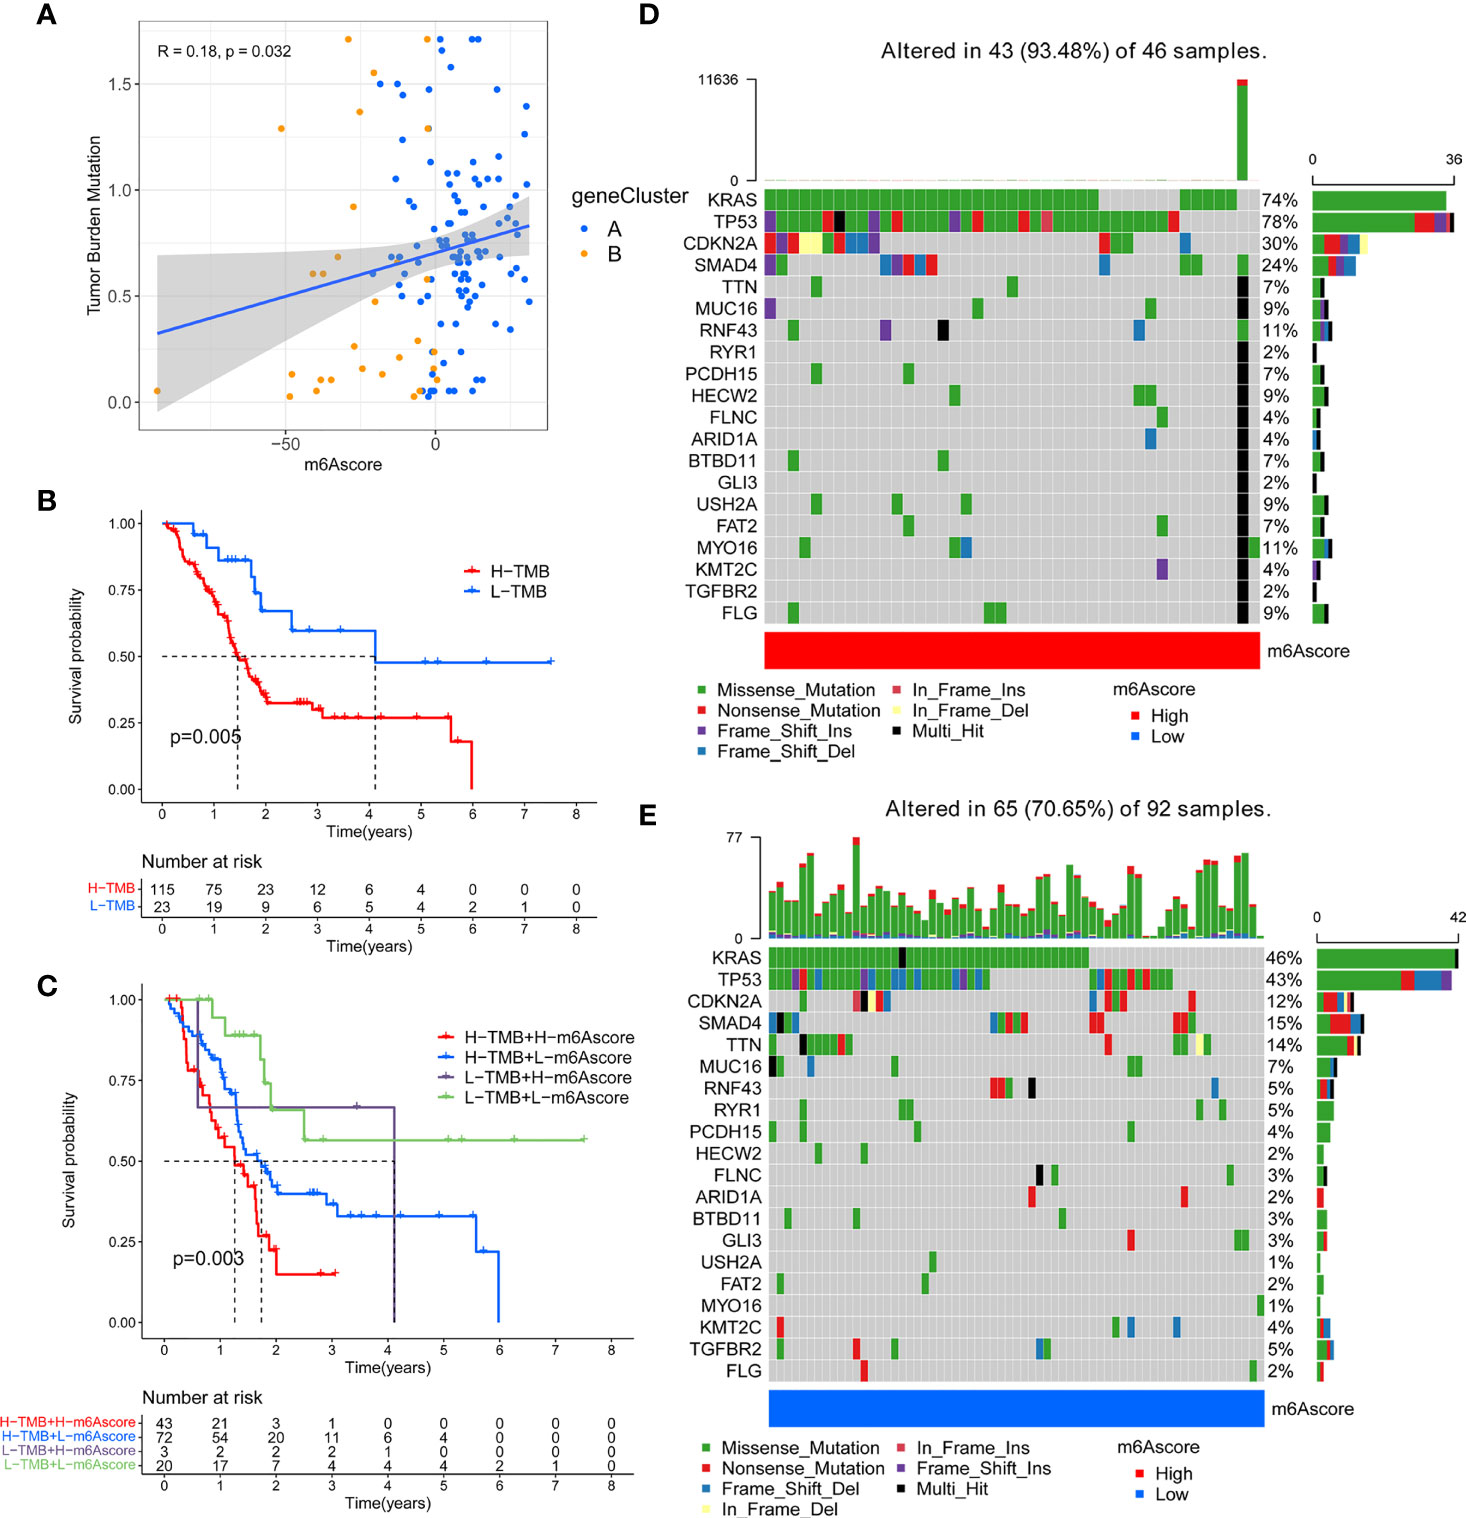
Figure 6 Correlation between m6A score and tumor mutation burden (TMB) in TCGA-PAAD cohort. (A) A scatter plot describing the positive correlation between m6A score and tumor mutation burden. (B) Survival analysis of high TMB group and low TMB group. (C) Stratified survival analysis including TMB and m6A scores. (D) OncoPrint for gene mutations in the high m6A score group. (E) OncoPrint for gene mutations in the low m6A score group.
The treatment of immune checkpoint inhibitors represented by CTLA-4/PD-1 inhibitors is undoubtedly a major progress in anti-tumor therapy. We compared the expression of common immune checkpoint genes between the high and low m6A score groups, and found that PD-L1 was highly expressed in the high m6A score group, PDCD1 was highly expressed in the low m6A score group, while the expression of CTLA4 and IDO1 had no significant difference between the two groups (Figures 7A–D). As a new predictor of the immune response, IPS is widely used and recommended for evaluating the immune response of patients. Our analysis showed that the IPS of the low m6A score group was higher no matter in the case of anti-PD-1/CTLA-4 therapy alone, or combination therapy (Figures 7E–H). These results indicated that m6A methylation modification in pancreatic cancer may play an important role in mediating the immune response.
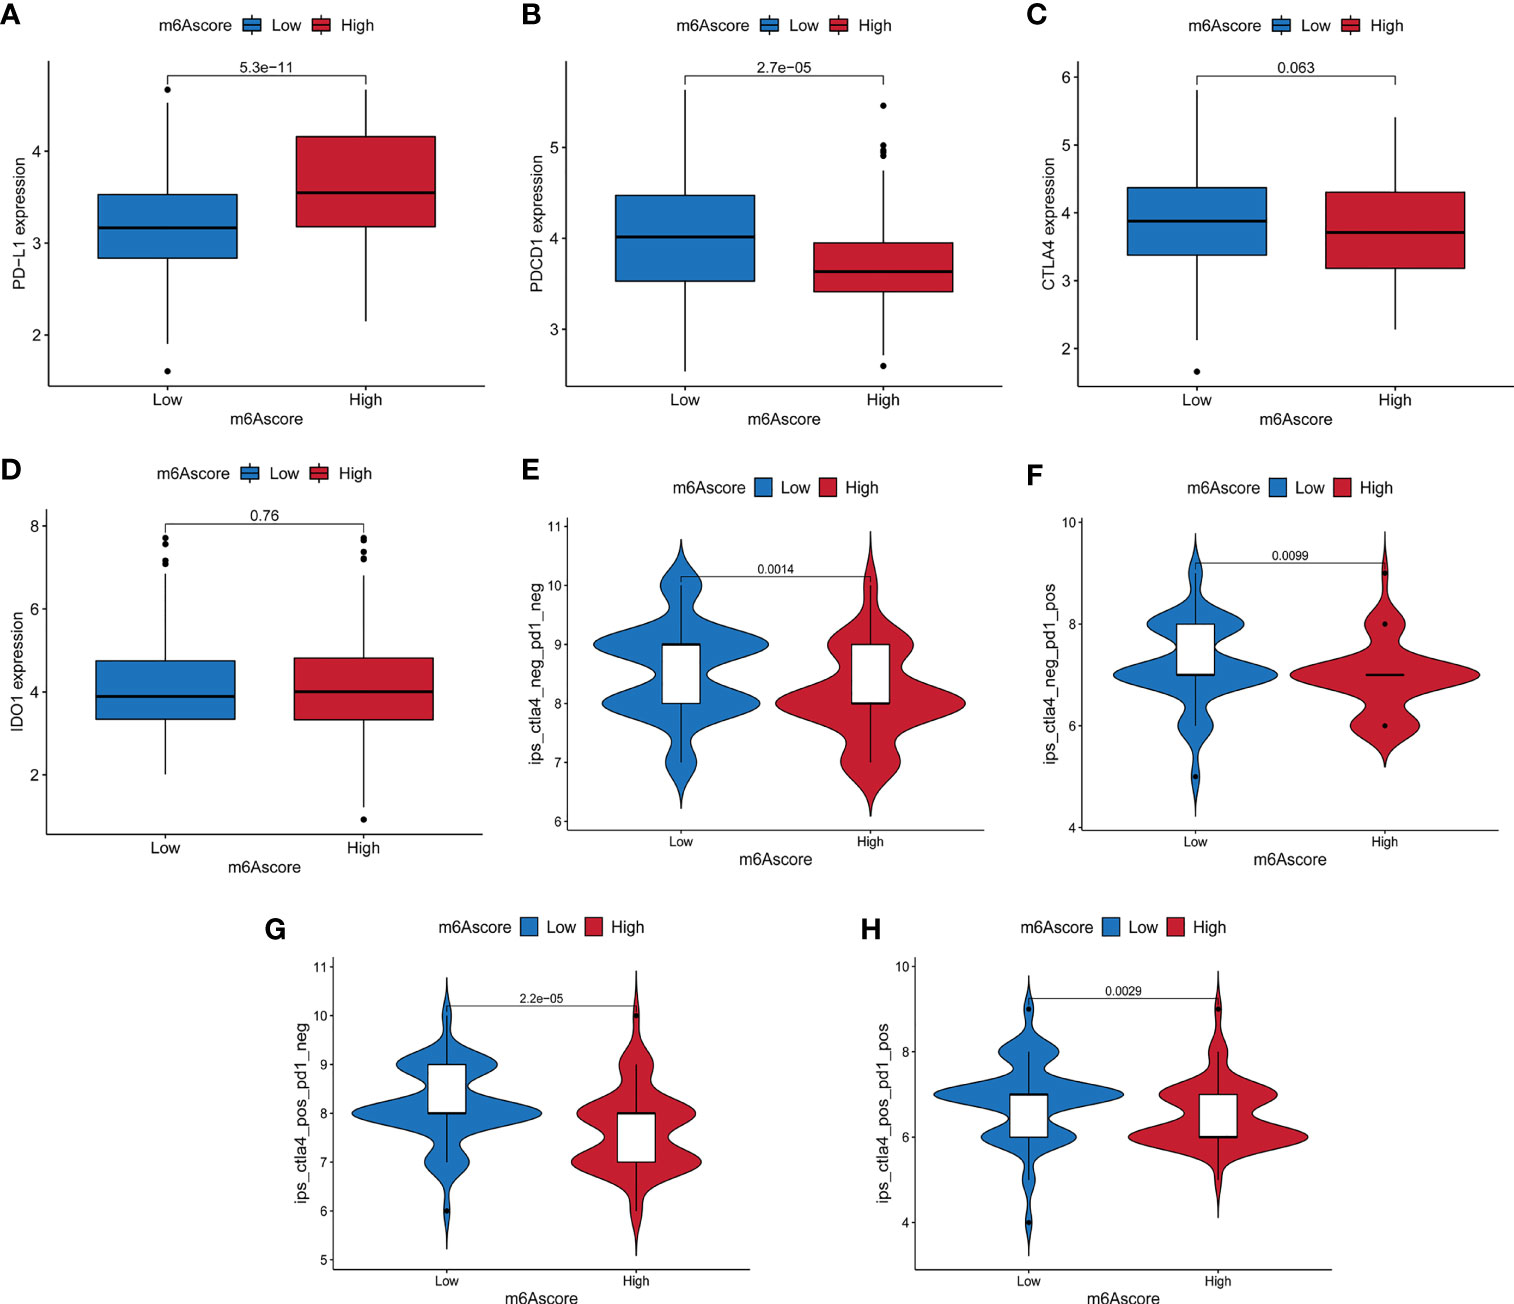
Figure 7 The relationship between m6A score and immune checkpoint genes and immunotherapy. (A–D) The expression differences of PD-L1, PDCD1, CTLA4 and IDO1 between high and low m6A score groups. (E) The difference of Immunophenoscore (IPS) between high and low m6A score groups with CTLA4 (-)/PD1 (-). (F) The difference of IPS between high and low m6A score groups with CTLA4 (-)/PD1 (+). (G) The difference of IPS between high and low m6A score groups with CTLA4 (+)/PD1 (-). (H) The difference of IPS between high and low m6A score groups with CTLA4 (+)/PD1 (+).
Recent studies have shown that m6A methylation modification plays an indispensable role in a variety of immune-related biological processes, including innate and acquired immune response, immune recognition, immune cell dynamic balance, and anti-tumor immune response (22). Since most studies mainly focus on the regulatory relationship between single m6A regulator and immune cell type, the comprehensive landscape of TME immune-infiltrating mediated by multiple m6A regulators in PC has not been fully understood. Therefore, clarifying the characteristics of immune cell infiltration in different m6A modification patterns will help us to improve our understanding of the anti-tumor immune response in TME, and provide new insights for the risk stratification of patients and the choice of clinical treatment strategies.
Based on 23 m6A regulators, we first identified two m6A modification subtypes. Differences in mRNA transcriptomes between different m6A modification subtype were found to be closely related to tumor metabolism and immune-related biological processes, and differentially expressed genes (DEGs) were significantly enriched in glucose metabolism-related pathways, chemokine-related pathways, cytokine-related pathways, and TGF-β signaling pathways. DEGs correlated to the prognosis of PC were defined as m6A-related signature genes. Based on the m6A signature genes, we determined two m6A-related gene subtypes. In the two gene clusters, we found that gene cluster A had lower immune score, stromal score and immune response-related T cell infiltration, which suggested an immune cold phenotype. In contrast, gene cluster B showed a relatively high immune score and T cell infiltration, which corresponded to the immune activation phenotype, namely hot tumor. Survival analysis showed that gene cluster A characterized by immune cold phenotype was associated with poor prognosis, while gene cluster B characterized by anti-tumor immune response was associated with good prognosis. We speculate that patients in gene cluster B may benefit from immunotherapy. Our results are consistent with those of previous TME studies, which also indicates that m6A methylation modification is of great significance for shaping different TME immune characteristics.
In view of the individual heterogeneity of m6A methylation modification, it is necessary to quantify the m6A modification pattern of a single tumor sample. Scoring models based on specific biomarkers between m6A modified subtypes have been well established in gastric cancer and colorectal cancer to improve the choice of clinical treatment and prognosis of patients (12, 13). Based on principal component analysis and a method similar to GGI, we established an m6A scoring scheme for PC patients. Gene cluster B with immune hot phenotype showed lower m6A score, while gene cluster A with immune cold phenotype indicated higher m6A score. Kaplan-Meier analysis showed that the m6A score had good prognostic predictive ability. The survival rate of patients in the low m6A score group was higher and the prognosis was better. These results suggest that the m6A score is a reliable index to comprehensively evaluate the m6A modification pattern of individual tumors, and can be used to further determine the characteristics of TME immune cell infiltration, namely tumor immunophenotype. Besides, verification in the TCGA-PAAD cohort showed that m6A score can be used as an independent prognostic indicator for PC patients. And the nomogram constructed by m6A score combined with other clinical variables can effectively predict the prognosis of patients.
Evaluation of potential mutation driver genes in tumors is an important means to explore the potential mechanisms of cancer occurrence and development, which is conducive to cancer diagnosis and rational selection of treatment strategies. We found that the mutation rates of KRAS, TP53, CDKN2A, and AMAD4 were significantly increased in the high m6A score group. An important feature of KRAS mutant tumors is the immunosuppressive state (40). KRAS signaling induces the expression of immune regulatory factors and inflammatory cytokines in tumor cells, and subsequently recruits neutrophils and myeloid-derived suppressor cells (MDSC) to form an immunosuppressive tumor microenvironment (41). Mutated KRAS in pancreatic cancer plays a central role in tumor development and growth by regulating T-cell cytokines in TME. By acting on downstream effectors, KRAS leads to impaired T-cell recognition of tumor cells, which may mediate immunity escape (22, 42). There are mutations of TP53 in most types of cancers. The deletion or mutation of TP53 in cancers will affect the recruitment and activity of T cells, leading to immune evasion and promoting cancer progression (43, 44). The loss of P53 (encoded by TP53) in pancreatic cancer leads to increased infiltration of regulatory T cells (Tregs) in the peripheral and intratumoral tissues (45). CDKN2A is a multifunctional gene that prevents the cell cycle at the G1/S checkpoint through the CKD4/6 regulatory mechanism. It is reported that approximately 60% of patients with pancreatic ductal adenocarcinoma carry the CDKN2A mutation, and this mutation is associated with a high risk of tumor development (46, 47). SMAD4 is a member of the SMAD family and participates in the transforming growth factor-β (TGF-β) pathway, which inhibits the activity of normal immune cells and promotes the immune escape of cancer cells (48, 49). These studies suggest that KRAS, TP53, CDKN2A, and AMAD4 mutations may be involved in the formation of immune suppression and immune escape in the high m6A score group. These m6A score-related gene mutations are closely related to the immune activity in TME, indicating that there may be a potential interaction between m6A methylation modification and tumor immune genomics. Because the mutation data of pancreatic cancer in the TCGA database is not sufficient, and only a few genes have obvious somatic mutations, it is necessary to verify the mutation oncoprint and explore the underlying mechanism in a larger data set.
In this study, we demonstrated that m6A modification patterns played an important role in the formation of different TME immune infiltration landscapes, which suggested that m6A methylation modification may affect the therapeutic effect of immune checkpoint inhibitors. We found that the expression of PD-L1 was higher in the high m6A score group. Previous studies suggested that pancreatic cancer had an immunosuppressive tumor microenvironment with high PD-L1 expression, which inhibited the cytotoxicity of activated T cells, and PD-L1 overexpression was associated with a poor prognosis (50, 51). We also compared the IPS that predicted the efficacy of anti-PD-1/CTLA-4 regimens in the high and low m6A score groups. The low score group had higher IPS, which indicated a relatively better immunotherapy effect. However, our results do not imply causal associations of m6A score and anti-tumor immunity in PC, more clinical evidence needs to be collected in future studies to verify the relationship between m6A score and immunotherapy. The above analysis suggests that m6A modification characteristics combined with TME status, tumor mutation burden, neoantigen load, PD-L1 expression, IPS and other biomarkers may be a more effective predictive strategy for immunotherapy.
Our research still has some shortcomings. Although we included 23 recognized m6A regulators through literature review, newly identified regulators still need to be added into the model to improve the accuracy of the identification of m6A methylation modification patterns. In addition, since not all patients with low m6A scores can benefit from immunotherapy, more clinicopathological features need to be combined to improve the accuracy of prediction. Although we obtained 434 PC samples from different cohorts, the number of samples may be relatively insufficient, and our findings need to be further validated in a prospective cohort of PC patients receiving immunotherapy.
The study was done within tumor microenvironment in a whole, without distinguishing tumor component, immune component, and stromal component furthermore. This may cause some subtype information to be masked due to the mixture of the component, which is also a shortcoming of our research. We were more concerned about proposing molecular subtypes related to m6A methylation in the overall tumor microenvironment and further constructing scores. Subsequent clinical analysis showed that the m6A score could be used as an important supplement to existing clinical variables, and could effectively predict the prognosis of patients in combination with other clinical indicators. We may refine the differentiation of the various components of the tumor microenvironment in subsequent research work, and try to use single-cell analysis to distinguish cell types to obtain more information.
This study has provided some new insights into the clinical application of immunotherapy. By targeting m6A regulators or m6A-related signature genes to change the m6A modification pattern and further reverse the poor infiltration of immune cells in TME, that is, the transformation of immune cold tumors to hot tumors, may contribute to the future development of new immunotherapy drugs or combination therapy strategies. In addition, the combination of therapeutic strategies for KRAS, TP53, CDKN2A, and AMAD4 mutations with immunotherapy may open up a new way for the selection of treatment options and reverse the immunosuppressive state in tumors. These findings are conducive to the identification of different immunophenotypes, thereby improving the patient’s response to immunotherapy, and can promote the clinical practice of personalized immunotherapy for cancer.
In conclusion, we evaluated 23 regulators-mediated m6A methylation modification landscapes based on 434 PC samples, and correlated m6A modification with the TME immune-infiltrating characteristics. And we constructed the m6A score, which can comprehensively evaluate the m6A modification pattern and immune-infiltrating characteristics of individual tumors, and further determine the tumor immunophenotype to guide clinical application.
The datasets presented in this study can be found in online repositories. The names of the repository/repositories and accession number(s) can be found in the article/Supplementary Material.
LX and MS designed the work. MX, TZ, and YW collected and integrated the data. MS analyzed the data and prepared the manuscript. MS, WH, and LX edited and revised the manuscript. All authors contributed to the article and approved the submitted version.
This research was funded by National Natural Science Foundation of China No. 81871911 (WH), No. 81972237 (LX), and No. 81772623 (LX), and the National Key Research and Development Program of China 2018YFC1312103 (LX).
The authors declare that the research was conducted in the absence of any commercial or financial relationships that could be construed as a potential conflict of interest.
All claims expressed in this article are solely those of the authors and do not necessarily represent those of their affiliated organizations, or those of the publisher, the editors and the reviewers. Any product that may be evaluated in this article, or claim that may be made by its manufacturer, is not guaranteed or endorsed by the publisher.
The authors express gratitude to the public database TCGA and GEO.
The Supplementary Material for this article can be found online at: https://www.frontiersin.org/articles/10.3389/fimmu.2021.739768/full#supplementary-material
m6A, N6-methyladenosine; TME, Tumor microenvironment; m7G, N7-methylguanine; m5C, N5-methylcytosine; PC, Pancreatic cancer; CAR-T, chimeric antigen receptor T; DC, Dendritic cells; TCGA, The Cancer Genome Atlas; GEO, Gene Expression Ominibus; TPMs, transcripts per kilobase million; CNV, copy number variation; CDF, cumulative distribution function; LM22, Leukocyte signature matrix; DEGs, differentially expressed genes; GO, Gene Ontology; MF, molecular function; BP, biological processes; CC, cellular components; KEGG, Kyoto Encyclopedia of Genes and Genomes; PCA, principal component analysis; ROC, receiver operating characteristic; TMB, tumor mutation burden; IPS, Immunophenoscore; MHC, MHC-related molecules; CP, immunomodulators; EC, effector cells; SC, suppressor cells; TCIA, The Cancer Immunome Atlas; AUC, area under curve; PurIST, purity Independent Subtyping of Tumors; MDSC, myeloid-derived suppressor cells; Tregs, regulatory T cells; TGF-β, transforming growth factor-β.
1. Zheng HX, Zhang XS, Sui N. Advances in the Profiling of N(6)-Methyladenosine (M(6)a) Modifications. Biotechnol Adv (2020) 45:107656. doi: 10.1016/j.biotechadv.2020.107656
2. Dai F, Wu Y, Lu Y, An C, Zheng X, Dai L, et al. Crosstalk Between RNA M(6)a Modification and non-Coding RNA Contributes to Cancer Growth and Progression. Mol Ther Nucleic Acids (2020) 22:62–71. doi: 10.1016/j.omtn.2020.08.004
3. Huang H, Weng H, Chen J. M(6)a Modification in Coding and Non-Coding Rnas: Roles and Therapeutic Implications in Cancer. Cancer Cell (2020) 37:270–88. doi: 10.1016/j.ccell.2020.02.004
4. Zhao W, Qi X, Liu L, Ma S, Liu J, Wu J. Epigenetic Regulation of M(6)a Modifications in Human Cancer. Mol Ther Nucleic Acids (2020) 19:405–12. doi: 10.1016/j.omtn.2019.11.022
5. Huang H, Weng H, Chen J. The Biogenesis and Precise Control of RNA M(6)a Methylation. Trends Genet (2020) 36:44–52. doi: 10.1016/j.tig.2019.10.011
6. Yang C, Hu Y, Zhou B, Bao Y, Li Z, Gong C, et al. The Role of M(6)a Modification in Physiology and Disease. Cell Death Dis (2020) 11:960. doi: 10.1038/s41419-020-03143-z
7. Nombela P, Miguel-López B, Blanco S. The Role of M(6)a, M(5)C and Ψ RNA Modifications in Cancer: Novel Therapeutic Opportunities. Mol Cancer (2021) 20:18. doi: 10.1186/s12943-020-01263-w
8. Han SH, Choe J. Diverse Molecular Functions of M(6)a mRNA Modification in Cancer. Exp Mol Med (2020) 52:738–49. doi: 10.1038/s12276-020-0432-y
9. Gu J, Zhan Y, Zhuo L, Zhang Q, Li G, Li Q, et al. Biological Functions of M(6)a Methyltransferases. Cell Biosci (2021) 11:15. doi: 10.1186/s13578-020-00513-0
10. Jiang X, Liu B, Nie Z, Duan L, Xiong Q, Jin Z, et al. The Role of M6a Modification in the Biological Functions and Diseases. Signal Transduct Target Ther (2021) 6:74. doi: 10.1038/s41392-020-00450-x
11. Uddin MB, Wang Z, Yang C. The M(6)a RNA Methylation Regulates Oncogenic Signaling Pathways Driving Cell Malignant Transformation and Carcinogenesis. Mol Cancer (2021) 20:61. doi: 10.1186/s12943-021-01356-0
12. Zhang B, Wu Q, Li B, Wang D, Wang L, Zhou YL. M(6)a Regulator-Mediated Methylation Modification Patterns and Tumor Microenvironment Infiltration Characterization in Gastric Cancer. Mol Cancer (2020) 19:53. doi: 10.1186/s12943-020-01170-0
13. Chong W, Shang L, Liu J, Fang Z, Du F, Wu H, et al. M(6)a Regulator-Based Methylation Modification Patterns Characterized by Distinct Tumor Microenvironment Immune Profiles in Colon Cancer. Theranostics (2021) 11:2201–17. doi: 10.7150/thno.52717
14. Mizrahi JD, Surana R, Valle JW, Shroff RT. Pancreatic Cancer. Lancet (2020) 395:2008–20. doi: 10.1016/S0140-6736(20)30974-0
15. Klein AP. Pancreatic Cancer Epidemiology: Understanding the Role of Lifestyle and Inherited Risk Factors. Nat Rev Gastroenterol Hepatol (2021) 18:493–502. doi: 10.1038/s41575-021-00457-x
16. Mahajan UM, Langhoff E, Goni E, Costello E, Greenhalf W, Halloran C, et al. Immune Cell and Stromal Signature Associated With Progression-Free Survival of Patients With Resected Pancreatic Ductal Adenocarcinoma. Gastroenterology (2018) 155:1625–39. doi: 10.1053/j.gastro.2018.08.009
17. Fridman WH, Zitvogel L, Sautès-Fridman C, Kroemer G. The Immune Contexture in Cancer Prognosis and Treatment. Nat Rev Clin Oncol (2017) 14:717–34. doi: 10.1038/nrclinonc.2017.101
18. Turley SJ, Cremasco V, Astarita JL. Immunological Hallmarks of Stromal Cells in the Tumour Microenvironment. Nat Rev Immunol (2015) 15:669–82. doi: 10.1038/nri3902
19. Ren B, Cui M, Yang G, Wang H, Feng M, You L, et al. Tumor Microenvironment Participates in Metastasis of Pancreatic Cancer. Mol Cancer (2018) 17:108. doi: 10.1186/s12943-018-0858-1
20. Wang S, Li Y, Xing C, Ding C, Zhang H, Chen L, et al. Tumor Microenvironment in Chemoresistance, Metastasis and Immunotherapy of Pancreatic Cancer. Am J Cancer Res (2020) 10:1937–53.
21. Huang X, Ding L, Liu X, Tong R, Ding J, Qian Z, et al. Regulation of Tumor Microenvironment for Pancreatic Cancer Therapy. Biomaterials (2021) 270:120680. doi: 10.1016/j.biomaterials.2021.120680
22. Torphy RJ, Schulick RD, Zhu Y. Understanding the Immune Landscape and Tumor Microenvironment of Pancreatic Cancer to Improve Immunotherapy. Mol Carcinog (2020) 59:775–82. doi: 10.1002/mc.23179
23. Henze J, Tacke F, Hardt O, Alves F, Al RW. Enhancing the Efficacy of CAR T Cells in the Tumor Microenvironment of Pancreatic Cancer. Cancers (Basel) (2020) 12: 1389. doi: 10.3390/cancers12061389
24. Liu Y, Liang G, Xu H, Dong W, Dong Z, Qiu Z, et al. Tumors Exploit FTO-Mediated Regulation of Glycolytic Metabolism to Evade Immune Surveillance. Cell Metab (2021) 33:1221–33. doi: 10.1016/j.cmet.2021.04.001
25. Han D, Liu J, Chen C, Dong L, Liu Y, Chang R, et al. Anti-Tumour Immunity Controlled Through Mrna M(6)a Methylation and YTHDF1 in Dendritic Cells. Nature (2019) 566:270–4. doi: 10.1038/s41586-019-0916-x
26. Wang L, Hui H, Agrawal K, Kang Y, Li N, Tang R, et al. M(6) a RNA Methyltransferases METTL3/14 Regulate Immune Responses to Anti-PD-1 Therapy. EMBO J (2020) 39:e104514. doi: 10.15252/embj.2020104514
27. Moffitt RA, Marayati R, Flate EL, Volmar KE, Loeza SG, Hoadley KA, et al. Virtual Microdissection Identifies Distinct Tumor- and Stroma-Specific Subtypes of Pancreatic Ductal Adenocarcinoma. Nat Genet (2015) 47:1168–78. doi: 10.1038/ng.3398
28. Rashid NU, Peng XL, Jin C, Moffitt RA, Volmar KE, Belt BA, et al. Purity Independent Subtyping of Tumors (Purist), A Clinically Robust, Single-Sample Classifier for Tumor Subtyping in Pancreatic Cancer. Clin Cancer Res (2020) 26:82–92. doi: 10.1158/1078-0432.CCR-19-1467
29. Meng Z, Yuan Q, Zhao J, Wang B, Li S, Offringa R, et al. The M(6)a-Related Mrna Signature Predicts the Prognosis of Pancreatic Cancer Patients. Mol Ther Oncolytics (2020) 17:460–70. doi: 10.1016/j.omto.2020.04.011
30. Liu H, Qiu C, Wang B, Bing P, Tian G, Zhang X, et al. Evaluating DNA Methylation, Gene Expression, Somatic Mutation, and Their Combinations in Inferring Tumor Tissue-of-Origin. Front Cell Dev Biol (2021) 9:619330. doi: 10.3389/fcell.2021.619330
31. Șenbabaoğlu Y, Michailidis G, Li JZ. Critical Limitations of Consensus Clustering in Class Discovery. Sci Rep (2014) 4:6207. doi: 10.1038/srep06207
32. Tibshirani R, Walther G, Hastie T. Estimating the Number of Clusters in a Data Set via the Gap Statistic. J R Stat Soc Ser B Stat Methodol (2001) 63:411–23. doi: 10.1111/1467-9868.00293
33. Dudoit S, Fridlyand JA. Prediction-Based Resampling Method for Estimating the Number of Clusters in a Dataset. Genome Biol (2002) 3:H36. doi: 10.1186/gb-2002-3-7-research0036
34. Wilkerson MD, Hayes DN. Consensusclusterplus: A Class Discovery Tool With Confidence Assessments and Item Tracking. Bioinformatics (2010) 26:1572–3. doi: 10.1093/bioinformatics/btq170
35. Newman AM, Steen CB, Liu CL, Gentles AJ, Chaudhuri AA, Scherer F, et al. Determining Cell Type Abundance and Expression From Bulk Tissues With Digital Cytometry. Nat Biotechnol (2019) 37:773–82. doi: 10.1038/s41587-019-0114-2
36. Yoshihara K, Shahmoradgoli M, Martínez E, Vegesna R, Kim H, Torres-Garcia W, et al. Inferring Tumour Purity and Stromal and Immune Cell Admixture From Expression Data. Nat Commun (2013) 4:2612. doi: 10.1038/ncomms3612
37. Sotiriou C, Wirapati P, Loi S, Harris A, Fox S, Smeds J, et al. Gene Expression Profiling in Breast Cancer: Understanding the Molecular Basis of Histologic Grade to Improve Prognosis. J Natl Cancer Inst (2006) 98:262–72. doi: 10.1093/jnci/djj052
38. Zeng D, Li M, Zhou R, Zhang J, Sun H, Shi M, et al. Tumor Microenvironment Characterization in Gastric Cancer Identifies Prognostic and Immunotherapeutically Relevant Gene Signatures. Cancer Immunol Res (2019) 7:737–50. doi: 10.1158/2326-6066.CIR-18-0436
39. Charoentong P, Finotello F, Angelova M, Mayer C, Efremova M, Rieder D, et al. Pan-Cancer Immunogenomic Analyses Reveal Genotype-Immunophenotype Relationships and Predictors of Response to Checkpoint Blockade. Cell Rep (2017) 18:248–62. doi: 10.1016/j.celrep.2016.12.019
40. Cullis J, Das S, Bar-Sagi D. Kras and Tumor Immunity: Friend or Foe? Cold Spring Harb Perspect Med (2018) 8:a031849. doi: 10.1101/cshperspect.a031849
41. Merz V, Gaule M, Zecchetto C, Cavaliere A, Casalino S, Pesoni C, et al. Targeting KRAS: The Elephant in the Room of Epithelial Cancers. Front Oncol (2021) 11:638360. doi: 10.3389/fonc.2021.638360
42. Dey P, Li J, Zhang J, Chaurasiya S, Strom A, Wang H, et al. Oncogenic KRAS-Driven Metabolic Reprogramming in Pancreatic Cancer Cells Utilizes Cytokines From the Tumor Microenvironment. Cancer Discov (2020) 10:608–25. doi: 10.1158/2159-8290.CD-19-0297
43. Blagih J, Buck MD, Vousden KH. P53, Cancer and the Immune Response. J Cell Sci (2020) 133: cs237453. doi: 10.1242/jcs.237453
44. Blagih J, Zani F, Chakravarty P, Hennequart M, Pilley S, Hobor S, et al. Cancer-Specific Loss of P53 Leads to a Modulation of Myeloid and T Cell Responses. Cell Rep (2020) 30:481–96. doi: 10.1016/j.celrep.2019.12.028
45. Bezzi M, Seitzer N, Ishikawa T, Reschke M, Chen M, Wang G, et al. Diverse Genetic-Driven Immune Landscapes Dictate Tumor Progression Through Distinct Mechanisms. Nat Med (2018) 24:165–75. doi: 10.1038/nm.4463
46. Bertoli C, Skotheim JM, de Bruin RA. Control of Cell Cycle Transcription During G1 and s Phases. Nat Rev Mol Cell Biol (2013) 14:518–28. doi: 10.1038/nrm3629
47. Hu C, Hart SN, Polley EC, Gnanaolivu R, Shimelis H, Lee KY, et al. Association Between Inherited Germline Mutations in Cancer Predisposition Genes and Risk of Pancreatic Cancer. JAMA (2018) 319:2401–9. doi: 10.1001/jama.2018.6228
48. Robert C. A Decade of Immune-Checkpoint Inhibitors in Cancer Therapy. Nat Commun (2020) 11:3801. doi: 10.1038/s41467-020-17670-y
49. Javadrashid D, Baghbanzadeh A, Derakhshani A, Leone P, Silvestris N, Racanelli V, et al. Pancreatic Cancer Signaling Pathways, Genetic Alterations, and Tumor Microenvironment: The Barriers Affecting the Method of Treatment. Biomedicines (2021) 9:373. doi: 10.3390/biomedicines9040373
50. Macherla S, Laks S, Naqash AR, Bulumulle A, Zervos E, Muzaffar M. Emerging Role of Immune Checkpoint Blockade in Pancreatic Cancer. Int J Mol Sci (2018) 19:3505. doi: 10.3390/ijms19113505
Keywords: pancreatic cancer, m6A, tumor microenvironment, immunotherapy, mutation burden
Citation: Sun M, Xie M, Zhang T, Wang Y, Huang W and Xia L (2021) m6A Methylation Modification Patterns and Tumor Microenvironment Infiltration Characterization in Pancreatic Cancer. Front. Immunol. 12:739768. doi: 10.3389/fimmu.2021.739768
Received: 11 July 2021; Accepted: 06 September 2021;
Published: 20 September 2021.
Edited by:
Peng Qu, National Institutes of Health (NIH), United StatesReviewed by:
Chong Jin, University of Pennsylvania, United StatesCopyright © 2021 Sun, Xie, Zhang, Wang, Huang and Xia. This is an open-access article distributed under the terms of the Creative Commons Attribution License (CC BY). The use, distribution or reproduction in other forums is permitted, provided the original author(s) and the copyright owner(s) are credited and that the original publication in this journal is cited, in accordance with accepted academic practice. No use, distribution or reproduction is permitted which does not comply with these terms.
*Correspondence: Limin Xia, eGlhbGltaW5AdGpoLnRqbXUuZWR1LmNu; Wenjie Huang, aHVhbmd3ZW5qaWVAdGpoLnRqbXUuZWR1LmNu
Disclaimer: All claims expressed in this article are solely those of the authors and do not necessarily represent those of their affiliated organizations, or those of the publisher, the editors and the reviewers. Any product that may be evaluated in this article or claim that may be made by its manufacturer is not guaranteed or endorsed by the publisher.
Research integrity at Frontiers
Learn more about the work of our research integrity team to safeguard the quality of each article we publish.