 Harry Robertson1
 Jennifer Li1
 Hani Jieun Kim2,3
 Jake W. Rhodes4
 Andrew N. Harman4,5
 Ellis Patrick1,3,4
 Natasha M. Rogers1,6,7*†
- 1Kidney Injury Group, Centre for Transplant and Renal Research, Westmead Institute for Medical Research, Westmead, NSW, Australia
- 2Computational Systems Biology Group, Children’s Medical Research Institute, Westmead, NSW, Australia
- 3School of Mathematics and Statistics, University of Sydney, Camperdown, NSW, Australia
- 4Centre for Virus Research, Westmead Institute for Medical Research, Westmead, NSW, Australia
- 5The University of Sydney, School of Medical Sciences, Faculty of Medicine and Health Sydney, Sydney, NSW, Australia
- 6Renal and Transplantation Medicine, Westmead Hospital, Westmead, NSW, Australia
- 7Thomas E. Starzl Transplantation Institute, Department of Surgery, University of Pittsburgh School of Medicine, Pittsburgh, PA, United States
Dendritic cells (DC) are central to regulating innate and adaptive immune responses. Strategies that modify DC function provide new therapeutic opportunities in autoimmune diseases and transplantation. Current pharmacological approaches can alter DC phenotype to induce tolerogenic DC (tolDC), a maturation-resistant DC subset capable of directing a regulatory immune response that are being explored in current clinical trials. The classical phenotypic characterization of tolDC is limited to cell-surface marker expression and anti-inflammatory cytokine production, although these are not specific. TolDC may be better defined using gene signatures, but there is no consensus definition regarding genotypic markers. We address this shortcoming by analyzing available transcriptomic data to yield an independent set of differentially expressed genes that characterize human tolDC. We validate this transcriptomic signature and also explore gene differences according to the method of tolDC generation. As well as establishing a novel characterization of tolDC, we interrogated its translational utility in vivo, demonstrating this geneset was enriched in the liver, a known tolerogenic organ. Our gene signature will potentially provide greater understanding regarding transcriptional regulators of tolerance and allow researchers to standardize identification of tolDC used for cellular therapy in clinical trials.
Introduction
Dendritic cells (DC) represent a population of bone marrow (BM)-derived cells responsible for the collection and presentation of captured antigen (Ag) (1). DC are found throughout the body, and their capacity for Ag presentation provides a crucial link between innate and adaptive immune responses. Multiple DC subsets have been described, broadly divided into myeloid and plasmacytoid groups (2). Similar to other immune cells, DC are also able to alter their phenotype and function based on environmental cues (3), contextual inflammatory signaling, and the presence of self/non-self Ag. Classically, mature DC drive effector T cell responses, and immature DC mediate central or peripheral tolerance primarily through immunoregulatory factors that induce regulatory or anergic T cells (4). An additional subset that are maturation-resistant – so-called tolerogenic DC (tolDC) – can be manufactured ex vivo but have not yet been found physiologically. TolDC have been extensively interrogated in pre-clinical models, and are exceedingly effective at limiting host immune responses that drive autoimmune disease [summarized in (5)] or allograft rejection in transplantation [summarized in (6)]. Capitalizing on their ability to modulate T and/or B cell behavior and release immunomodulatory molecules, tolDC have been used in recent phase I/II clinical trials for type 1 diabetes (7), rheumatoid arthritis (8), multiple sclerosis (9), and liver and kidney transplantation (10) as therapeutic agents that reduce exposure to non-specific immunosuppressive drugs.
Multiple protocols for the generation of tolDC exist (11). BM-derived progenitors (animals) and CD14+ peripheral blood mononuclear cells (PBMC, humans) are driven towards prototypic DC using growth factor/cytokine cocktails, and then “tolerized” pharmacologically. Interleukin-10 (IL-10) and vitamin D-based regimens are most frequently used, a substantial list of pharmacological modifiers of DC function exists (12) which continues to expand (6). Avoiding ex vivo isolation and manipulation, in vivo modulation using DC-specific targeting techniques, such as nanoparticles (13, 14) or antibodies (15), can directly deliver a pharmacological payload. Despite treatment heterogeneity, the DC phenotype is characterized by immunoregulatory properties (16) which then assumes generation of stable tolDC.
Identification of DC subsets is typically based on cell-surface markers. Although expression appears relatively conserved between species, tissues and disease models (2), the same standardized characteristics are not yet available for tolDC. Indeed, tolDC used in recent clinical studies did not have uniform methods for generation, phenotype or functional measurements (17). To date, there is no consensus for “gold-standard” validation of tolerogenic properties, and current methods range from analysis of cell-surface markers to allogeneic T cell stimulation (10). This has significant implications for clinical trials where differences in tolDC generation may impact clinical outcomes. There is also ongoing concern that tolDC are not stably manipulated and, like regulatory T cells, can be subverted to activated or inflammatory forms by a permissive microenvironment. Understanding gene changes that robustly reflect tolDC would be a useful tool in standardizing their generation, which may ultimately impact patient outcome.
Transcriptomic analysis allows for the identification of conserved and differentially expressed genes in tolDC regardless of the method of generation. A specific transcriptomic signature may also assist with discovery of surrogate markers that may be used clinically. The adaptation of differentially expressed genes to enrichment pathways also provides insight into the biological interpretability of gene(s) of interest. Recent literature (18) seeking to bridge this gap in the literature are limited to consolidating already reported signatures of previous studies and drawing on published conclusions to extract a transcriptome unique to the tolDC phenotype. We have addressed this shortcoming by analyzing available datasets to yield an independent set of differentially expressed genes within each study. Comparing these results across datasets yielded a common tolDC transcriptome which we then validated. We used the same pipeline to generate a mature DC transcriptome, and both novel gene signatures were applied to immune cell populations in vivo.
Methods
TolDC Data Acquisition
A search to identify publicly available gene expression data in the Gene Expression Omnibus (GEO) https://www.ncbi.nlm.nih.gov/geo/ was performed using the terms: “tolerogenic dendritic cell”, “regulatory dendritic cell” and “tolDC”. The search for publications up to December 2020 revealed 136 Datasets, of which 98 were human. Datasets were initially excluded from downstream analysis if they did not have an immature DC phenotype (control) within the dataset. Only 24 were whole datasets, and 8 contained cell samples that included adequately phenotyped tolDC (Figure 1A). These datasets were arbitrarily divided into two groups: 5 datasets were used for initial tolDC gene set discovery, and the 3 remaining were used for validation. One further validation dataset was obtained from ArrayExpress (19).
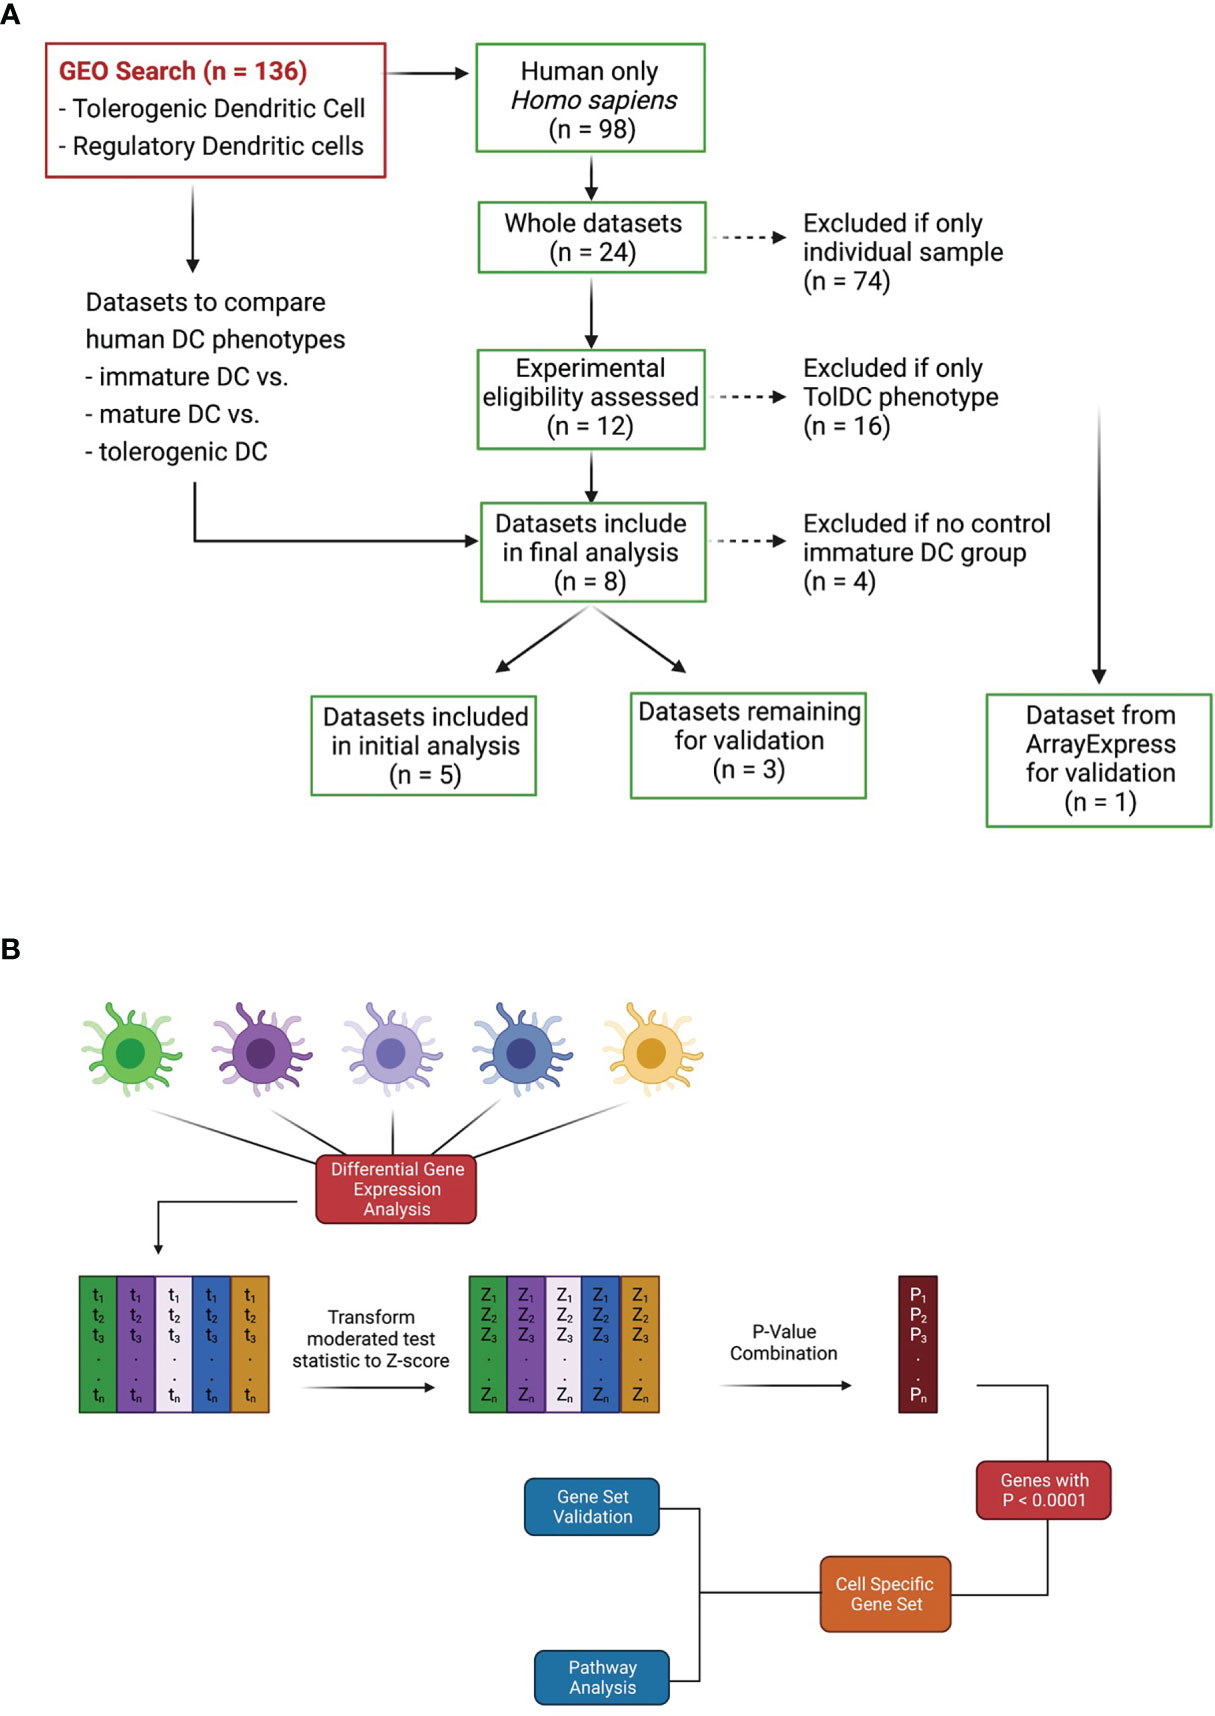
Figure 1 Dataset identification and workflow for tolDC gene analysis. (A) Flowchart demonstrating relevant GEO search with inclusion and exclusion criteria. (B) Pipeline for generating tolDC, AADC and mature DC gene signatures.
Data Analysis
The raw data of each of the five datasets precured [GSE13762 (20), GSE23371 (21), GSE56017 (22), GSE117946 (23), GSE52894 (24)] were obtained from the gene expression omnibus (https://www.ncbi.nlm.nih.gov/geo/). All five datasets were normalized using the quantile normalization method, with each dataset filtered to exclude genes with nil expression. Within each dataset, differential gene expression analysis was performed using limma (Smyth G. K. 2004) with Benjamini–Hochberg multiple testing correction (p < 0.05). In this way, a moderated test statistic was calculated for each gene within each dataset. Moderated test statistics were converted to z-scores, and subsequently p-values, as described in the directPA vignette (25). Pearson’s method of combining p-values was used to derive an overall significance score for each gene across all datasets (Figure 1B). An overall significance score of p < 0.00001 was used as the threshold to establish genes in the tolDC transcriptome.
TolDC Gene Signature Validation
Three (3) datasets acquired from GEO (GSE104438 (26), GSE98480 (27), GSE92852 (28) containing tolDC and immature DC gene expression data were used for validation. A final validation was also performed using data from ArrayExpress database (E-MTAB-6937 (19). As with our discovery and initial validation set, we analysed each dataset individually to diminish potential batch effects that would arise from merging datasets. In all datasets, the moderated test statistics for each gene were converted into z-scores (as outlined in Figure 1B) and the pattern of gene expression compared with our tolDC gene set.
Alternatively Activated Dendritic Cell Gene Signature
In a similar manner to the identification of genes critical to tolDC, we determined genes differentially expressed between the tolDC stimulated with and without lipopolysaccharide (LPS). Three datasets were used in the analysis: GSE23371 (21), GSE117946 (23), GSE52894 (24). Differential gene expression was performed using the limma pipeline optimized as above, combining the results of our analyses using Pearson’s Method, and yielding a set of genes critical to defining AADC.
Mature DC Gene Signature
Differentially expressed genes between immature DC stimulated with and without lipopolysaccharide (LPS) were also explored. Four datasets were used in the analysis: GSE23371 (21), GSE56017 (22), GSE117946 (23), GSE52894 (24).
Analysis of Enriched Pathways
A Wilcoxon rank sum test was performed on the combined p-value that was determined for each gene within our gene set analysis, returning a significance value for KEGG pathways that were enriched in the DC of interest. A subsequent Gene Set Enrichment Analysis (GSEA) was performed on the ranked list of genes, executed using the clusterProfliler (29) package in R.
Signature Validation
We sought to validate the specificity of our mature and tolDC signature using in vivo datasets that contained mononuclear phagocytes (MNP), including recognized DC subsets (30, 31) or peripheral blood immune cell subsets [GSE28492 (32)]. RNAseq data was normalized using the TMM method without filtering, microarray data was normalized using quantile normalization, and gene expression was compared between each cell phenotype.
Single Cell RNAseq of Kidney, Liver, and PBMC Datasets
Five individual single cell RNAseq (scRNA-seq) samples were obtained from the Panglao database (https://panglaodb.se/). The search criteria were initially limited to liver tissue only from human donors. The accession code SRA716608 was used to extract scRNAseq into R for analysis. The five samples were normalized and integrated using the harmony algorithm. The combined dataset was then analysed using the Uniform Manifold Approximation and Projection (UMAP) dimensional reduction technique. The tolDC phenotype was then plotted on the UMAP projection. To compare tolDC and mature DC gene signatures in different tissue compartments, liver (SRA716608, n = 22154 cells), peripheral blood mononuclear cells (PBMC, SRA749327, n = 15881 cells) and kidney cortex (SRA598936, n = 3573 cells) scRNA-seq samples were also acquired. Datasets belonging to individual tissue types were integrated using the harmony method, normalized and scaled. The expression of genesets was measured between DC in each tissue type.
Data Availability and Code Statement
Data utilized for this study is publicly available using the GEO accession codes listed. The code utilized to generate analysis and figures is available at: https://github.com/Harry25R/Transcriptomic-analysis-identifies-a-tolerogenic-dendritic-cell-signature.git.
Results
Dataset Quality Control
Five complete datasets with tolDC gene sequencing were retrieved. Each dataset had a different method of tolDC generation and 3 studies shared the same sequencing platform (Table 1). A principal component analysis (PCA) identified phenotypic specific differences between samples in the GSE52894 dataset (24) (Figure 2A). This was consistent across all included datasets (Supplementary Figure 1A). Across the first principal component we observed large differences when DC were matured with LPS. The largest source of variation was between tolerogenic and mature DC, an expected result given the regulatory nature of tolDC compared to mature (immunogenic) DC. Confirming these results, unsupervised hierarchical clustering between samples exhibited strong correlation between samples of the same phenotype (Supplementary Figure 1B).
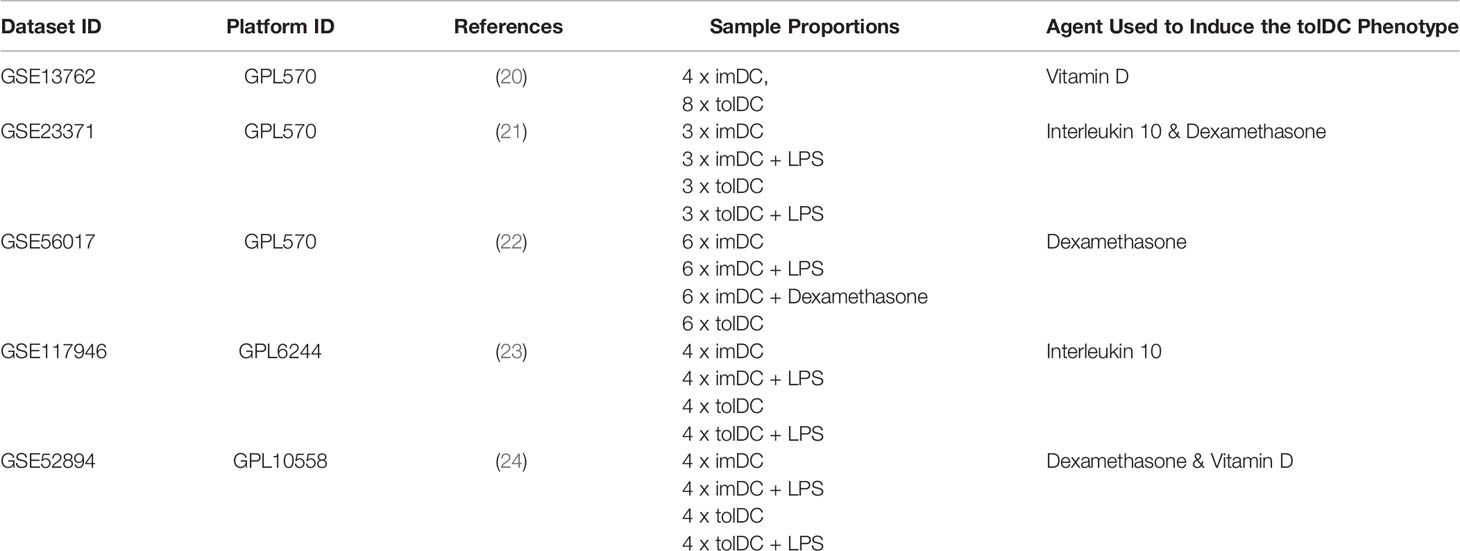
Table 1 Identified publicly available gene datasets including immature, tolerogenic and mature DC for initial tolDC gene set discovery.
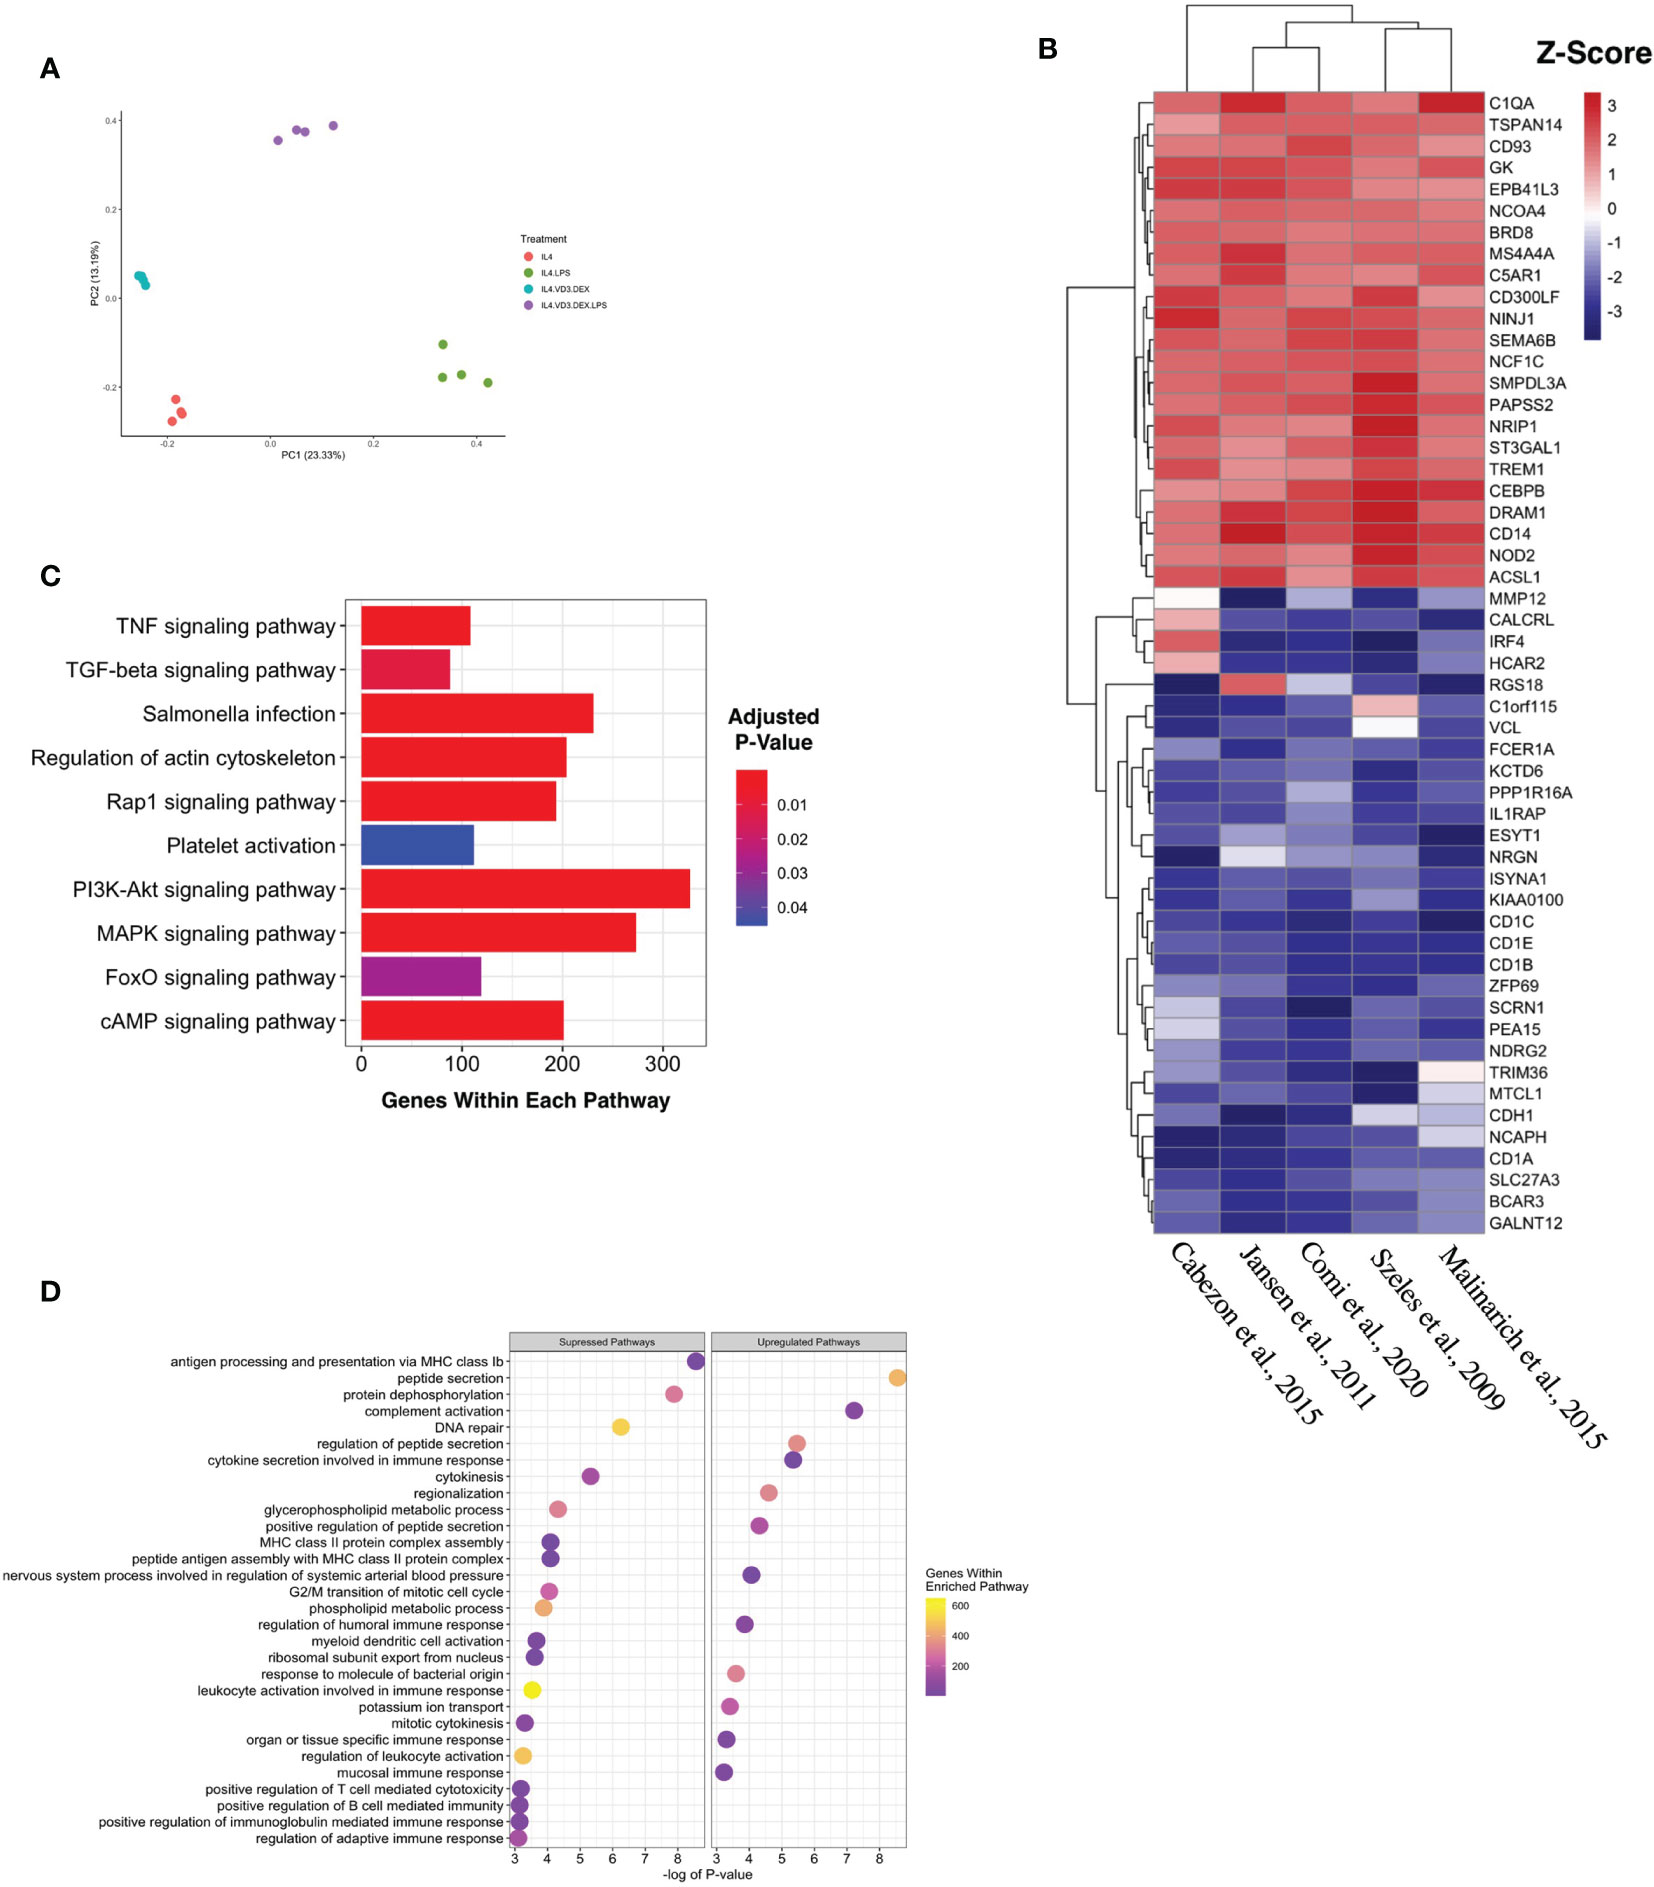
Figure 2 Generating a unique tolDC transcriptome. (A) Principal component analysis (PCA) plot characterizing change in gene expression profiles between immature DC (red), mature DC (green), tolDC (blue), or alternatively-activated tolerogenic DC (AADC, purple) in GSE52894. Each dot presents a sample, and each color represents a DC phenotype. (B) Heatmap representation of the top 20 differentially expressed genes (DEG) by tolDC. DEG were arranged by hierarchical clustering on the vertical axis. Datasets, also clustered by hierarchical clustering, are displayed on the horizontal axis. The p-value yielded from each study were converted to z-scores and plotted. (C) KEGG and (D) Gene Set Enrichment analyses. Each point on the dot plot represents the number of genes involved in the relevant pathway. The gene ratio is the proportion of DEG versus genes not differentially expressed. Each point was colored to represent the adjusted p-value using the Benjamini-Hochberg method.
Establishing a tolDC Gene Signature
The results of individual differential gene expression analysis were ranked by p-value. The top 10 up-regulated and downregulated genes are listed in Tables 2A, 2B, respectively. Our results were consistent with previous reports, suggesting no homogeneity in differentially expressed genes DEG between different methods generating tolDC if only looking at the strongest changes (18). By considering more than just the top genes, we then assessed homogeneous differential gene expression across the datasets, identifying 53 genes with a combined p-value<10-5 which we deemed to be characteristic of tolDC (Table 3). The top 20 DEG are displayed in heatmap form (Figure 2B).

Table 2A Top 10 differentially upregulated genes in tolDC.
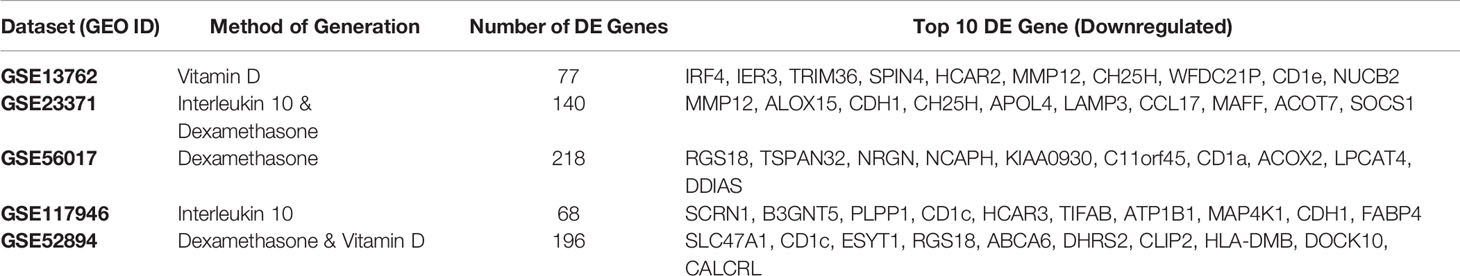
Table 2B Top 10 differentially downregulated genes in tolDC.
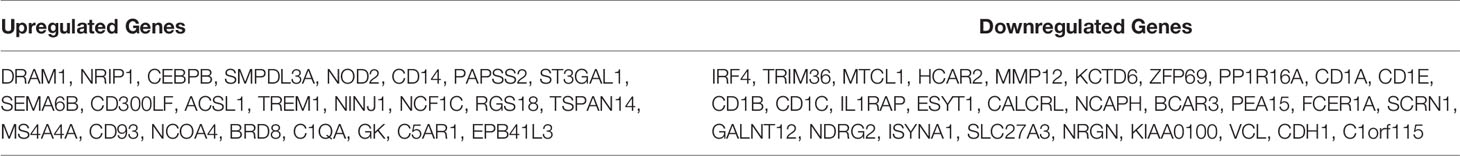
Table 3 Summary of differentially expressed genes in tolDC.
TolDC Pathway Enrichment Analysis
Mapping DEG within the tolDC gene set to the KEGG database returned several enriched pathways (Figure 2C). The mitogen-activated protein kinase (MAPK) pathway was significantly enriched, as were cyclic AMP, Ras-related Protein 1, Forkhead box O and tumor necrosis factor (TNF) pathways. Gene Set Enrichment Analysis (GSEA) assigned directional change to each pathway and ranked genes were then mapped against the Gene Ontology (GO) database. Encouragingly, pathways involved in antigen presentation and antigen binding were all suppressed (Figure 2D), consistent with literature demonstrating that tolDC negatively regulate the immune response.
TolDC Gene Set Validation
Based on the initial discovery set, we identified 3 appropriate gene sets for validation (Table 4), annotating each gene by the expected enrichment direction (Figure 3A). Our gene signature fit data from TLR- and interluekin-10-generated tolDC, although GM-CSF-generated tolDC performed poorly in this validation step. We conducted further validation of our tolDC gene set using data from (19) (Table 4) who compared transcriptomic signatures from tolDC derived from 3 different treatments (vitamin D, dexamethasone or rapamycin). Rapamycin-derived tolDC demonstrated a significant genomic deviation from our gene signature (Figure 3B).
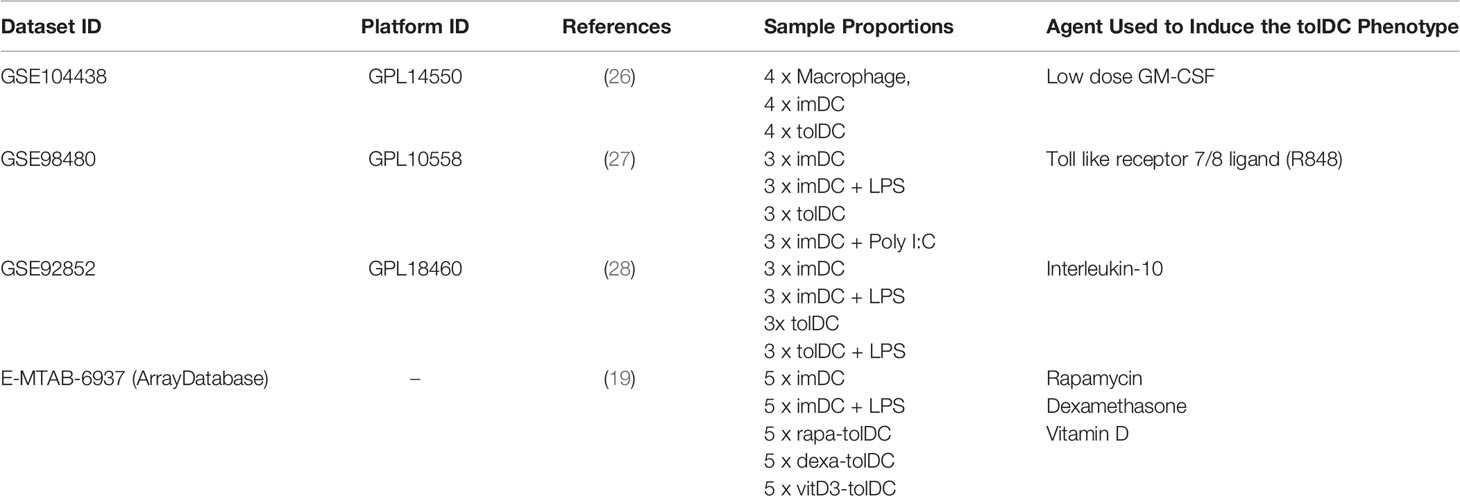
Table 4 Identified publicly available gene datasets including immature, tolerogenic and mature DC for tolDC gene set validation.
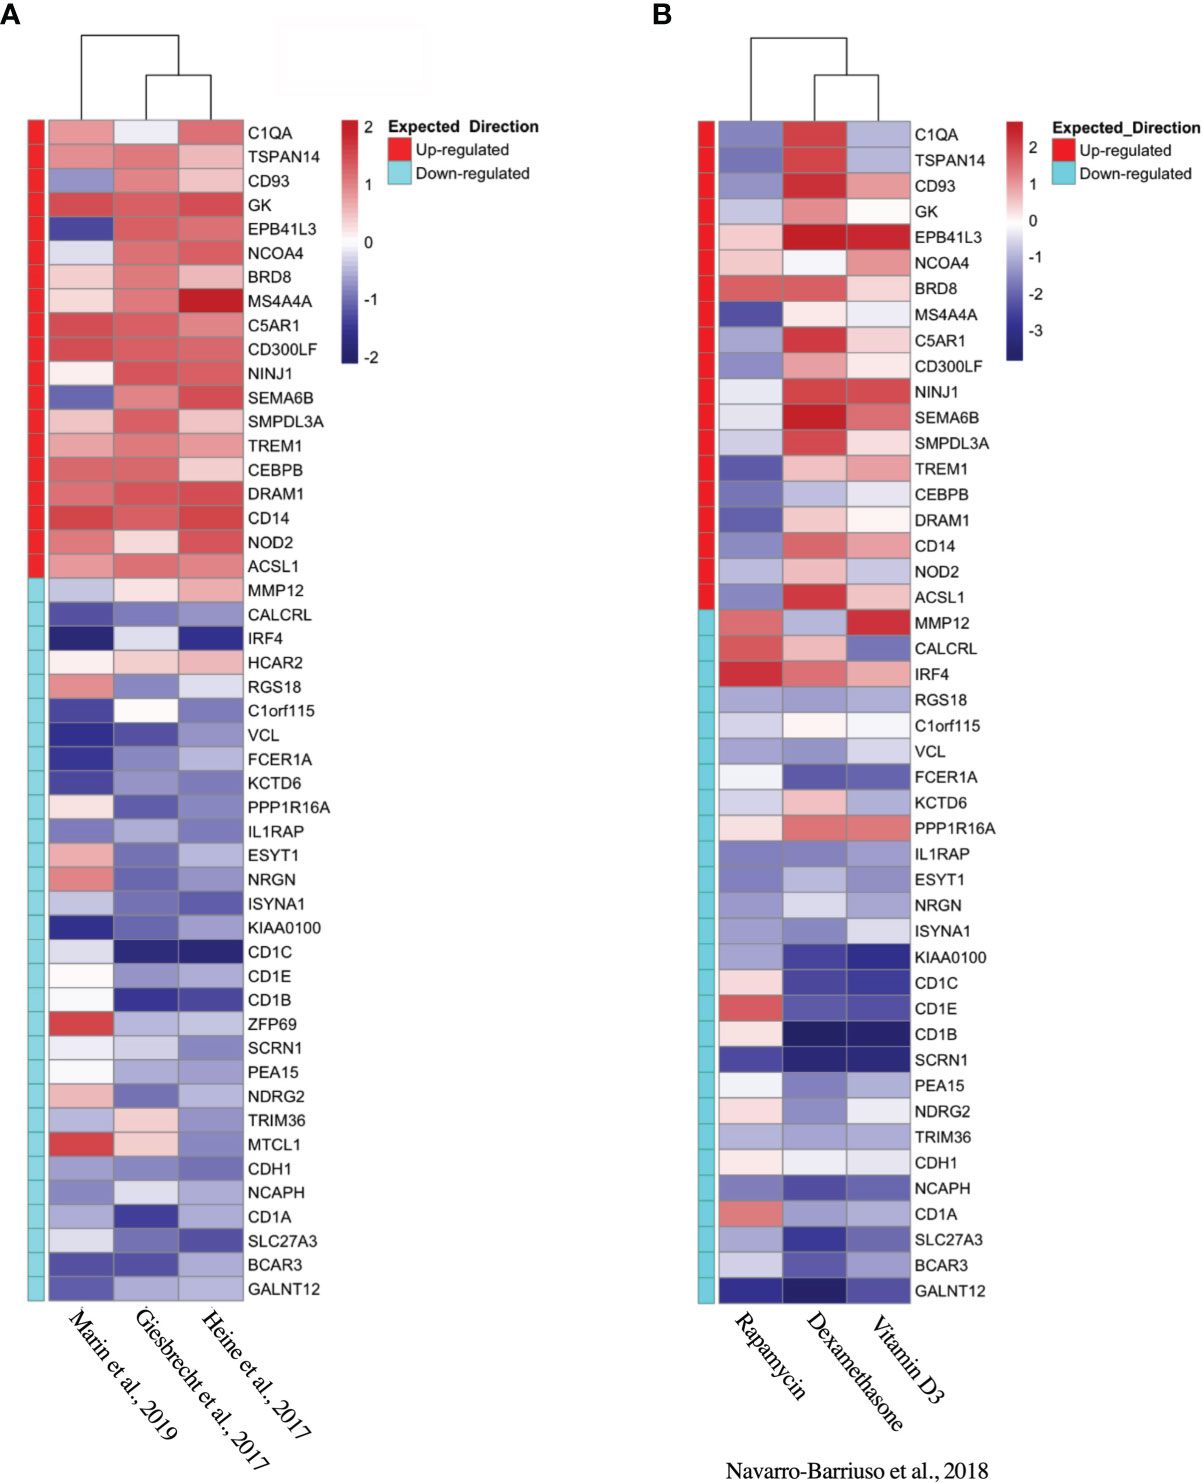
Figure 3 Validation of tolDC transcriptome. Heatmap representation of upregulated and downregulated genes from the tolDC discovery gene set compared to expression in (A) GEO-derived or (B) ArrayDatabase validation gene set.
Alternatively-Activated tolDC
Propagated tolDC that are “alternatively activated” (AADC) by exposure to an inflammatory stimulus, typically LPS, also demonstrate robust regulatory properties that protect against graft-versus-host disease (33, 34). AADC have shown greater efficacy in controlling inflammatory immune responses in vivo (35) compared to a more modest effect from IL-10-conditioned tolDC (36). We initially interrogated three datasets that compared gene expression between AADC and tolDC, although these demonstrated different DEG (Figure 4A, Table 5). Analysis determined 39 DEG that were enriched in AADC compared to tolDC (Table 4 and Figure 4B), and we mapped these to GEA pathways (Figures 4C, D).
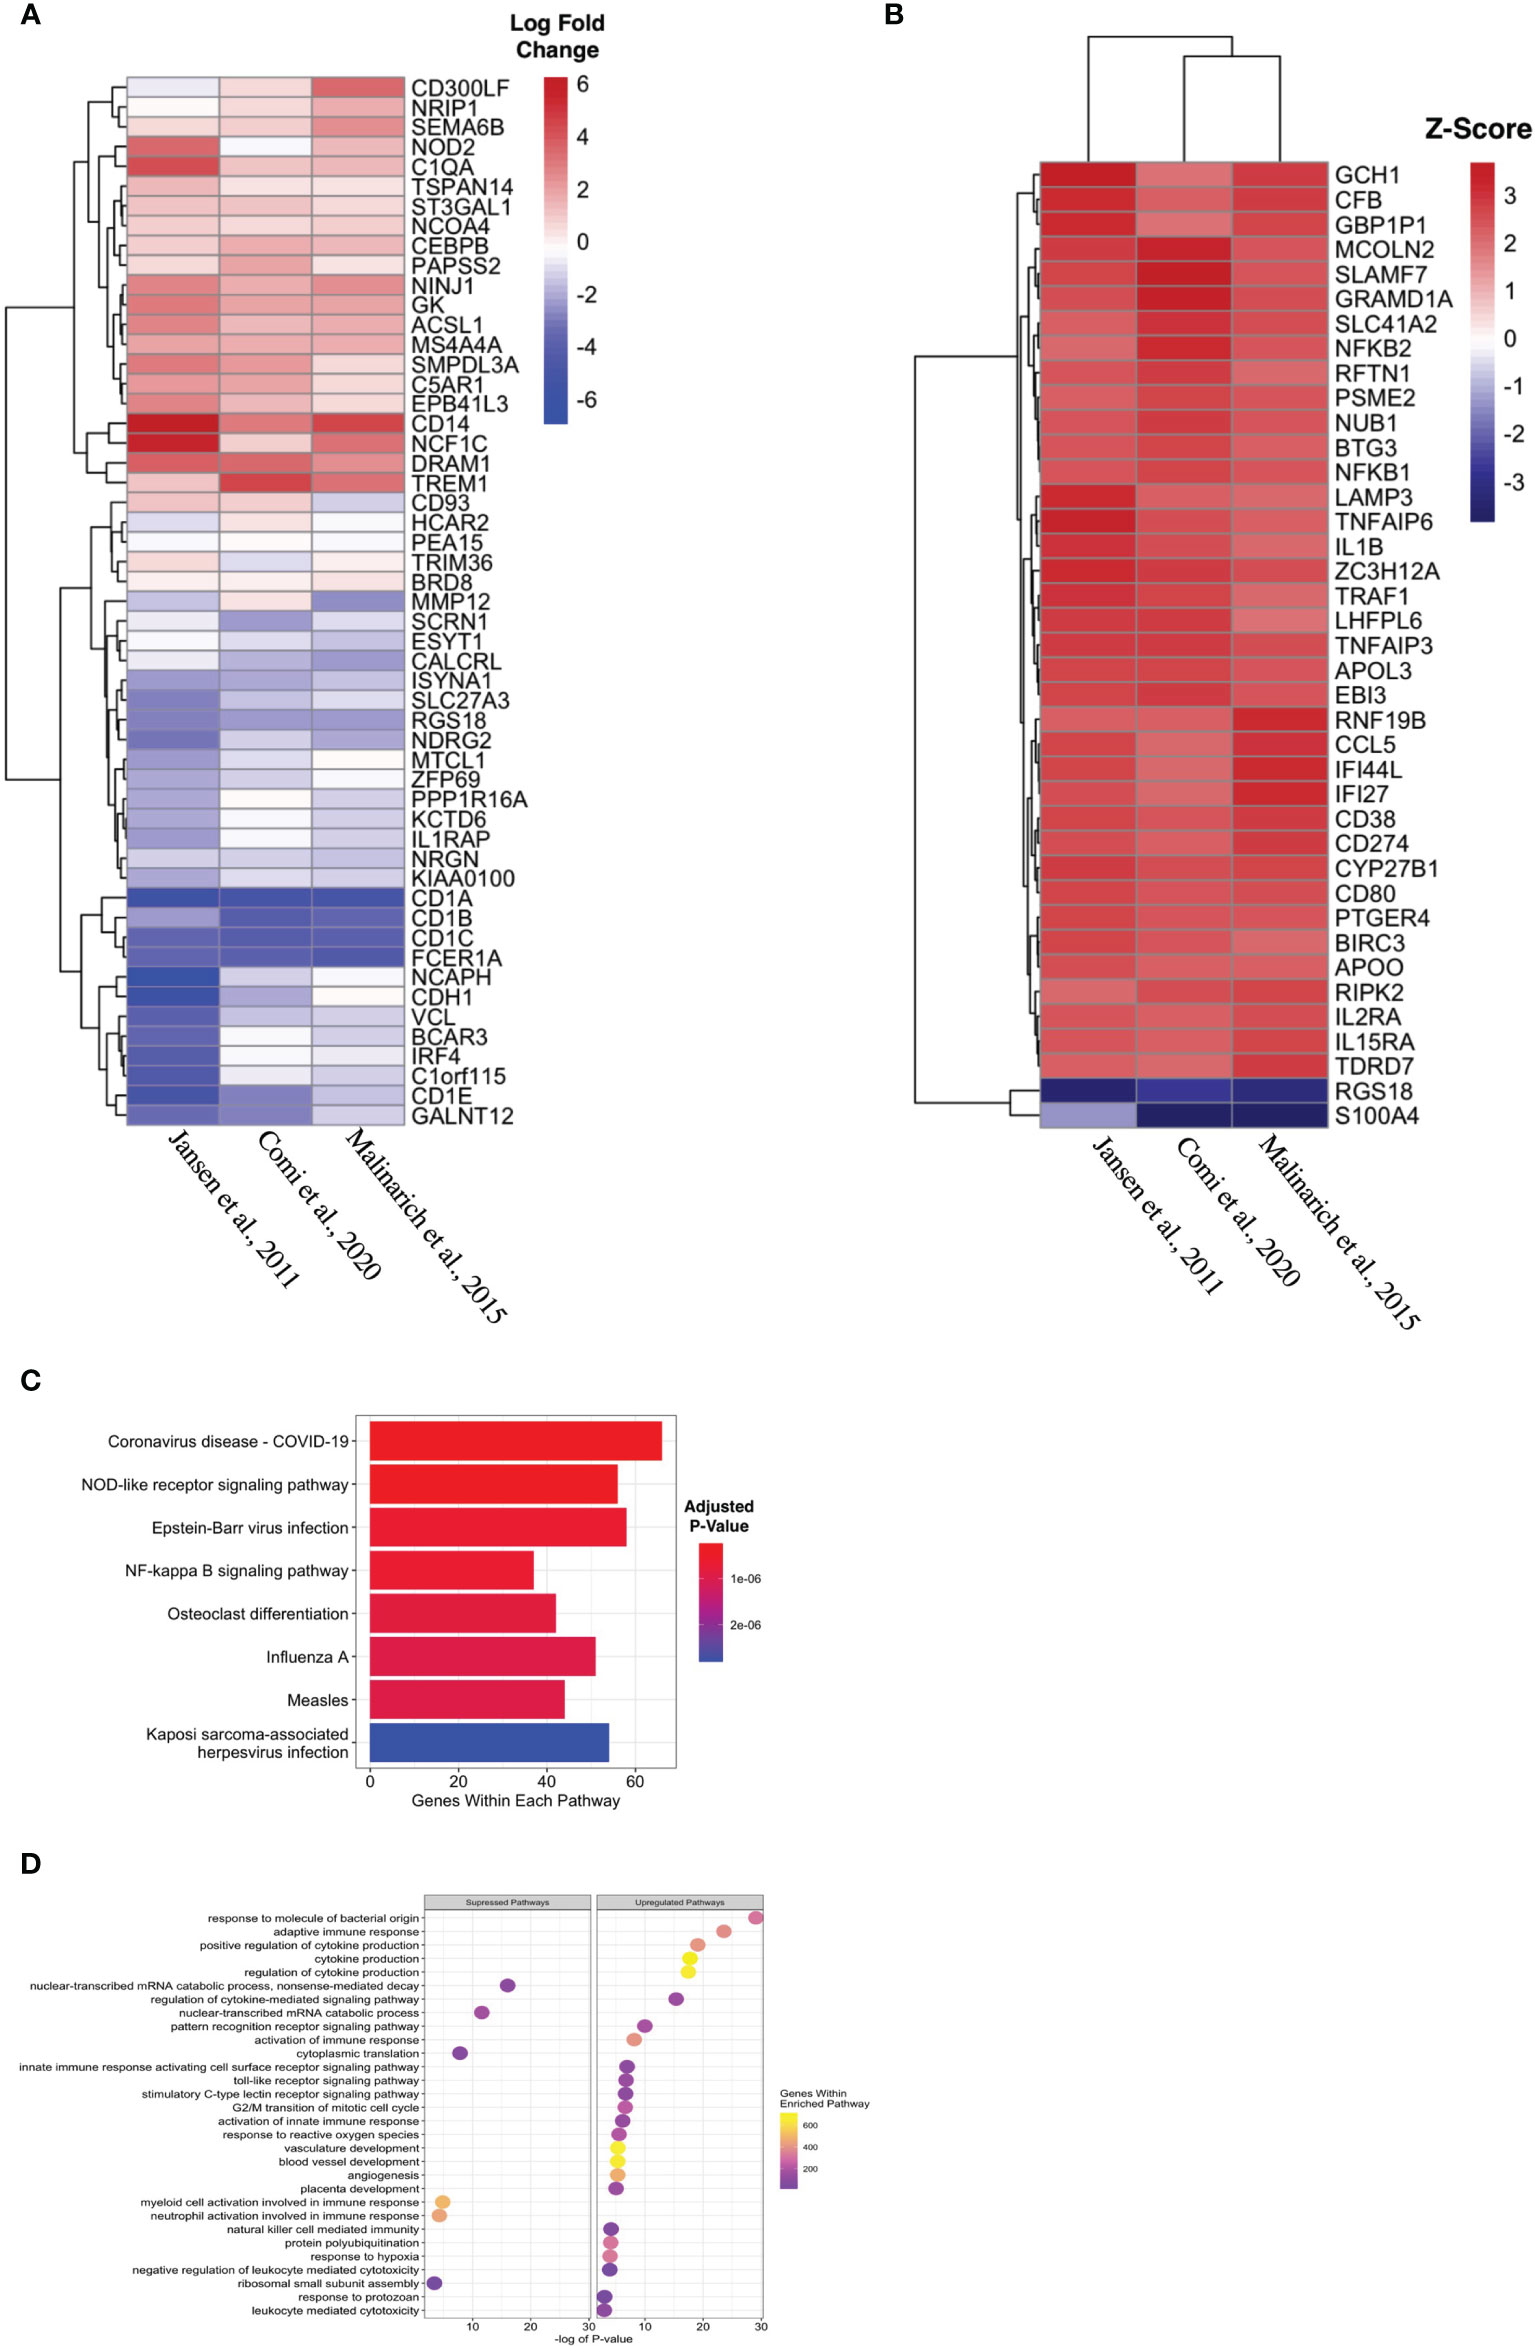
Figure 4 Identifying transcriptomic differences between subtypes of tolDC. (A) Heatmap representation of the top 39 DEG by AADC. (B) Fold change difference in expression of genes in AADC compared to tolDC. (C) KEGG and (D) Gene Set Enrichment analyses.
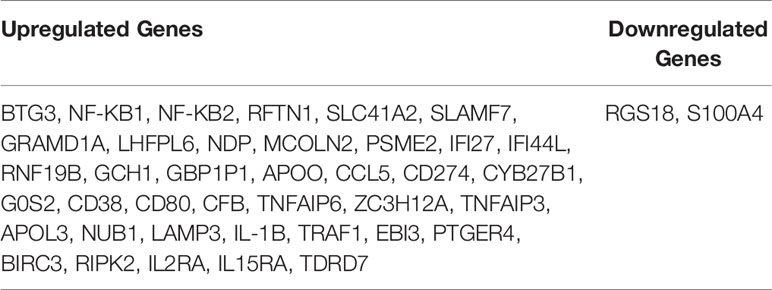
Table 5 Summary of differentially expressed genes in AADC.
DC Signatures in Tissue
The liver is unique amongst solid organs in its capacity to modulate local and systemic tolerance. This is contributed to by the presence of unconventional antigen presenting cells (liver sinusoidal endothelial cells, Kupffer cells) (37), altered T cell proportions (particular γδ subsets) (38, 39), and an increased ratio of DC to parenchymal cells (2-5 times higher in liver compared to other organs) (40). Importantly, liver-resident DC demonstrate features most consistent with a tolerogenic phenotype and function, with low endocytic capacity, decreased MHC expression, limited T cell allostimulation and high IL-10 production (41–43). Using scRNAseq samples from healthy human liver which has been clustered by cell type (Figure 5A, Supplementary Figure 2A), we then demonstrated that upregulated genes within the tolDC signature was enriched in areas which mapped to DC/monocyte/macrophage lineage within the liver (Figures 5B–D). Downregulated genes were not overexpressed in any cell type (Supplementary Figure 2B). We also interrogated whether our tolDC signature was overexpressed in the kidney (which has significantly lower tolerogenic capacity) and/or PBMC. We were able to demonstrate that our gene signature was not enriched in either compared to liver (Figure 5E), although an analysis of housekeeping genes (44) was not significantly different (Supplementary Figure 2C).
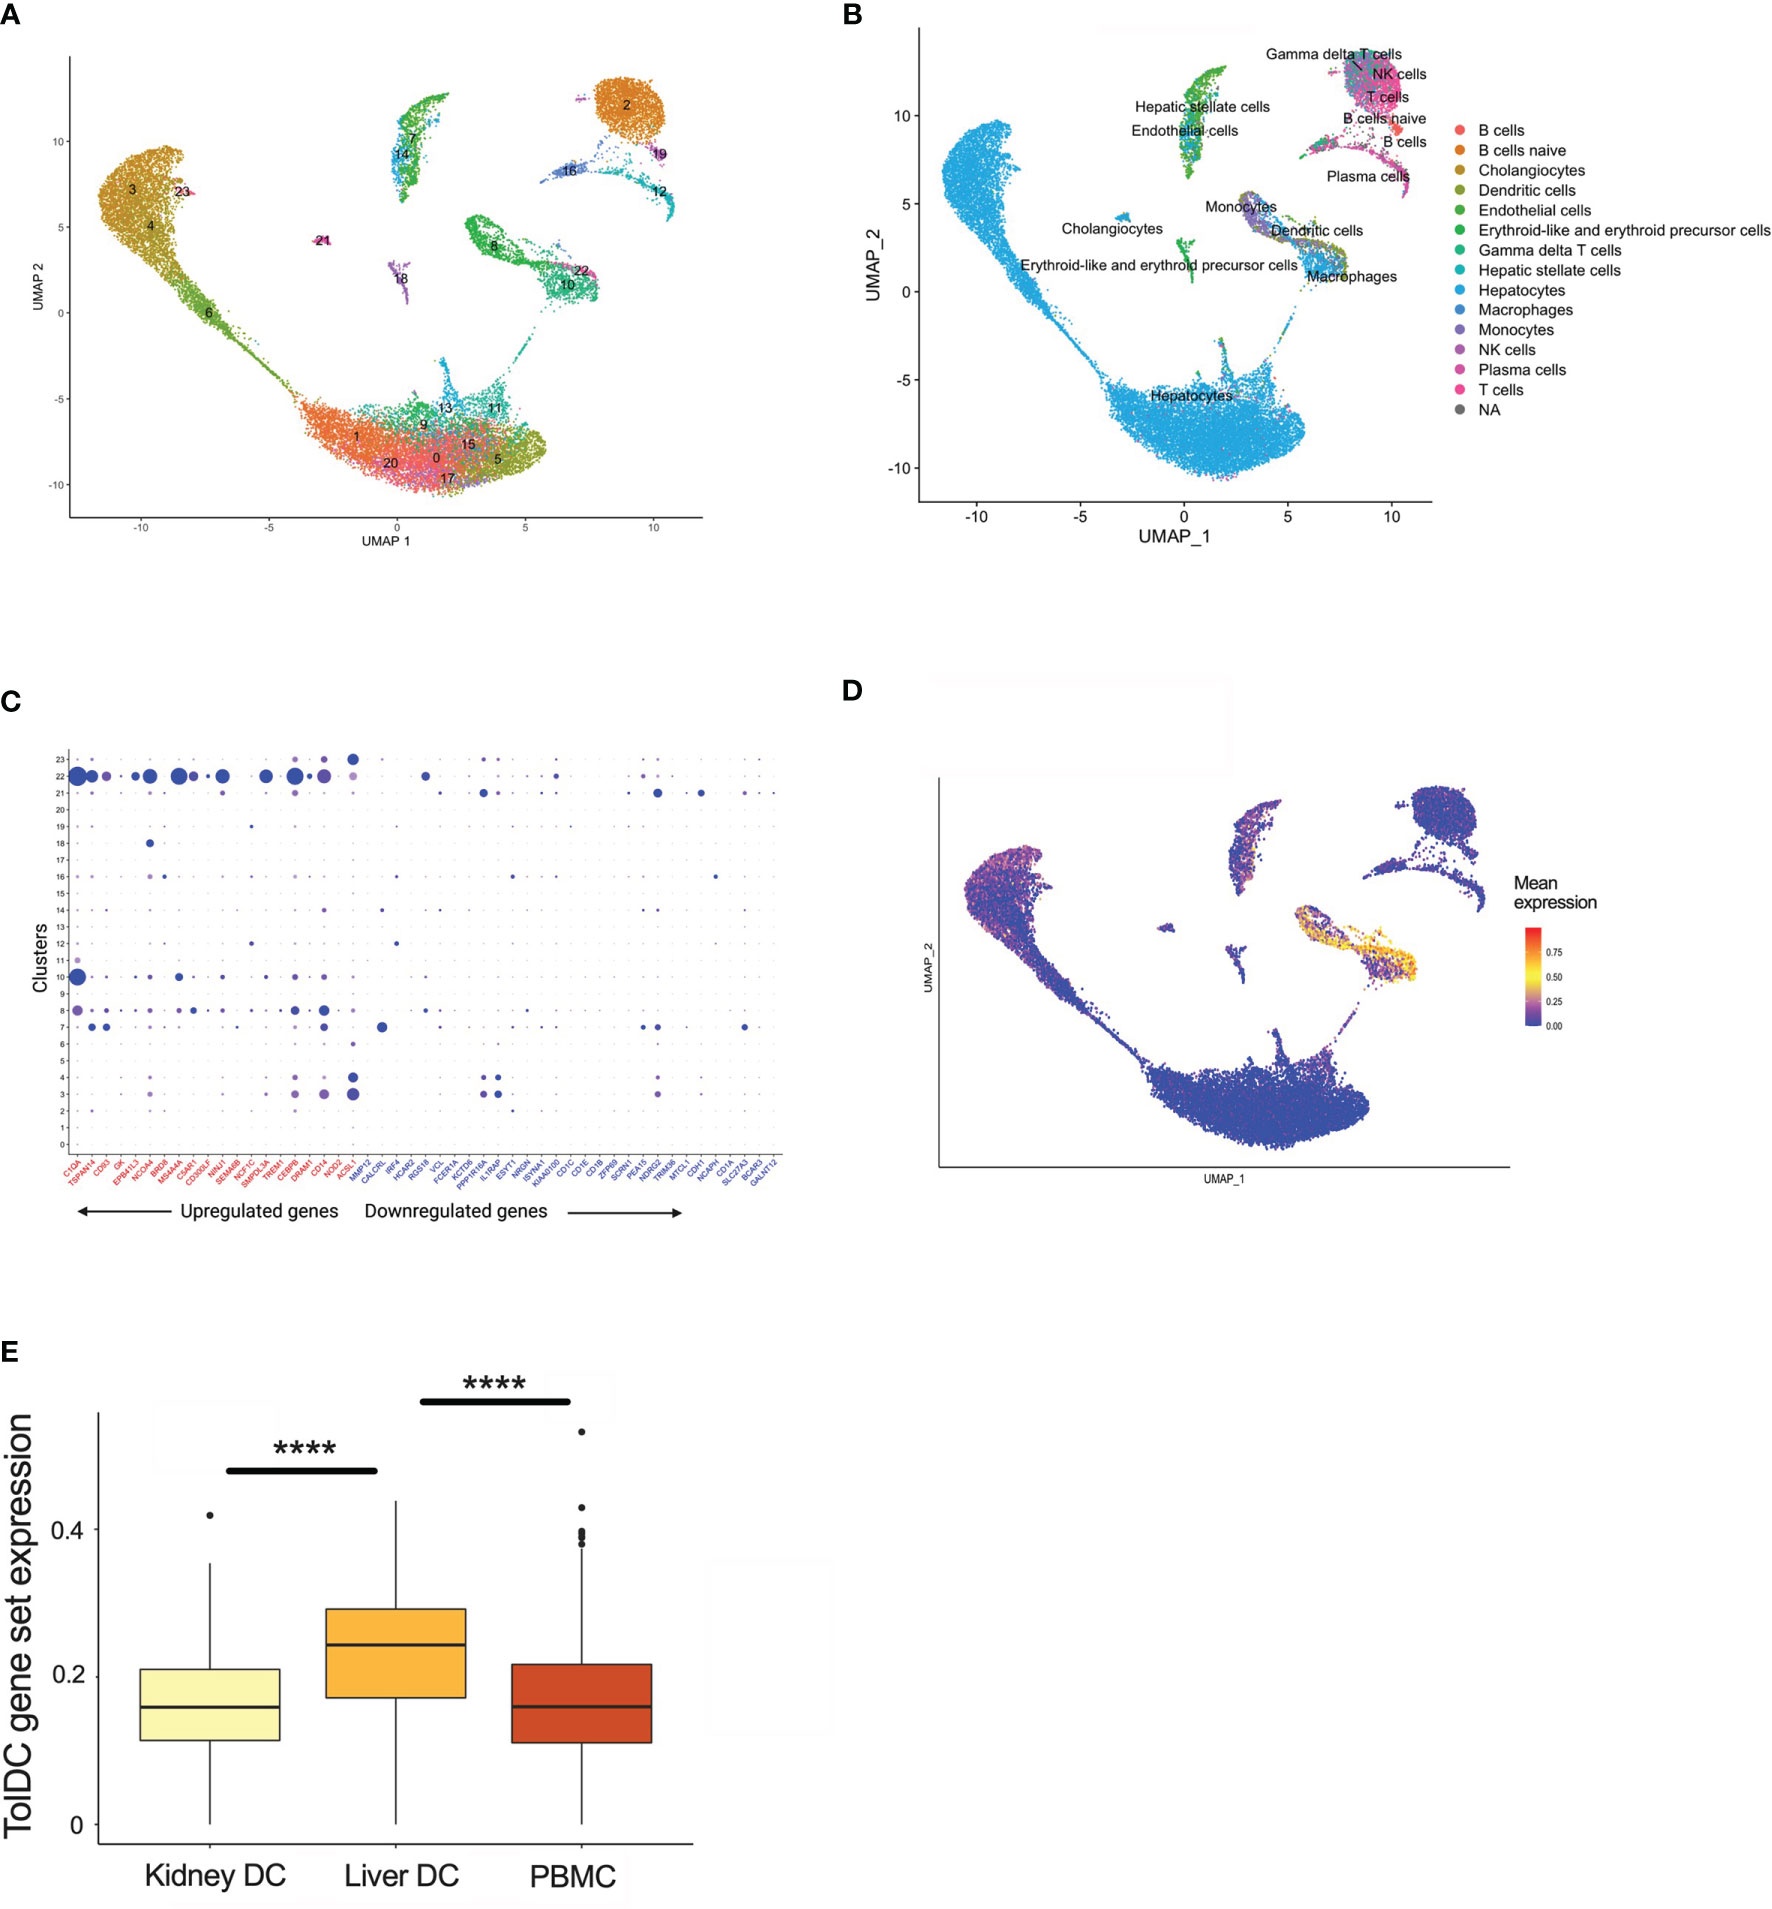
Figure 5 TolDC gene set is overexpressed in liver-resident DC. (A) UMAP plot displaying the clustering of harmony integrated scRNAseq samples. (B) UMAP plot of liver datasets annotated by cell type. (C) Dot plot displaying up- and down-regulated tolDC gene expression markers enriched within cell clusters. (D) UMAP plot demonstrating a joint density analysis of upregulated genes from the tolDC gene set. (E) Boxplot displaying the expression of the tolDC gene set across tissue-resident and circulating DC. ****p < 0.0001.
The Relevance of DC Gene Signatures In Vivo
DC are rare populations within the peripheral blood (45), but reside at greater frequency within tissue interstitial compartments in an immature state, and sample the environment in organs exposed to potential (neo-)antigens in lung (46, 47), kidney (48), and skin (49, 50). The potential for exogenous stimuli to initiate DC activation suggests that the mature DC gene signature might be enriched in tissue-specific DC subsets in vivo. A total of 64 genes were significantly differentially expressed between the mature and immature DC, and the top 52 genes were heat-mapped (Figure 6A). The enrichment analysis yielded pathways relevant to cell inflammation and infection (Figures 6B, C). Mature DC are well-defined in the literature, and the correlation with an inflammatory gene signature demonstrates the reliability of our pipeline to resolve genes according to DC phenotype, as well as supporting the current hypothesis that DC are influenced by the surrounding environment (3).
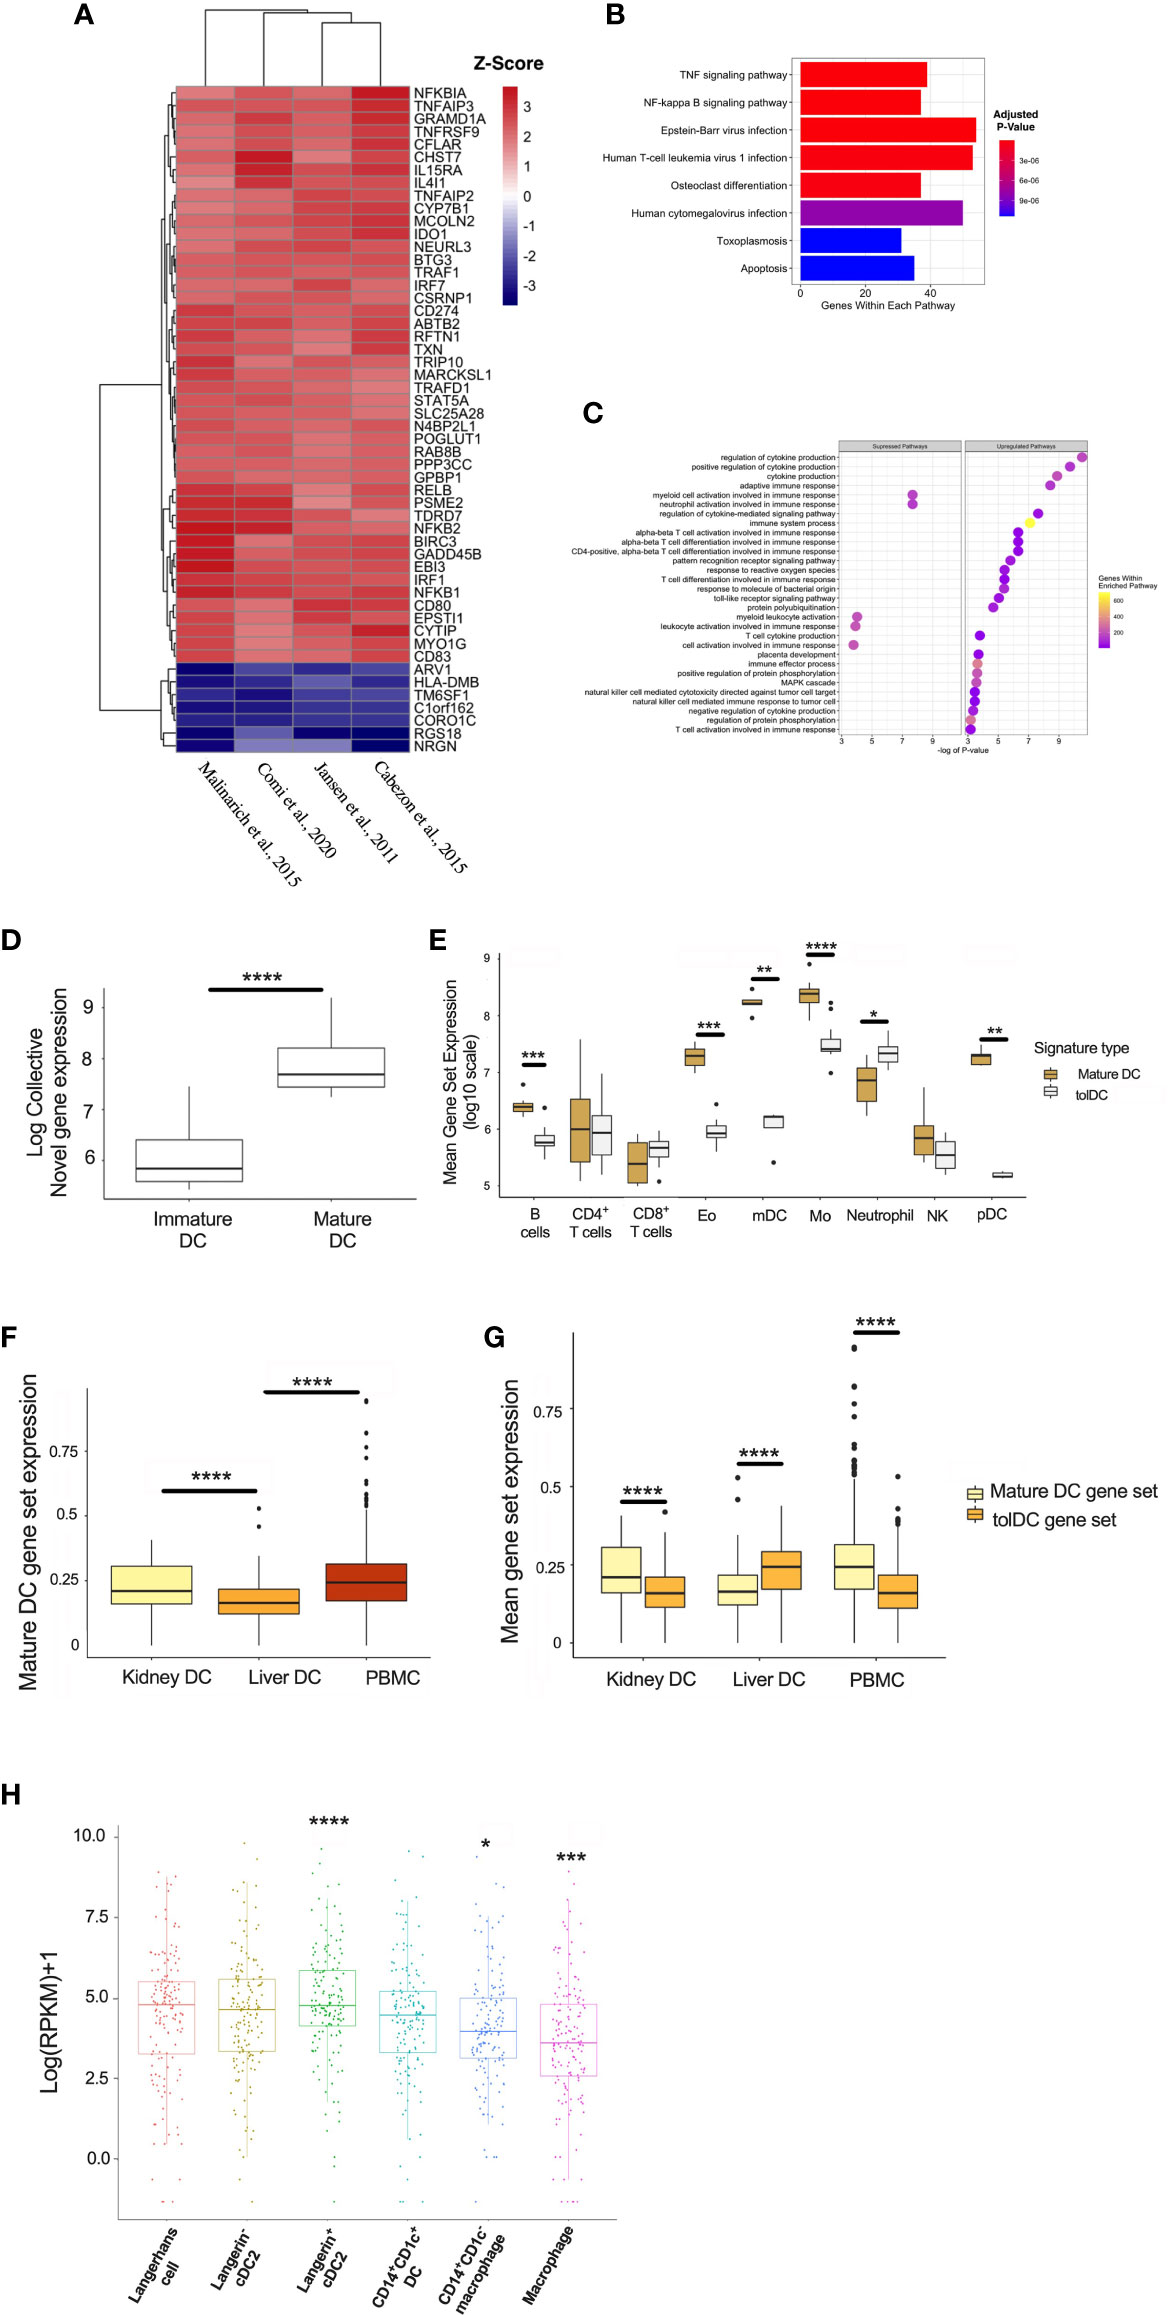
Figure 6 Generating a mature DC transcriptome. (A) Heatmap representation of the top 52 DEG within the mature DC phenotype. (B) KEGG and (C) Gene Set Enrichment Analyses. (D) Mature DC gene-set expression in myeloid cell subsets isolated from epithelial tissues. (E) Comparison of tolDC and mature DC gene signatures in peripheral blood immune cell subsets. (F) Boxplot displaying the expression of genes critical to mature DC across DC in liver, kidney and PBMC. (G) Comparison of tolDC and mature DC gene set expression in liver, kidney and PBMC. (H) Mononuclear phagocytes from epithelial and subepithelial tissues were isolated and classified as DC or macrophage. The average expression of the mature DC gene signature was plotted between cells. A two-sample t-test was performed to determine statistically significant differences in base mean expression of the mature DC gene set across MNP. *p < 0.05, **p < 0.01, ***p < 0.001, ****p < 0.0001.
To further demonstrate the physiological relevance of our DC gene signatures, we used a dataset identifying 6 myeloid cell subsets (31), demonstrating that our mature DC gene set correlated with the appropriate (mature) DC subset identified in vivo (Figure 6D). This also shows our approach to identifying a cell-specific gene signature on microarray platforms could be successfully applied to RNAseq data. Interestingly, the tolerogenic and mature DC gene sets could also be applied to distinct immune cell subsets within peripheral blood (32), with the latter enriched in myeloid DC (mDC) and monocytes (Figure 6E). We applied our mature DC signature to liver, kidney and PBMC scRNAseq samples, demonstrating significantly lower expression in liver (Figure 6F). Kidney-resident DC and PBMC showed an enhanced mature DC signal compared to tolDC (Figure 6G). We also interrogated a recent dataset comparing the expression profiles of mononuclear phagocytes (MNP) isolated from epidermal and dermal tissue (30). The expression of our mature, but not tolerogenic, DC signature was significantly higher in recognized DC subsets (Figure 6H and Supplementary Figures 3A, B).
Discussion
Here we derive novel, distinct genetic signatures for both tolDC and mature DC. Both gene sets align with known biological differences in phenotype and function, and can be used to identify physiological DC subsets in vivo. Most interesting was the mapping of the tolDC signature to liver DC. Our analysis also demonstrated that tolDC and immature DC are distinct subsets, despite current paradigms suggesting overlap of several features (51), and these data support the notion that tolDC indeed derive from specific transcriptional programming.
We identified several genes critical to tolDC function. Several compartments of the CD1 glycoprotein complex were downregulated in the tolDC gene set. CD1 is a cell surface protein that is involved in presentation of lipid-based antigens to T-cells and natural killer cells that subsequently mediate adaptive immunity (52, 53). CD1 autoreactive T-cells, particularly CD1a and CD1c, are abundant among circulating T-cells from healthy human adults and neonates (54) and are associated with a variety of diseases. The plasticity of CD1 antigen presentation highlights evolved mechanisms that regulate the self/non-self cellular lipid environment presented to T‐cells. With CD1a-c expression decreased in the tolDC we can speculate defective T cell stimulation ability due to altered antigen processing and presentation (55). This finding has also been replicated in tissue-resident CD103+ conventional DC which were less effective in antigen cross-presentation with accumulated lipid bodies (56).
CD14, a known monocyte cell-surface marker in blood, is expressed by tissue-based macrophages, and was significantly upregulated in tolDC. CD14 has several functions on the surface of monocytes, ranging from metabolism to pathogen-associated-molecular pattern (PAMP) identification in the innate immune response (57). CD14 binds to extracellular LPS and acts as a secondary receptor to TLR4 in facilitating a subsequent immune response (58). However, recent data has demonstrated that DC subsets expressing CD14 impeded T-cell proliferation (59). Interestingly, CD14 and CD1a kinetics are replicated in human monocyte-derived DC whose maturation capacity are limited by co-culture with immune complexes (60).
The global gene expression profile of tolDC identified prominent enrichment of the mitogen-associated protein kinase (MAPK) pathway. This finding is in keeping with reports that MAPK (specifically p38) inhibition promotes an immunogenic DC phenotype (61) and augments effector T cell responses (62). Cytoskeletal pathway changes (specifically related to actin filaments) were suppressed, a process that is fundamental to plasma membrane internalization for endocytosis and vesicle transportation required for antigen processing and cell surface presentation (63, 64).
Our tolDC gene set was validated in datasets from publications generating tolerogenic human DC using a variety of pharmacological agents (TLR ligands, IL-10, vitamin D and dexamethasone). TolDC propagated using GM-CSF (26) or rapamycin (19) demonstrated noticeably different transcriptomes, in keeping with known phenotypic and functional differences (although direct in vitro comparisons were not consistently reported). GM-CSF alone is not commonly used in vitro for this purpose, and has been shown to produce tolDC that are distinct from the established literature, including greater plasticity (65) and metabolic changes that drive T cell inhibition (26). Rapamycin-induced tolDC also diverge from other tolDC, producing higher bioactive IL-12 and lower IL-10 levels (66), in addition to strikingly discrepant findings of mTOR inhibition on DC function that demonstrate activation (67, 68) or inhibition (69, 70).
Alternatively-activated DC (AADC), tolerogenic DC activated by inflammatory stimuli, are effective in inducing anergic and regulatory T cell responses (34) that protects against lethal graft-versus-host-disease in pre-clinical models (33). Only 3 comparative datasets were available for analysis and did not demonstrate homogeneity between DEG from AADC and tolDC. Gene enrichment analysis demonstrated increased virus and stress responsiveness, as well as cytokine-signaling/inflammatory pathways, with concurrent downregulation of mitochondrial function. Metabolic plasticity, including enhanced catabolism, has been correlated with DC function, and our findings correlated with previous work demonstrating decreased oxidative phosphorylation capacity with LPS-stimulated tolDC (24).
TolDC are artificially generated in vitro, and therefore not wholly representative of DC found physiologically. However, natural and induced DC with tolerogenic capacity (71) are crucial for homeostatic function, particularly in tissues exposed to environmental stimuli. The liver is considered the most tolerogenic organ, and our tolDC gene signature was overrepresented in four integrated scRNAseq datasets of healthy human liver, clustering with liver-resident DC (with overlap seen in the macrophage/monocyte population). DC and macrophages are interrelated, derive from common lineages, and are often phenotypically and functionally indistinguishable (51). Hepatic DC are distinct from other tissue-based DC (37, 72), abundantly secreting immunosuppressive cytokines (41, 73) that dictate immunoregulatory properties. We mapped the tolDC gene set to scRNAseq samples of healthy (and more immunogenic) kidney as a comparator, but the signature was not overexpressed, in keeping with clinical and experimental data that support organ-specific differences in allograft acceptance (74).
Our pipeline generating a tolDC transcriptomic signature was applied to developing a gene set relevant to mature DC. Genes deemed significant to mature DC were strongly implicated in the inflammatory response and, using the KEGG database, mapped to TNF-α and NF-kB signaling pathways. NF-κB is a central mediator of pro-inflammatory gene induction and functions in both innate and adaptive immune cells, and central for DC maturation (75). We were able to demonstrate that our mature DC gene signature was enriched in CD1c+ mature DC rather than CLEC9A+ immature DC. These findings, while not novel, speak to the validity of our methods in characterizing DC phenotype using gene expression datasets, and demonstrate that our signature could be applied to physiological DC in vivo.
This paper further highlights the need for further -omic studies to identify a consensus gene expression profile, including distinct signaling pathways, that can confirm tolDC function and stability in vivo. Despite the reported safety of tolDC in early-phase human trials (17), and known efficacy in large animal models (76), potential variability in clinical grade tolDC preparations remains a concern for translational purposes. The advent of standardized tolDC manufacturing through Focus and Accelerate Cell-based Tolerance-inducing Therapies (77) aims to minimize variations in approach and is a key step towards a standardized tolDC production for pre-clinical studies and clinical trials. Understanding the genomic processes behind the functional properties of DC and identification of molecular targets of immunomodulation provide potential opportunities for intervention to silence unwanted immune responses.
Data Availability Statement
Publicly available datasets were analysed in this study. This data can be found here: GSE13762, GSE23371, GSE56017, GSE117946, GSE52894, GSE104438, GSE98480, GSE92852, ArrayExpress database E-MTAB-6937.
Author Contributions
NR and EP led the study, designed experiments, and wrote the manuscript. HR, JL, and EP analysed the data. All authors contributed to experimental design and drafting the manuscript.
Funding
JL is supported by a NHMRC postgraduate scholarship (GNT1168776). AH is supported by National Health Medical Research Council (NHMRC) Ideas Grant (GNT1181482). EP is supported by a Discovery Early Career Researcher Award from the Australian Research Council. NR is supported by NHMRC Project and Career Development Grants (GNT1138372, GNT1158977 respectively).
Conflict of Interest
The authors declare that the research was conducted in the absence of any commercial or financial relationships that could be construed as a potential conflict of interest.
Publisher’s Note
All claims expressed in this article are solely those of the authors and do not necessarily represent those of their affiliated organizations, or those of the publisher, the editors and the reviewers. Any product that may be evaluated in this article, or claim that may be made by its manufacturer, is not guaranteed or endorsed by the publisher.
Supplementary Material
The Supplementary Material for this article can be found online at: https://www.frontiersin.org/articles/10.3389/fimmu.2021.733231/full#supplementary-material
Supplementary Figure 1A | Principal component analysis (PCA) from tolDC discovery and validation datasets. PCA plots characterizing the change in gene expression profiles between immature DC (red), mature DC (green), tolDC (blue), or alternatively-activated tolerogenic DC (AADC, purple).
Supplementary Figure 1B | Heatmap demonstrating the correlation between samples. Gene signatures from immature DC (blue), mature DC (red), tolDC (purple), and AADC (green) from relevant datasets. Both the horizontal and vertical axis were clustered using the same hierarchical clustering algorithm. Each square on the heatmap is the value of Pearson’s correlation coefficient between the two sample, and values are assigned a color.
Supplementary Figure 2 | TolDC gene signature expression in human kidney tissue. (A) UMAP plot of human liver datasets integrated using the harmony method. Each dataset was annotated using the accessible code on the Panglao database. (B) UMAP plot demonstrating a joint density analysis of downregulated genes from the tolDC gene set. (C) Boxplot displaying the expression of housekeeping genes glyceraldehyde 3-phosphate dehydrogenase (GAPDH), succinate dehydrogenase complex subunit A (SDHA) and peptidylprolyl isomerase A (PPIA) across liver and kidney DC, and PBMC.
Supplementaary Figure 3 | TolDC gene set expression in human mononuclear phagocytes. Mononuclear phagocytes were isolated from epithelial and sub-epithelial tissues. The average expression of the tolDC gene signature was plotted between cells. The average expression of the tolDC gene signature was plotted between cells. A two-sample t-test was performed to determine differences in base mean expression of the tolDC gene set across MNP. (B) Boxplot displaying differences between tolDC and mature DC transcriptomic signatures within each MNP subset. **p < 0.01, ***p < 0.001.
References
1. Collin M, Bigley V. Human Dendritic Cell Subsets: An Update. Immunology (2018) 154:3–20. doi: 10.1111/imm.12888
2. Anderson DA 3rd, Dutertre CA, Ginhoux F, Murphy KM. Genetic Models of Human and Mouse Dendritic Cell Development and Function. Nat Rev Immunol (2021) 21:101–15. doi: 10.1038/s41577-020-00413-x
3. Kakimoto M, Hasegawa A, Fujita S, Yasukawa M. Phenotypic and Functional Alterations of Dendritic Cells Induced by Human Herpesvirus 6 Infection. J Virol (2002) 76:10338–45. doi: 10.1128/JVI.76.20.10338-10345.2002
4. Cabeza-Cabrerizo M, Cardoso A, Minutti CM, Pereira da Costa M, Reis ESC. Dendritic Cells Revisited. Annu Rev Immunol (2021) 39:131–66. doi: 10.1146/annurev-immunol-061020-053707
5. Hilkens CM, Isaacs JD, Thomson AW. Development of Dendritic Cell-Based Immunotherapy for Autoimmunity. Int Rev Immunol (2010) 29:156–83. doi: 10.3109/08830180903281193
6. Ochando J, Ordikhani F, Jordan S, Boros P, Thomson AW. Tolerogenic Dendritic Cells in Organ Transplantation. Transpl Int (2020) 33:113–27. doi: 10.1111/tri.13504
7. Giannoukakis N, Phillips B, Finegold D, Harnaha J, Trucco M. Phase I (Safety) Study of Autologous Tolerogenic Dendritic Cells in Type 1 Diabetic Patients. Diabetes Care (2011) 34:2026–32. doi: 10.2337/dc11-0472
8. Bell GM, Anderson AE, Diboll J, Reece R, Eltherington O, Harry RA, et al. Autologous Tolerogenic Dendritic Cells for Rheumatoid and Inflammatory Arthritis. Ann Rheum Dis (2017) 76:227–34. doi: 10.1136/annrheumdis-2015-208456
9. Zubizarreta I, Florez-Grau G, Vila G, Cabezon R, Espana C, Andorra M, et al. Immune Tolerance in Multiple Sclerosis and Neuromyelitis Optica With Peptide-Loaded Tolerogenic Dendritic Cells in a Phase 1b Trial. Proc Natl Acad Sci USA (2019) 116:8463–70. doi: 10.1073/pnas.1820039116
10. Thomson AW, Metes DM, Ezzelarab MB, Raich-Regue D. Regulatory Dendritic Cells for Human Organ Transplantation. Transplant Rev (Orlando) (2019) 33:130–6. doi: 10.1016/j.trre.2019.05.001
11. Moreau A, Varey E, Beriou G, Hill M, Bouchet-Delbos L, Segovia M, et al. Tolerogenic Dendritic Cells and Negative Vaccination in Transplantation: From Rodents to Clinical Trials. Front Immunol (2012) 3:218. doi: 10.3389/fimmu.2012.00218
12. Morelli AE, Thomson AW. Tolerogenic Dendritic Cells and the Quest for Transplant Tolerance. Nat Rev Immunol (2007) 7:610–21. doi: 10.1038/nri2132
13. Peche H, Renaudin K, Beriou G, Merieau E, Amigorena S, Cuturi MC. Induction of Tolerance by Exosomes and Short-Term Immunosuppression in a Fully MHC-Mismatched Rat Cardiac Allograft Model. Am J Transplant (2006) 6:1541–50. doi: 10.1111/j.1600-6143.2006.01344.x
14. Dane KY, Nembrini C, Tomei AA, Eby JK, O’Neil CP, Velluto D, et al. Nano-Sized Drug-Loaded Micelles Deliver Payload to Lymph Node Immune Cells and Prolong Allograft Survival. J Control Rel (2011) 156:154–60. doi: 10.1016/j.jconrel.2011.08.009
15. Bonifaz L, Bonnyay D, Mahnke K, Rivera M, Nussenzweig MC, Steinman RM. Efficient Targeting of Protein Antigen to the Dendritic Cell Receptor DEC-205 in the Steady State Leads to Antigen Presentation on Major Histocompatibility Complex Class I Products and Peripheral CD8+ T Cell Tolerance. J Exp Med (2002) 196:1627–38. doi: 10.1084/jem.20021598
16. Steinman RM, Hawiger D, Nussenzweig MC. Tolerogenic Dendritic Cells. Annu Rev Immunol (2003) 21:685–711. doi: 10.1146/annurev.immunol.21.120601.141040
17. Li J, Thomson AW, Rogers NM. Myeloid and Mesenchymal Stem Cell Therapies for Solid Organ Transplant Tolerance. Transplantation (2021). doi: 10.1097/TP.0000000000003765
18. Schinnerling K, Garcia-Gonzalez P, Aguillon JC. Gene Expression Profiling of Human Monocyte-Derived Dendritic Cells - Searching for Molecular Regulators of Tolerogenicity. Front Immunol (2015) 6:528. doi: 10.3389/fimmu.2015.00528
19. Navarro-Barriuso J, Mansilla MJ, Naranjo-Gomez M, Sanchez-Pla A, Quirant-Sanchez B, Teniente-Serra A, et al. Comparative Transcriptomic Profile of Tolerogenic Dendritic Cells Differentiated With Vitamin D3, Dexamethasone and Rapamycin. Sci Rep (2018) 8:14985. doi: 10.1038/s41598-018-33248-7
20. Szeles L, Keresztes G, Torocsik D, Balajthy Z, Krenacs L, Poliska S, et al. 1,25-Dihydroxyvitamin D3 Is an Autonomous Regulator of the Transcriptional Changes Leading to a Tolerogenic Dendritic Cell Phenotype. J Immunol (2009) 182:2074–83. doi: 10.4049/jimmunol.0803345
21. Jansen BJ, Sama IE, Eleveld-Trancikova D, van Hout-Kuijer MA, Jansen JH, Huynen MA, et al. MicroRNA Genes Preferentially Expressed in Dendritic Cells Contain Sites for Conserved Transcription Factor Binding Motifs in Their Promoters. BMC Genomics (2011) 12:330. doi: 10.1186/1471-2164-12-330
22. Cabezon R, Carrera-Silva EA, Florez-Grau G, Errasti AE, Calderon-Gomez E, Lozano JJ, et al. MERTK as Negative Regulator of Human T Cell Activation. J Leukoc Biol (2015) 97:751–60. doi: 10.1189/jlb.3A0714-334R
23. Comi M, Avancini D, Santoni de Sio F, Villa M, Uyeda MJ, Floris M, et al. Coexpression of CD163 and CD141 Identifies Human Circulating IL-10-Producing Dendritic Cells (DC-10). Cell Mol Immunol (2020) 17:95–107. doi: 10.1038/s41423-019-0218-0
24. Malinarich F, Duan K, Hamid RA, Bijin A, Lin WX, Poidinger M, et al. High Mitochondrial Respiration and Glycolytic Capacity Represent a Metabolic Phenotype of Human Tolerogenic Dendritic Cells. J Immunol (2015) 194:5174–86. doi: 10.4049/jimmunol.1303316
25. Yang P, Patrick E, Tan SX, Fazakerley DJ, Burchfield J, Gribben C, et al. Direction Pathway Analysis of Large-Scale Proteomics Data Reveals Novel Features of the Insulin Action Pathway. Bioinformatics (2014) 30:808–14. doi: 10.1093/bioinformatics/btt616
26. Marin E, Bouchet-Delbos L, Renoult O, Louvet C, Nerriere-Daguin V, Managh AJ, et al. Human Tolerogenic Dendritic Cells Regulate Immune Responses Through Lactate Synthesis. Cell Metab (2019) 30:1075–1090 e1078. doi: 10.1016/j.cmet.2019.11.011
27. Giesbrecht K, Eberle ME, Wolfle SJ, Sahin D, Sahr A, Oberhardt V, et al. IL-1beta As Mediator of Resolution That Reprograms Human Peripheral Monocytes Toward a Suppressive Phenotype. Front Immunol (2017) 8:899. doi: 10.3389/fimmu.2017.00899
28. Heine A, Held SAE, Schulte-Schrepping J, Wolff JFA, Klee K, Ulas T, et al. Generation and Functional Characterization of MDSC-Like Cells. Oncoimmunology (2017) 6:e1295203. doi: 10.1080/2162402X.2017.1295203
29. Yu G, Wang LG, Han Y, He QY. Clusterprofiler: An R Package for Comparing Biological Themes Among Gene Clusters. OMICS (2012) 16:284–7. doi: 10.1089/omi.2011.0118
30. Rhodes JW, Botting RA, Bertram KM, Vine EE, Rana H, Baharlou H, et al. Human Anogenital Monocyte-Derived Dendritic Cells and Langerin+Cdc2 are Major HIV Target Cells. Nat Commun (2021) 12:2147. doi: 10.1038/s41467-021-22375-x
31. Chen YP, Yin JH, Li WF, Li HJ, Chen DP, Zhang CJ, et al. Single-Cell Transcriptomics Reveals Regulators Underlying Immune Cell Diversity and Immune Subtypes Associated With Prognosis in Nasopharyngeal Carcinoma. Cell Res (2020) 30:1024–42. doi: 10.1038/s41422-020-0374-x
32. Allantaz F, Cheng DT, Bergauer T, Ravindran P, Rossier MF, Ebeling M, et al. Expression Profiling of Human Immune Cell Subsets Identifies miRNA-mRNA Regulatory Relationships Correlated With Cell Type Specific Expression. PloS One (2012) 7:e29979. doi: 10.1371/journal.pone.0029979
33. Sato K, Yamashita N, Yamashita N, Baba M, Matsuyama T. Regulatory Dendritic Cells Protect Mice From Murine Acute Graft-Versus-Host Disease and Leukemia Relapse. Immunity (2003) 18:367–79. doi: 10.1016/S1074-7613(03)00055-4
34. Sato K, Yamashita N, Baba M, Matsuyama T. Modified Myeloid Dendritic Cells Act as Regulatory Dendritic Cells to Induce Anergic and Regulatory T Cells. Blood (2003) 101:3581–9. doi: 10.1182/blood-2002-09-2712
35. Lan YY, Wang Z, Raimondi G, Wu W, Colvin BL, de Creus A, et al. “Alternatively Activated” Dendritic Cells Preferentially Secrete IL-10, Expand Foxp3+CD4+ T Cells, and Induce Long-Term Organ Allograft Survival in Combination With CTLA4-Ig. J Immunol (2006) 177:5868–77. doi: 10.4049/jimmunol.177.9.5868
36. Lee WC, Qiani S, Wan Y, Li W, Xing Z, Gauldie J, et al. Contrasting Effects of Myeloid Dendritic Cells Transduced With an Adenoviral Vector Encoding Interleukin-10 on Organ Allograft and Tumor Rejection. Immunology (2000) 101:233–41. doi: 10.1046/j.1365-2567.2000.00096.x
37. Dai H, Zheng Y, Thomson AW, Rogers NM. Transplant Tolerance Induction: Insights From the Liver. Front Immunol (2020) 11:1044. doi: 10.3389/fimmu.2020.01044
38. Malone F, Carper K, Reyes J, Li W. γδT Cells Are Involved in Liver Transplant Tolerance. Transplant Proc (2009) 41:233–5. doi: 10.1016/j.transproceed.2008.10.040
39. Horst AK, Neumann K, Diehl L. Modulation of Liver Tolerance by Conventional and Nonconventional Antigen-Presenting Cells and Regulatory Immune Cells. Cell Mol Immunol (2016) 13:277–92. doi: 10.1038/cmi.2015.112
40. Steptoe RJ, Patel RK, Subbotin VM, Thomson AW. Comparative Analysis of Dendritic Cell Density and Total Number in Commonly Transplanted Organs: Morphometric Estimation in Normal Mice. Transpl Immunol (2000) 8:49–56. doi: 10.1016/S0966-3274(00)00010-1
41. Bamboat ZM, Stableford JA, Plitas G, Burt BM, Nguyen HM, Welles AP, et al. Human Liver Dendritic Cells Promote T Cell Hyporesponsiveness. J Immunol (2009) 182:1901–11. doi: 10.4049/jimmunol.0803404
42. Kingham TP, Chaudhry UI, Plitas G, Katz SC, Raab J, DeMatteo RP. Murine Liver Plasmacytoid Dendritic Cells Become Potent Immunostimulatory Cells After Flt-3 Ligand Expansion. Hepatology (2007) 45:445–54. doi: 10.1002/hep.21457
43. Woo J, Lu L, Rao AS, Li Y, Subbotin V, Starzl TE, et al. Isolation, Phenotype, and Allostimulatory Activity of Mouse Liver Dendritic Cells. Transplantation (1994) 58:484–91. doi: 10.1097/00007890-199408270-00015
44. Watson S, Mercier S, Bye C, Wilkinson J, Cunningham AL, Harman AN. Determination of Suitable Housekeeping Genes for Normalization of Quantitative Real Time PCR Analysis of Cells Infected With Human Immunodeficiency Virus and Herpes Viruses. Virol J (2007) 4:130. doi: 10.1186/1743-422X-4-130
45. Orsini G, Legitimo A, Failli A, Massei F, Biver P, Consolini R. Enumeration of Human Peripheral Blood Dendritic Cells Throughout the Life. Int Immunol (2012) 24:347–56. doi: 10.1093/intimm/dxs006
46. Blank F, Rothen-Rutishauser B, Gehr P. Dendritic Cells and Macrophages Form a Transepithelial Network Against Foreign Particulate Antigens. Am J Respir Cell Mol Biol (2007) 36:669–77. doi: 10.1165/rcmb.2006-0234OC
47. Sertl K, Takemura T, Tschachler E, Ferrans VJ, Kaliner MA, Shevach EM. Dendritic Cells With Antigen-Presenting Capability Reside in Airway Epithelium, Lung Parenchyma, and Visceral Pleura. J Exp Med (1986) 163:436–51. doi: 10.1084/jem.163.2.436
48. Yatim KM, Gosto M, Humar R, Williams AL, Oberbarnscheidt MH. Renal Dendritic Cells Sample Blood-Borne Antigen and Guide T-Cell Migration to the Kidney by Means of Intravascular Processes. Kidney Int (2016) 90:818–27. doi: 10.1016/j.kint.2016.05.030
49. Nishibu A, Ward BR, Jester JV, Ploegh HL, Boes M, Takashima A. Behavioral Responses of Epidermal Langerhans Cells In Situ to Local Pathological Stimuli. J Invest Dermatol (2006) 126:787–96. doi: 10.1038/sj.jid.5700107
50. Clausen BE, Stoitzner P. Functional Specialization of Skin Dendritic Cell Subsets in Regulating T Cell Responses. Front Immunol (2015) 6:534. doi: 10.3389/fimmu.2015.00534
51. Rogers NM, Ferenbach DA, Isenberg JS, Thomson AW, Hughes J. Dendritic Cells and Macrophages in the Kidney: A Spectrum of Good and Evil. Nat Rev Nephrol (2014) 10:625–43. doi: 10.1038/nrneph.2014.170
52. Siddiqui S, Visvabharathy L, Wang CR. Role of Group 1 CD1-Restricted T Cells in Infectious Disease. Front Immunol (2015) 6:337. doi: 10.3389/fimmu.2015.00337
53. Barral DC, Brenner MB. CD1 Antigen Presentation: How It Works. Nat Rev Immunol (2007) 7:929–41. doi: 10.1038/nri2191
54. de Jong A, Pena-Cruz V, Cheng TY, Clark RA, Van Rhijn I, Moody DB. CD1a-Autoreactive T Cells Are a Normal Component of the Human Alphabeta T Cell Repertoire. Nat Immunol (2010) 11:1102–9. doi: 10.1038/ni.1956
55. Herber DL, Cao W, Nefedova Y, Novitskiy SV, Nagaraj S, Tyurin VA, et al. Lipid Accumulation and Dendritic Cell Dysfunction in Cancer. Nat Med (2010) 16:880–6. doi: 10.1038/nm.2172
56. Veglia F, Tyurin VA, Mohammadyani D, Blasi M, Duperret EK, Donthireddy L, et al. Lipid Bodies Containing Oxidatively Truncated Lipids Block Antigen Cross-Presentation by Dendritic Cells in Cancer. Nat Commun (2017) 8:2122. doi: 10.1038/s41467-017-02186-9
57. Wu Z, Zhang Z, Lei Z, Lei P. CD14: Biology and Role in the Pathogenesis of Disease. Cytokine Growth Factor Rev (2019) 48:24–31. doi: 10.1016/j.cytogfr.2019.06.003
58. Zanoni I, Ostuni R, Marek LR, Barresi S, Barbalat R, Barton GM, et al. CD14 Controls the LPS-Induced Endocytosis of Toll-Like Receptor 4. Cell (2011) 147:868–80. doi: 10.1016/j.cell.2011.09.051
59. Heger L, Hofer TP, Bigley V, de Vries IJM, Dalod M, Dudziak D, et al. Subsets of CD1c(+) DCs: Dendritic Cell Versus Monocyte Lineage. Front Immunol (2020) 11:559166. doi: 10.3389/fimmu.2020.559166
60. Laborde EA, Vanzulli S, Beigier-Bompadre M, Isturiz MA, Ruggiero RA, Fourcade MG, et al. Immune Complexes Inhibit Differentiation, Maturation, and Function of Human Monocyte-Derived Dendritic Cells. J Immunol (2007) 179:673–81. doi: 10.4049/jimmunol.179.1.673
61. Guindi C, Cloutier A, Gaudreau S, Zerif E, McDonald PP, Tatsiy O, et al. Role of the P38 MAPK/C/EBPbeta Pathway in the Regulation of Phenotype and IL-10 and IL-12 Production by Tolerogenic Bone Marrow-Derived Dendritic Cells. Cells (2018) 7(12):256. doi: 10.3390/cells7120256
62. Lu Y, Zhang M, Wang S, Hong B, Wang Z, Li H, et al. P38 MAPK-Inhibited Dendritic Cells Induce Superior Antitumour Immune Responses and Overcome Regulatory T-Cell-Mediated Immunosuppression. Nat Commun (2014) 5:4229. doi: 10.1038/ncomms5229
63. May RC, Machesky LM. Phagocytosis and the Actin Cytoskeleton. J Cell Sci (2001) 114:1061–77. doi: 10.1242/jcs.114.6.1061
64. Schafer DA. Coupling Actin Dynamics and Membrane Dynamics During Endocytosis. Curr Opin Cell Biol (2002) 14:76–81. doi: 10.1016/S0955-0674(01)00297-6
65. Chitta S, Santambrogio L, Stern LJ. GMCSF in the Absence of Other Cytokines Sustains Human Dendritic Cell Precursors With T Cell Regulatory Activity and Capacity to Differentiate Into Functional Dendritic Cells. Immunol Lett (2008) 116:41–54. doi: 10.1016/j.imlet.2007.11.013
66. Turnquist HR, Cardinal J, Macedo C, Rosborough BR, Sumpter TL, Geller DA, et al. mTOR and GSK-3 Shape the CD4+ T-Cell Stimulatory and Differentiation Capacity of Myeloid DCs After Exposure to LPS. Blood (2010) 115:4758–69. doi: 10.1182/blood-2009-10-251488
67. Haidinger M, Poglitsch M, Geyeregger R, Kasturi S, Zeyda M, Zlabinger GJ, et al. A Versatile Role of Mammalian Target of Rapamycin in Human Dendritic Cell Function and Differentiation. J Immunol (2010) 185:3919–31. doi: 10.4049/jimmunol.1000296
68. Amiel E, Everts B, Freitas TC, King IL, Curtis JD, Pearce EL, et al. Inhibition of Mechanistic Target of Rapamycin Promotes Dendritic Cell Activation and Enhances Therapeutic Autologous Vaccination in Mice. J Immunol (2012) 189:2151–8. doi: 10.4049/jimmunol.1103741
69. Reichardt W, Durr C, von Elverfeldt D, Juttner E, Gerlach UV, Yamada M, et al. Impact of Mammalian Target of Rapamycin Inhibition on Lymphoid Homing and Tolerogenic Function of Nanoparticle-Labeled Dendritic Cells Following Allogeneic Hematopoietic Cell Transplantation. J Immunol (2008) 181:4770–9. doi: 10.4049/jimmunol.181.7.4770
70. Cheng M, Hu S, Wang Z, Pei Y, Fan R, Liu X, et al. Inhibition of Neddylation Regulates Dendritic Cell Functions via Deptor Accumulation Driven mTOR Inactivation. Oncotarget (2016) 7:35643–54. doi: 10.18632/oncotarget.9543
71. Iberg CA, Hawiger D. Natural and Induced Tolerogenic Dendritic Cells. J Immunol (2020) 204:733–44. doi: 10.4049/jimmunol.1901121
72. Pillarisetty VG, Shah AB, Miller G, Bleier JI, DeMatteo RP. Liver Dendritic Cells are Less Immunogenic Than Spleen Dendritic Cells Because of Differences in Subtype Composition. J Immunol (2004) 172:1009–17. doi: 10.4049/jimmunol.172.2.1009
73. Bamboat ZM, Ocuin LM, Balachandran VP, Obaid H, Plitas G, DeMatteo RP. Conventional DCs Reduce Liver Ischemia/Reperfusion Injury in Mice via IL-10 Secretion. J Clin Invest (2010) 120:559–69. doi: 10.1172/JCI40008
74. Madariaga ML, Kreisel D, Madsen JC. Organ-Specific Differences in Achieving Tolerance. Curr Opin Organ Transplant (2015) 20:392–9. doi: 10.1097/MOT.0000000000000206
75. Shih VF, Davis-Turak J, Macal M, Huang JQ, Ponomarenko J, Kearns JD, et al. Control of RelB During Dendritic Cell Activation Integrates Canonical and Noncanonical NF-kappaB Pathways. Nat Immunol (2012) 13:1162–70. doi: 10.1038/ni.2446
76. Ezzelarab MB, Zahorchak AF, Lu L, Morelli AE, Chalasani G, Demetris AJ, et al. Regulatory Dendritic Cell Infusion Prolongs Kidney Allograft Survival in Nonhuman Primates. Am J Transplant (2013) 13:1989–2005. doi: 10.1111/ajt.12310
Keywords: dendritic cell, tolerogenic dendritic cell (tolDC), gene expression profile analysis, mature dendritic cells, mononuclear phagocyte cells, transcriptomic, liver, human dendritic cell
Citation: Robertson H, Li J, Kim HJ, Rhodes JW, Harman AN, Patrick E and Rogers NM (2021) Transcriptomic Analysis Identifies A Tolerogenic Dendritic Cell Signature. Front. Immunol. 12:733231. doi: 10.3389/fimmu.2021.733231
Received: 30 June 2021; Accepted: 30 September 2021;
Published: 20 October 2021.
Edited by:
Elodie Segura, Institut Curie, FranceReviewed by:
Aurelie Moreau, Institut National de la Santé et de la Recherche Médicale (INSERM), FrancePaulina A. García-González, University of Chile, Chile
Copyright © 2021 Robertson, Li, Kim, Rhodes, Harman, Patrick and Rogers. This is an open-access article distributed under the terms of the Creative Commons Attribution License (CC BY). The use, distribution or reproduction in other forums is permitted, provided the original author(s) and the copyright owner(s) are credited and that the original publication in this journal is cited, in accordance with accepted academic practice. No use, distribution or reproduction is permitted which does not comply with these terms.
*Correspondence: Natasha M. Rogers, bmF0YXNoYS5yb2dlcnNAaGVhbHRoLm5zdy5nb3YuYXU=
†These authors share senior authorship