 Muhammad Salman Malik1
 Øystein Wessel
 Maria K. Dahle
 Espen Rimstad
94% of researchers rate our articles as excellent or good
Learn more about the work of our research integrity team to safeguard the quality of each article we publish.
Find out more
ORIGINAL RESEARCH article
Front. Immunol., 16 September 2021
Sec. Comparative Immunology
Volume 12 - 2021 | https://doi.org/10.3389/fimmu.2021.729017
This article is part of the Research TopicImmunity to Emerging Pathogens in Poikilothermic VertebratesView all 9 articles
Piscine orthoreovirus (PRV-1) infection causes heart and skeletal muscle inflammation (HSMI) in farmed Atlantic salmon (Salmo salar). The virus is also associated with focal melanized changes in white skeletal muscle where PRV-1 infection of macrophages appears to be important. In this study, we studied the macrophage polarization into M1 (pro-inflammatory) and M2 (anti-inflammatory) phenotypes during experimentally induced HSMI. The immune response in heart with HSMI lesions was characterized by CD8+ and MHC-I expressing cells and not by polarized macrophages. Fluorescent in situ hybridization (FISH) assays revealed localization of PRV-1 in a few M1 macrophages in both heart and skeletal muscle. M2 type macrophages were widely scattered in the heart and were more abundant in heart compared to the skeletal muscle. However, the M2 macrophages did not co-stain for PRV-1. There was a strong cellular immune response to the infection in the heart compared to that of the skeletal muscle, seen as increased MHC-I expression, partly in cells also containing PRV-1 RNA, and a high number of cytotoxic CD8+ granzyme producing cells that targeted PRV-1. In skeletal muscle, MHC-I expressing cells and CD8+ cells were dispersed between myocytes, but these cells did not stain for PRV-1. Gene expression analysis by RT-qPCR complied with the FISH results and confirmed a drop in level of PRV-1 following the cell mediated immune response. Overall, the results indicated that M1 macrophages do not contribute to the initial development of HSMI. However, large numbers of M2 macrophages reside in the heart and may contribute to the subsequent fast recovery following clearance of PRV-1 infection.
Piscine orthoreovirus (PRV) infects salmonid fish and is linked to several diseases in different salmonid species (1). The subtype PRV-1 is widespread in farmed Atlantic salmon (Salmo salar) and is found to be the etiological cause of heart and skeletal muscle inflammation (HSMI) (2). This subtype is also associated with focal melanized changes in white skeletal muscle, commonly seen after slaughter (3). PRV-1 infection of macrophages appears to be important for the development of the melanized changes. Comparative aspects of the pathogenesis and development of melanized changes and HSMI, including the role of macrophages, has not been explored.
HSMI is a common viral disease in the marine production phase of Atlantic salmon farming in Norway, and mortality has in some cases been reported to reach 20% (4, 5). The disease is also prevalent in other Atlantic salmon farming countries including Chile (6) and Scotland (7), but with few reported outbreaks in Canada (8). Histopathological findings include moderate to severe inflammation of the epi-, myo- and endocardium layers of the heart and moderate necrosis in the red muscle tissue (9). Experimentally it has been shown that the histopathological lesions of HSMI appear about 2 weeks after the peak in the viral load during an acute PRV-1 infection (2).
In contrast, the melanized focal changes in white skeletal muscle have not been associated with clinical symptoms of disease or mortality. The condition is a rather common cause of reduced quality and declassification of the fillets. In contrast to other histopathological lesions of HSMI, the focal melanized changes are only found in the skeletal muscle, and not in the heart. The histological appearance is different from HSMI and characterized as a chronic granulomatous inflammatory reaction. The melanized focal changes appear to increase in number and severity with time after transfer of the fish from fresh to sea water (10). The chronicity of the condition indicates that it is not linked to an acute PRV-1 infection, but possibly to the persistent infection phase.
PRV belongs to the Reoviridae family and has a ten-segmented, double stranded RNA (dsRNA) genome packed in double layered capsid. The virus initially infects and replicates in erythrocytes, which are considered to be the major target cell population (11, 12), implying that the virus can be found in any visceral organ (8, 13). In the acute phase when there is high viremia, the virus infects cardiomyocytes and several other cell types, while in the persistent phase PRV-1 establishes a productive infection in long lived renal erythroid progenitor cells and in macrophages of Atlantic salmon (13).
The pathogenesis of HSMI is characterized by PRV-1 infection of cardiomyocytes and induction of a classical antiviral immune response that recruits CD8+ cytotoxic T cells (14–18). Activated cytotoxic T cells use granzymes and perforins to kill pathogen infected cells through recognition of antigen presented by major histocompatibility complex I (MHC-I) (19). Histological mapping of activated cytotoxic T cells and MHC-I positive cells and their association with PRV-1 infection could enhance the understanding of virus-specific cytotoxicity in HSMI. A transcriptomic analysis of HSMI affected heart tissue has indicated that CD4+ T helper cells are also present (20).
In the focal melanized changes in white skeletal muscle, PRV-1 is not found in myocytes, but in macrophages and melano-macrophages (21, 22). The macrophage responses associated with PRV-1 infection seem to be central for the pathogenesis of these melanized spots (23), i.e. the PRV-1 infection is associated with the polarization of M1 and M2 macrophage phenotypes in the pathological changes. PRV-1 infected, pro-inflammatory M1 macrophages are found in the early stages of the spot formation, while PRV-1 infected melano-macrophages of the anti-inflammatory M2 phenotype, associated with tissue repair and regeneration, are found late in the spot development (23). M1 polarized macrophages have a role in inactivation of pathogens through release of nitric oxide produced by the inducible nitric oxide synthase enzyme (iNOS2), whereas arginase-2 (Arg2) is considered as a marker for M2 type macrophages in teleost fish species (24, 25).
In the present work we studied if the PRV-1 associated macrophage polarization seen in melanized changes in white skeletal muscle, also occurred in HSMI affected heart and skeletal muscle tissue. We used material from a well characterized experimental PRV-1 challenge (2), focusing on samples collected at the time of peak virus load and at the time of maximum histopathological changes. The samples were analyzed by multiplex fluorescent in situ hybridization (FISH) assays in combination with gene expression by RT-qPCR. In addition, the cellular immune response was mapped by targeting MHC-I, IL-17A and CD8 positive cells.
Samples from a previously published PRV-1 challenge experiment were used in the present study (2). In the previous study Atlantic salmon smolts had been injected with purified PRV-1 particles (2.3x10⁶ copies/fish). The PRV-1 level had been monitored by RT-qPCR in each individual fish, as described earlier (2). The fish reached peak viral load 4 weeks post challenge (wpc) and had histopathological lesions consistent with HSMI at 6 wpc. Tissue samples from heart (n = 6) and skeletal muscle (n = 6) from 4 wpc and at 6 wpc were selected for gene expression analysis. Non-infected fish at 4 wpc (n = 3) and 6 wpc (n = 3) were included as negative controls. Heart and skeletal muscle tissue samples from fish (n=1) with peak viral load from 4 wpc (cardiac score of 0.1, scale 0-3) and 6 wpc representing peak histopathological score (cardiac score of 2.6, scale 0-3) were selected for fluorescent in situ hybridization analysis to compare macrophage polarization both at peak of infection and peak of histopathological lesions. Tissue from a non-infected fish of the control group was used as negative control.
Total RNA had been extracted from the heart and skeletal muscle tissues (n = 6) as previously described (2). For the present study, cDNA was synthesized from 1 µg total RNA from each tissue by using Quantitect Reverse Transcription Kit (Qiagen). Manufacturer’s guidelines were followed for the elimination of genomic DNA. Wipeout buffer (7x) was added and incubated at 42°C for 30 min with RT master-mix that includes reverse transcriptase enzyme and RNase inhibitor. A 12 µl reaction volume (15 ng cDNA input) was used for quantitative PCR using Maxima SYBR Green/ROX qPCR Master Mix (2x)-K0253 (Thermo Fisher Scientific). Thermal cycling conditions were set with initial denaturation for 10 min/95°C and 40 cycles of amplification with 15 sec/95°C, 30 sec/60°C and 30 sec/72°C. The PRV-1 load had been examined in the previous study (2). Melting curve analysis were performed to determine assay specificity. No template control (NTC) was run as a negative control on each plate. Elongation factor (EF1α) was run as a reference gene (26). Cut off value was set at Ct 35 (11). Relative fold change was measured for the genes of interest against the reference gene (EF1α) and the non-infected group (control) (Table S1). Specific primers targeting different genes were used for their amplification (Table 1).
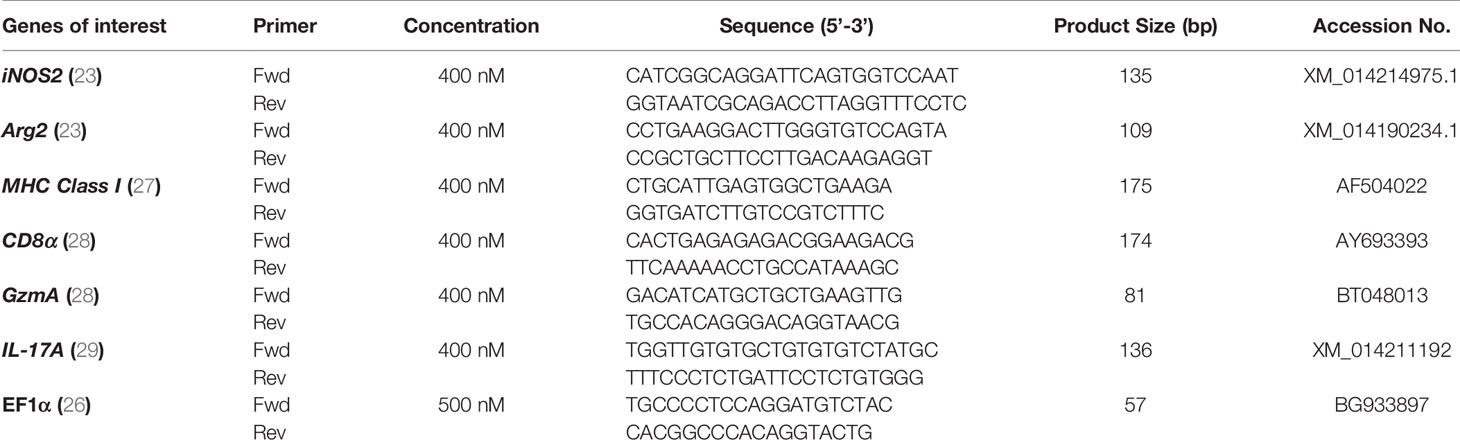
Table 1 List of primers used in quantitative PCR analysis.
Relative fold change (2- ΔΔCt formula) in gene expression level was compared between control and infected groups of fish. Nonparametric Mann-Whitney test was applied due to a low sample size in each group. GraphPad Prism version 9.0 (GraphPad Software Inc., La Jolla, CA, USA) was used for data analysis and graph layouts. A p-value ≤ 0.05 was considered as significantly different from the control.
Histopathological examination of heart and skeletal muscle tissues was performed to ensure that the selection criteria mentioned above were followed (2). Imaging was performed using a bright field microscope system (Carl Zeiss Light Microscopy System with Axio Imager 2 - Carl Zeiss AG, Oberkochen, Germany).
Formalin fixed, paraffin embedded (FFPE) tissue sections (5 µm thickness) from heart and skeletal muscle tissues selected from fish with HSMI, were mounted using Superfrost plus (Thermo Fisher Scientific) slides. Sections were baked at 60°C for 2 hrs in HybEZ™ II oven (Advanced Cell Diagnostics, catalog #321720) prior to deparaffinization with absolute ethanol (100%) and fresh xylene. Initial blocking was done with hydrogen peroxide (Advanced Cell Diagnostics) for 10 min at room temperature (RT). RNAscope antigen retrieval reagent (Advanced Cell Diagnostics, catalog #322000) was used for 15 min at 99°C and slides were further incubated with RNAscope protease plus reagent for 15 min at 40°C in the HybEZ™ II oven following manufacturer guidelines. Immedge hydrophobic barrier pen (Vector Laboratories, Burlingame, CA) was used to make hydrophobic barrier around tissue areas over slides for further probe hybridization procedures.
Simultaneous detection multiple RNA targets were performed using RNAscope® Multiplex fluorescent V2 assay kit (Advanced Cell Diagnostics catalog #323100). Individual specific RNAscope probes (Listed in Table 2) were designed against PRV-1 L3 segment (Advanced Cell Diagnostics catalog #537451); iNOS2 (Advanced Cell Diagnostics catalog #548391); Arg2 (Advanced Cell Diagnostics catalog #548381) CD8α (Advanced Cell Diagnostics catalog #836821); Granzyme A (Advanced Cell Diagnostics catalog #836841); MHC-I (Advanced Cell Diagnostics catalog #836831) and IL-17A (Advanced Cell Diagnostics catalog #836861). Peptidylpropyl Isomerase B- (PPIB) (Advanced Cell Diagnostics, catalog #494421) was taken as a positive control for RNA integrity of the samples and dihydrodipicolinate reductase (DapB) from Bacillus subtilis (Advanced Cell Diagnostics catalog #310043) was taken as a negative control for cross-reactivity and background.
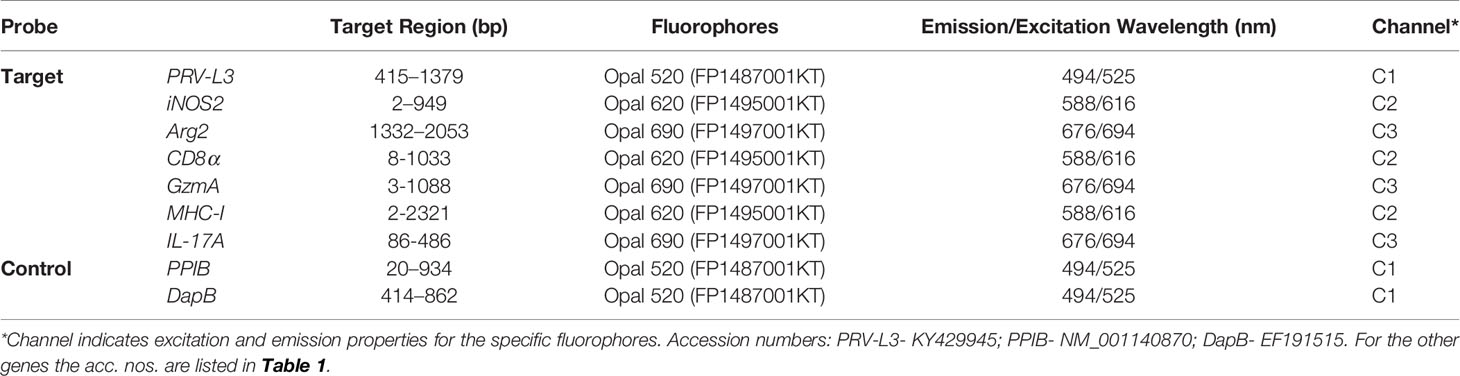
Table 2 Probes used in FISH assays.
As per manufacturer’s instructions, all probes were mixed and hybridized to each section for 2 hrs at 40°C in the HybEZ™ II oven. Signal amplification was done by applying series of amplifier reagents (Amp1-Amp3) included in the kit. A 1:1500 diluted Opal fluorophores (Akoya Biosciences, CA, United States) in tyramide signal amplification (TSA) buffer (Advanced Cell Diagnostics catalog #322809) were assigned separately to each probe with different excitation and emission spectrum to produce a specific output signal. RNAscope® multiplex Fluorescent Detection Reagents v2 (catalog #323110) were used to develop and block each probe sequentially. DAPI (fluorescent DNA stain) was used as a counter stain for 30 sec at RT. About 1-2 drops of Prolong Gold antifade mounting reagent (Thermo Fisher Scientific) were used to mount cover slides. Confocal microscopy was performed using TCS SP8 gSTED confocal microscope (Leica microsystems GmbH, Mannheim, Germany).
Heart and skeletal muscle tissues from an experimental PRV-1 challenge were used. Samples were selected from the key time points i.e. peak virus load (4wpc), and maximum histopathological changes (6 wpc) (Figure S1).
In the heart, a few iNOS2 positive cells (assumed M1 macrophages) were spotted in the spongiosum layer both at the peak in viremia (Figure S2) and at the peak in HSMI pathology (Figure 1A) and were localized particularly in aggregations of blood cells. iNOS2 stained cells were not found in the epicardial and compactum layers (Figure S2). Several of the iNOS2 positive macrophages also stained for PRV-1 (Figure 1B). Numerous Arg2 specific cells (assumed M2 type macrophages) were detected in heart at both time points (Figures 1C, S2), but with a more abundant appearance at 6 wpc. There was no staining of PRV-1 in Arg2 positive M2 macrophages (Figures 1D, S2). Heart tissue from both time points had a lower number of M1 polarized macrophages compared to M2 polarized macrophages, as estimated through FISH (Figures 1, S2). PRV-1 infected cells were widely scattered in the layers of epicardium, compactum and spongiosum in infected fish at both sampling points (Figures 1F, S2). The FISH results were in accordance with the transcript expression levels observed by RT-qPCR where the iNOS2 expression was low, while the Arg2 expression was upregulated (approximately 11 folds, p< 0.01) in heart tissue at 6 wpc (Figure 1G).
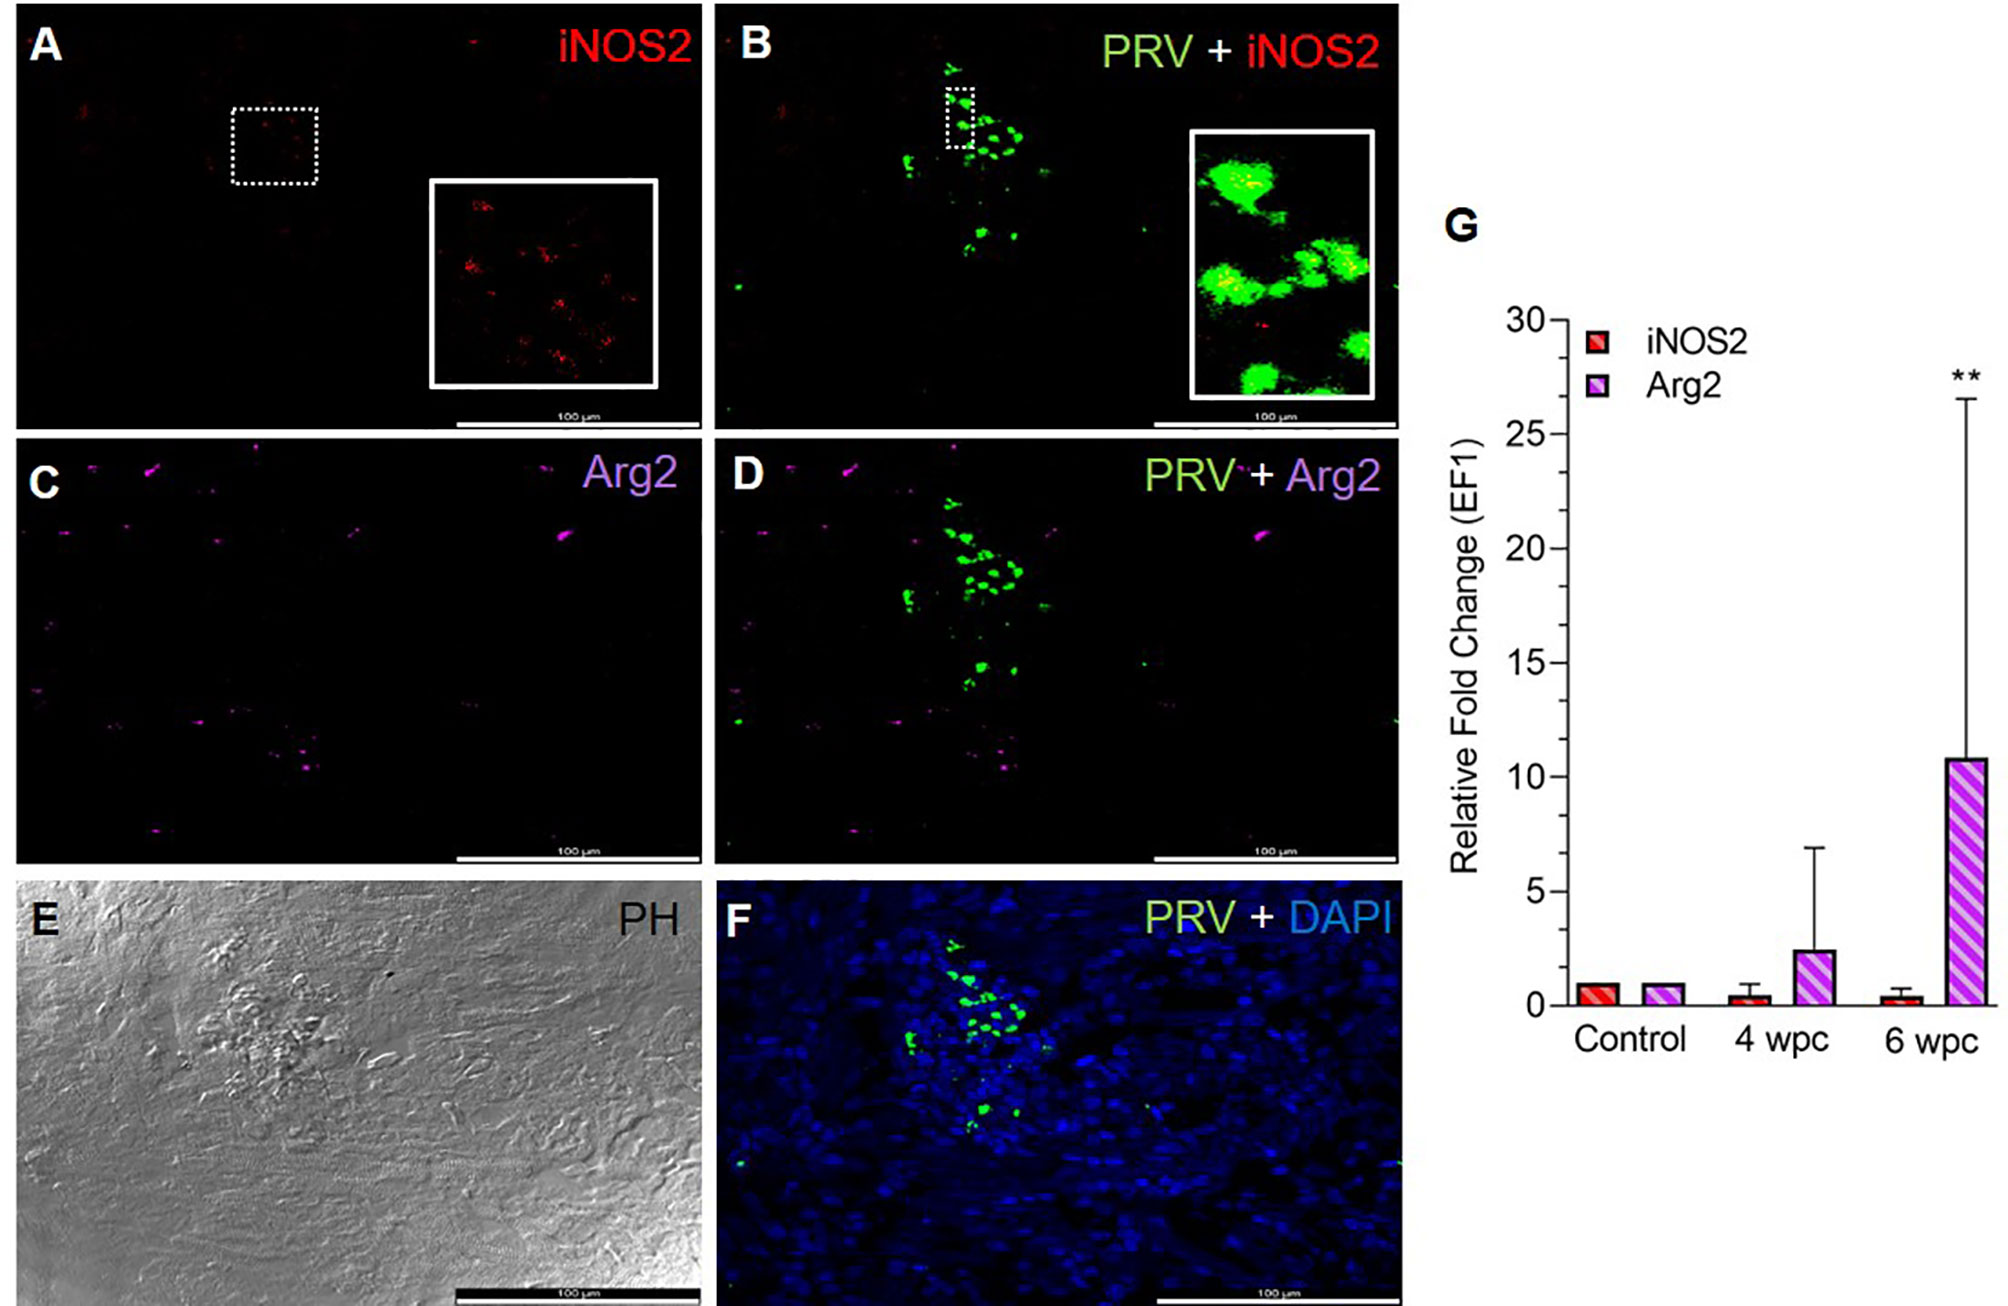
Figure 1 Fluorescent in situ hybridization (FISH) of iNOS2, Arg2 and PRV-1 (A–F) in heart tissue at the peak of HSMI (6 wpc). (A) A limited number of iNOS2 (red) positive M1 macrophages were detected. (B) Merged image showing modest co-localization of PRV-1 and iNOS2 (inset). (C) Widely distributed Arg2 (purple) positive M2 macrophages. (D) Merged image does not show co-localization of PRV-1 and Arg2-positive M2 macrophages. (E) Phase contrast image showing aggregated blood cells in the stratum spongiosum layer. (F) PRV-1 (green) infected cells amongst clustered blood cells. Cellular nuclei stained with DAPI (blue) (Scale Bar = 100 µm). (G) Relative fold change expression (medians) of iNOS2 and Arg2 at 4 wpc and 6 wpc normalized against EF1α expression. (*) shows significant difference from the control (**p < 0.01).
In skeletal muscle tissue at 4 wpc, dispersed M1 and M2 macrophage populations were observed (Figure S3). At 6 wpc there were few iNOS2 positive M1 macrophages detected around infected blood cells (Figure 2A), but the majority of the M1 macrophages were negative for PRV-1 (Figure 2B). A similar pattern was observed for Arg2 specific staining, with no co-localization of PRV-1 and Arg2 (Figures 2C, D). Only modest staining of PRV infected cells were seen in skeletal muscle (Figure 2F). There was a low level of iNOS2 expression, however, the Arg2 level was upregulated at 4 wpc (approximately 8 folds) but significantly upregulated at 6 wpc (6 folds, p<0.01) (Figure 2G).
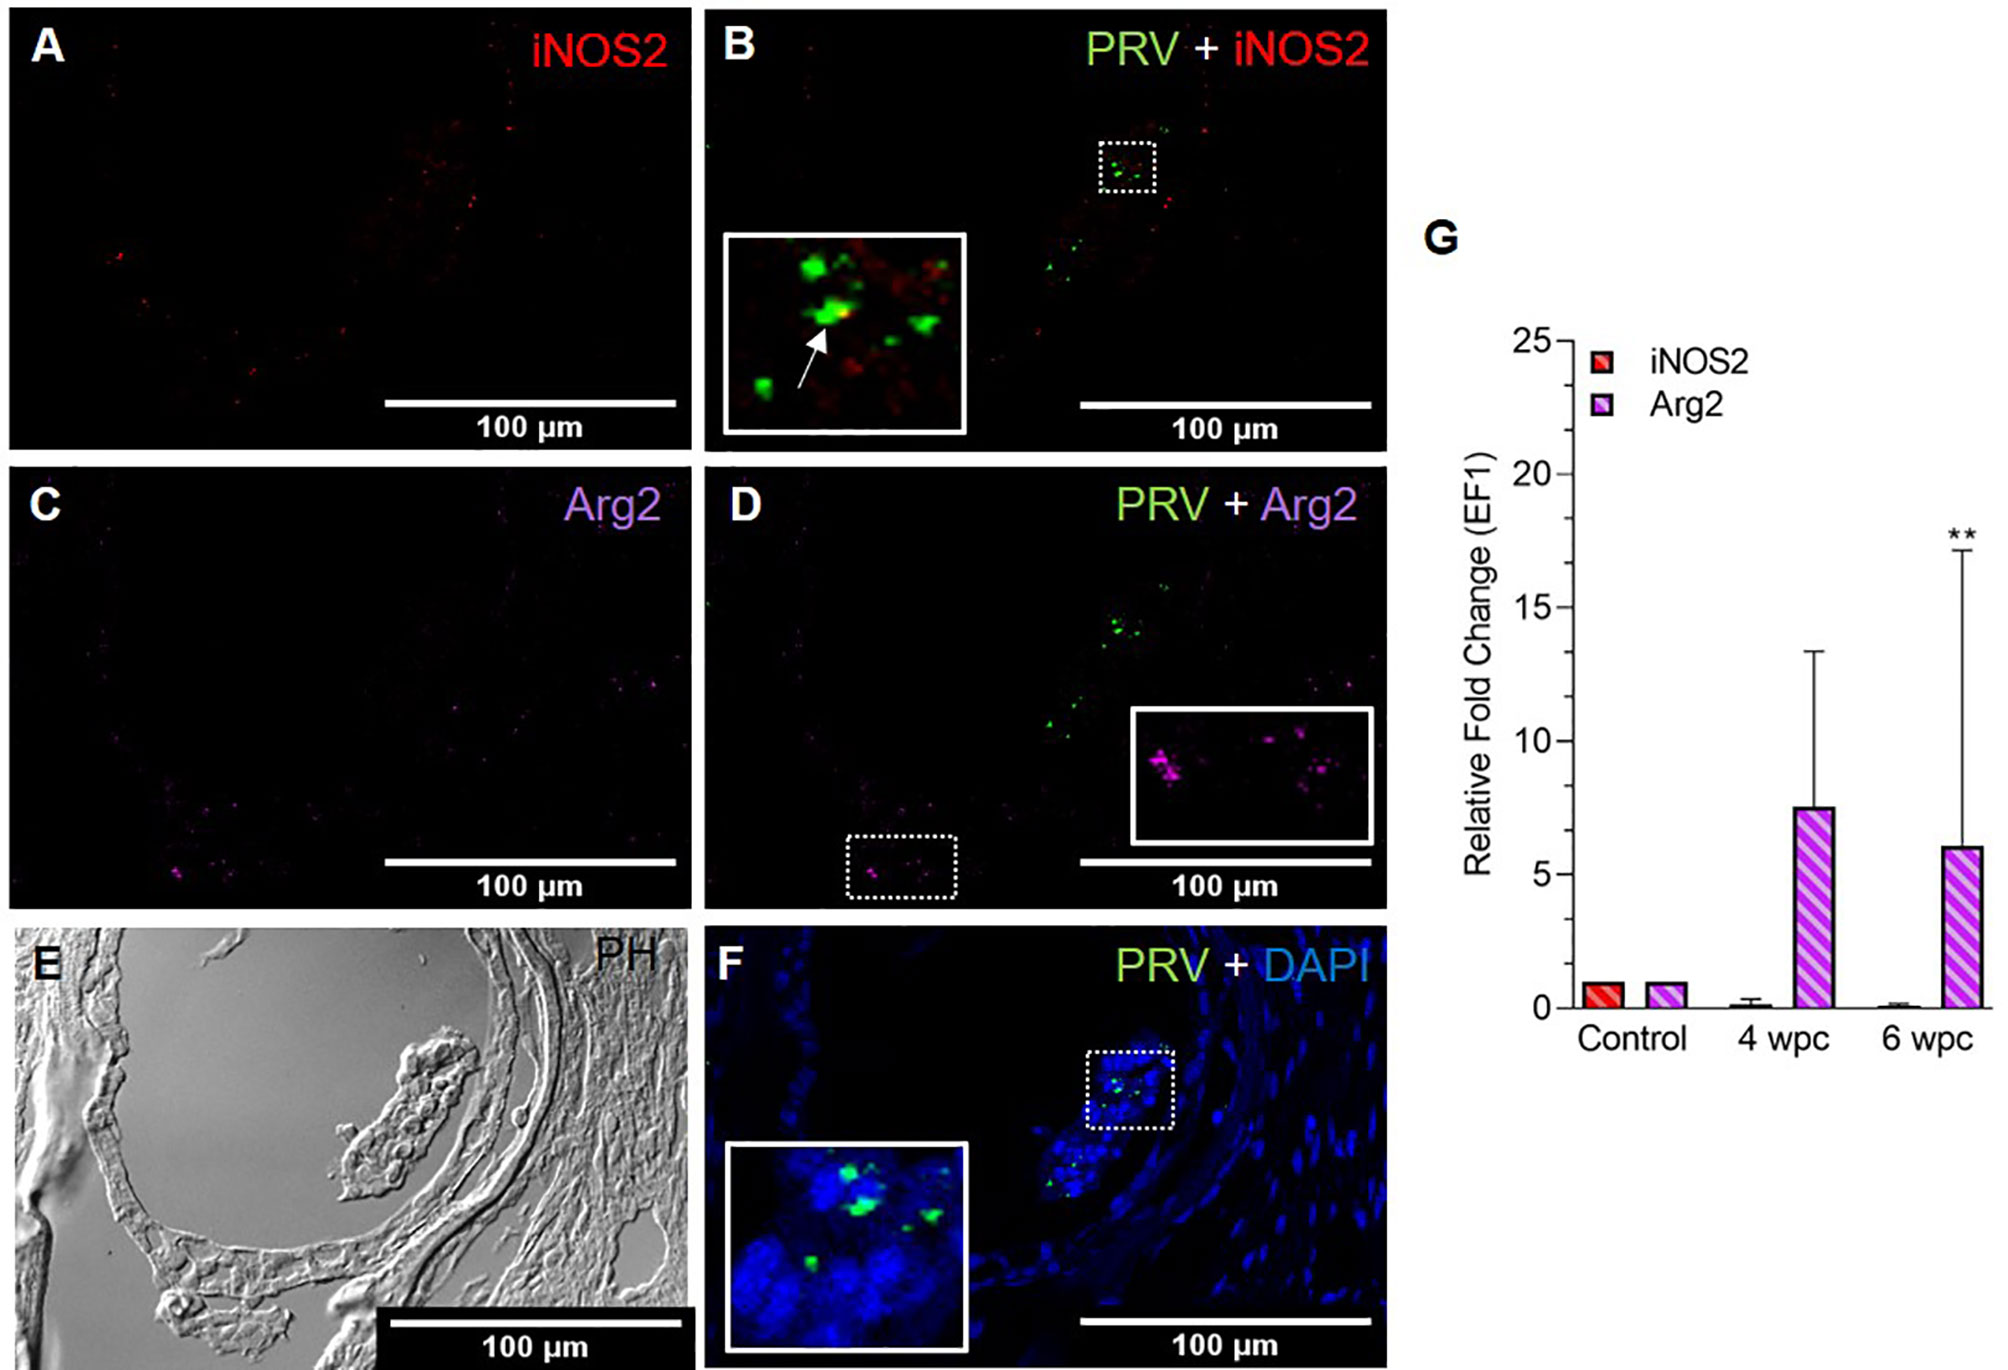
Figure 2 Fluorescent in situ hybridization (FISH) of iNOS2, Arg2 and PRV-1 (A–F) in skeletal muscle at the peak of HSMI (6 wpc). (A) Few iNOS2 (red) positive M1 macrophages were detected. (B) Merged image showing co-localization (yellow in inset) of PRV-1 and iNOS2-positive M1 macrophages. (C) Sporadic presence of Arg2 (purple) positive M2 macrophages (D) Merged image does not show co-localization of PRV-1 and Arg2 (E) Phase contrast image showing aggregated blood cells in a vessel in the center. (F) A limited number of PRV-1 infected cells (green) were found (Scale Bar = 100 µm). (G) Relative fold change expression (medians) of iNOS2 and Arg2 at 4 wpc and 6 wpc normalized against EF1α. (*) show significant difference from the control (**p < 0.01).
In non-infected control fish, Arg2 positive M2 macrophages were present in heart tissue but not found in skeletal muscle (Figures S4, S5). No iNOS2 positive M1 macrophages were seen in neither heart nor skeletal muscle of these fish.
A strong influx of CD8+ cells was noted at 6 wpc (Figure 3) whereas low to moderate level of CD8+ cells in the heart were detected at 4 wpc (Figure S6). CD8+ cells were abundant in the stratum spongiosum compared to epicardium and compactum layer. At 4 wpc, CD8+ cells localized around PRV-1 infected cardiomyocytes. No co-localization of PRV-1 and CD8 were seen in the same cells, but PRV-1 infected cardiomyocytes co-localized with CD8+ cells was a typical feature. CD8+ cells were found widely distributed in the different heart regions at 6 wpc but were particularly abundant in areas with dense PRV-1 staining and co-localized with PRV-1 infected cells (Figure 3C). CD8α gene expression showed a minor increase at 4 wpc (1.2-fold) but was significantly increased at 6 wpc (67-fold, p < 0.01) (Figure 3D). Upregulation of CD8α in heart at 6 wpc correlated in time with a moderate decline in PRV-1 RNA levels (Figures 3D, S7).
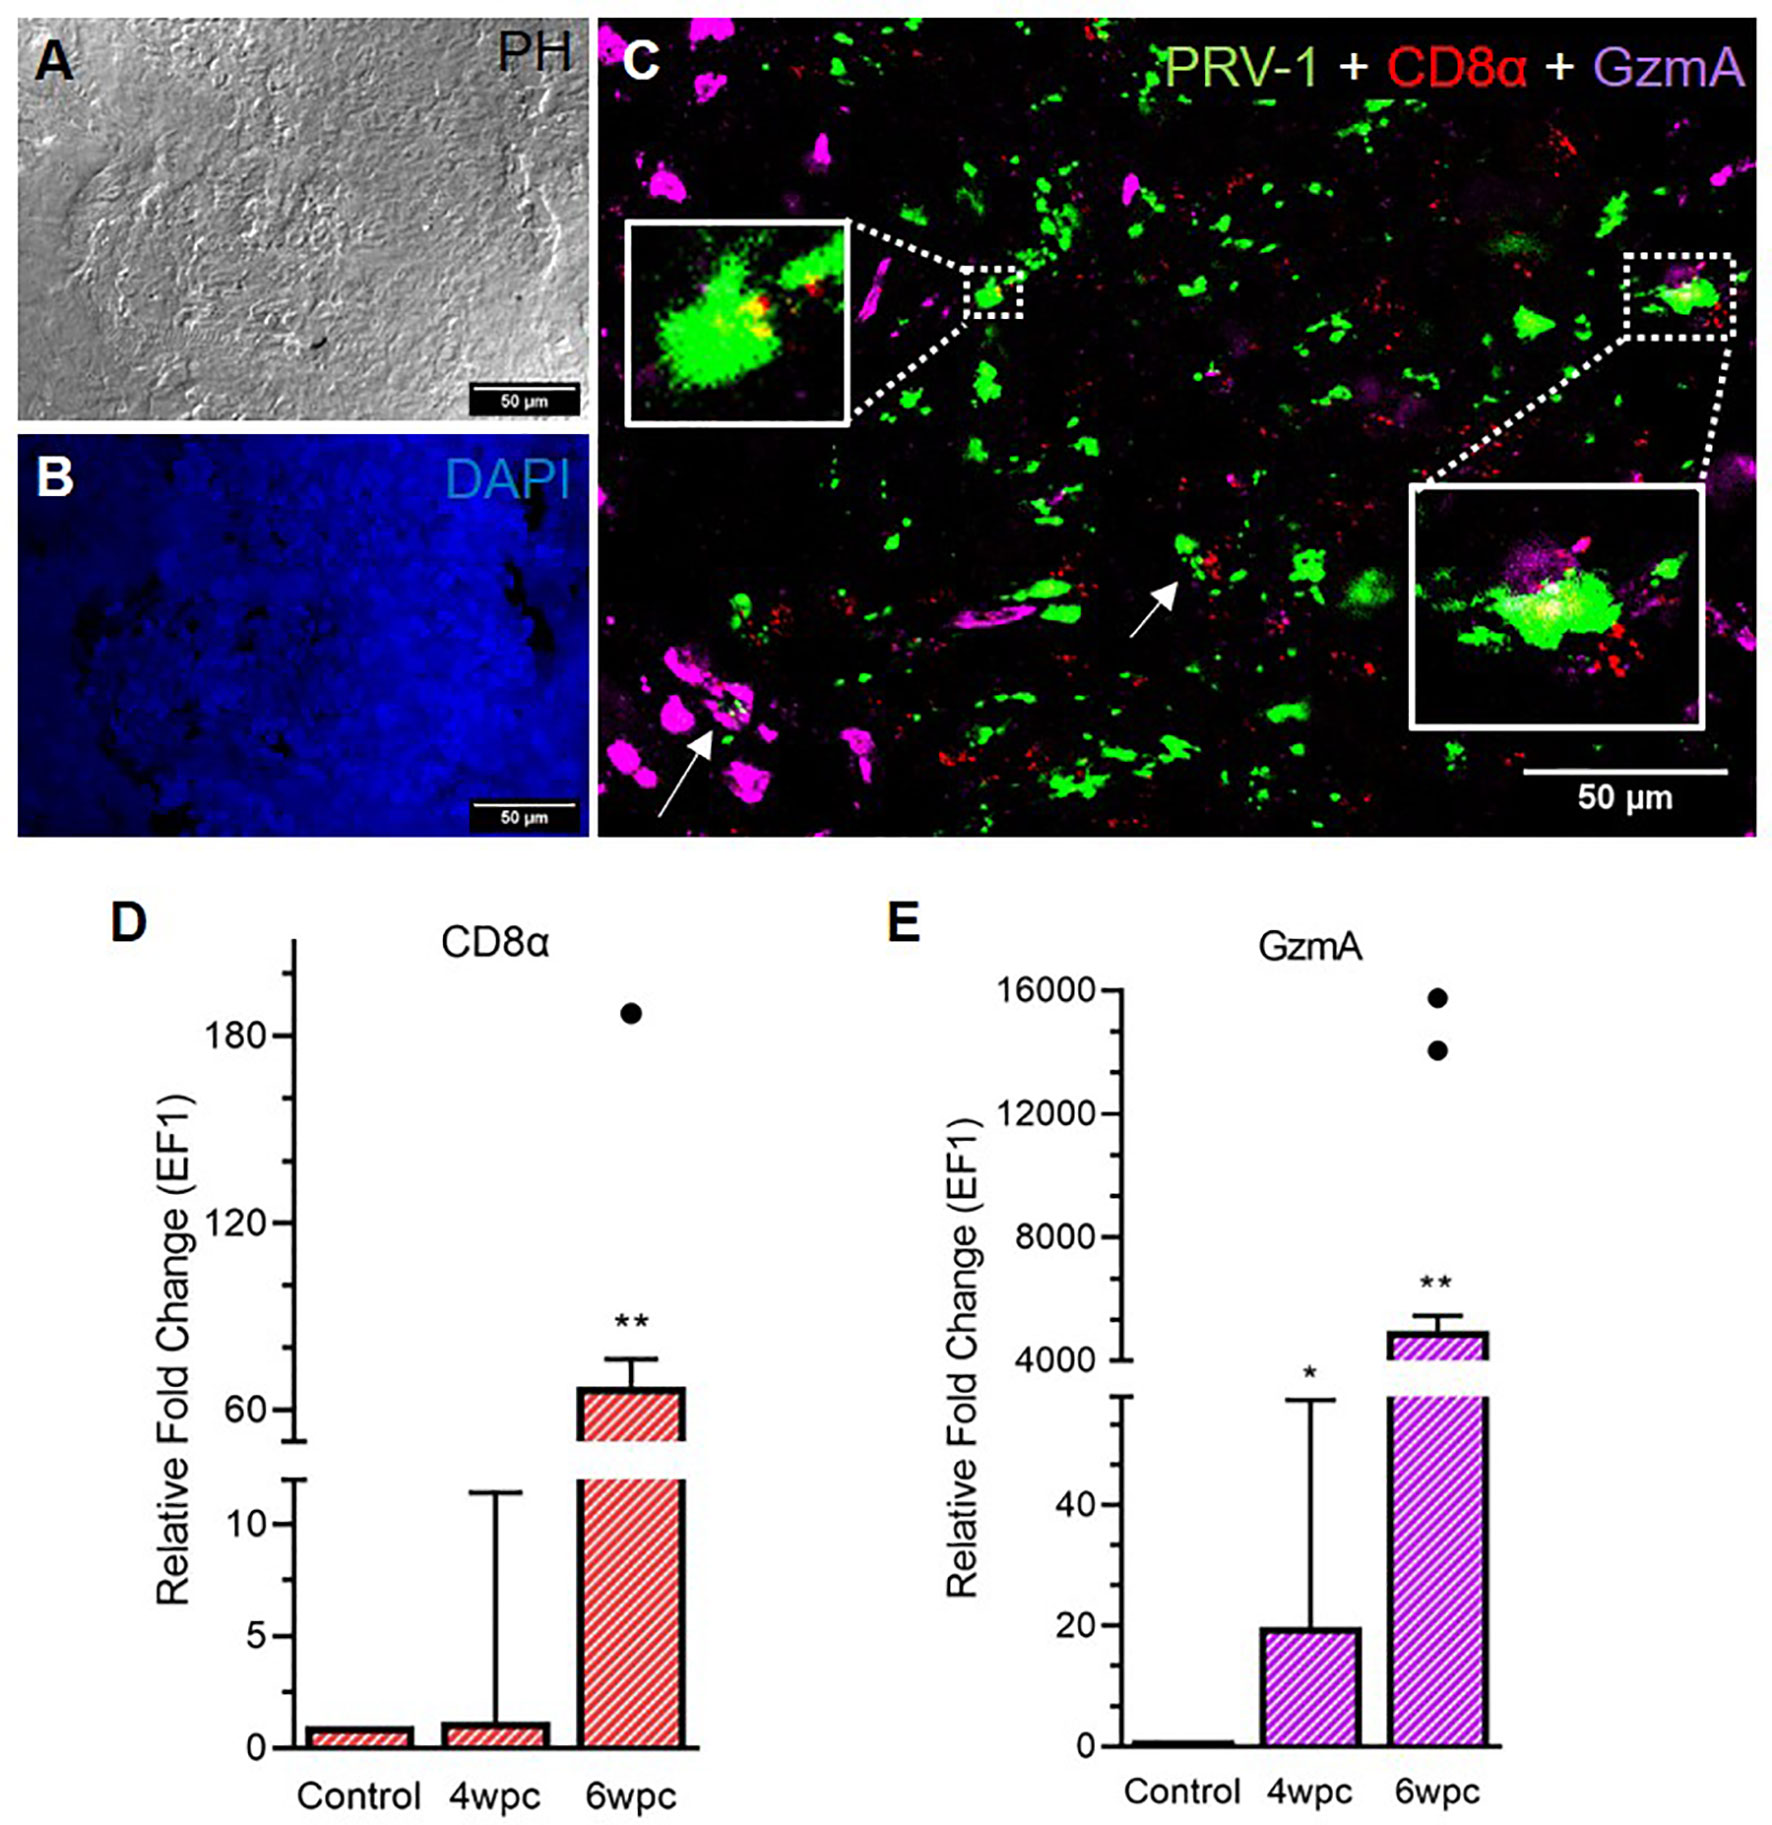
Figure 3 Fluorescent in situ hybridization (FISH) of PRV-1, CD8α and GzmA in heart tissue at peak of HSMI associated histopathological changes (6 wpc). (A) Phase contrast image showing blood cells in the spongiosum. (B) Nuclei stained with DAPI (Blue). (C) Merged image showing co-localization of PRV-1 (green) with CD8+ (red) cells and cells expressing GzmA (purple) (arrows, yellow in inserts). GzmA stained cells were prominent in areas with dense PRV-1 staining (Scale Bar = 50 µm). (D, E) Relative fold change expression (medians) of CD8α and GzmA at 4 wpc and 6 wpc normalized against EF1α. Dots show outlier values in the respective group of fish. (*) shows significant difference from the control (*p < 0.05, **p < 0.01).
Granzyme A (GzmA) positive cells were prominent in heart tissue in areas with dense PRV-1 staining (Figure 3C). GzmA transcripts were highly increased at 6 wpc (approximately 5000 folds, p < 0.01), indicating increased cytotoxic activity (Figure 3E).
In the skeletal muscle tissue, the number of CD8+ cells was almost negligible at 4 wpc (Figure S8) and cells were sporadically present at 6 wpc (Figure 4). No co-localization of PRV-1 infected cells and CD8+ cells was detected (Figure 4C). Expression analysis showed a significant downregulation of CD8α expression level at 4 wpc (p < 0.05) but a slightly upregulated expression level at 6 wpc (3-fold, not statistically significant) (Figure 4D). GzmA positive cells were sporadically present in skeletal muscle at 6 wpc, but no co-localization with PRV-1 was seen (Figure 4C). Gene expression of GzmA showed significant upregulation at 6 wpc (15-fold, p < 0.01) (Figure 4E).
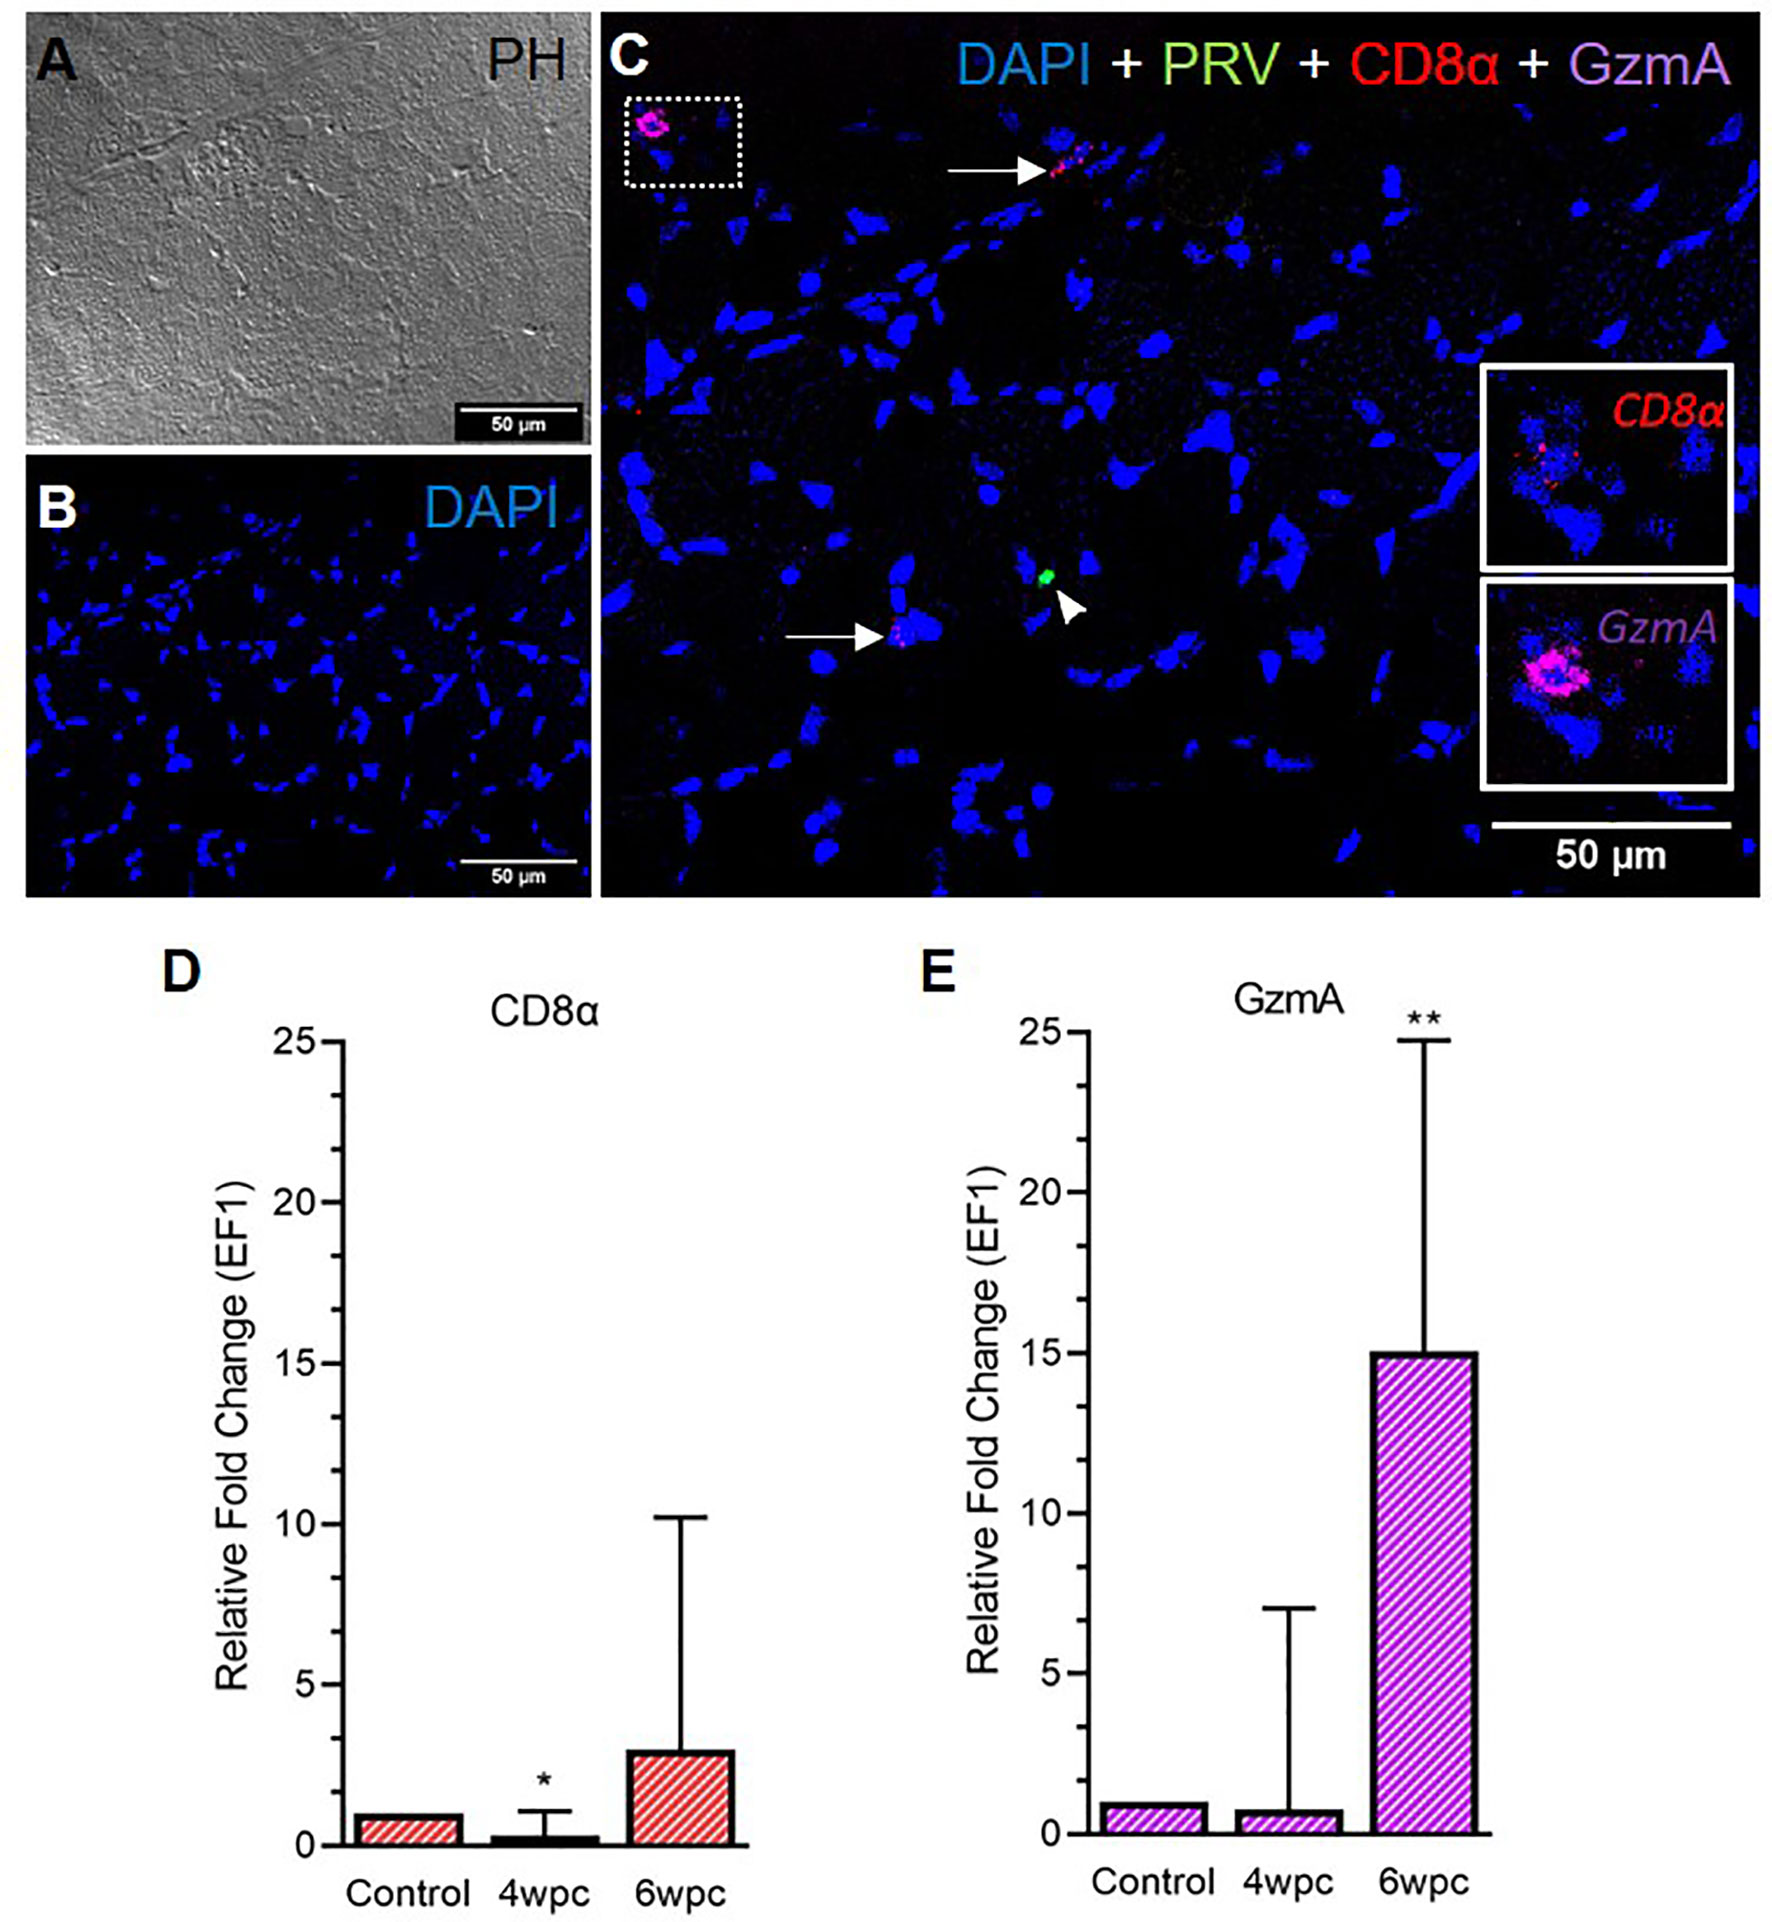
Figure 4 Fluorescent in situ hybridization (FISH) of CD8α, GzmA and PRV-1 in skeletal muscle at the peak of HSMI (6 wpc). (A) Phase contrast image showing structures of myocytes. (B) Nuclei stained with DAPI (Blue). (C) Merged image showing presence of PRV-1 (green) infected cell (arrowhead), and CD8+ cells (insets). Some cells were stained positive only for CD8α and GzmA specific transcripts (arrows) (Scale Bar = 50µm). (D, E) Relative fold expression (medians) of CD8α and GzmA at 4 wpc and 6 wpc normalized against EF1α. (*) shows significant difference from the control (*p < 0.05, **p < 0.01).
In heart, modest co-staining of PRV-1 and MHC-I in the same cells was observed throughout the tissue at both peak of infection (Figure S9) and maximum HSMI pathology (Figure 5). Within aggregated blood cells, PRV-1 partially co-localized with MHC-I in the same cells both at 4 wpc (Figure S9) and 6 wpc (Figure 5B). However, some MHC-I expressing cells in the aggregated blood did not stain for PRV-1. Significant upregulation of MHC-I was detected at both 4 wpc (72-fold, p<0.01) and 6 wpc (93-fold, p<0.01), compared to control.
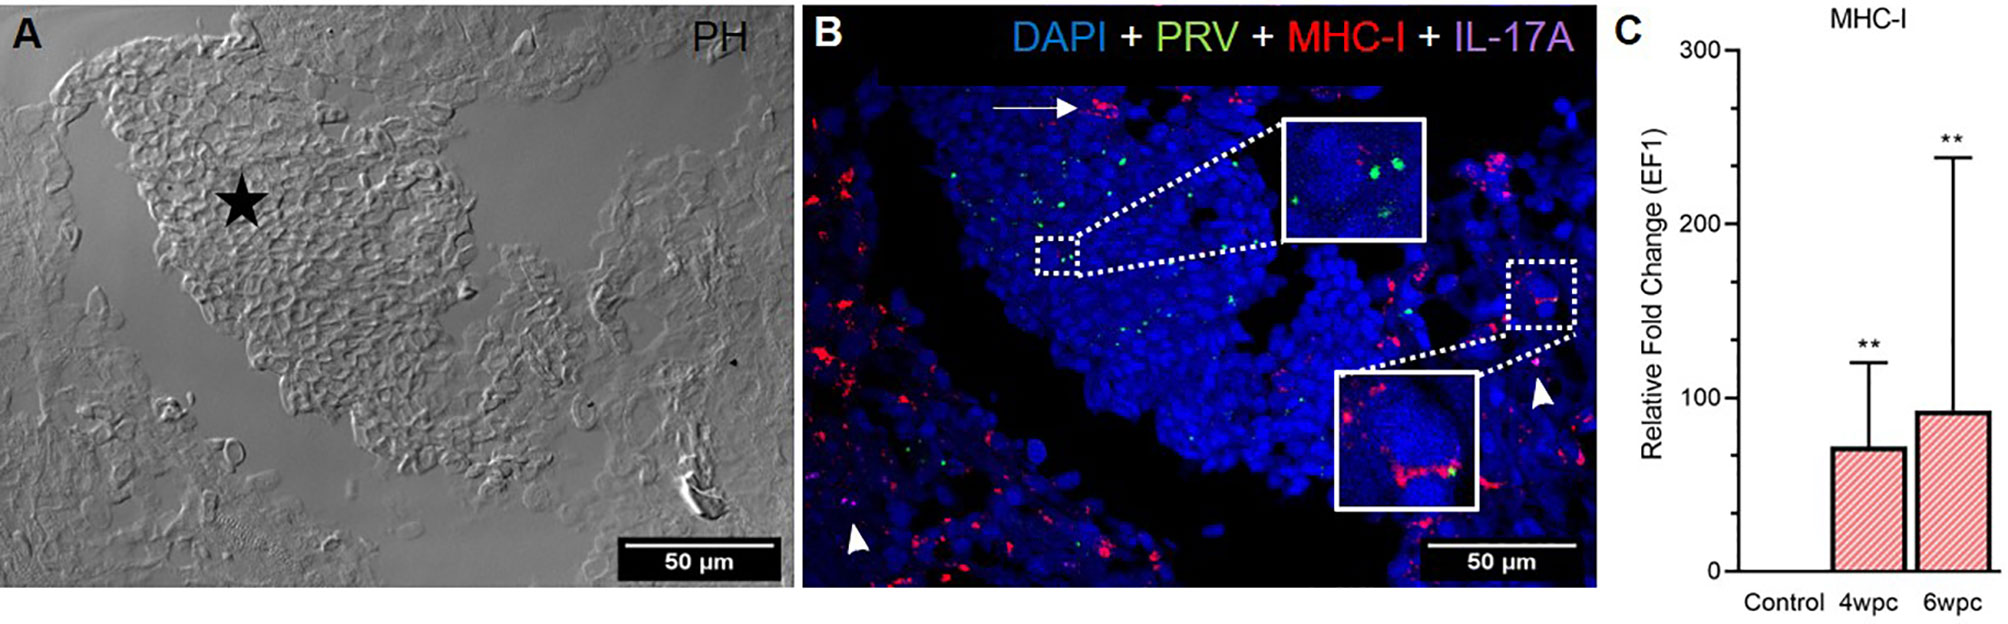
Figure 5 Fluorescent in situ hybridization (FISH) of PRV-1, MHC-I and IL-17A in heart tissue at peak of HSMI (6 wpc). (A) Phase contrast image showing an area with aggregated blood cells (star) in the spongiosum layer. (B) Merged image showing presence of PRV-1 (green) in cardiomyocytes and clotted blood cells, partially co-localizing with MHC-I (red) positive cells (insets). Some MHC-I positive cells in the aggregated blood did not co-stain for PRV-1 (arrow). IL-17A (purple) positive cells were sporadically scattered in the tissue (arrowhead). Nuclei stained with DAPI (Blue) (Scale Bar = 50 µm). (C) Relative fold change expression (medians) of MHC-I at 4 wpc and 6 wpc normalized against EF1α. Asterisk (*) shows significantly difference from the control (**p < 0.01).
The Th17 T-helper cells of Atlantic salmon produce the proinflammatory cytokine IL-17A (29–32). In heart, specific staining showed the presence of a few IL-17A-positive cells at both samplings, however, no pattern of co-localization with PRV-1 was observed (Figure 5B), and gene expression analysis showed a slight downregulation (not statistically significant) of IL-17A in heart after PRV-1 infection (Figure S10).
In skeletal muscle tissue MHC-I positive cells were dispersed between myocytes at 4 wpc (Figure S11) and 6 wpc (Figures 6A, B). A few PRV-1 positive cells were also present, but none of these cells were also positive for MHC-I. Expression analysis showed significant upregulation of MHC-I at 6 wpc (27-fold, p<0.01) (Figure 6C) which correlated with a drop in the PRV-1 level. In contrast to the heart tissue, no IL-17A specific transcripts could be detected in the skeletal muscle by FISH and RT-qPCR.
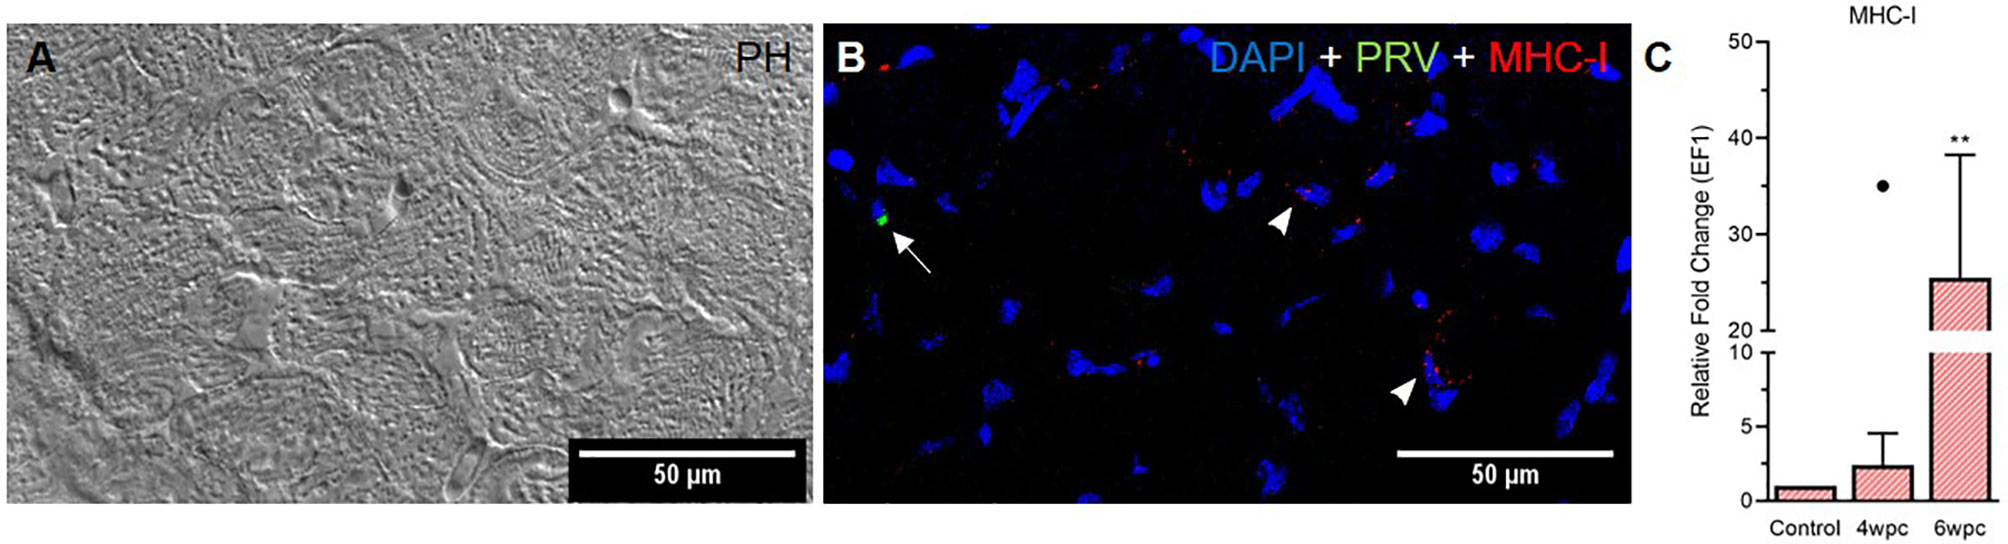
Figure 6 Fluorescent in situ hybridization (FISH) of PRV-1 and MHC-I in skeletal muscle at peak of HSMI associated histopathological changes (6 wpc). (A) Phase contrast image showing myocyte structure (B) Merged image showing MHC-I (red) positive cells (arrowheads) and PRV-1 (green) infected cells (arrow). Nuclei stained with DAPI (Blue) (Scale Bar = 50 µm). (C) Relative fold change expression (medians) of MHC-I at 4 wpc and 6 wpc normalized against EF1α. Dot sign shows outlier value from the respective fish group. (*) shows significantly difference from the control (**p < 0.01).
The aim of this study was to map the cellular immune responses in heart and skeletal muscle tissues from PRV-1 infected fish developing HSMI, by using FISH, targeting iNOS2 and Arg2 for M1 and M2 polarized macrophages respectively, with additional detection of MHC-I, IL-17A, CD8, and GzmA. The focus was set on the peak in virus load (4 wpc) and the maximal histopathological changes in the heart (6 wpc), using material from a previously performed PRV-1 experimental challenge. In accordance with the relative limited pathological changes of the skeletal muscle, the findings were in general more pronounced in heart, however the findings in the two organs were in accordance with each other.
We found that the Arg2-positive, tissue repair associated M2 type macrophages were the dominant type of macrophages in heart tissue both at 4 wpc and at 6 wpc. On the other hand, HSMI affected heart tissue showed a low presence of the classically activated M1 macrophage phenotype, based on iNOS2 staining. These results were corroborated by mRNA expression analyses by RT-qPCR. We did not observe presence of PRV-1 in M2 macrophages, and only a limited number of the M1 macrophages stained for PRV-1.
Contrasting these findings is the dominance of PRV-1 infected, pro-inflammatory M1 polarized macrophages reported from the early stages of melanized focal changes in skeletal muscle of Atlantic salmon (23). In the later stages of the melanized focal changes the anti-inflammatory M2 phenotype dominates, but still many of these M2 cells are PRV-1 infected (23). In the present study, tissue repair associated M2 macrophages were frequent in heart tissue both at 4 wpc and 6 wpc. At 4 wpc the histopathological changes had not yet developed in the heart, and FISH of hearts from naive fish showed that they also harbored M2 positive cells. That heart tissues harbor a large number of Arg2-positive M2 macrophage-like cells is in line with previous findings (13), and indicate the potential of the heart for healing via macrophage mediated repair mechanism (33). The presence of self-renewing tissue macrophages, seeded during embryonic hematopoiesis, makes the repair of heart tissue in fish a well-organized process (34). The macrophage M1 and M2 polarization is a dynamic process (35), and in line with this the pro-inflammatory M1 phenotype dominates early in the pathogenesis of melanized focal changes in skeletal muscle while the M2 phenotype dominates in the late stages (23). Both macrophage phenotypes can be infected by PRV-1 (23). The M1 macrophages with their high production of iNOS2 enzyme are inducers of melanin production (36), and in HSMI hearts there are only sporadic tiny patches of melanin present. The M2 macrophages found in heart did not stain for PRV-1 RNA, i.e. there was no indication of PRV-1 infection of this cell type in HSMI. Together this indicate a lack of a prominent role of M1 and M2 macrophages in development of HSMI. It can be speculated whether the differences in HSMI pathogenesis and development of melanized spots are caused by properties of the virus strain, i.e. different strains of orthoreoviruses have been shown to vary in their ability to productively infect macrophages (37). The difference in HSMI pathogenesis and development of melanized spots could also be associated to variance in resident and recruited macrophage populations in heart tissue and white skeletal muscle or related to acute versus persistent infection.
The co-localization of PRV-1 infected cells with CD8+ cells, and the co-staining of PRV-1 and MHC-I in the same cells enhances the understanding of the pathogenesis of HSMI. Gene expression analysis supported the in situ expression of CD8+ cell marker, and highly upregulated CD8α expression was detected in heart, in line with earlier studies (17). Specific targeting of the PRV-1 infected cells by cells producing GzmA was indicated by the co-localization with PRV-1 infected cells. GzmA specific transcripts are primarily produced by CD8+ T-cells, but can also be detected in natural killer cells (38). In contrast to heart, skeletal muscle tissue exhibited moderate recruitment of CD8+ cells and these did also not co-localize with PRV-1 infected cells.
Atlantic salmon erythrocytes show high expression of MHC-I after PRV-infection (14). MHC-I expressing cells also positive for PRV-1 were abundant and found associated with high numbers of GzmA positive cells. This finding suggests that antigen presentation to cytotoxic T cells is important for the elimination of PRV-1 from the heart. The high number of M2 macrophages indicates a potential of the heart tissue for rapid recovery. The PRV-1 level correlated inversely with high CD8+ cell activity and MHC-I expression in heart.
The combination of FISH and RT-qPCR analysis confirmed that a strong CD8+ mediated immune response is important in the pathogenesis of HSMI, and demonstrated the co-localization of PRV-1 infected, MHC-I positive cells with CD8 and Granzyme A-positive cells in heart. The results did not indicate a prominent role of M1 polarized macrophages in the initial development of HSMI in Atlantic salmon however, the large population of M2 polarized macrophages resident in heart tissue indicates a prominent role of these cells in the rapid recovery after HSMI.
The raw data supporting the conclusions of this article will be made available by the authors, without undue reservation.
The animal study was reviewed and approved by Animal Care and Use Committee/IACUC and NARA (permit number 7487) according to the European Union Directive 2010/63/EU and Norwegian regulation FOR-2015-06-18-761.
Conceptualization, MM and ER. Methodology, MM, IN, and ØW. Software, MM. Validation, MM, ØW, and MD. Formal analysis, MM, ØW, MD, and ER. Investigation, MM, ØW, and ER. Resources, ER. Data curation, MM and IN. Writing—original draft preparation, MM and ER. Writing—review and editing, ØW, MM, MD, and ER. Visualization, MM and IN. Supervision, ER, MD, and ØW. Project administration, ER. Funding acquisition, ER. All authors contributed to the article and approved the submitted version.
The study was supported by the Research Council of Norway, grant 280847/E40 (ViVaAct) and by Norwegian University of Life Science.
The authors declare that the research was conducted in the absence of any commercial or financial relationships that could be construed as a potential conflict of interest.
All claims expressed in this article are solely those of the authors and do not necessarily represent those of their affiliated organizations, or those of the publisher, the editors and the reviewers. Any product that may be evaluated in this article, or claim that may be made by its manufacturer, is not guaranteed or endorsed by the publisher.
The Supplementary Material for this article can be found online at: https://www.frontiersin.org/articles/10.3389/fimmu.2021.729017/full#supplementary-material
Supplementary Figure 1 | Histopathological overview of heart (A, B) and skeletal muscle (C, D) tissues at 4 and 6 wpc. (A) Heart section without cardiac lesions at 4 wpc. (B) Severe cardiac lesions at 6 wpc in all three layers of the heart (arrowheads). (C) Intact and conformed myocytes with minor presence of melanin (shown in inset), 4 wpc (D) Overall, mild degeneration with presence of small hemorrhages (shown in inset) with thin melanin deposits (arrowhead), 6 wpc. Scale bar = 50 µm.
Supplementary Figure 2 | Fluorescent in situ hybridization (FISH) of iNOS2, Arg2 and PRV-1 in HSMI (heart) at 4 wpc. (A) Few iNOS2 (red) positive M1 macrophages were detected. (B) Merged image showing co-localization of some PRV-1 in M1 macrophages (insets). (C) Widely distributed Arg2 (purple) positive M2 macrophages. (D) Merged image showing no co-localization of PRV-1 in M2 macrophages. (E) Phase contrast image showing all different layers of the heart i.e. epicardium (white arrow), compactum (black arrowhead) and spongiosum (white arrowhead). (F) PRV-1 (green) infected cells scattered in all different layers of the heart. Nuclei stained with DAPI (blue). Scale Bar = 100 µm.
Supplementary Figure 3 | Fluorescent in situ hybridization (FISH) of iNOS2, Arg2 and PRV-1 in HSMI (skeletal muscle) at 4 wpc. (A) Phase contrast image showing structure of myocytes. (B) Merged image showing PRV-1 infected cells (arrows) surrounded by M1 (arrowheads) and M2 macrophages (dotted circle). No co-localization of PRV-1 was observed in the M1 and M2 stained cells. Scale bar = 100µm.
Supplementary Figure 4 | Skeletal muscle tissue from un-infected control fish collected at a time corresponding to 4 wpc for the PRV-1 challenged fish. (A) No PRV-1 (green) detection, (B) No iNOS2 (red) positive cells (M1) were detected, (C) No Arg2 (purple) positive cells (M2) were detected. (D, E) Nuclei were stained with DAPI (blue) and phase contrast image shows myocytes. Scale bar = 100µm.
Supplementary Figure 5 | Heart tissue from un-infected control fish collected at a time corresponding to 4 wpc for the PRV-1 challenged fish. (A) No PRV-1 (green) detection, (B) No iNOS2 (red) positive cells (M1). (C) Phase contrast image. (D) Cellular nuclei were stained with DAPI (blue). (E, F) Few Arg2 (purple) positive cells in the heart (insets). Scale bar = 100µm.
Supplementary Figure 6 | Fluorescent in situ hybridization (FISH) of PRV-1, CD8α and GzmA in HSMI (Heart) at 4 wpc. (A) Phase contrast image showing structure of epi- (e), compactum (myo- (m)) and spongiosum layer. (B) Merged image showing no-colocalization of PRV-1 (green) but presence of few CD8+ (red) cells at the infected site (inset), whereas granzyme A (purple, arrows) specific transcripts are distributed elsewhere. Scale bar = 100 µm.
Supplementary Figure 7 | RT-qPCR data showing median (line) PRV-1 level (red) in (A) heart and (B) skeletal muscle tissues at peak viral load (4 wpc) and peak pathological changes (6 wpc). Uninfected fish from each timepoint was included as a control fish.
Supplementary Figure 8 | Fluorescent in situ hybridization (FISH) of PRV-1, CD8α and GzmA in HSMI (skeletal muscle) at 4 wpc. (A) Phase contrast image showing myocytes structure. (B) Merged image showing PRV-1 (green) infected cells (inset) and sporadic presence of granzyme A (purple) specific cells (arrows). No CD8+ cells (red) were detected at 4 wpc. Scale bar = 100 µm.
Supplementary Figure 9 | Fluorescent in situ hybridization (FISH) of PRV-1, MHC-I and IL-17A in HSMI (Heart) at 4 wpc. (A) Phase contrast image showing structure of epi- (e), compactum (C) and spongiosum layer. (B) Merged image showing partial co-localization of PRV-1 (green) in MHC-I (red) positive cells. Very few IL-17A (purple) specific transcripts were detected (inset). Scale bar = 100 µm.
Supplementary Figure 10 | Relative fold change expression (medians) of IL-17A at 4 wpc and 6 wpc in the heart tissue normalized against EF1α.
Supplementary Figure 11 | Fluorescent in situ hybridization (FISH) of PRV-1, MHC-I and IL-17A in HSMI (skeletal muscle) at 4 wpc. (A) Phase contrast image showing myocytes structure. (B) Merged image showing PRV-1 (green) infected cells (inset) surrounded by MHC-I (red) cells. Scale bar = 100 µm.
Supplementary Table 1 | Ct values for samples.
1. Polinski MP, Vendramin N, Cuenca A, Garver KA. Piscine Orthoreovirus: Biology and Distribution in Farmed and Wild Fish. J Fish Dis (2020) 43(11):1331–52. doi: 10.1111/jfd.13228
2. Wessel O, Braaen S, Alarcon M, Haatveit H, Roos N, Markussen T, et al. Infection With Purified Piscine Orthoreovirus Demonstrates a Causal Relationship With Heart and Skeletal Muscle Inflammation in Atlantic Salmon. PloS One (2017) 12(8):e0183781. doi: 10.1371/journal.pone.0183781
3. Bjorgen H, Wessel O, Fjelldal PG, Hansen T, Sveier H, Saebo HR, et al. Piscine Orthoreovirus (PRV) in Red and Melanised Foci in White Muscle of Atlantic Salmon (Salmo Salar). Vet Res (2015) 46:89. doi: 10.1186/s13567-015-0244-6
4. Kongtorp R, Kjerstad A, Taksdal T, Guttvik A, Falk K. Heart and Skeletal Muscle Inflammation in Atlantic Salmon, Salmo Salar L.: A New Infectious Disease. J Fish Dis (2004) 27(6):351–8. doi: 10.1111/j.1365-2761.2004.00549.x
5. Svendsen J, Fritsvold C. The Health Situation in Norwegian Aquaculture. In: Chapter 45 Cardiomyopathy Syndrome (CMS) The Norwegian Veterinary Institute Report Series No 1b-2018. Oslo, Norway: The Norwegian Veterinary Institute (2018).
6. Godoy MG, Kibenge MJ, Wang Y, Suarez R, Leiva C, Vallejos F, et al. First Description of Clinical Presentation of Piscine Orthoreovirus (PRV) Infections in Salmonid Aquaculture in Chile and Identification of a Second Genotype (Genotype II) of PRV. Virol J (2016) 13:98. doi: 10.1186/s12985-016-0554-y
7. Ferguson HW, Kongtorp RT, Taksdal T, Graham D, Falk K. An Outbreak of Disease Resembling Heart and Skeletal Muscle Inflammation in Scottish Farmed Salmon, Salmo Salar L., With Observations on Myocardial Regeneration. J Fish Dis (2005) 28(2):119–23. doi: 10.1111/j.1365-2761.2004.00602.x
8. Di Cicco E, Ferguson HW, Schulze AD, Kaukinen KH, Li S, Vanderstichel R, et al. Heart and Skeletal Muscle Inflammation (HSMI) Disease Diagnosed on a British Columbia Salmon Farm Through a Longitudinal Farm Study. PloS One (2017) 12(2):e0171471. doi: 10.1371/journal.pone.0171471
9. Kongtorp R, Taksdal T, Lyngøy A. Pathology of Heart and Skeletal Muscle Inflammation (HSMI) in Farmed Atlantic Salmon Salmo Salar. Dis Aquat Org (2004) 59(3):217–24. doi: 10.3354/dao059217
10. Bjorgen H, Haldorsen R, Oaland O, Kvellestad A, Kannimuthu D, Rimstad E, et al. Melanized Focal Changes in Skeletal Muscle in Farmed Atlantic Salmon After Natural Infection With Piscine Orthoreovirus (PRV). J Fish Dis (2019) 42(6):935–45. doi: 10.1111/jfd.12995
11. Finstad OW, Dahle M, Lindholm T, Nyman I, Løvoll M, Wallace C, et al. Piscine Orthoreovirus (PRV) Infects Atlantic Salmon Erythrocytes. Vet Res (2014) 45(1):13. doi: 10.1186/1297-9716-45-35
12. Wessel Ø, Olsen CM, Rimstad E, Dahle MK. Piscine Orthoreovirus (PRV) Replicates in Atlantic Salmon (Salmo Salar L.) Erythrocytes Ex Vivo. Vet Res (2015) 46:26. doi: 10.1186/s13567-015-0154-7
13. Dhamotharan K, Bjørgen H, Malik MS, Nyman IB, Markussen T, Dahle MK, et al. Dissemination of Piscine Orthoreovirus-1 (PRV-1) in Atlantic Salmon (Salmo Salar) During the Early and Regenerating Phases of Infection. Pathogens (2020) 9(2):143. doi: 10.3390/pathogens9020143
14. Dahle MK, Wessel O, Timmerhaus G, Nyman IB, Jorgensen SM, Rimstad E, et al. Transcriptome Analyses of Atlantic Salmon (Salmo Salar L.) Erythrocytes Infected With Piscine Orthoreovirus (PRV). Fish Shellfish Immunol (2015) 45(2):780–90. doi: 10.1016/j.fsi.2015.05.049
15. Røsæg MV, Lund M, Nyman IB, Markussen T, Aspehaug V, Sindre H, et al. Immunological Interactions Between Piscine Orthoreovirus and Salmonid Alphavirus Infections in Atlantic Salmon. Fish Shellfish Immunol (2017) 64:308–19. doi: 10.1016/j.fsi.2017.03.036
16. Haatveit HM, Wessel Ø, Markussen T, Lund M, Thiede B, Nyman IB, et al. Viral Protein Kinetics of Piscine Orthoreovirus Infection in Atlantic Salmon Blood Cells. Viruses (2017) 9(3):49. doi: 10.3390/v9030049
17. Mikalsen AB, Haugland O, Rode M, Solbakk IT, Evensen O. Atlantic salmon reovirus infection causes a CD8 T cell myocarditis in Atlantic salmon (Salmo salar L.). PloS One (2012) 7(6):e37269. doi: 10.1371/journal.pone.0037269
18. Takizawa F, Dijkstra JM, Kotterba P, Korytář T, Kock H, Köllner B, et al. The Expression of CD8α Discriminates Distinct T Cell Subsets in Teleost Fish. Dev Comp Immunol (2011) 35(7):752–63. doi: 10.1016/j.dci.2011.02.008
19. Nakanishi T, Shibasaki Y, Matsuura Y. T Cells in Fish. Biology (2015) 4(4):640–63. doi: 10.3390/biology4040640
20. Johansen L-H, Thim HL, Jørgensen SM, Afanasyev S, Strandskog G, Taksdal T, et al. Comparison of Transcriptomic Responses to Pancreas Disease (PD) and Heart and Skeletal Muscle Inflammation (HSMI) in Heart of Atlantic Salmon (Salmo Salar L). Fish Shellfish Immunol (2015) 46(2):612–23. doi: 10.1016/j.fsi.2015.07.023
21. Di Cicco E, Ferguson HW, Kaukinen KH, Schulze AD, Li S, Tabata A, et al. The Same Strain of Piscine Orthoreovirus (PRV-1) Is Involved in the Development of Different, But Related, Diseases in Atlantic and Pacific Salmon in British Columbia. Facets (2018) 3(1):599–641. doi: 10.1139/facets-2018-0008
22. Malik MS, Bjørgen H, Dhamotharan K, Wessel Ø, Koppang EO, Di Cicco E, et al. Erythroid Progenitor Cells in Atlantic Salmon (Salmo Salar) May Be Persistently and Productively Infected With Piscine Orthoreovirus (PRV). Viruses (2019) 11(9):824. doi: 10.3390/v11090824
23. Malik MS, Bjørgen H, Nyman IB, Wessel Ø, Koppang EO, Dahle MK, et al. PRV-1 Infected Macrophages in Melanized Focal Changes in White Muscle of Atlantic Salmon (Salmo Salar) Correlates With a Pro-Inflammatory Environment. Front Immunol (2021) 12:664624. doi: 10.3389/fimmu.2021.664624
24. Wentzel AS, Petit J, van Veen WG, Fink IR, Scheer MH, Piazzon MC, et al. Transcriptome Sequencing Supports a Conservation of Macrophage Polarization in Fish. Scient Rep (2020) 10(1):1–15. doi: 10.1038/s41598-020-70248-y
25. Wiegertjes GF, Wentzel AS, Spaink HP, Elks PM, Fink IR. Polarization of Immune Responses in Fish: The ‘Macrophages First’Point of View. Mol Immunol (2016) 69:146–56. doi: 10.1016/j.molimm.2015.09.026
26. Løvoll M, Austbø L, Jørgensen JB, Rimstad E, Frost P. Transcription of Reference Genes Used for Quantitative RT-PCR in Atlantic Salmon Is Affected by Viral Infection. Vet Res (2011) 42(1):8. doi: 10.1186/1297-9716-42-8
27. Jørgensen SM, Lyng-Syvertsen B, Lukacs M, Grimholt U, Gjøen T. Expression of MHC Class I Pathway Genes in Response to Infectious Salmon Anaemia Virus in Atlantic Salmon (Salmo Salar L.) Cells. Fish Shellfish Immunol (2006) 21(5):548–60. doi: 10.1016/j.fsi.2006.03.004
28. Munang’andu HM, Fredriksen BN, Mutoloki S, Dalmo RA, Evensen Ø. The Kinetics of CD4+ and CD8+ T-Cell Gene Expression Correlate With Protection in Atlantic Salmon (Salmo Salar L) Vaccinated Against Infectious Pancreatic Necrosis. Vaccine (2013) 31(15):1956–63. doi: 10.1016/j.vaccine.2013.02.008
29. Marjara IS, Chikwati EM, Valen EC, Krogdahl Å, Bakke AM. Transcriptional Regulation of IL-17A and Other Inflammatory Markers During the Development of Soybean Meal-Induced Enteropathy in the Distal Intestine of Atlantic Salmon (Salmo Salar L.). Cytokine (2012) 60(1):186–96. doi: 10.1016/j.cyto.2012.05.027
30. Zhang Y, Zhang X, Liang Z, Dai K, Zhu M, Zhang M, et al. Interleukin-17 Suppresses Grass Carp Reovirus Infection in Ctenopharyngodon Idellus Kidney Cells by Activating NF-κb Signaling. Aquaculture (2020) 520:734969. doi: 10.1016/j.aquaculture.2020.734969
31. González-Fernández C, Chaves-Pozo E, Cuesta A. Identification and Regulation of Interleukin-17 (IL-17) Family Ligands in the Teleost Fish European Sea Bass. Int J Mol Sci (2020) 21(7):2439. doi: 10.3390/ijms21072439
32. Mutoloki S, Cooper GA, Marjara IS, Koop BF, Evensen Ø. High Gene Expression of Inflammatory Markers and IL-17A Correlates With Severity of Injection Site Reactions of Atlantic Salmon Vaccinated With Oil-Adjuvanted Vaccines. BMC Genomics (2010) 11:336. doi: 10.1186/1471-2164-11-336
33. Schulze PC, Lee RT. Macrophage-Mediated Cardiac Fibrosis. Am Heart Assoc (2004) 95(6):552–3. doi: 10.1161/01.RES.0000143420.87587.9e
34. Grayfer L, Kerimoglu B, Yaparla A, Hodgkinson JW, Xie J, Belosevic M. Mechanisms of Fish Macrophage Antimicrobial Immunity. Front Immunol (2018) 9:1105. doi: 10.3389/fimmu.2018.01105
35. Viola A, Munari F, Sánchez-Rodríguez R, Scolaro T, Castegna A. The Metabolic Signature of Macrophage Responses. Front Immunol (2019) 10:1462. doi: 10.3389/fimmu.2019.01462
36. Lassalle MW, Igarashi S, Sasaki M, Wakamatsu K, Ito S, Horikoshi T. Effects of Melanogenesis-Inducing Nitric Oxide and Histamine on the Production of Eumelanin and Pheomelanin in Cultured Human Melanocytes. Pigment Cell Res (2003) 16(1):81–4. doi: 10.1034/j.1600-0749.2003.00004.x
37. O'Hara D, Patrick M, Cepica D, Coombs KM, Duncan R. Avian Reovirus Major μ-Class Outer Capsid Protein Influences Efficiency of Productive Macrophage Infection in a Virus Strain-Specific Manner. J Virolol (2001) 75(11):5027–35. doi: 10.1128/jvi.75.11.5027-5035.2001
Keywords: Atlantic salmon, cell mediated immunity, heart and skeletal muscle inflammation, macrophage polarization, Piscine orthoreovirus 1
Citation: Malik MS, Nyman IB, Wessel Ø, Dahle MK and Rimstad E (2021) Dynamics of Polarized Macrophages and Activated CD8+ Cells in Heart Tissue of Atlantic Salmon Infected With Piscine Orthoreovirus-1. Front. Immunol. 12:729017. doi: 10.3389/fimmu.2021.729017
Received: 22 June 2021; Accepted: 31 August 2021;
Published: 16 September 2021.
Edited by:
Leon Grayfer, George Washington University, United StatesReviewed by:
Mark D. Fast, University of Prince Edward Island, CanadaCopyright © 2021 Malik, Nyman, Wessel, Dahle and Rimstad. This is an open-access article distributed under the terms of the Creative Commons Attribution License (CC BY). The use, distribution or reproduction in other forums is permitted, provided the original author(s) and the copyright owner(s) are credited and that the original publication in this journal is cited, in accordance with accepted academic practice. No use, distribution or reproduction is permitted which does not comply with these terms.
*Correspondence: Espen Rimstad, ZXNwZW4ucmltc3RhZEBubWJ1Lm5v
Disclaimer: All claims expressed in this article are solely those of the authors and do not necessarily represent those of their affiliated organizations, or those of the publisher, the editors and the reviewers. Any product that may be evaluated in this article or claim that may be made by its manufacturer is not guaranteed or endorsed by the publisher.
Research integrity at Frontiers
Learn more about the work of our research integrity team to safeguard the quality of each article we publish.