 Junhong Shi1
 Meiyu Bao
 Weifeng Wang
 Weiwei Liu
- 1Department of Laboratory Medicine and Central Laboratory, Shanghai Tenth People’s Hospital, Tongji University School of Medicine, Shanghai, China
- 2Department of Central Laboratory, Shanghai Tenth People’s Hospital, Tongji University, Shanghai, China
- 3Department of Gastroenterology, Second People’s Hospital of Lianyungang City, Lianyungang, China
- 4Department of Laboratory Medicine, Shanghai Skin Disease Hospital, Tongji University School of Medicine, Shanghai, China
Procollagen-Lysine,2-Oxoglutarate 5-Dioxygenase 3 (PLOD3) is related to a variety of human diseases. However, its function in Colorectal cancer (CRC) remains uncertain. PLOD3 expression was analyzed using The Cancer Genome Atlas (TCGA) pan-cancer data. DAVID was used for enrichment analysis of PLOD3-related genes. The correlation between PLOD3 expression and immune cell infiltration was evaluated. Four expression profile datasets (GSE17536, GSE39582, GSE74602, and GSE113513) from Gene Expression Omnibus, and two proteomic datasets were used as validation cohorts for assessing the diagnostic and prognostic value of PLOD3 in CRC. What’s more, we performed immunohistochemistry (IHC) staining for PLOD3 in 160 paired CRC specimens and corresponding adjacent non-tumor tissues. PLOD3 was highly expressed in many tumors including CRC. PLOD3 was upregulated in advanced stage CRCs, and high PLOD3 expression was associated with poor survival. High PLOD3 expression was associated with low levels of B cells, CD4+ T cells, M1 macrophages, CD8+ T cells, and multiple immunerelated characteristics. In addition, the high PLOD3 expression group had a higher TIDE score and a lower tumor mutation burden and microsatellite instability, indicating that patients with high PLOD3 expression may be resistant to immunotherapy. Additional datasets and IHC analysis were used to validate the diagnostic and prognostic value of PLOD3 at the mRNA and protein levels in CRC. Patients with non-response to immunotherapy showed increased PLOD3 expression in an immunotherapy treated dataset. PLOD3 is a potential biomarker for CRC diagnosis and prognosis prediction. CRCs with high PLOD3 expression may be resistant to immune checkpoint therapy.
Introduction
Colorectal cancer (CRC) is one of the most common malignant tumors of the digestive system, and its morbidity and mortality rates are high worldwide (1). Despite effective cancer screening measures and modern medicine, CRC remains the leading cause of cancer-related mortality worldwide (2). According to the “Cancer Statistics in China”, the incidence and mortality of CRC have increased in China (3). Therefore, it is important to identify novel diagnostic and prognostic biomarkers and to explore potential relevant targets for the treatment of CRC.
Recently, growing evidence has reported that the elevated deposition of collagen and its cross-linking can worsen tumor progression by promoting cancer cell proliferation, migration, and invasion (4, 5). Collagen deposition and cross-linking are dependent on the hydroxylation of lysine residues, which is mainly catalyzed by procollagen-lysine, 2-oxoglutarate 5-dioxygenase (PLOD). PLOD3, a member of PLOD family (6), is a multifunctional enzyme with lysyl hydroxylase, collagen galactosyltransferase, and glucosyltransferase activities (7). Collagens constitute a highly specialized family of extracellular matrix (ECM) proteins that maintain tissue architecture and regulate cellular responses (8, 9). PLOD3 is localized on chromosome 7q22.1, and its activity is critical for the biosynthesis of type IV and VI collagens (10). PLOD3 overexpression is correlated with high circulating protein levels in some patients (11) and increasing evidence suggested that PLOD3 is associated with tumorigenesis in various cancer types. PLOD3 is a novel diagnostic marker for early-stage hepatocellular carcinoma (12), human glioma prognosis (13) and ovarian cancer (14). In addition, PLOD3 interacts with STAT3 immunosuppressive signals, which promotes lung cancer metastasis via dysregulated RAS-MAP kinase pathway (15). These results suggested an underlying association between PLOD3 and tumor tumorigenesis as well as antitumor immunity. Several pancancer studies (16–18) published in the last year reminded us to explore the molecular features of PLOD3 using the high-throughput sequencing data. The aim of this study was to uncover the functional role, as well as the diagnostic and prognostic value of PLOD3 in CRC.
Methods
Patients and Samples
A total of 160 paired paraffin-embedded CRC specimens and corresponding adjacent non-tumor tissues were collected to design a tissue array chip from the Shanghai Tenth People’s Hospital, Tongji University School of Medicine. The study was approved by the Research Ethics Committee of Shanghai Tenth People’s Hospital and carried out in accordance with the ethical standards formulated in the Helsinki Declaration. The related ethical approval code is 2020-KN155-01. Tissue microarray was constructed by 1.5-mm cores.
Immunohistochemistry
Immunohistochemistry (IHC) for PLOD3 was carried out on CRC tissue microarray slides. The slides were first incubated at 60°C for 4 h, deparaffinized in xylene, and then rehydrated in alcohol. After heating in citrate buffer for 23 min, we used 0.3% of hydrogen peroxide (H2O2) to block endogenous peroxidase activity. Slides were blocked with 3% bovine serum albumin for 30 min and incubated in the anti-PLOD3 antibody (diluted 1:200; ab128698; Abcam) overnight at 4°C. The next day, after 3 washes with PBS, slides were incubated with secondary antibody for 1 h, then we used the 3,3-diaminobenzidine (DAB) kit for visualization, and hematoxylin was used to stain nuclei. After the experiments, the slides were observed by microscope. All stainings were scored based on the staining intensity and extensity of positive cells, the intensity (0=genitive, 1=weak, 2=moderate, and 3=strong) and extensity (0 = 5% or less of cells stained positive; 1 = 5%-25%; 2 = 26% to 50%; 3 = 51% to 75%; and 4 = 75% or more) of tumor staining were evaluated. The positive cell density of each core was counted by two independent investigators blind to clinical outcome and knowledge of the clinicopathological data. The final IHC score was calculated by multiplying the strongest intensity score and the total extensity score (maximum value of 12).
Data Acquisition and Preprocessing
The Cancer Genome Atlas (TCGA) colon adenocarcinoma (COAD) and rectum adenocarcinoma (READ) data, including gene expression quantified by fragments per kilobase million and clinical information of 51 normal tissues and 638 tumor tissues, were obtained from the UCSC Xena project (http://xena.ucsc.edu/). Four independent validation cohorts (GSE17536, GSE39582, GSE74602, and GSE113513) were obtained from the Gene Expression Omnibus (GEO; https://www.ncbi.nlm.nih.gov/geo). Gene level mutations (Mutect2) of the COAD and READ cohorts were acquired from TCGA data portal (https://portal.gdc.cancer.gov/).
TIMER Database Analysis
The TIMER (12) database was used to analyze differences in PLOD3 expression between tumors and normal controls from TCGA data set.
Comprehensive Tumor Immune Analysis
The pan-cancer immune cell infiltration scores for TCGA were obtained from a previously published study (19). The results were based on CIBERSORT (20) and were used for further analysis. TCGA CRC cancer samples were divided into two groups according to median PLOD3 expression (high versus low), and immune cell infiltration was compared between groups. Tumor Immune Dysfunction and Exclusion (TIDE) algorithm (21) was used to estimate a tide score and the predicted response to immune checkpoint blockade. Immunescore and Stromalscore were calculated via “estimate” (22) package.
Biological Functions of PLOD3 in CRC
The top 1000 genes showing the highest correlation with PLOD3 were extracted from the LinkedOmics database (http://www. linkedomics.org) (23). Function annotations were performed to identify potentially involved biological processes and signaling pathways using DAVID (24) 6.8 (https://david.ncifcrf.gov/).
Mutation Analysis
Tumor mutation analysis was performed using the “maftools” package (25). High and low PLOD3 expression oncoplots were generated via “oncoplot” function, and tumor mutation burden (TMB) was calculated using the “maftools” package. Differentially mutated genes between PLOD3-high and low groups were evaluated via Fisher’s exact test.
Validation of the Diagnostic, Prognostic and Therapeutic Value of PLOD3
Four independent validation cohorts (GSE17536 (26), GSE39582 (27), GSE74602, and GSE113513) were obtained from the GEO database and used as validation cohorts to determine the diagnostic and prognostic value of PLOD3. GSE17536 (177 patients) and GSE39582 (585 patients) with relevant survival information were applied for PLOD3’s prognostic value validation; GSE74602 (30 pairs) and GSE113513 (14 pairs) including the CRC tissues and matched adjacent tissues were employed for validating the expression difference of PLOD3 between tumor and normal tissues. In this analysis, patients were divided into low- and high-PLOD3 groups according to an optimal PLOD3 cutoff, which was generated using the association between PLOD3 and survival data with the survminer package. GSE91061 (28) including 105 immunotherapy-treated samples was used for the validation of PLOD3’s therapeutic value. After immunotherapy treatment, samples were classified into the following categories according to the patient’s response: complete response (CR), partial response (PR), stable disease (SD) and progressive disease (PD). Among them, CR and PR are recognized as patients who respond to immunotherapy. SD and PD are recognized as patients who do not respond to immunotherapy. Moreover, the protein levels of PLOD3 in colorectal tumors and normal tissues were assessed using a proteomic dataset (29). Another proteomic dataset (30) was used to validate the prognostic value of PLOD3 according to protein expression levels.
Statistical Analysis
Differences in variables between groups were tested using the Wilcoxon test or chi-squared test, as appropriate. Kaplan-Meier curves were drawn to estimate the overall survival distribution. The log-rank test was used to analyze the statistical difference in survival curves between two groups. Kruskal-Wallis tests were used for comparing PLOD3’s expression difference among more than two comparison groups and Wilcoxon test was used for comparison between two groups. The ROC curve was plotted via “pROC” package. All figures and statistical analyses were performed using R software (version 4.0.2; http://www.R-project.org). A value of p < 0.05 was considered statistically significant. All statistical tests were two-sided.
Results
Pan-Cancer PLOD3 Expression Analysis
Analysis of PLOD3 using the TIMER2 database showed that PLOD3 expression was higher in 19 TCGA tumors than in the corresponding normal tissues, including bladder urothelial carcinoma, breast invasive carcinoma, cholangiocarcinoma, COAD, esophageal carcinoma, Glioblastoma multiforme, head and neck squamous cell carcinoma, Kidney Chromophobe, kidney renal clear cell carcinoma, kidney renal papillary cell carcinoma, Liver hepatocellular carcinoma, lung adenocarcinoma, lung squamous cell carcinoma, Pheochromocytoma and Paraganglioma, Prostate adenocarcinoma, READ, Skin Cutaneous Melanoma, Stomach adenocarcinoma, and Uterine Corpus Endometrial Carcinoma (Figure 1A). Particularly, higher PLOD3 expression was observed in TCGA COAD and READ cohorts, separately and collectively, compared with the adjacent normal tissues (Figures 1B, C), suggesting that PLOD3 plays a role in the pathogenesis of CRC.
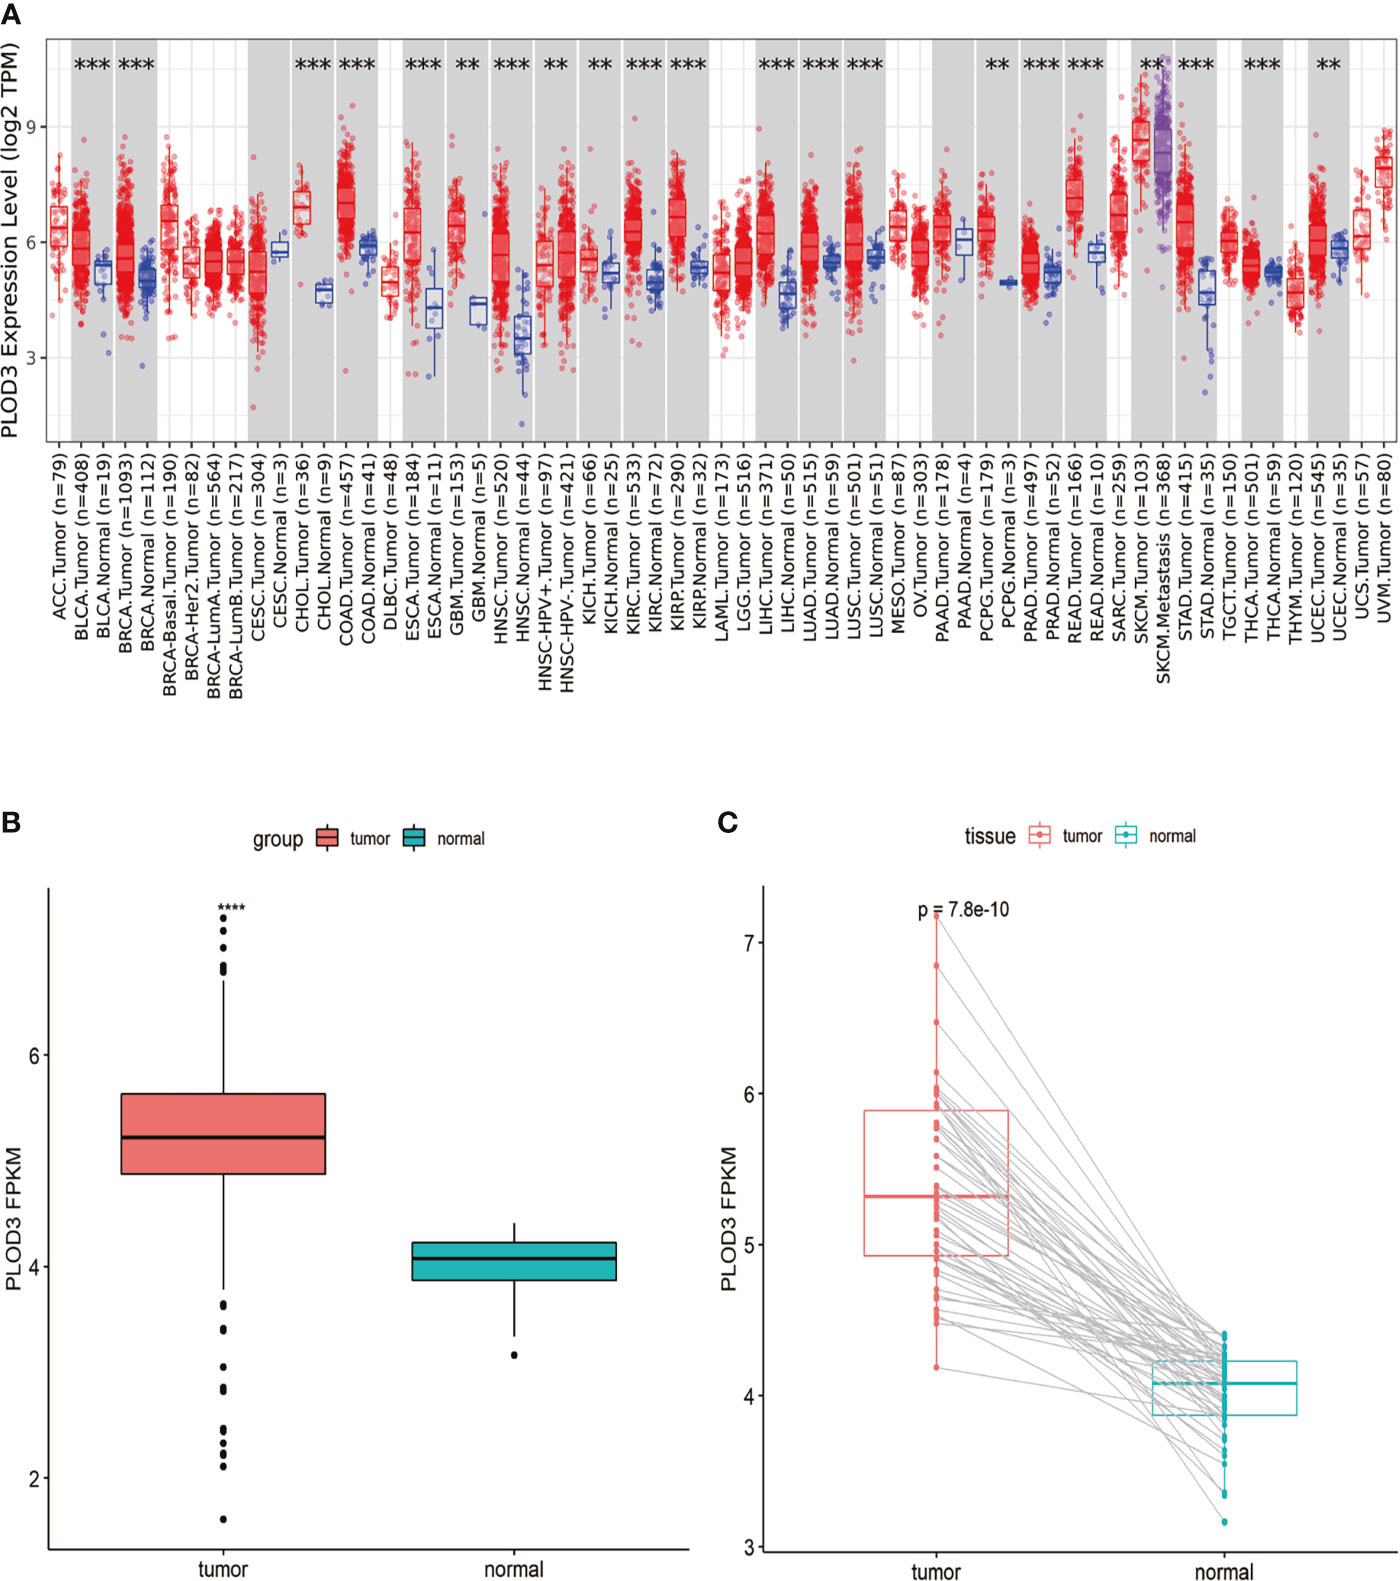
Figure 1 Pan-cancer PLOD3 expression analysis. (A) PLOD3 expression in tumor and normal tissues from pan-cancer data of The Cancer Genome Atlas (TCGA). (B) PLOD3 expression in tumor and normal tissues from CRC obtained from TCGA. (C) PLOD3 expression in paired CRC tumor and normal tissues from TCGA. Data are expressed as the mean ± SD. **p < 0.01, ***p < 0.001, ****p < 0.0001.
Correlations Between PLOD3 Expression and Clinical Parameters in CRC Patients
The role of PLOD3 in CRC remains unclear. Investigating the correlation between PLOD3 expression and clinical features may clarify the function of PLOD3 in the progression of CRC. In this study, we examined the relationship between PLOD3 expression and the clinical parameters of CRC using TCGA cohort. The results showed that PLOD3 expression differed significantly according to tumor N stage, M stage, clinical stage, and microsatellite instability (MSI) status. Increased N, M, and clinical stages were associated with increased PLOD3 expression (all p < 0.05), suggesting that PLOD3 may be a poor prognostic factor (Figures 2A–C). The microsatellite stable (MSS) group also showed higher PLOD3 expression (Figure 2D). Survival analysis using PLOD3 median expression as the cut-off value showed that CRCs with higher expression of PLOD3 had a worse prognosis than those with lower expression (log rank p < 0.01) (Figure 2E).
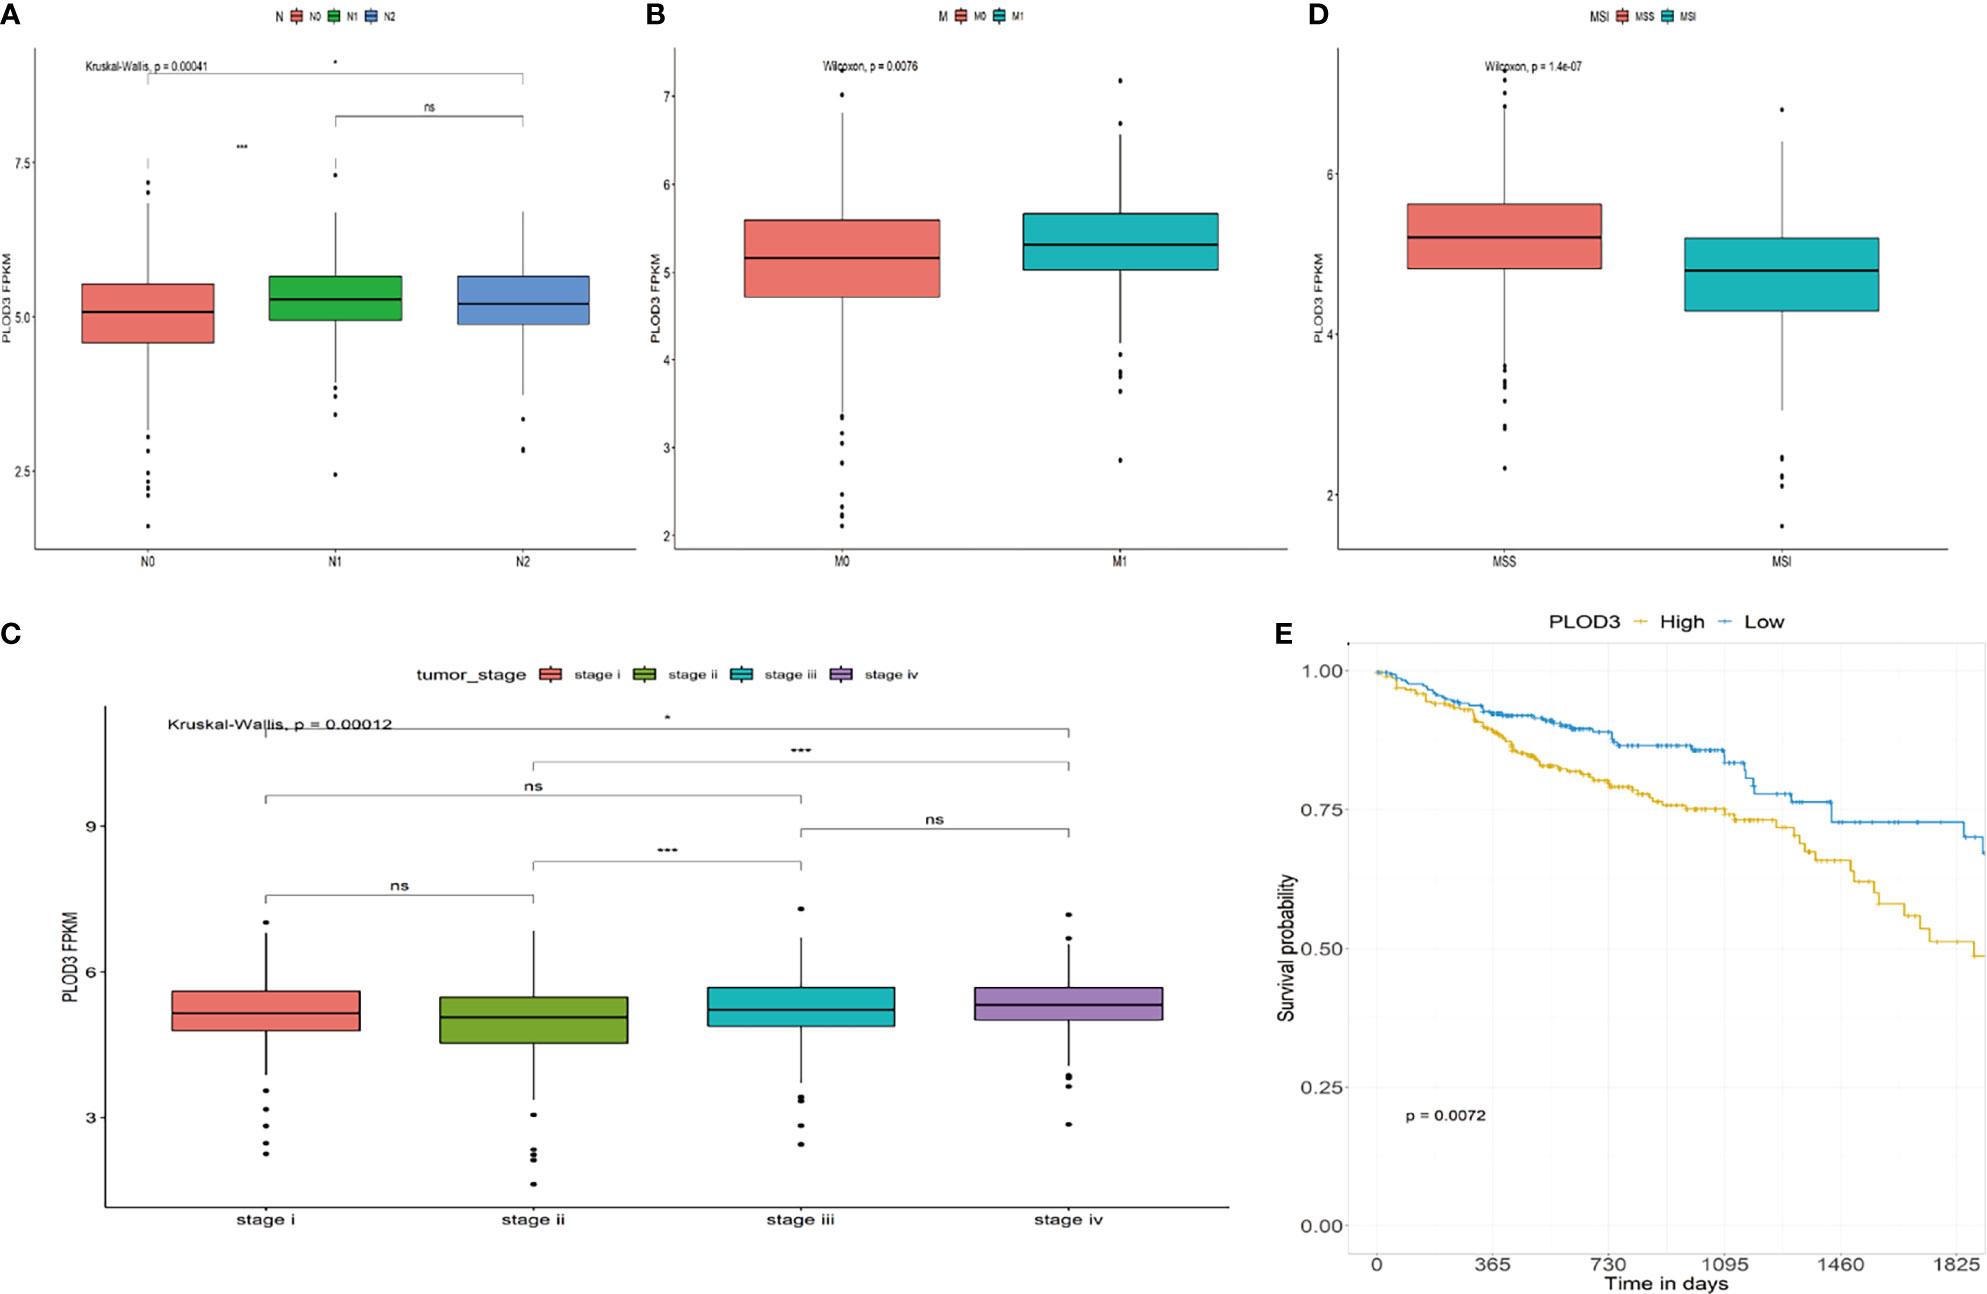
Figure 2 Association of PLOD3 expression with clinicopathological characteristics, including (A) CRC N stage, (B) CRC M stage, (C) CRC pathologic stage, (D) MSI and MSS, and (E) overall survival (OS). *p < 0.05, ***p < 0.001, ns, No Significance.
Gene Function Annotation and Pathway Analysis
After determining the prognostic value of PLOD3 in CRC, we next explored the biological functions associated with PLOD3. GO and KEGG enrichment analyses were performed, and the top GO terms and signaling pathways are shown in Figures 3A, B. PLOD3 gene expression was associated with many biological processes, such as vesicle-mediated transport, ephrin receptor signaling pathway, and autophagy. PLOD3 was also associated with Notch signaling, neurotrophin signaling, and glycosaminoglycan biosynthesis.
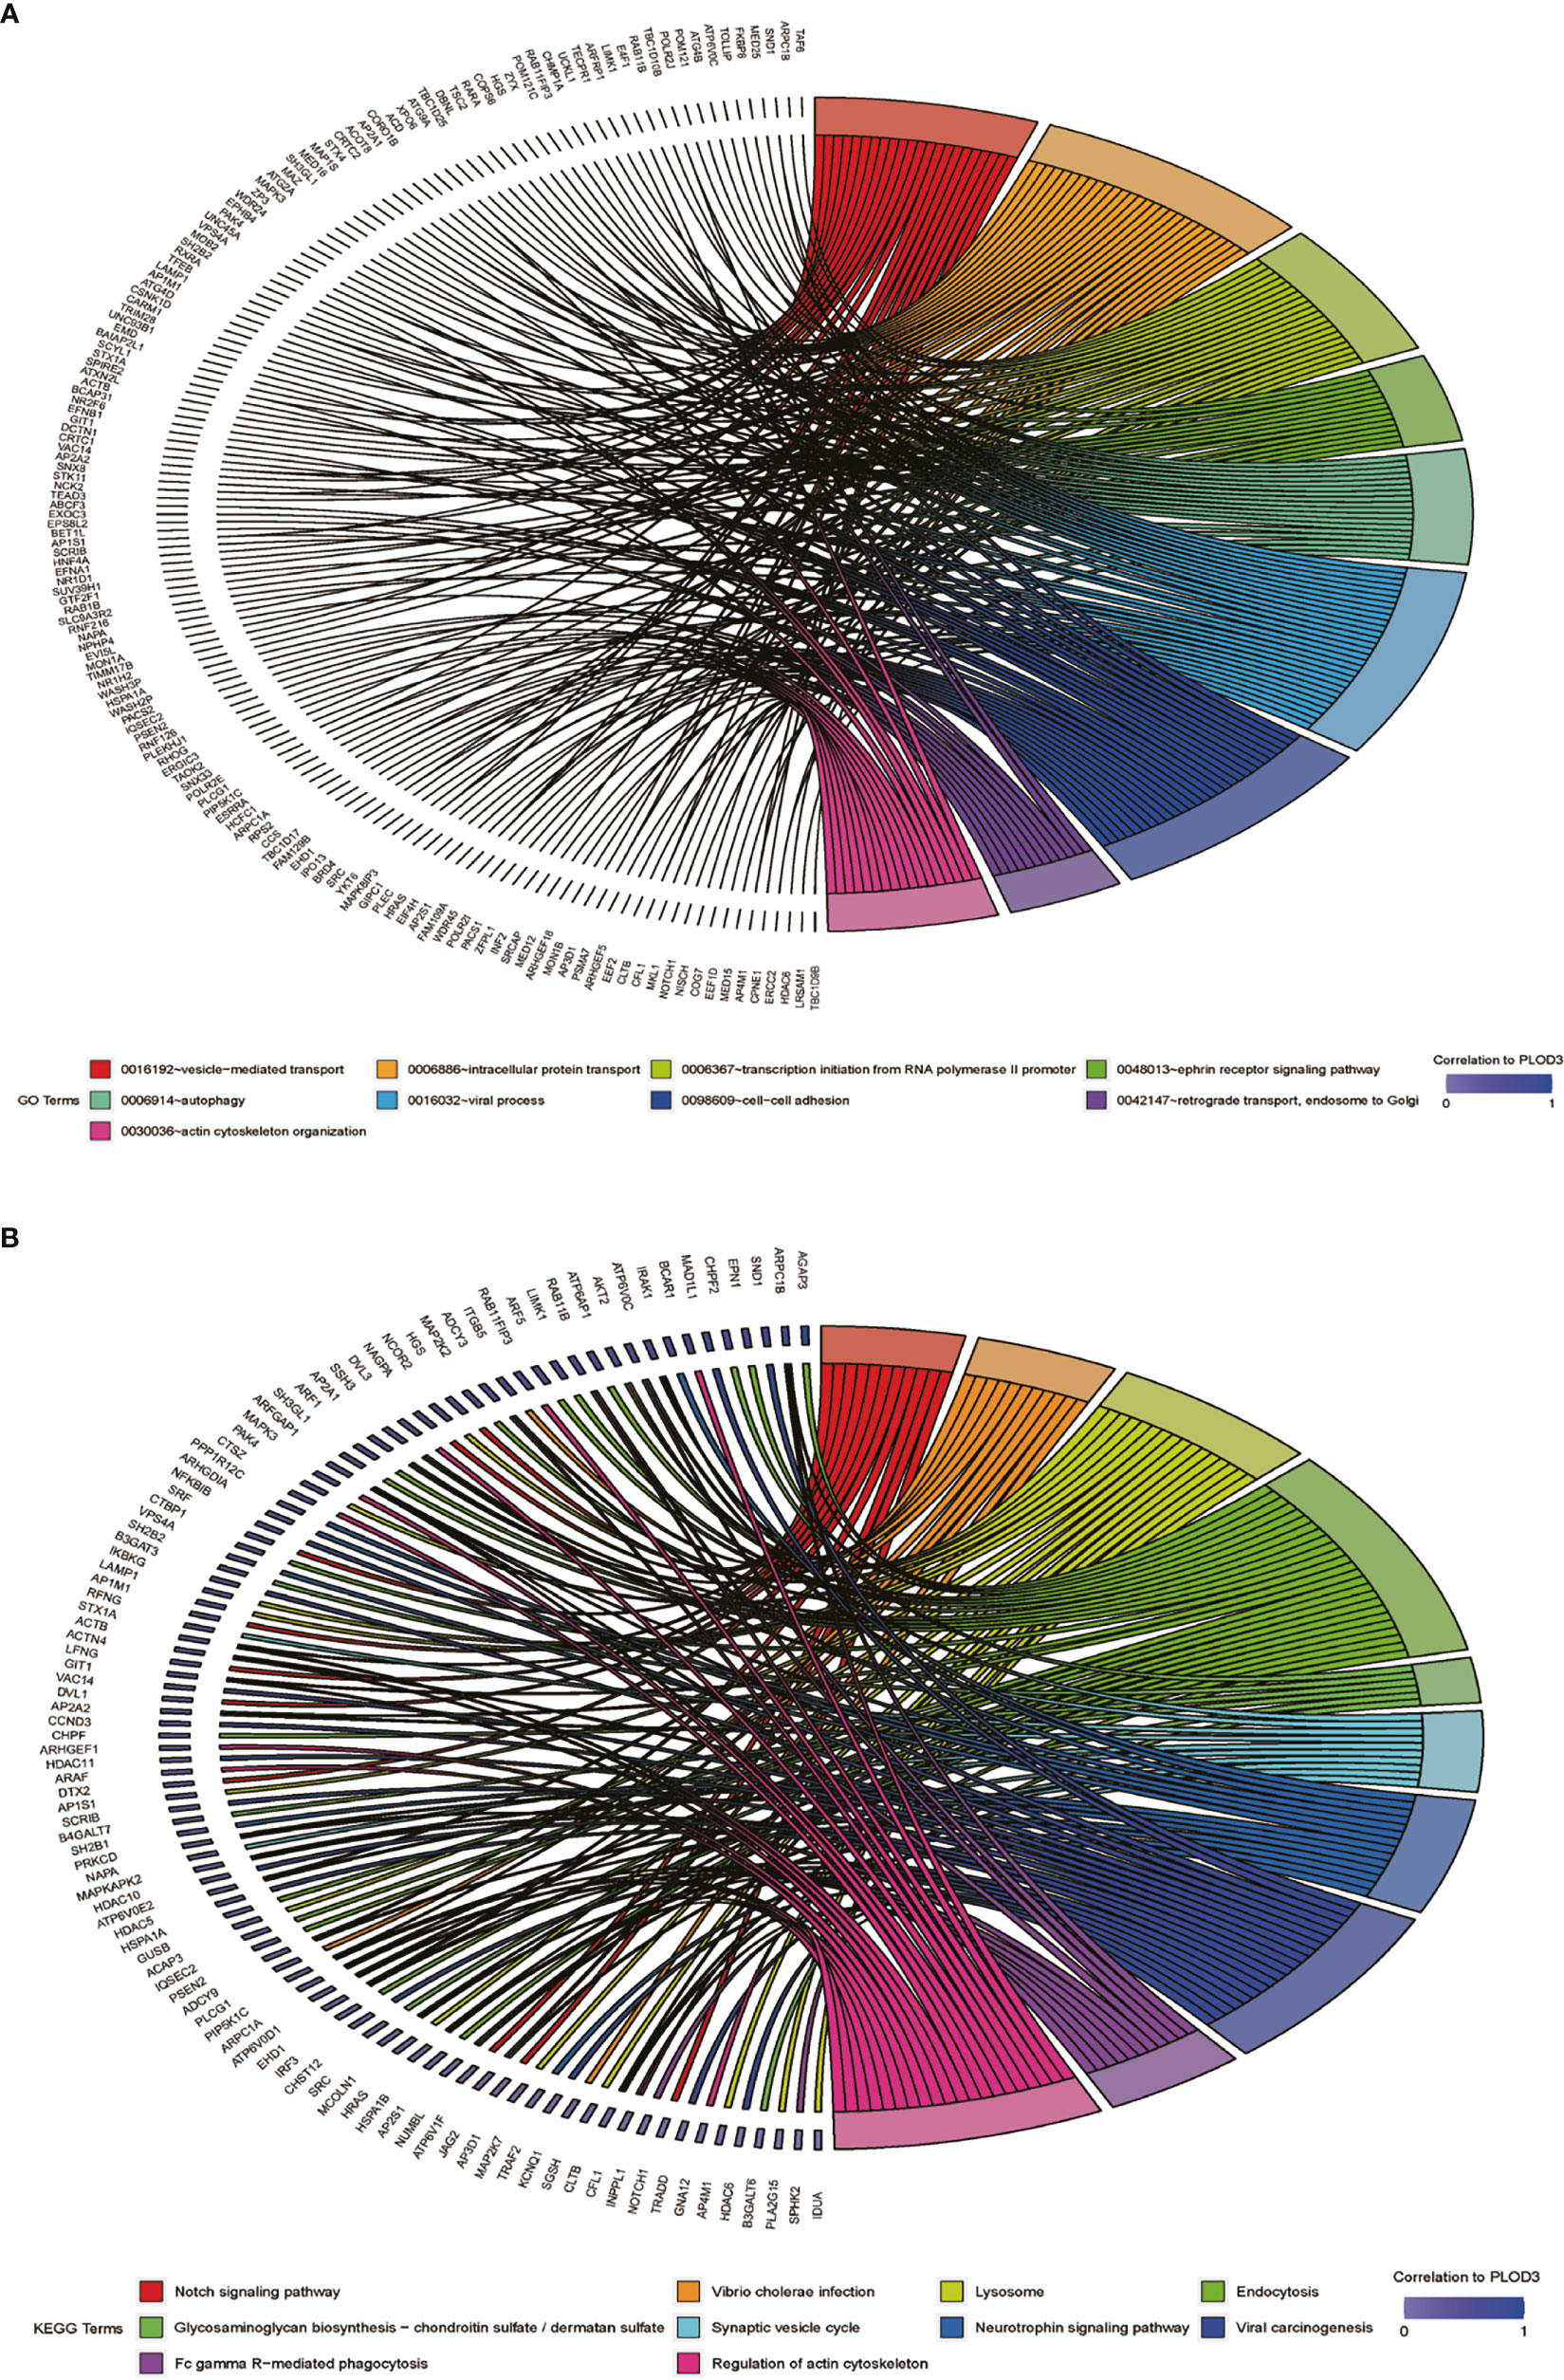
Figure 3 (A) GO BP pathway analysis of PLOD3 related genes in CRC. (B) KEGG pathway analysis of PLOD3 related genes in CRC.
Differences in Genomic Mutation Profiles and TMB Between Different PLOD3 Groups
To examine the relationship between PLOD3 and mutation profiles in CRC, tumor mutations were compared between PLOD3 high and low groups. We chose the top 20 mutation genes in the whole CRC cohort and compared the mutation frequency difference between PLOD3 high (Figure 4A) and low (Figure 4B) groups using the Fisher’s test. Furthermore, we visualized these mutation genes in a forest (Figure 4C). TP53, APC, and KRAS, were significantly mutated in the PLOD3-high group, whereas PIK3CA, FAT4, and OBSCN were specifically mutated in the low-expression group. In addition, a significant (p < 0.001) negative correlation was observed between PLOD3 and TMB (Figure 4D).
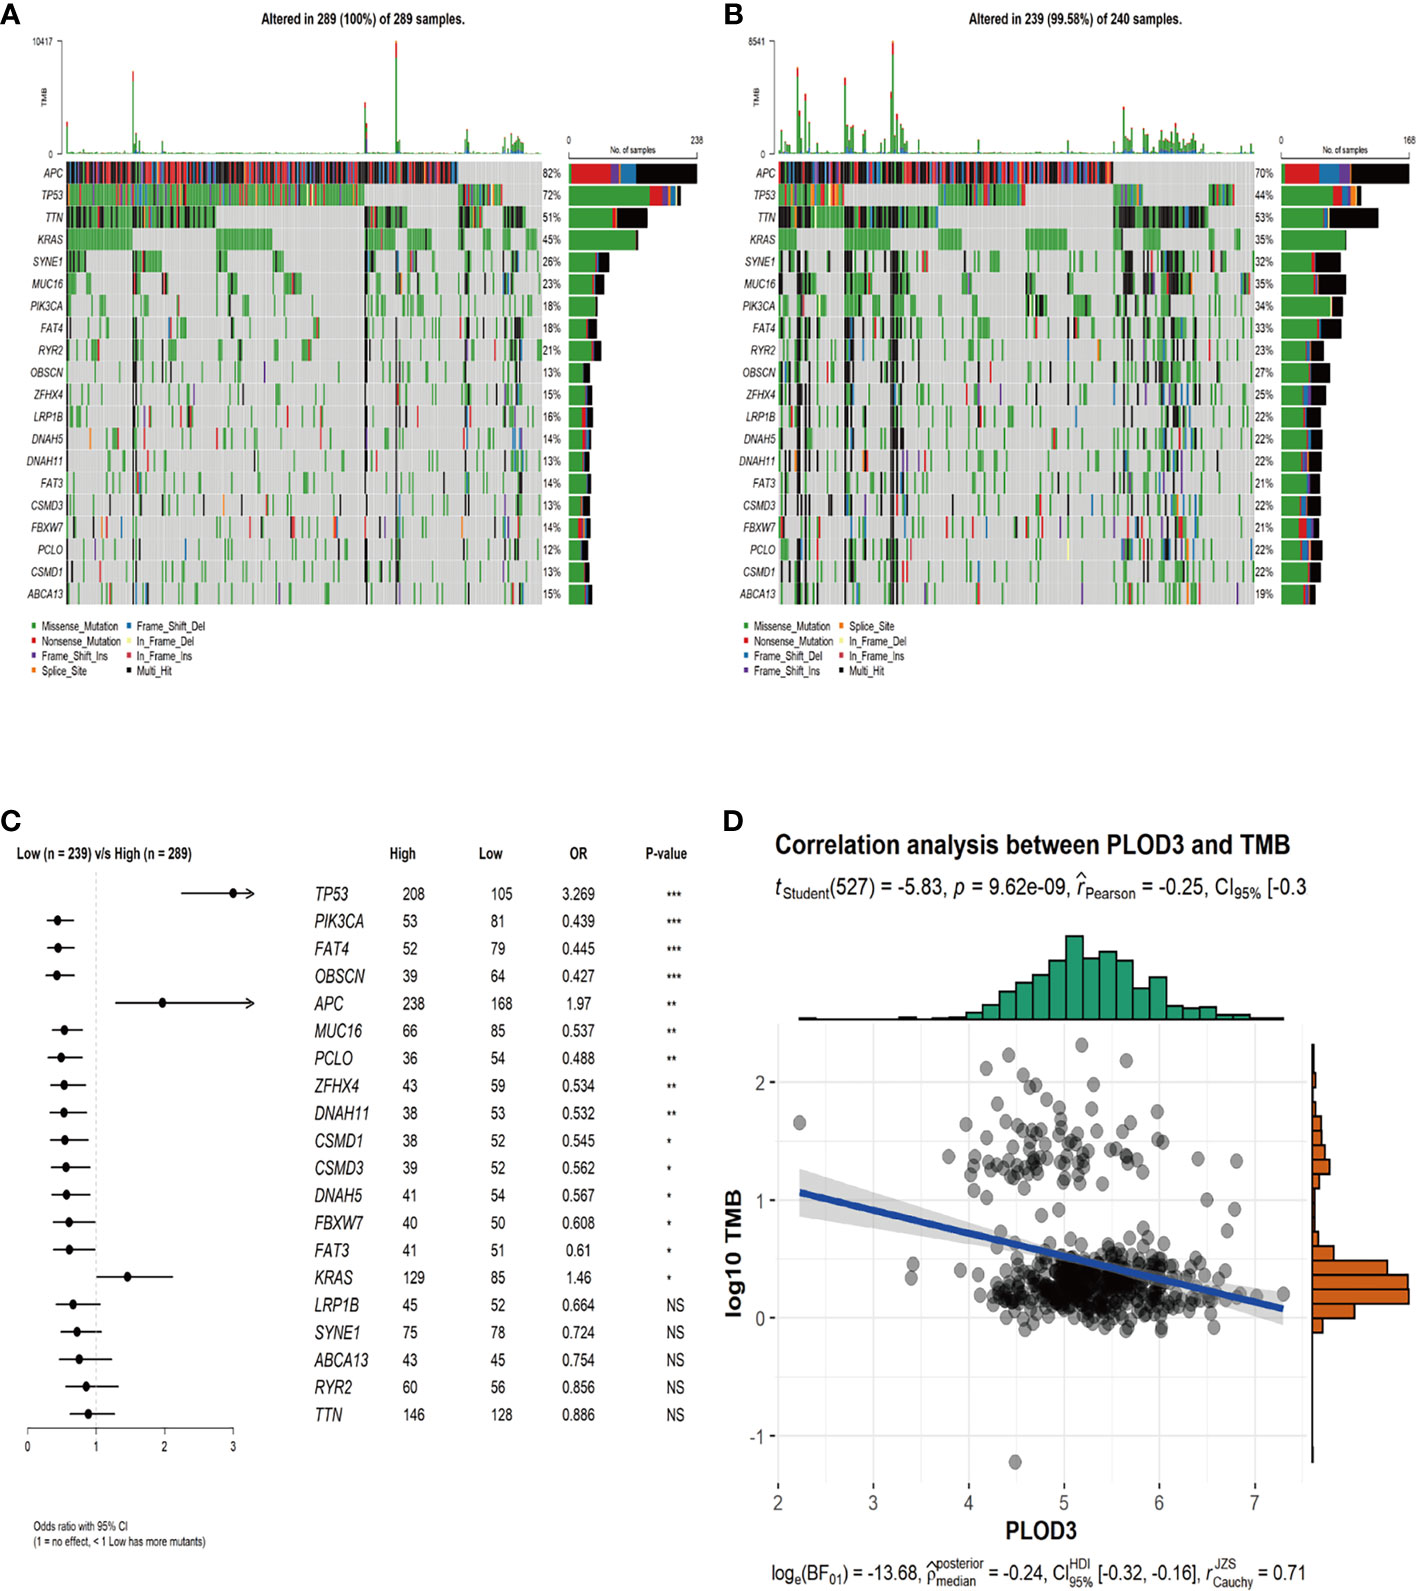
Figure 4 Genomic mutation profiles and TMB characteristics of PLOD3-high and PLOD3-low groups. (A) Distribution of top 20 frequently mutated genes in PLOD3-high TCGA-CRC subgroups. The upper bar plot shows the TMB for each patient, and the left bar plot indicates the gene mutation frequency in different risk groups. (B) Distribution of top 20 frequently mutated genes in PLOD3-low TCGA-CRC subgroups. The upper bar plot shows the TMB for each patient, and the left bar plot indicates the gene mutation frequency in different risk groups. (C) Differentially mutated genes between PLOD3-high and low groups. The p values were calculated by Fisher’s exact test. *p < 0.05; **p < 0.01; ***p < 0.001, NS, No Significance. (D) Correlation analysis of TMB and PLOD3 in TCGA-CRC cohort.
PLOD3 and the Immune Microenvironment in CRC
Next, we analyzed the immune cell infiltration difference between PLOD3 high and low groups. The infiltration scores of B cell plasma, T cell CD8+, T cell CD4 memory resting, T cell CD4 memory activated, T cell follicular helper, T cell gamma delta, and macrophage M1 were higher in the PLOD3-low cohort than in the PLOD3-high cohort (Figure 5A). PLOD3 was significantly negatively correlated with StromalScore (Figure 5B) and immuneScore (Figure 5C). In addition, PLOD3 was significantly negatively correlated with multiple immune checkpoints (Figure 5D) and many other immune related genes, such as antigen-presentation, chemokines, interferons, and T cell inflamed genes (Figure 5E). What’s more, a significantly higher TIDE score was observed in PLOD3-high group (Figure 5F). In an immunotherapy-treated cohort, patients showed non-response to immunotherapy presented with higher PLOD3 expression (Figure 5G). Given that higher PLOD3 expression was associated with lower immunescore, infiltration of multiple immune cells and many immune-related genes, TMB, and MSI score, consistent with the higher TIDE score, we speculated that CRC patients with high PLOD3 expression may be resistant to immunotherapy, which was justified in an immunotherapy-treated cohort.
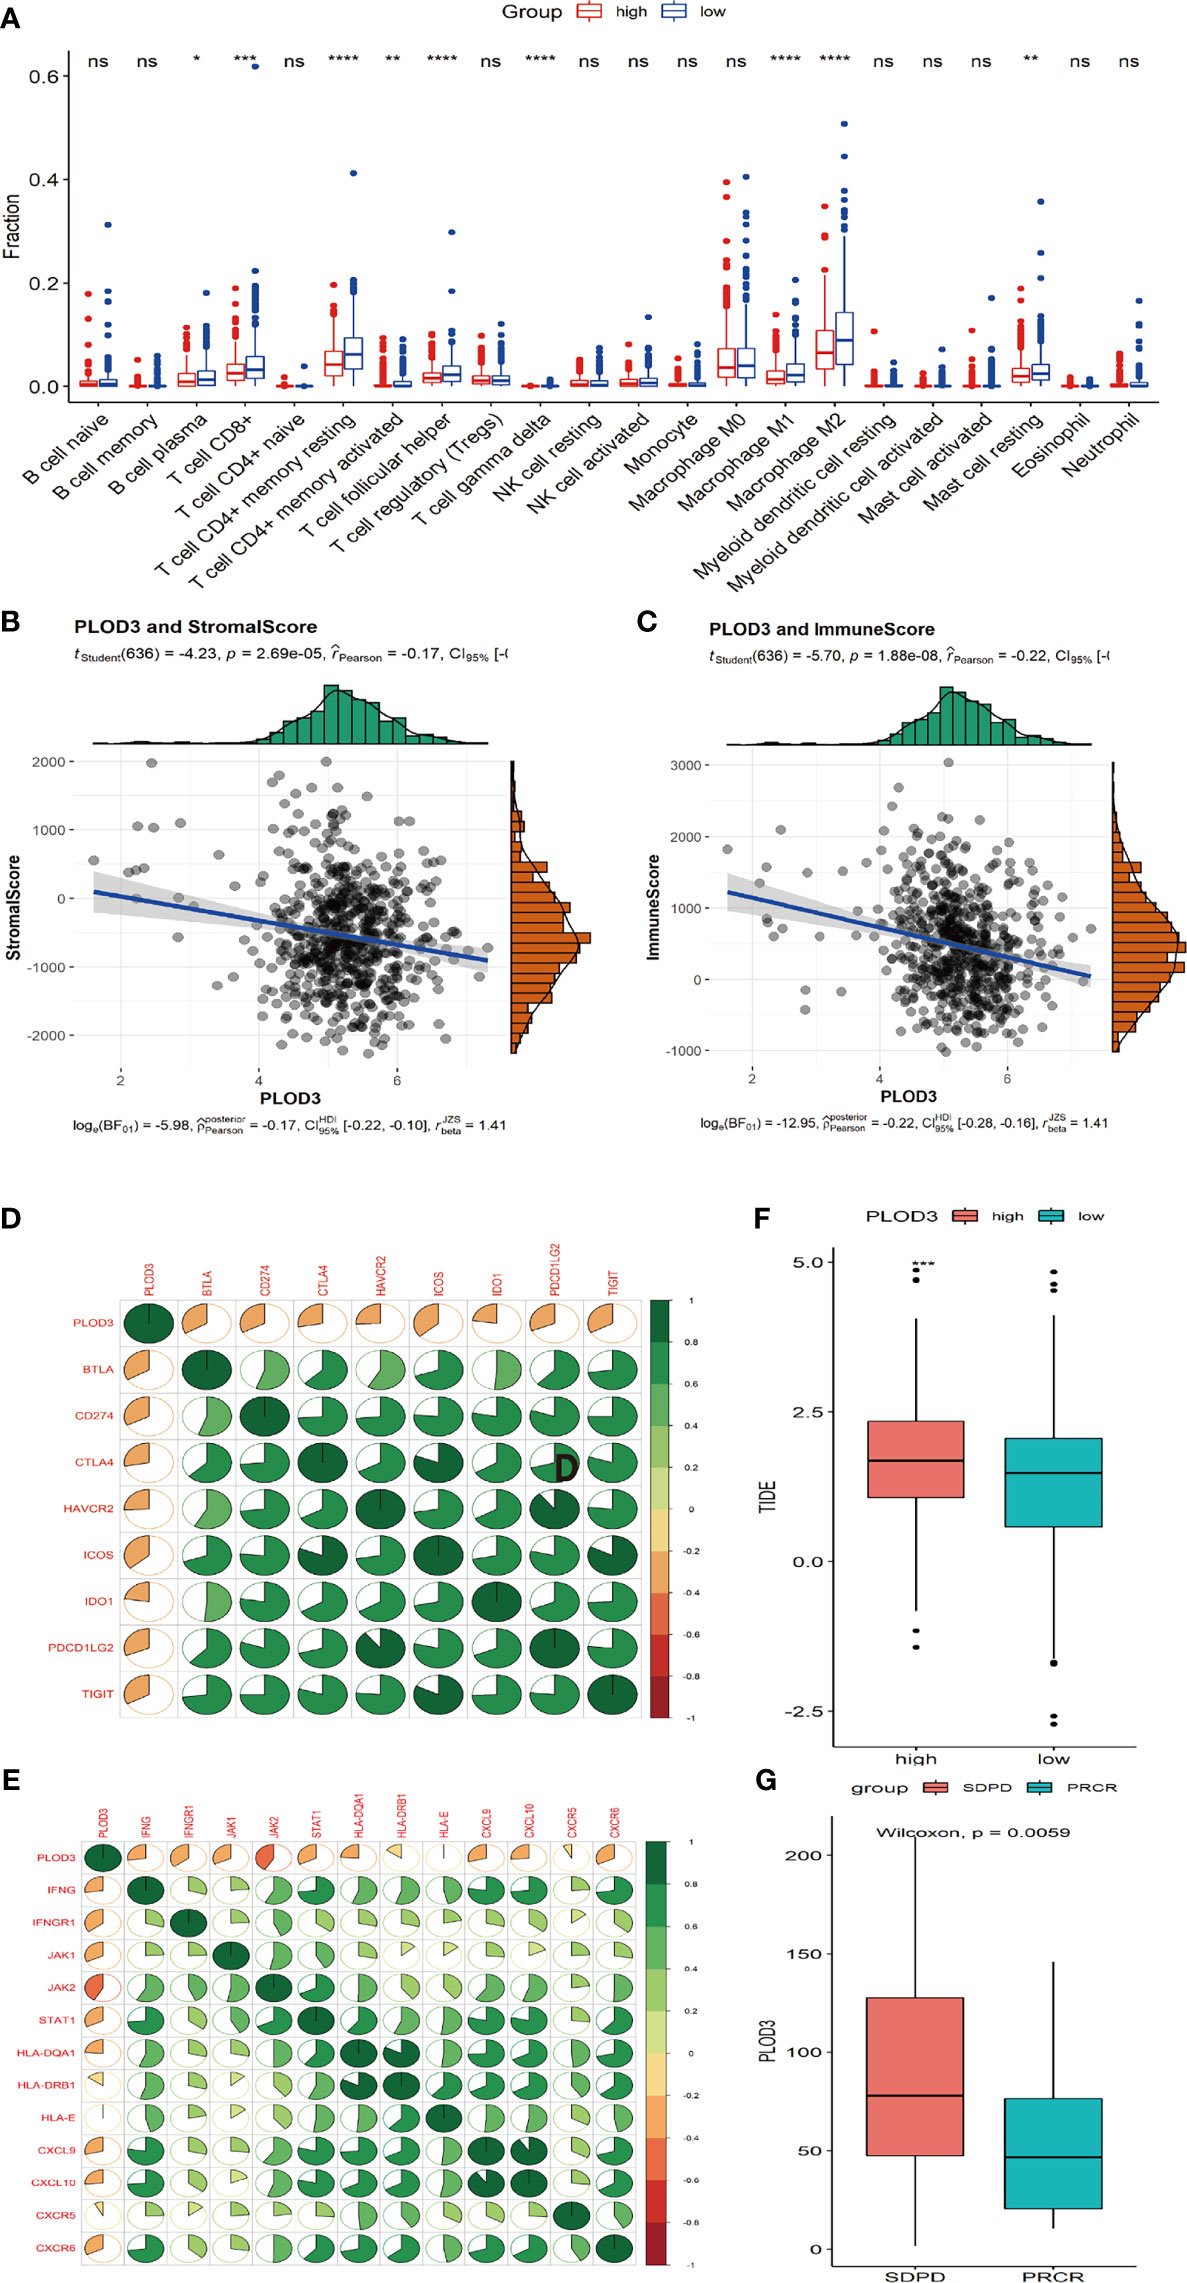
Figure 5 Correlation analysis of immune cell infiltration and PLOD3 in CRC. (A) Immune cell infiltration levels in high and low PLOD3 expression groups from TCGA-CRC cohort. (B) Correlation analysis of StromalScore and PLOD3 in TCGA-CRC cohort; (C) Correlation analysis of ImmueScore and PLOD3 in TCGA-CRC cohort. (D) Correlation between PLOD3 and immune checkpoint levels; green represents positive correlation, red represents negative correlation; color intensity is positively related with the strength of the correlation. (E) Correlation between PLOD3 and immune related genes; green represents positive correlation, red represents negative correlation; color intensity is positively related with the strength of the correlation. (F) Boxplot shows the TIDE score for high and low PLOD3 expression groups. Data are expressed as the mean ± SD. * p < 0.05, ** p < 0.01, ***p < 0.001, **** p < 0.0001. ns, not significant. (G) Boxplot shows the PLOD3 expression for immunotherapy response (CR and PR) and non-response groups (SD and PD). CR, complete response; PR, partial response; SD, stable disease; PD, progressive disease.
Validation of the Diagnostic and Prognostic Value of PLOD3
Two GEO datasets (GSE74602 and GSE113513) were used to validate the diagnostic value of PLOD3 using paired tumor and normal samples. PLOD3 expression was significantly higher in tumor than in normal samples (Figures 6A, B). PLOD3 protein expression was higher in CRC than normal tissues (Figure 6C). Figure 6D showed PLOD3 protein presented with good diagnostic value between CRC and normal tissues. To further confirm the diagnostic value of PLOD3 in CRC patients, the expression of PLOD3 were analyzed by TMA-based IHC. we compared 160 CRC tumor tissues with paired adjacent normal tissues in a microarray, the representative IHC images of positive PLOD3 expression in tumor tissue and negative PLOD3 expression in normal tissue were shown (Figure 6E). Grossly, PLOD3 was overexpressed in tumor parts comparing to normal specimens (Figure 6F, p-value = 4.2e-14).
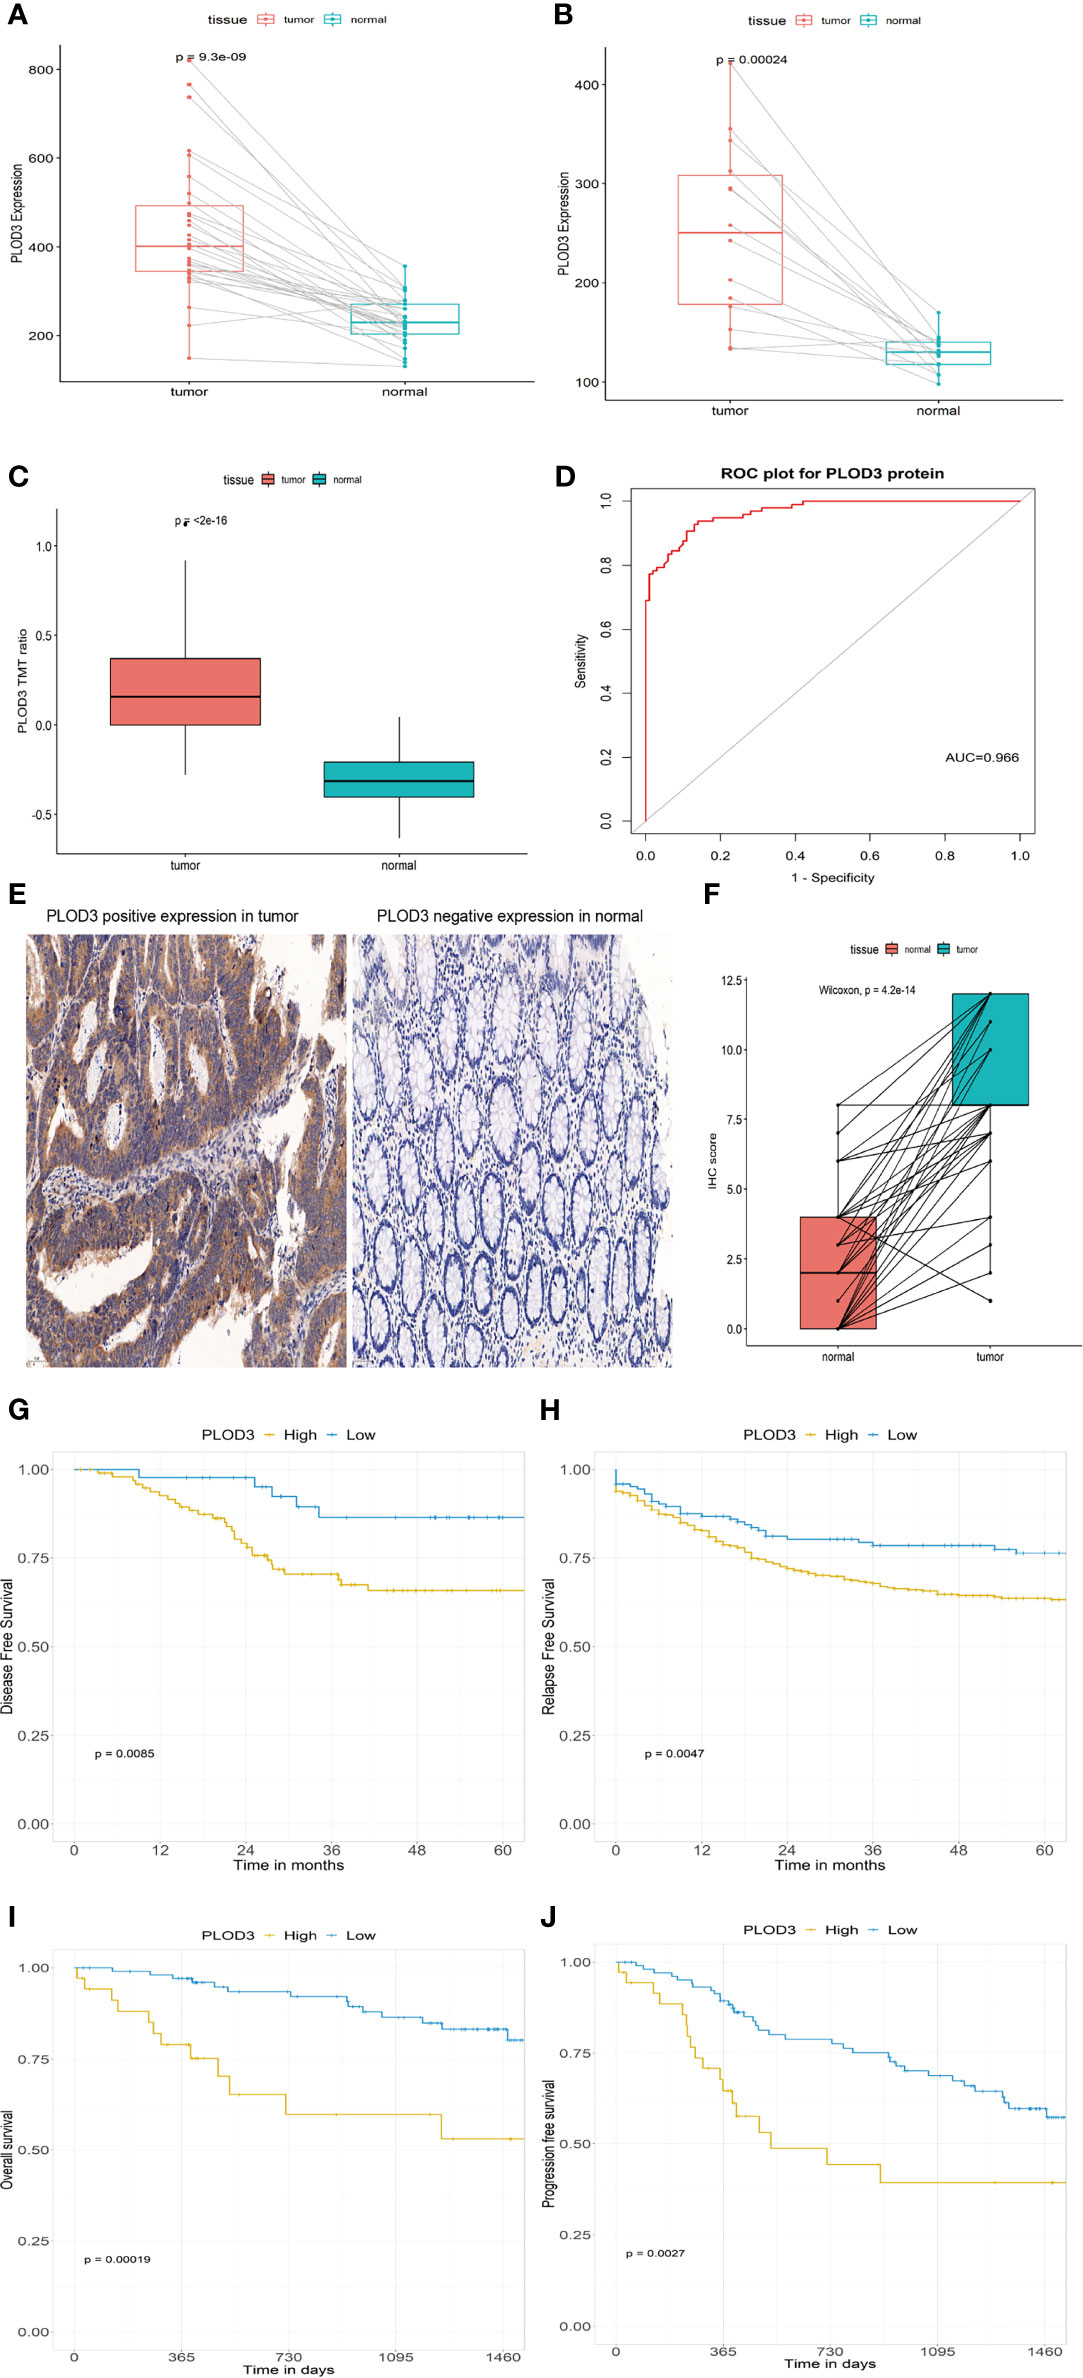
Figure 6 PLOD3 expression in CRC and normal tissues from the GSE74602 (A) and GSE113513 (B) cohorts; PLOD3 protein expression difference in CRC and normal tissues and TMT ratio means the protein abundance by TMT-based quantitation (C) and ROC curve of PLOD3 protein for discriminating tumor and normal tissues in proteome dataset (D); (E) Representative microphotographs of PLOD3 immunohistochemical staining in CRC tissue and adjacent normal tissue by IHC. Scale bar = 50 μm. (F) IHC scores in CRC tissues and adjacent tissues. Prognostic value of PLOD3 in the GSE17536 (G) and GSE39582 (H) cohorts; Prognostic value of PLOD3 in the proteome dataset (I, J).
GSE17536 and GSE39582 were used to validate the prognostic value of PLOD3. In the GSE17536 dataset, patients with higher PLOD3 expression had a worse disease-free survival (Figure 6G). In GSE39582, patients with higher PLOD3 had a worse progression-free survival (Figure 6H). The proteomic dataset generated by Li et al. (30) was used to validate the prognostic value of PLOD3 protein expression, and the results revealed that patients with higher PLOD3 protein expression had a worse overall survival and progression-free survival (Figures 6I, J). Taken together, the results indicate that PLOD3 is a promising biomarker for the diagnosis, prognosis, and treatment of CRC.
Discussion
PLOD3, a collagen biosynthesis-related protein, was reported to contributes to carcinogenesis of HCC (12), glioma (13), ovarian cancer (14, 31), and lung cancer (15). However, the function of PLOD3 in CRC remains to be elucidated. In the current study, we found that PLOD3 was expressed at high levels in CRC tissues, and patients with higher PLOD3 expression had worse survival. These results were validated at the mRNA and protein levels using additional datasets. CRCs with higher PLOD3 expression showed a lower TMB, a higher TIDE score, and patients with MSS tended to have higher PLOD3 expression, suggesting that these patients could present with immunotherapy resistance. An immunotherapy-treated cohort was enrolled to validate PLOD3’s predictive role for immunotherapy response.
PLODs are mainly regulated at the transcriptional level. For instance, hypoxia-induced factor-1 activates PLOD1 in breast cancer, and to a great extent, activates PLOD2 in cancer development (32). PLOD1 was found to be directly regulated by miR-140-5p and abnormally expressed PLOD1 induced cancer aggressiveness in bladder cancer (33). Unlike PLOD1 and PLOD2, the regulation of PLOD3 in CRC is poorly understood. Data mining using TCGA datasets showed that PLOD3 was overexpressed in 19 types of tumor tissues compared with normal tissues, indicating that PLOD3 may serve as a novel biomarker in cancer. Increased PLOD3 expression in CRC tumor tissues at the mRNA and protein levels indicated the potential diagnostic value of PLOD3. The prognostic value of PLOD3 was validated in other datasets, confirming its prognostic potential.
In the present study, patients with advanced stage CRC showed higher PLOD3 expression, indicating that PLOD3 may be associated with metastasis. PLODs are implicated in metastasis because of their role in regulating collagen biosynthesis (34, 35). Collagens provide the scaffold for ECM assembly and are considered “highways” for cancer cell migration (36). MicroRNA-663a targets the 3′ untranslated region of PLOD3 and decreases its expression, resulting in decreased accumulation of extracellular collagen (37). GO and KEGG enrichment analysis of PLOD3-related genes identified many associated pathways, such as the Notch signaling, neurotrophin signaling, and glycosaminoglycan biosynthesis pathways. Neurotrophin expression is associated with poor prognosis in cutaneous melanoma. The Notch signaling pathway is activated in CRC and other cancer types (38, 39) and could be related to poor-prognosis subtypes and metastasis in CRC (40), which may explain the association of PLOD3 with poor prognosis. Some studies revealed the worse prognostic value of TP53 (41) and KRAS for CRCs (42). Higher mutation frequency of TP53 and KRAS were observed in high-PLOD3 group, which may account for the worse survival for this group. In contrast, FAT4 was highly mutated in the PLOD3-low group and Zhuang et al. has demonstrated the better prognostic value of FAT4 in CRC (43).
Immune cells play a role in the regulation of tumor cell behavior (44, 45), and accumulating evidence supports their significance in predicting outcomes and therapeutic efficacy in many cancer types (45, 46). In the present study, the infiltration levels of CD8-positive T cells and M1 macrophages were significantly lower in the PLOD3-high CRC group. OBSCN (47) was significantly associated favorable prognosis, immune-hot subtype and potentially better immunotherapeutic efficacy, which was consistent with more immune infiltration in PLOD3-low group. Moreover, negative correlations were observed between PLOD3 expression and multiple immune related genes (48, 49), suggesting that PLOD3 plays a negative role in regulating tumor immunology. Several indicators for immunotherapy response have been identified in CRC, such as TMB (50, 51) and MSI (52, 53) status. Remarkably, the expression of the PLOD3 was negatively correlated with immuneScore and a previous study (54) in CRC indicated that CRC patients with a lower immuneScore had a poor overall survival. CRCs with higher PLOD3 showed a lower ImmuneScore, TMB, a higher TIDE score, and patients with MSS tended to have higher PLOD3 expression, suggesting the potential for immunotherapy resistance in CRC patients, which was validated in an immunotherapy treated cohort.
The fecal occult blood test methods are more easily accepted by patients, currently but they often suffered various interfering factors with some causes of false-negative, false-positive results, and low sensitivity rates for detecting colon polyps (55). Therefore, early, non-invasive, specific, and sensitive biomarkers are still required for screening strategies in colorectal cancer. We firstly reported the diagnostic and prognostic value of PLOD3 in CRC and validated our finding in other transcriptome and proteome datasets. Given PLOD3’s good discriminating ability and its prognostic value, PLOD3 was a promising biomarker for CRC.
Finally, we discovered, for the first time, the effect of PLOD3 on CRC. We performed a comprehensive analysis to evaluate the functional role of PLOD3 in CRC. The results suggest that PLOD3 is a promising biomarker for the diagnosis and prognosis of CRC. In addition, the study evaluated the performance of PLOD3 as a potential indicator for immunotherapy in CRC patients. These findings can facilitate the personalized treatment of CRC patients. However, the study had several limitations: The PLOD3’s predictive role for immunotherapy was not validated in an immunotherapy-treated CRC cohort and further investigations are needed in the future.
In summary, PLOD3 was identified as a promising biomarker for the diagnosis and prognosis prediction of CRC, and it could be valuable for the design of individualized treatment strategies for CRC patients.
Data Availability Statement
The datasets analyzed during this study are available in the TCGA database (https://portal.gdc.cancer.gov) (TCGA-COAD and TCGA-READ), GEO database (https://www.ncbi.nlm.nih.gov/geo) (GSE17536, GSE39582, GSE74602, and GSE113513).
Author Contributions
JS did bioinformatic analysis and wrote the manuscript. JS, XW, and YL collected the data. JS, MB, WW, CZ, and WL designed the research, organized the calculations. All authors contributed to the article and approved the submitted version.
Funding
This study was supported by grant from the Outstanding academic leaders plan of Shanghai (Grant No. 2018BR07) and “Qinglan Inheritance Project” Fund Project of the Second People’s Hospital of Lianyungang City.
Conflict of Interest
The authors declare that the research was conducted in the absence of any commercial or financial relationships that could be construed as a potential conflict of interest.
Publisher’s Note
All claims expressed in this article are solely those of the authors and do not necessarily represent those of their affiliated organizations, or those of the publisher, the editors and the reviewers. Any product that may be evaluated in this article, or claim that may be made by its manufacturer, is not guaranteed or endorsed by the publisher.
Acknowledgments
The authors would like to acknowledge Mr. Sun Liangdong for his valuable help on this manuscript.
References
1. Qaderi SM, Swartjes H, Custers J, Wilt J. Health Care Provider and Patient Preparedness for Alternative Colorectal Cancer Follow-Up; a Review. Eur J Surg Oncol (2020) 46(10 Pt A):1779–88. doi: 10.1016/j.ejso.2020.06.017
2. Arnold M, Sierra MS, Laversanne M, Soerjomataram I, Jemal A, Bray F. Global Patterns and Trends in Colorectal Cancer Incidence and Mortality. Gut (2017) 66(4):683–91. doi: 10.1136/gutjnl-2015-310912
3. Feng RM, Zong YN, Cao SM, Xu RH. Current Cancer Situation in China: Good or Bad News From The2018 Global Cancer Statistics? Cancer Commun (2019) 39(1):22. doi: 10.1186/s40880-019-0368-6
4. Jover E, Silvente A, Marin F, Martínez-González J, Orriols M, Martinez CM, et al. Inhibition of Enzymes Involved in Collagen Cross-Linking Reduces Vascular Smooth Muscle Cell Calcification. FASEB J (2018) 32:4459–69. doi: 10.1096/fj.201700653R
5. Xiong G, Lei D, Zhu J, Rychahou PG, Ren X. Prolyl-4-Hydroxylase α Subunit 2 Promotes Breast Cancer Progression and Metastasis by Regulating Collagen Deposition. BMC Cancer (2014) 14:1. doi: 10.1186/1471-2407-14-1
6. Salo AM, Sipil L, Sormunen R, Ruotsalainen H, Vainio S, Myllyl R. The Lysyl Hydroxylase Isoforms are Widely Expressed During Mouse Embryogenesis, But Obtain Tissue- and Cell-Specific Patterns in the Adult. Matrix Biol (2006) 25(8):475–83. doi: 10.1016/j.matbio.2006.08.260
7. Heikkinen J, Risteli M, Wang C, Latvala J, Rossi M, Valtavaara M, et al. Lysyl Hydroxylase 3 Is a Multifunctional Protein Possessing Collagen Glucosyltransferase Activity. J Biol Chem (2000) 275(46):36158–63. doi: 10.1074/jbc.M006203200
8. Reichenberger E, Olsen BR. Collagens as Organizers of Extracellular Matrix During Morphogenesis. Semin Cell Dev Biol (1996) 7(5):631–8. doi: 10.1006/scdb.1996.0077
9. Shrivastava A, Radziejewski C, Campbell E, Kovac L, Mcglynn M, Ryan TE, et al. An Orphan Receptor Tyrosine Kinase Family Whose Members Serve as Nonintegrin Collagen Receptors. Mol Cell (1997) 1(1):25–34. doi: 10.1016/S1097-2765(00)80004-0
10. Rautavuoma K, Takaluoma K, Sormunen R, Myllyharju J, Kivirikko KI, Soininen R. Premature Aggregation of Type IV Collagen and Early Lethality in Lysyl Hydroxylase 3 Null Mice. Proc Natl Acad Sci USA (2004) 101(39):14120–5. doi: 10.1073/pnas.0404966101
11. Salo AM, Wang C, Sipil L, Sormunen R, Vapola M, Kervinen P, et al. Lysyl Hydroxylase 3 (LH3) Modifies Proteins in the Extracellular Space, a Novel Mechanism for Matrix Remodeling. J Cell Physiol (2010) 207(3):644. doi: 10.1002/jcp.20596
12. Shen Q, Eun J, Lee K, Kim H, Yang H, Kim S, et al. Barrier to Autointegration Factor 1, Procollagen-Lysine, 2-Oxoglutarate 5-Dioxygenase 3, and Splicing Factor 3b Subunit 4 as Early-Stage Cancer Decision Markers and Drivers of Hepatocellular Carcinoma. Hepatology (Baltimore Md) (2018) 67(4):1360–77. doi: 10.1002/hep.29606
13. Tsai CK, Huang LC, Tsai WC, Huang SM, Hueng DY. Overexpression of PLOD3 Promotes Tumor Progression and Poor Prognosis in Gliomas. Oncotarget (2018) 9(21):15705–20. doi: 10.18632/oncotarget.24594
14. Guo T, Li B, Kang Y, Gu C, Xu C. COLGALT2 Is Overexpressed in Ovarian Cancer and Interacts With PLOD3. Clin Trans Med (2021) 11(3). doi: 10.1002/ctm2.370
15. Baek JH, Yun HS, Kwon GT, Kim JY, Lee CW, Song JY, et al. PLOD3 Promotes Lung Metastasis via Regulation of STAT3. Cell Death Dis (2018) 9(12):1138. doi: 10.1038/s41419-018-1186-5.
16. Ju Q, Li X, Zhang H, Yan S, Li Y, Zhao Y. NFE2L2 Is a Potential Prognostic Biomarker and Is Correlated With Immune Infiltration in Brain Lower Grade Glioma: A Pan-Cancer Analysis. Oxid Med Cell Longev (2020) 2020:3580719. doi: 10.1155/2020/3580719
17. Ju Q, Li XM, Zhang H, Zhao YJ. BRCA1-Associated Protein Is a Potential Prognostic Biomarker and Is Correlated With Immune Infiltration in Liver Hepatocellular Carcinoma: A Pan-Cancer Analysis. Front Mol Biosci (2020) 7:573619. doi: 10.3389/fmolb.2020.573619
18. Consortium ITP-CAoWG. Pan-Cancer Analysis of Whole Genomes. Nature (2020) 578(7793):82–93. doi: 10.1038/s41586-020-1969-6
19. Li T, Fu J, Zeng Z, David C, Li J, Chen Q, et al. TIMER2.0 for Analysis of Tumor-Infiltrating Immune Cells. Nucleic Acids Res (2020) W1):W1. doi: 10.1093/nar/gkaa407
20. Newman AM, Liu CL, Green MR, Gentles AJ, Feng W, Xu Y, et al. Robust Enumeration of Cell Subsets From Tissue Expression Profiles. Nat Methods (2015) 12(5):453–7. doi: 10.1038/nmeth.3337
21. Jiang P, Gu S, Deng P, Fu J, Sahu A, Hu X, et al. Signatures of T Cell Dysfunction and Exclusion Predict Cancer Immunotherapy Response. Nat Med (2015) 24:1550–8. doi: 10.1158/2326-6074.CRICIMTEATIAACR18-B077
22. Yoshihara K, Shahmoradgoli M, Martínez E, Vegesna R, Kim H, Torres-Garcia W, et al. Inferring Tumour Purity and Stromal and Immune Cell Admixture From Expression Data. Nat Commun (2013) 4. doi: 10.1038/ncomms3612
23. Vasaikar SV, Peter S, Wang J, Zhang B. LinkedOmics: Analyzing Multi-Omics Data Within and Across 32 Cancer Types. Nucleic Acids Res (2018) 46:D956–63. doi: 10.1093/nar/gkx1090
24. Dennis G JR., Sherman BT, Hosack DA, Yang J, Gao W, Lane HC, et al. DAVID: Database for Annotation, Visualization, and Integrated Discovery. Genome Biol (2003) 4(5):P3. doi: 10.1186/gb-2003-4-5-p3
25. Mayakonda A, Lin DC, Assenov Y, Plass C, Koeffler HP. Maftools: Efficient and Comprehensive Analysis of Somatic Variants in Cancer. Genome Res (2018) 28(11):1747–56. doi: 10.1101/gr.239244.118
26. Chen MS, Lo YH, Xi C, Williams C, Shroyer N. Growth Factor Independent 1 Is a Tumor Suppressor Gene in Colorectal Cancer. Mol Cancer Res (2019) 17:697–708. doi: 10.1158/1541-7786.MCR-18-0666
27. Marisa L, de Reyniès A, Duval A, Selves J, Gaub MP, Vescovo L, et al. Gene Expression Classification of Colon Cancer Into Molecular Subtypes: Characterization, Validation, and Prognostic Value. PloS Med (2013) 10(5):e1001453. doi: 10.1371/journal.pmed.1001453
28. Riaz N, Havel JJ, Makarov V, Desrichard A, Urba WJ, Sims JS, et al. Tumor and Microenvironment Evolution During Immunotherapy With Nivolumab. Cell (2017) 171(4):1035–49.e19. doi: 10.1016/j.cell.2017.09.028
29. Vasaikar S, Huang C, Wang X, Petyuk VA, Savage SR, Wen B, et al.Proteogenomic Analysis of Human Colon Cancer Reveals New Therapeutic Opportunities. Cell (2019) 177(4):1035–49.e19. doi: 10.1016/j.cell.2019.03.030.
30. Li C, Sun YD, Yu GY, Cui JR, Zeng R. Integrated Omics of Metastatic Colorectal Cancer. Cancer Cell (2020) 38(5). doi: 10.1016/j.ccell.2020.08.002
31. Lyu Y, Feng C. Collagen Synthesis and Gap Junctions: The Highway for Metastasis of Ovarian Cancer. Lab Invest (2021) 101(5):540–2. doi: 10.1038/s41374-021-00546-0
32. Gilkes D, Bajpai S, Wong C, Chaturvedi P, Hubbi M, Wirtz D, et al. Procollagen Lysyl Hydroxylase 2 Is Essential for Hypoxia-Induced Breast Cancer Metastasis. Mol Cancer Res: MCR (2013) 11(5):456–66. doi: 10.1158/1541-7786.MCR-12-0629
33. Yamada Y, Kato M, Arai T, Sanada H, Uchida A, Misono S, et al. Aberrantly Expressed PLOD1 Promotes Cancer Aggressiveness in Bladder Cancer: A Potential Prognostic Marker and Therapeutic Target. Mol Oncol (2019) 13(9):1898–912. doi: 10.1002/1878-0261.12532
34. Salo A, Cox H, Farndon P, Moss C, Grindulis H, Risteli M, et al. A Connective Tissue Disorder Caused by Mutations of the Lysyl Hydroxylase 3 Gene. Am J Hum Genet (2008) 83(4):495–503. doi: 10.1016/j.ajhg.2008.09.004
35. Qi Y, Xu R. Roles of PLODs in Collagen Synthesis and Cancer Progression. Front Cell Dev Biol (2018) 6:66. doi: 10.3389/fcell.2018.00066
36. Gilkes DM, Chaturvedi P, Bajpai S, Wong CC, Wei H, Pitcairn S, et al. Collagen Prolyl Hydroxylases Are Essential for Breast Cancer Metastasis. Cancer Res (2013) 73(11). doi: 10.1158/0008-5472.CAN-12-3963
37. Baek J, Yun H, Kwon G, Lee J, Kim J, Jo Y, et al. PLOD3 Suppression Exerts an Anti-Tumor Effect on Human Lung Cancer Cells by Modulating the PKC-Delta Signaling Pathway. Cell Death Dis (2019) 10(3):156. doi: 10.1038/s41419-019-1405-8
38. Sancho R, Cremona CA, Behrens A. Stem Cell and Progenitor Fate in the Mammalian Intestine: Notch and Lateral Inhibition in Homeostasis and Disease. EMBO Rep (2015) 16(5):571–81. doi: 10.15252/embr.201540188
39. Schmidt EM, Lamprecht S, Blaj C, Schaaf C, Krebs S, Blum H, et al. Targeting Tumor Cell Plasticity by Combined Inhibition of NOTCH and MAPK Signaling in Colon Cancer. J Exp Med (2018), jem.20171455. doi: 10.1084/jem.20171455
40. Jackstadt R, Hooff S, Leach JD, Cortes-Lavaud X, Sansom OJ. Epithelial NOTCH Signaling Rewires the Tumor Microenvironment of Colorectal Cancer to Drive Poor-Prognosis Subtypes and Metastasis. Cancer Cell (2019) 36(3):319–36.e7. doi: 10.1016/j.ccell.2019.08.003
41. Li H, Zhang J, Tong J, Chan A, To KF. Targeting the Oncogenic P53 Mutants in Colorectal Cancer and Other Solid Tumors. Int J Mol Sci (2019) 20(23):5999. doi: 10.3390/ijms20235999
42. Phipps AI, Buchanan DD, Makar KW, Win AK, Baron JA, Lindor NM, et al. KRAS-Mutation Status in Relation to Colorectal Cancer Survival: The Joint Impact of Correlated Tumour Markers. Br J Cancer (2013) 108:1757–64. doi: 10.1038/bjc.2013.118
43. Zhuang Y, Wang H, Jiang D, Li Y, Liu P. Multi Gene Mutation Signatures in Colorectal Cancer Patients: Predict for the Diagnosis, Pathological Classification, Staging and Prognosis. BMC Cancer 21(1):380. doi: 10.1186/s12885-021-08108-9
44. Sahin Ozkan H, Ugurlu MU, Yumuk PF, Kaya H. Prognostic Role of Immune Markers in Triple Negative Breast Carcinoma. Pathol Oncol Res (2020) 26(6):2733–45. doi: 10.1007/s12253-020-00874-4
45. Li C, Jiang P, Wei S, Xu X, Wang J.Regulatory T Cells in Tumor Microenvironment: New Mechanisms, Potential Therapeutic Strategies and Future Prospects. Mol Cancer (2020) 19(1):116. doi: 10.1186/s12943-020-01234-1.
46. Erin N, Grahovac J, Brozovic A, Efferth T. Tumor Microenvironment and Epithelial Mesenchymal Transition as Targets to Overcome Tumor Multidrug Resistance. Drug Resist Update (2020) 53:100715. doi: 10.1016/j.drup.2020.100715
47. Liu Z, Wang L, Guo C, Liu L, Jiao D, Sun Z, et al. TTN/OBSCN ‘Double-Hit’ Predicts Favourable Prognosis, ‘Immune-Hot’ Subtype and Potentially Better Immunotherapeutic Efficacy in Colorectal Cancer. J Cell Mol Med (2021) 25(7):3239–51. doi: 10.1111/jcmm.16393
48. Cohen R, Colle R, Pudlarz T, Heran M, André T. Immune Checkpoint Inhibition in Metastatic Colorectal Cancer Harboring Microsatellite Instability or Mismatch Repair Deficiency. Cancers (2021) 13(5):1149. doi: 10.3390/cancers13051149
49. Cohen R, Rousseau B, Vidal J, Colle R, Diaz L, André T. Immune Checkpoint Inhibition in Colorectal Cancer: Microsatellite Instability and Beyond. Targeted Oncol (2020) 15(1):11–24. doi: 10.1007/s11523-019-00690-0
50. Chen E, Jonker D, Loree J, Kennecke H, Berry S, Couture F, et al. Effect of Combined Immune Checkpoint Inhibition vs Best Supportive Care Alone in Patients With Advanced Colorectal Cancer: The Canadian Cancer Trials Group Co. 26 Study JAMA Oncol (2020) 6(6):831–8. doi: 10.1001/jamaoncol.2020.0910
51. Schrock AB, Ouyang C, Sandhu J, Sokol E, Jin D, Ross JS, et al. Tumor Mutational Burden is Predictive of Response to Immune Checkpoint Inhibitors in MSI-High Metastatic Colorectal Cancer. Ann Oncol (2019) 30:1096–103. doi: 10.1093/annonc/mdz134
52. Diaz L, Marabelle A, Kim TW, Geva R, Cutsem EV, André T, et al. 386pefficacy of Pembrolizumab in Phase 2 KEYNOTE-164 and KEYNOTE-158 Studies of Microsatellite Instability High Cancers. Ann Oncol (2017) 28(suppl_5). doi: 10.1093/annonc/mdx367.020
53. Prasad V, Kaestner V, Mailankody S. Cancer Drugs Approved Based on Biomarkers and 614 Not Tumor Type-FDA Approval of Pembrolizumab for Mismatch Repair-Deficient Solid 615 Cancers. JAMA Oncol (2018) 4(2):157–8. doi: 10.1001/jamaoncol.2017.4182
54. Wu B, Tao L, Yang D, Li W, Xu H, He Q. Development of an Immune Infiltration-Related Eight-Gene Prognostic Signature in Colorectal Cancer Microenvironment. BioMed Res Int (2020) 2020:2719739. doi: 10.1155/2020/2719739
Keywords: Colorectal cancer, PLOD3, biomarker, prognosis, immune therapy
Citation: Shi J, Bao M, Wang W, Wu X, Li Y, Zhao C and Liu W (2021) Integrated Profiling Identifies PLOD3 as a Potential Prognostic and Immunotherapy Relevant Biomarker in Colorectal Cancer. Front. Immunol. 12:722807. doi: 10.3389/fimmu.2021.722807
Received: 09 June 2021; Accepted: 08 September 2021;
Published: 27 September 2021.
Edited by:
Hubing Shi, Sichuan University, ChinaReviewed by:
Si-Cong Ma, Southern Medical University, ChinaYuyan Zhu, The First Affiliated Hospital of China Medical University, China
Yanjie Zhao, Qingdao University, China
Copyright © 2021 Shi, Bao, Wang, Wu, Li, Zhao and Liu. This is an open-access article distributed under the terms of the Creative Commons Attribution License (CC BY). The use, distribution or reproduction in other forums is permitted, provided the original author(s) and the copyright owner(s) are credited and that the original publication in this journal is cited, in accordance with accepted academic practice. No use, distribution or reproduction is permitted which does not comply with these terms.
*Correspondence: Changdong Zhao, bHlnemNkemNkQDE2My5jb20=; Weiwei Liu, aHVhc2hhbnZpdmlhbkAxMjYuY29t