 Ying Luo1*
 Ying Xue2
 Liyan Mao1Qun Lin1Guoxing Tang1Huijuan Song1Wei Liu1
 Shutao Tong1*Hongyan Hou1*Min Huang1*Renren Ouyang1*
 Feng Wang1*
 Ziyong Sun1*
- 1Department of Laboratory Medicine, Tongji Hospital, Tongji Medical College, Huazhong University of Science and Technology, Wuhan, China
- 2Department of Immunology, School of Basic Medicine, Tongji Medical College, Huazhong University of Science and Technology, Wuhan, China
Background: Rapid and effective discrimination between active tuberculosis (ATB) and latent tuberculosis infection (LTBI) remains a challenge. There is an urgent need for developing practical and affordable approaches targeting this issue.
Methods: Participants with ATB and LTBI were recruited at Tongji Hospital (Qiaokou cohort) and Sino-French New City Hospital (Caidian cohort) based on positive T-SPOT results from June 2020 to January 2021. The expression of activation markers including HLA-DR, CD38, CD69, and CD25 was examined on Mycobacterium tuberculosis (MTB)-specific CD4+ T cells defined by IFN-γ, TNF-α, and IL-2 expression upon MTB antigen stimulation.
Results: A total of 90 (40 ATB and 50 LTBI) and another 64 (29 ATB and 35 LTBI) subjects were recruited from the Qiaokou cohort and Caidian cohort, respectively. The expression patterns of Th1 cytokines including IFN-γ, TNF-α, and IL-2 upon MTB antigen stimulation could not differentiate ATB patients from LTBI individuals well. However, both HLA-DR and CD38 on MTB-specific cells showed discriminatory value in distinguishing between ATB patients and LTBI individuals. As for developing a single candidate biomarker, HLA-DR had the advantage over CD38. Moreover, HLA-DR on TNF-α+ or IL-2+ cells had superiority over that on IFN-γ+ cells in differentiating ATB patients from LTBI individuals. Besides, HLA-DR on MTB-specific cells defined by multiple cytokine co-expression had a higher ability to discriminate patients with ATB from LTBI individuals than that of MTB-specific cells defined by one kind of cytokine expression. Specially, HLA-DR on TNF-α+IL-2+ cells produced an AUC of 0.901 (95% CI, 0.833–0.969), with a sensitivity of 93.75% (95% CI, 79.85–98.27%) and specificity of 72.97% (95% CI, 57.02–84.60%) as a threshold of 44% was used. Furthermore, the performance of HLA-DR on TNF-α+IL-2+ cells for differential diagnosis was obtained with validation cohort data: 90.91% (95% CI, 72.19–97.47%) sensitivity and 68.97% (95% CI, 50.77–82.73%) specificity.
Conclusions: We demonstrated that HLA-DR on MTB-specific cells was a potentially useful biomarker for accurate discrimination between ATB and LTBI.
Introduction
Tuberculosis (TB), caused by Mycobacterium tuberculosis (MTB) infection, remains a lethal infectious disease that needs to be paid more attention globally (1–3). It was reported that there were still an estimated 10 million cases and nearly 1.4 million deaths of the disease in 2019 (4). The one main hurdle in controlling TB is the difficulty in differentiating active TB (ATB) from latent TB infection (LTBI) (5–8). Delayed ATB identification would enhance TB transmission and hamper the global End TB strategy (9, 10). Therefore, the development of tools for discrimination between ATB and LTBI would be a priority in the global effort to combat this disease (11, 12).
Pathogen detections including smear microscopy and mycobacterial culture were applied widely in the TB diagnosis field. However, the drawbacks of these conventional tests included limited sensitivity and length of time consumed (13, 14). Although a rapid diagnosis has been enhanced by various molecular techniques such as GeneXpert MTB/RIF and GeneXpert MTB/RIF Ultra (15–20), these tests also showed unsatisfactory utility, especially for paucibacillary cases (21–24). Interferon gamma release assays, including T-SPOT.TB (T-SPOT) and QuantiFERON-TB Gold In-Tube (QFT-GIT), were widely used for identifying MTB infection (25–28). Nevertheless, these two tests were not useful in distinguishing ATB from LTBI (29–31). Moreover, a variety of host biomarkers identified by omics including transcriptome (32–34), proteome (35, 36), and metabolome (37–39) have been proposed as potential biomarkers for diagnosing MTB infection. Howbeit, few studies validated their actual benefit in various areas with different demographic, ethnic settings, as well as TB prevalence. Besides, high operating costs and infrastructural requirements hinder their use in resource-constrained settings. Hence, there is an imperative need to seek an approach with good performance based on existing technology platforms.
Previous studies showed that MTB-specific T-cell activation might associate with MTB antigen load (40, 41). Several publications had denoted the potential of antigen-specific HLA-DR and CD38 in TB diagnosis (41, 42). Notwithstanding, further validation for these investigations, especially in different populations, is needed to get the most promising biomarkers a step closer to clinical translation. Meanwhile, T-cell activation could reflect by multiple markers including HLA-DR, CD38, CD69, and CD25. HLA-DR is usually highly expressed on the surface of T cells in advanced stages of activation as one kind of human class II major histocompatibility complex antigen (43–45). CD38 is a type II transmembrane glycoprotein that is extensively expressed on cells of hematopoietic and non-hematopoietic lineage (46). It is downregulated in resting memory cells and elevates in activated cells (45, 47). CD69 acts as a costimulatory molecule for T-cell activation and proliferation (48). It is one of the early markers upregulated after T-cell activation (45, 49–51). CD25, as α chain of IL-2 receptor, plays a key role in responsiveness to IL-2, enabling T lymphocyte activation and further IL-2 production (45, 52). Different activation biomarkers may have inconsistent performance in the diagnosis of TB. Besides, CD27 acts as a differentiation marker expressed on T cells as a member of the TNF receptor family (53). It was reported that the decreased expression of this marker denoted a conversion of T cells towards effector memory phenotype (54). Several previous studies have found that CD27 expression on MTB-specific cells decreased in ATB patients (40, 55, 56), suggesting its potential in TB diagnostics. Moreover, the value of the combination of various activation and differentiation biomarkers for TB diagnostics has not been adequately elaborated. Therefore, the issue is needed to be clarified. Meanwhile, MTB-specific T cells could represent by multiple cytokine secretion profiles including IFN-γ, TNF-α, and IL-2 upon MTB antigen stimulation. Thus, there is urgent need to identify appropriate combination for TB diagnosis with optimal performance. The present study evaluated and validated the potential utility of various activation and differentiation markers on different MTB-specific cells for TB diagnosis.
Methods
Study Design
The present study was carried out between June 2020 and January 2021. Participants were recruited at Tongji Hospital (Qiaokou cohort, the largest tertiary hospital in central China with 5500 beds) and Sino-French New City Hospital (Caidian cohort, a branch hospital of Tongji Hospital with 1600 beds), respectively. Subjects in two cohorts were selected based on positive T-SPOT results. On the basis of clinical and laboratory assessments, participants were classified as patients with ATB and individuals with LTBI. ATB patients were diagnosed by positive mycobacterial culture and/or GeneXpert MTB/RIF with supportive symptoms and radiological findings of ATB. LTBI individuals were identified by positive T-SPOT result in the absence of ATB evidence. Exclusion criteria for the study included (1) having received anti-TB therapy for more than 2 weeks and (2) being younger than 17 years old. This study was reviewed and approved by the committee of Tongji Hospital, Tongji Medical College, Huazhong University of Science and Technology.
T-SPOT Assay
Heparin-anticoagulated blood samples were collected for performing T-SPOT assay (Oxford Immunotec, Oxford, UK). The operation was conducted in accordance with manufacturer’s instruction. Briefly, peripheral blood mononuclear cells (PBMCs) were separated by Ficoll-Hypaque gradient centrifugation. Then, the isolated PBMCs (2.5 × 10⁵) were added to 96-well plates precoated with antibody against IFN-γ. There were four wells each participant: medium (negative control), early secreted antigenic target 6 (ESAT-6), culture filtrate protein 10 (CFP-10), and phytohemagglutinin (positive control). Cells were incubated for 16–20 h at 37°C with 5% CO2 and developed using anti-IFN-γ antibody conjugate with substrate to detect the presence of IFN-γ secreted cells. Spot-forming cells were counted with an automated enzyme-linked immunospot reader (CTL Analyzers, Cleveland, OH, USA). The test result was regarded positive if ESAT-6 and/or CFP-10 spot number minus negative control spot number ≥ 6. The test result was regarded negative if both ESAT-6 spot number minus negative control spot number and CFP-10 spot number minus negative control spot number ≤ 5. Results were considered undetermined if the spot number in phytohemagglutinin well was <20 or spot number in the medium well was >10.
Detection of Markers on MTB-Specific CD4+ Cells
PBMCs were stimulated with peptide ESAT-6 (2 μg/ml) and CFP-10 (2 μg/ml) for 18 h at 37°C with 5% CO2. Briefly, PBMCs were counted and 1 × 10⁶ cells were added to the well. Brefeldin A was added to the mixture 6 h before staining of the cells. Post incubation, PBMCs were first stained with Fixable Viability Stain 700 (BD Pharmingen) to discriminate live from dead cells, followed by appropriate surface marker staining. Cell surface staining was performed on PBMCs using the following anti-human monoclonal antibodies: anti-CD4-APC-Cy7, anti-HLA-DR-PerCp 5.5, anti-CD38-BV510, anti-CD69-BV421, anti-CD25-APC, and anti-CD27-PE-Cy7. For intracellular staining, the cells were fixed and permeabilized with Fixation and Permeabilization Buffer (BD Biosciences). Intracellular cytokine staining was conducted using the following anti-human monoclonal antibodies: anti-IFN-γ-BV605, anti-TNF-α-FITC, and anti-IL-2-PE. The staining was performed at 4°C, and the cells were stained for 30 min. The gating strategy was shown in Figure 1. The information of used antibodies was presented in Supplementary Table S1. Isotype controls with irrelevant specificities were included as negative controls. After washing, the pellets were resuspended in 200 μl staining buffer and analyzed with FACSCanto II flow cytometer (BD Biosciences, San Jose, CA). The flow data were analyzed using Flowjo software version 10.6.2 (TreeStar, Ashland, OR).
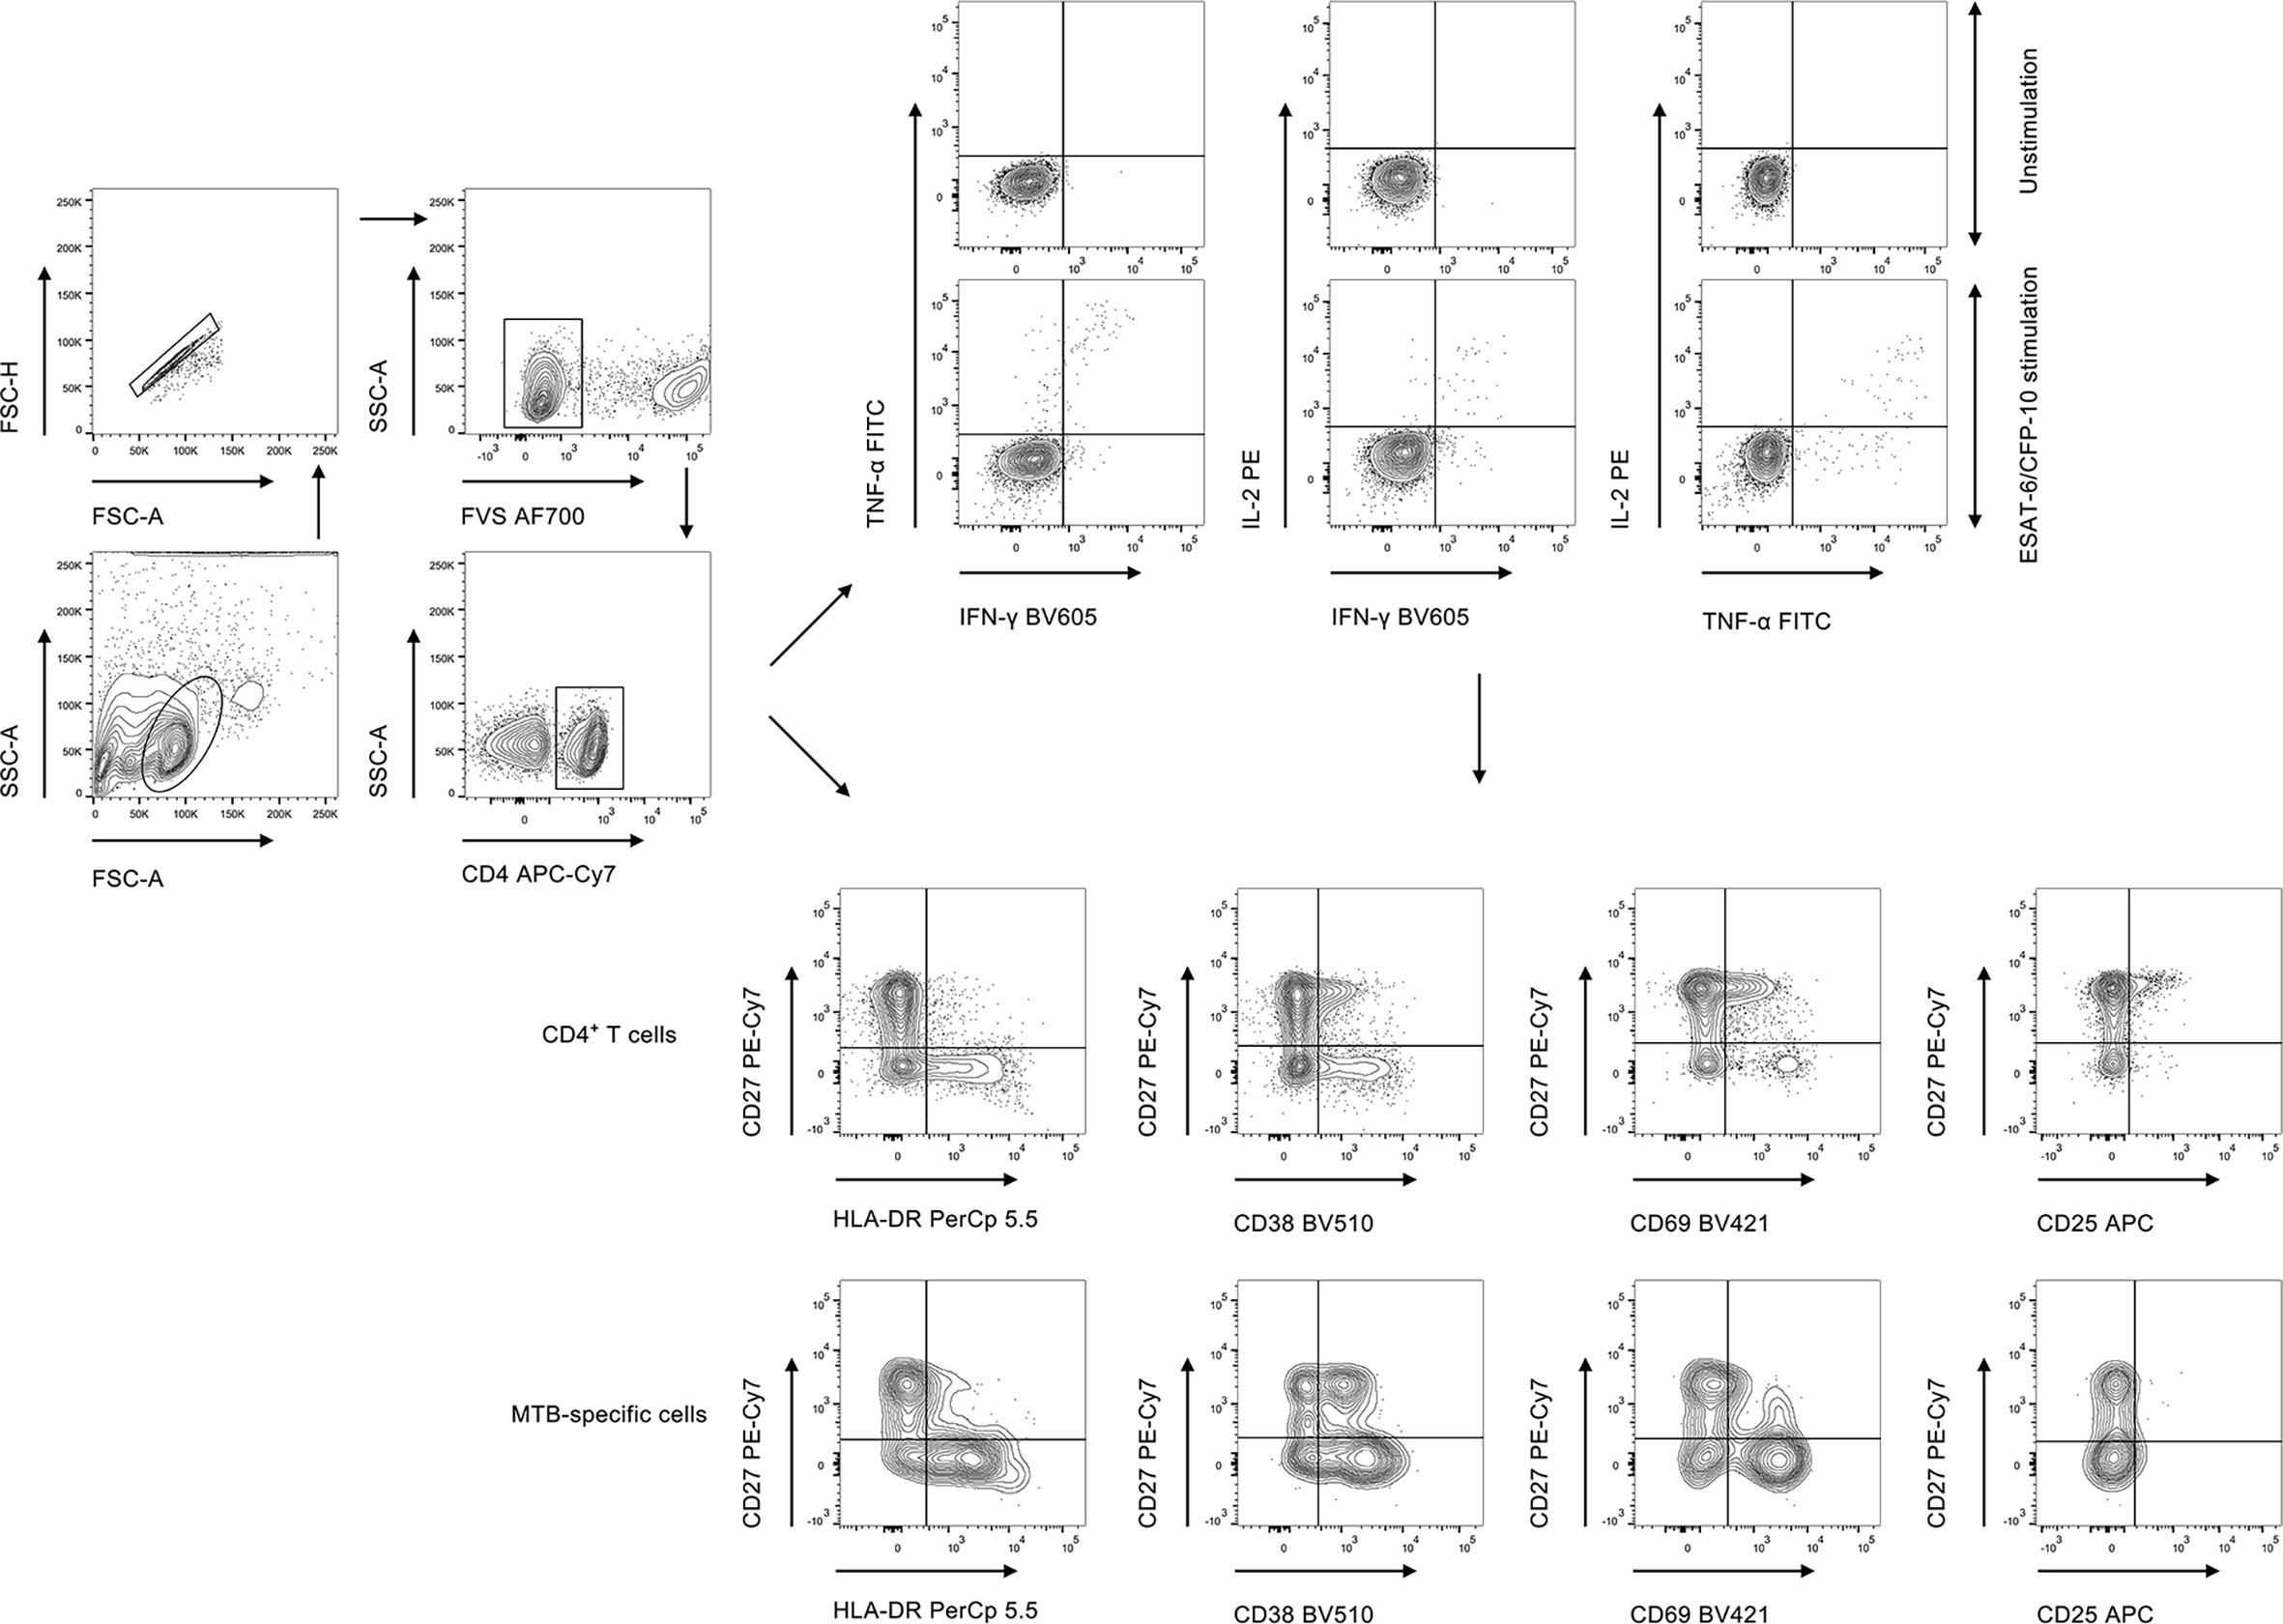
Figure 1 The gating strategies for cytokine expression and activation phenotype in the current study. FVS, fixable viability stain; MTB, Mycobacterium tuberculosis.
The background in the unstimulated tube was subtracted when reporting the percentage of cytokine-producing cells in the stimulated tube. MTB-specific cells were determined by cytokine production including IFN-γ, TNF-α, and IL-2. Responders were defined as individuals with relative counts of cytokine-producing CD4+ T cells (more than 15 events were recorded) in MTB antigen-stimulated condition that were significantly higher than the unstimulated control (a fold change of more than 3). The 15-event cut-off for phenotypic analysis was applied to each cytokine combination. Phenotype analysis for MTB-specific CD4+ T cells was only performed on responders.
Statistical Analysis
Continuous variables were described using median (interquartile range) or means ± standards deviation (SD). Categorical variables were expressed as number (%). Comparison between various groups was performed using Mann-Whitney U test for continuous variables, and Chi-square test or Fisher’s exact test for categorical variables. A two-side test with P < 0.05 was considered statistically significant.
The diagnostic performance of various biomarkers was assessed by receiver operator characteristics (ROC) curve analysis. Area under the curve (AUC), sensitivity, specificity, positive predictive value (PPV), negative predictive value (NPV), positive likelihood ratio (PLR), negative likelihood ratio (NLR), and accuracy, together with their 95% confidence intervals (CI), were determined. The comparison between various ROC AUCs was performed by using z test with the procedure of Delong et al. (57). Data analysis was performed using GraphPad Prism version 8 (GraphPad Software, San Diego, CA, USA), R 4.0.2 program (R Core Team), SPSS version 25.0 (SPSS, Inc., Chicago, IL, USA), and MedCalc version 11.6 (MedCalc, Mariakerke, Belgium).
Results
Demographic and Clinical Characteristics of Study Participants
Out of 90 subjects from Qiaokou cohort, 40 were ATB patients and the other 50 were LTBI individuals. Among 64 cases from the Caidian cohort, 29 were diagnosed as ATB and 35 were diagnosed as LTBI. Participants had a mean age of around 60 years and more than half were males. There was no significant difference between ATB patients and LTBI individuals in distribution of age and gender. An overview of the clinical and demographic characteristics of recruited participants was presented in Table 1.
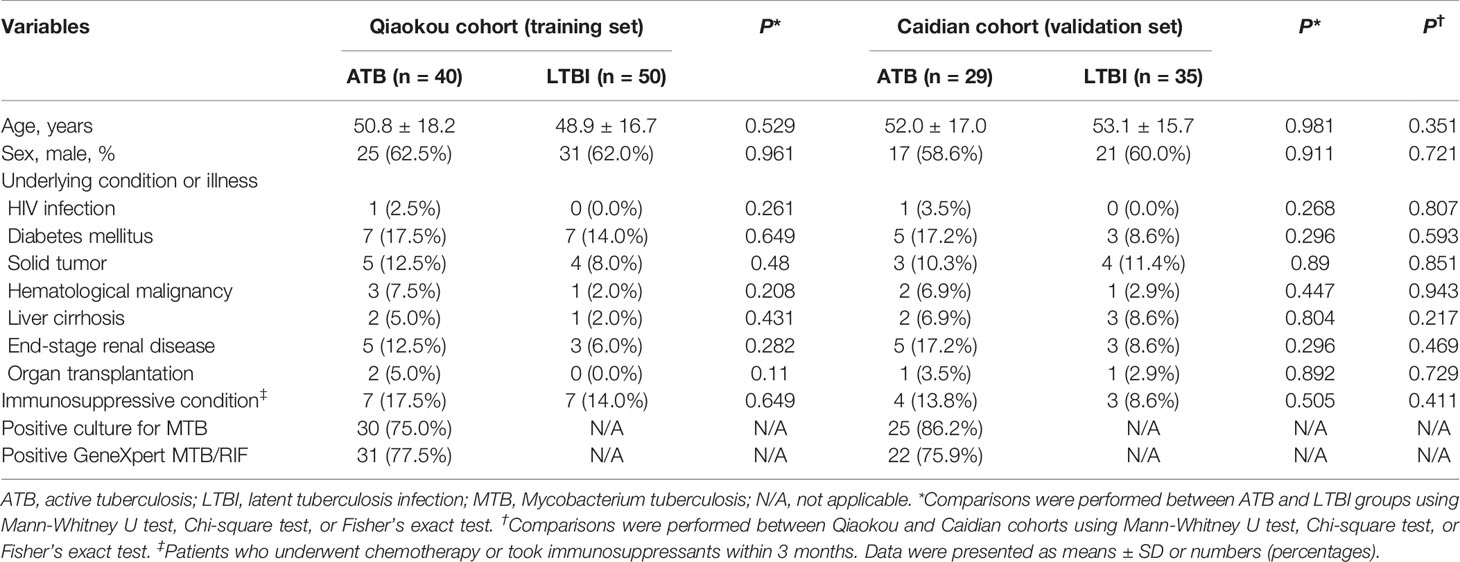
Table 1 Demographic and clinical characteristics of study population.
Cytokine Expression Patterns Upon MTB Antigen Stimulation for Distinguishing ATB From LTBI
We measured the expression of Th1 cytokines including IFN-γ, TNF-α, and IL-2 secreted by CD4+ T cells upon MTB antigen stimulation and analyzed the value of expression profile for distinguishing ATB patients from LTBI individuals. It was observed that statistical difference existed in some co-expression patterns between patients with ATB and LTBI individuals (Figure 2A). When we assessed the ability of cytokine secretion patterns to diagnose ATB disease using ROC curve analysis, it was found that the AUCs produced by all candidates were lower than 0.7 (Figure 2B).
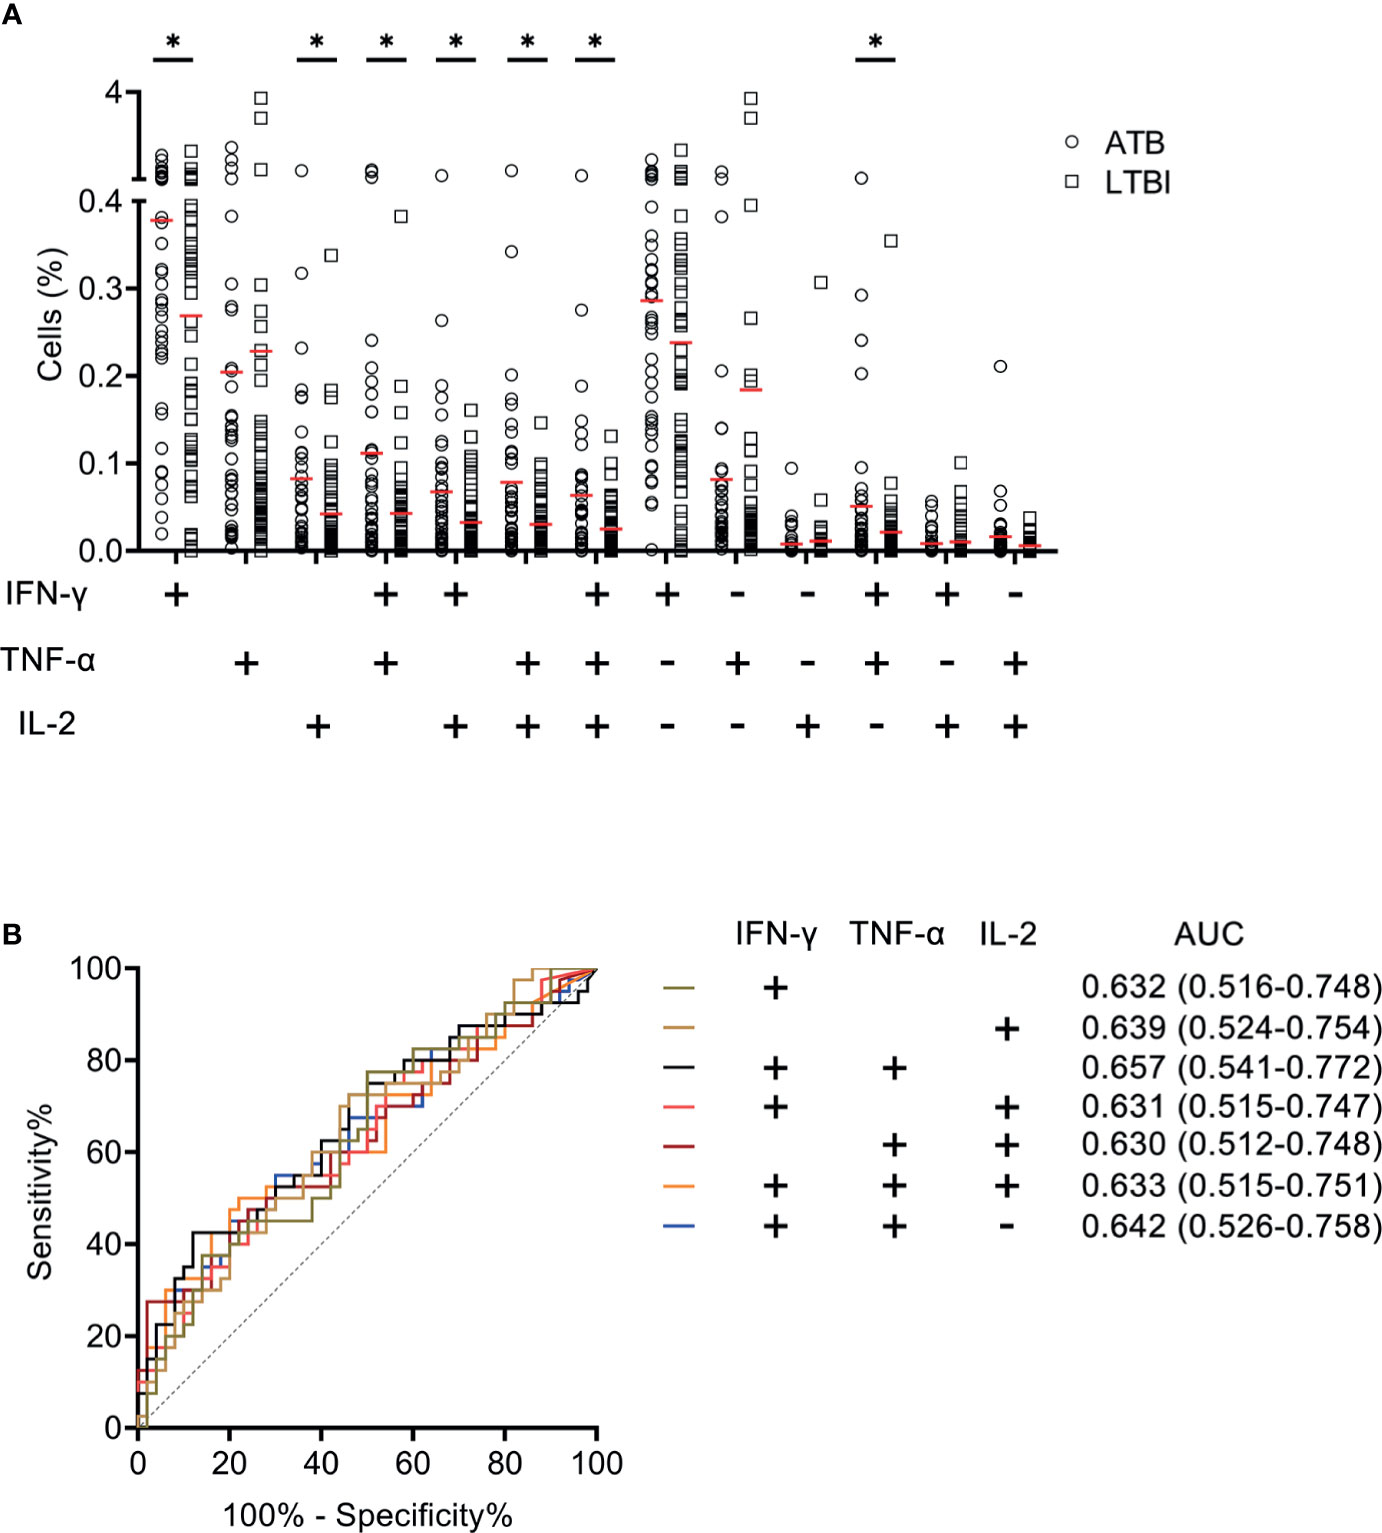
Figure 2 The performance of various cytokine expression pattern upon MTB antigen stimulation in distinguishing ATB patients from LTBI individuals in Qiaokou cohort. (A) Aligned dot plots showing the results of the expression pattern of IFN-γ, TNF-α, and IL-2 upon MTB antigen stimulation in ATB patients and LTBI individuals. Horizontal lines indicate the medians. (B) ROC analysis showing the performance of various cytokine expression pattern in discriminating ATB patients from LTBI individuals. *P < 0.05 (Mann-Whitney U test). MTB, Mycobacterium tuberculosis; ATB, active tuberculosis; LTBI, latent tuberculosis infection; AUC, area under the curve.
Activation Markers on CD4+ T Cells for Discriminating ATB From LTBI
The utility of activation markers including HLA-DR, CD38, CD69, and CD25 on CD4+ T cells for discriminating ATB patients from LTBI individuals was evaluated. The expression of CD38 and CD25 in ATB patients was significantly higher than that in LTBI individuals, while no statistical difference was observed in HLA-DR and CD69 expression between these two groups (Figure 3A). ROC curve analysis showed that the AUCs were 0.699 (95% CI, 0.589–0.809) for CD25 and 0.625 (95% CI, 0.508–0.742) for CD38 (Figure 3B). When combining with CD27, no improved performance was obtained for the purpose of distinguishing ATB patients from LTBI individuals (Figure 3C).
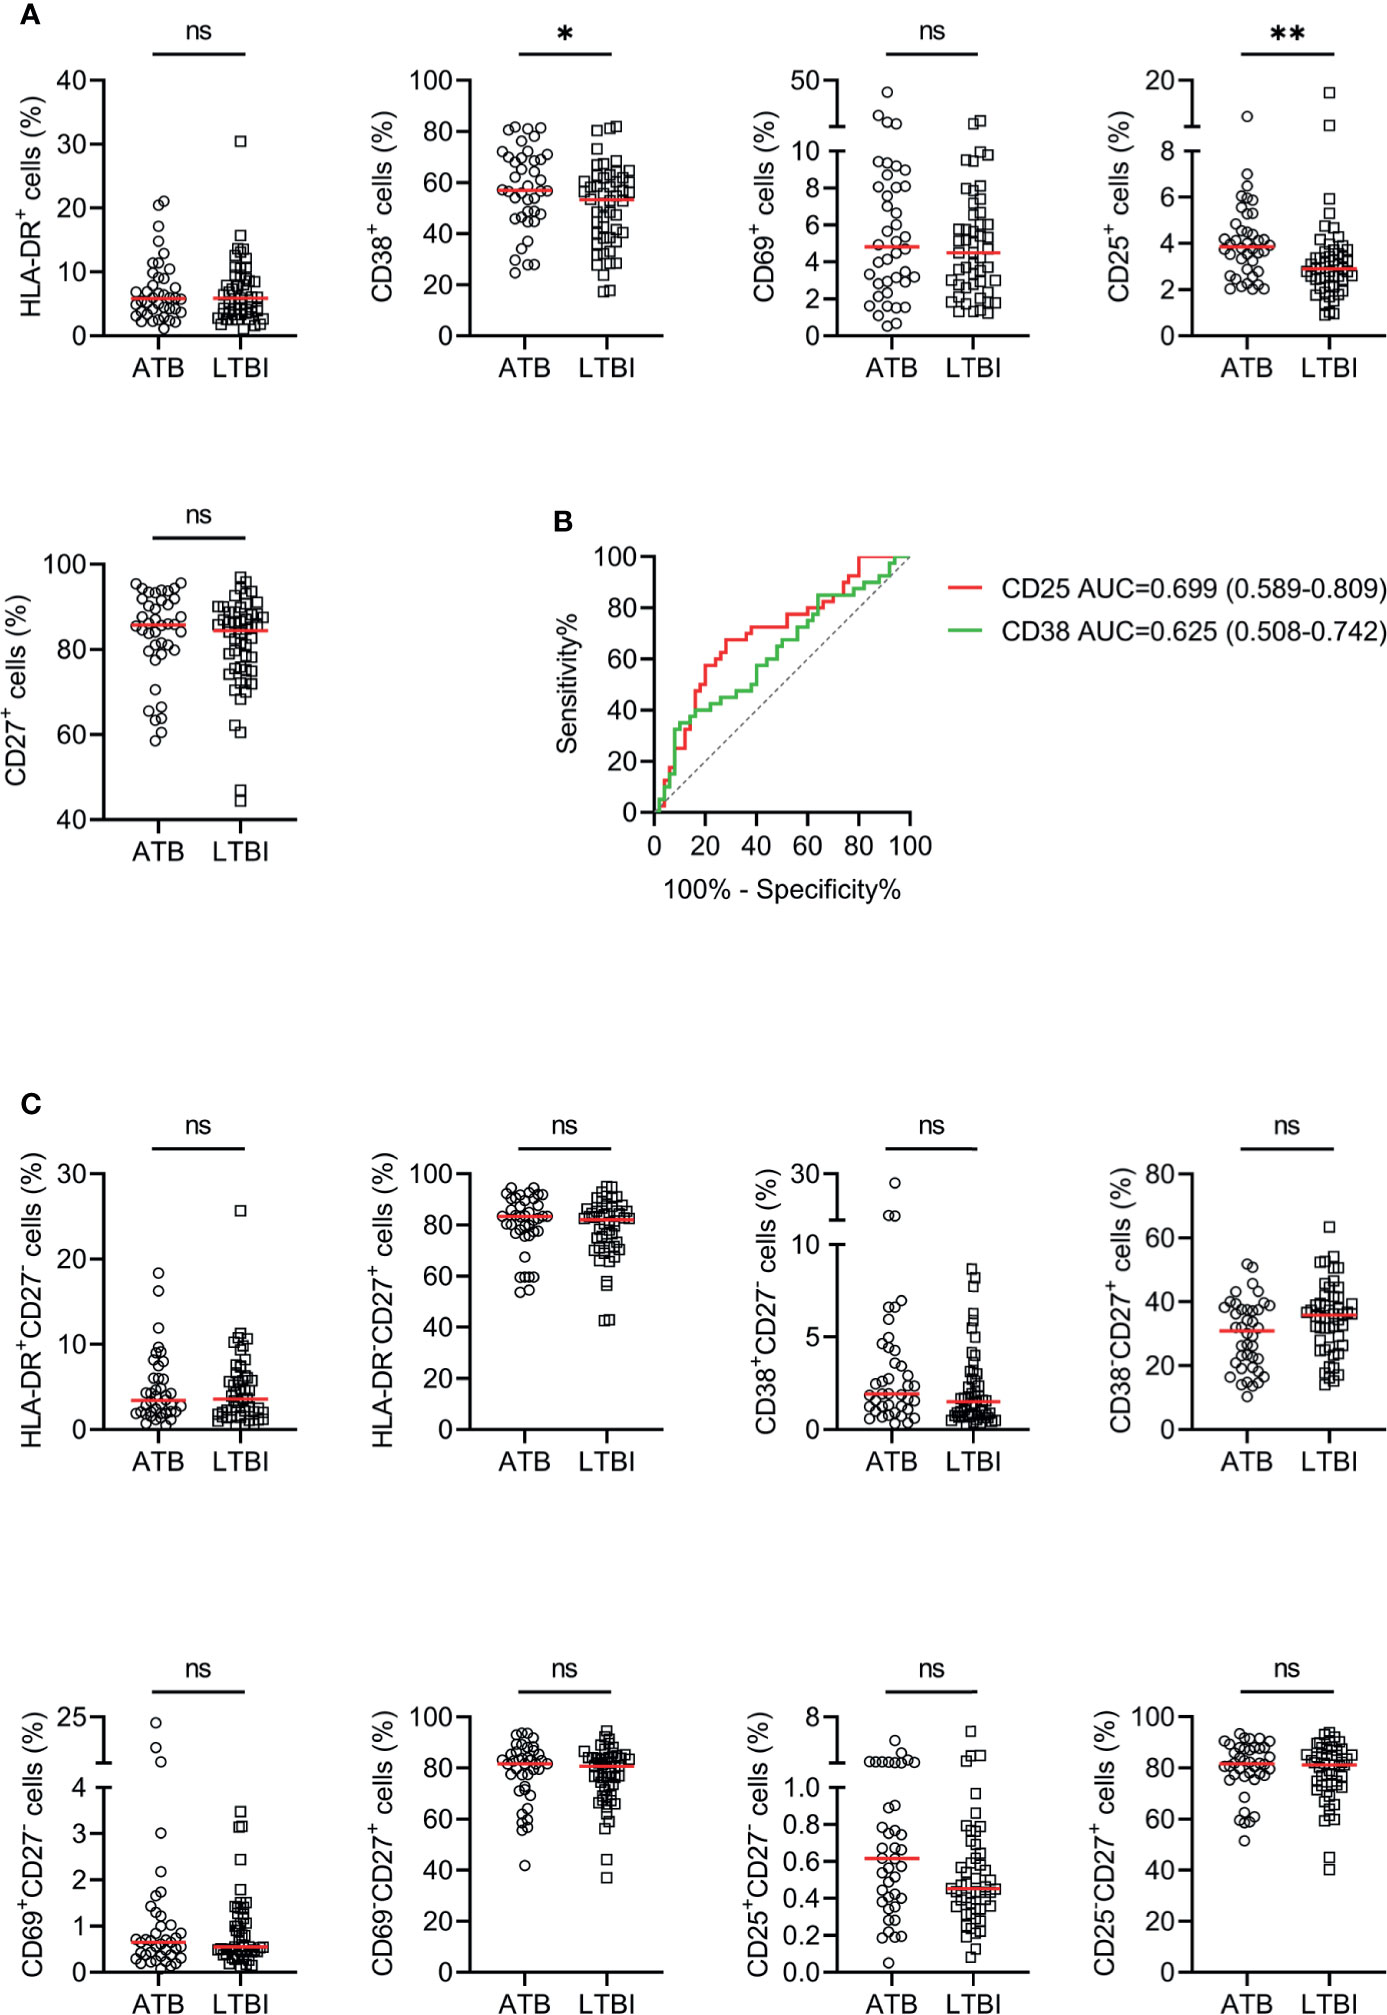
Figure 3 The performance of various markers on CD4+ T cells in distinguishing ATB patients from LTBI individuals in Qiaokou cohort. (A) Scatter dot plots showing the results of the expression of HLA-DR, CD38, CD69, CD25, and CD27 on CD4+ T cells in ATB patients and LTBI individuals. Horizontal lines indicate the medians. (B) ROC analysis showing the performance of the expression of CD38 and CD25 on CD4+ T cells in discriminating ATB patients from LTBI individuals. (C) Scatter dot plots showing the results of the proportions of HLA-DR+CD27- cells, HLA-DR-CD27+ cells, CD38+CD27- cells, CD38-CD27+ cells, CD25+CD27- cells, and CD25-CD27+ cells of CD4+ T cells in ATB patients and LTBI individuals. Horizontal lines indicate the medians. *P < 0.05, **P < 0.01, ns, no significance (Mann-Whitney U test). MTB, Mycobacterium tuberculosis; ATB, active tuberculosis; LTBI, latent tuberculosis infection; AUC, area under the curve.
Activation Markers on MTB-Specific Cells for Differentiating ATB From LTBI
We examined the expression levels of activation markers on MTB-specific cells determined by Th1 cytokine expression. Obvious difference was found in HLA-DR and CD38 expression on MTB-specific cells between ATB patients and LTBI individuals, while no significant difference was observed in CD69 and CD25 expression between these two groups (Figure 4). ATB patients showed significantly higher expression of HLA-DR and CD38, especially on polyfunctional MTB-specific cells, compared to LTBI individuals (Figures 4A, C). Specially, when a threshold was set as 44%, HLA-DR on TNF-α+IL-2+ cells was able to discriminate ATB patients from LTBI individuals with a sensitivity of 93.75% (95% CI, 79.85–98.27%) and specificity of 72.97% (95% CI, 57.02–84.60%) (Table 2 and Figure 4B). The comparison between AUCs showed that the performance of HLA-DR on TNF‐α+ cells was superior to that on IFN‐γ+ cells (Z test, P < 0.05). Moreover, HLA‐DR on IFN‐γ+TNF‐α+, IFN‐γ+IL-2+, and TNF‐α+IL-2+ cells had superiority over that on IFN‐γ+ cells in differentiating ATB from LTBI (Z test, P < 0.05). Meanwhile, it was observable that CD27 expression on MTB-specific cells was significantly lower in ATB patients to that in LTBI individuals (Figures 4G, H). The value of combination of activation markers and CD27 was also analyzed for differential diagnosis purpose. However, there was no added benefit observed (Supplementary Figure S1).
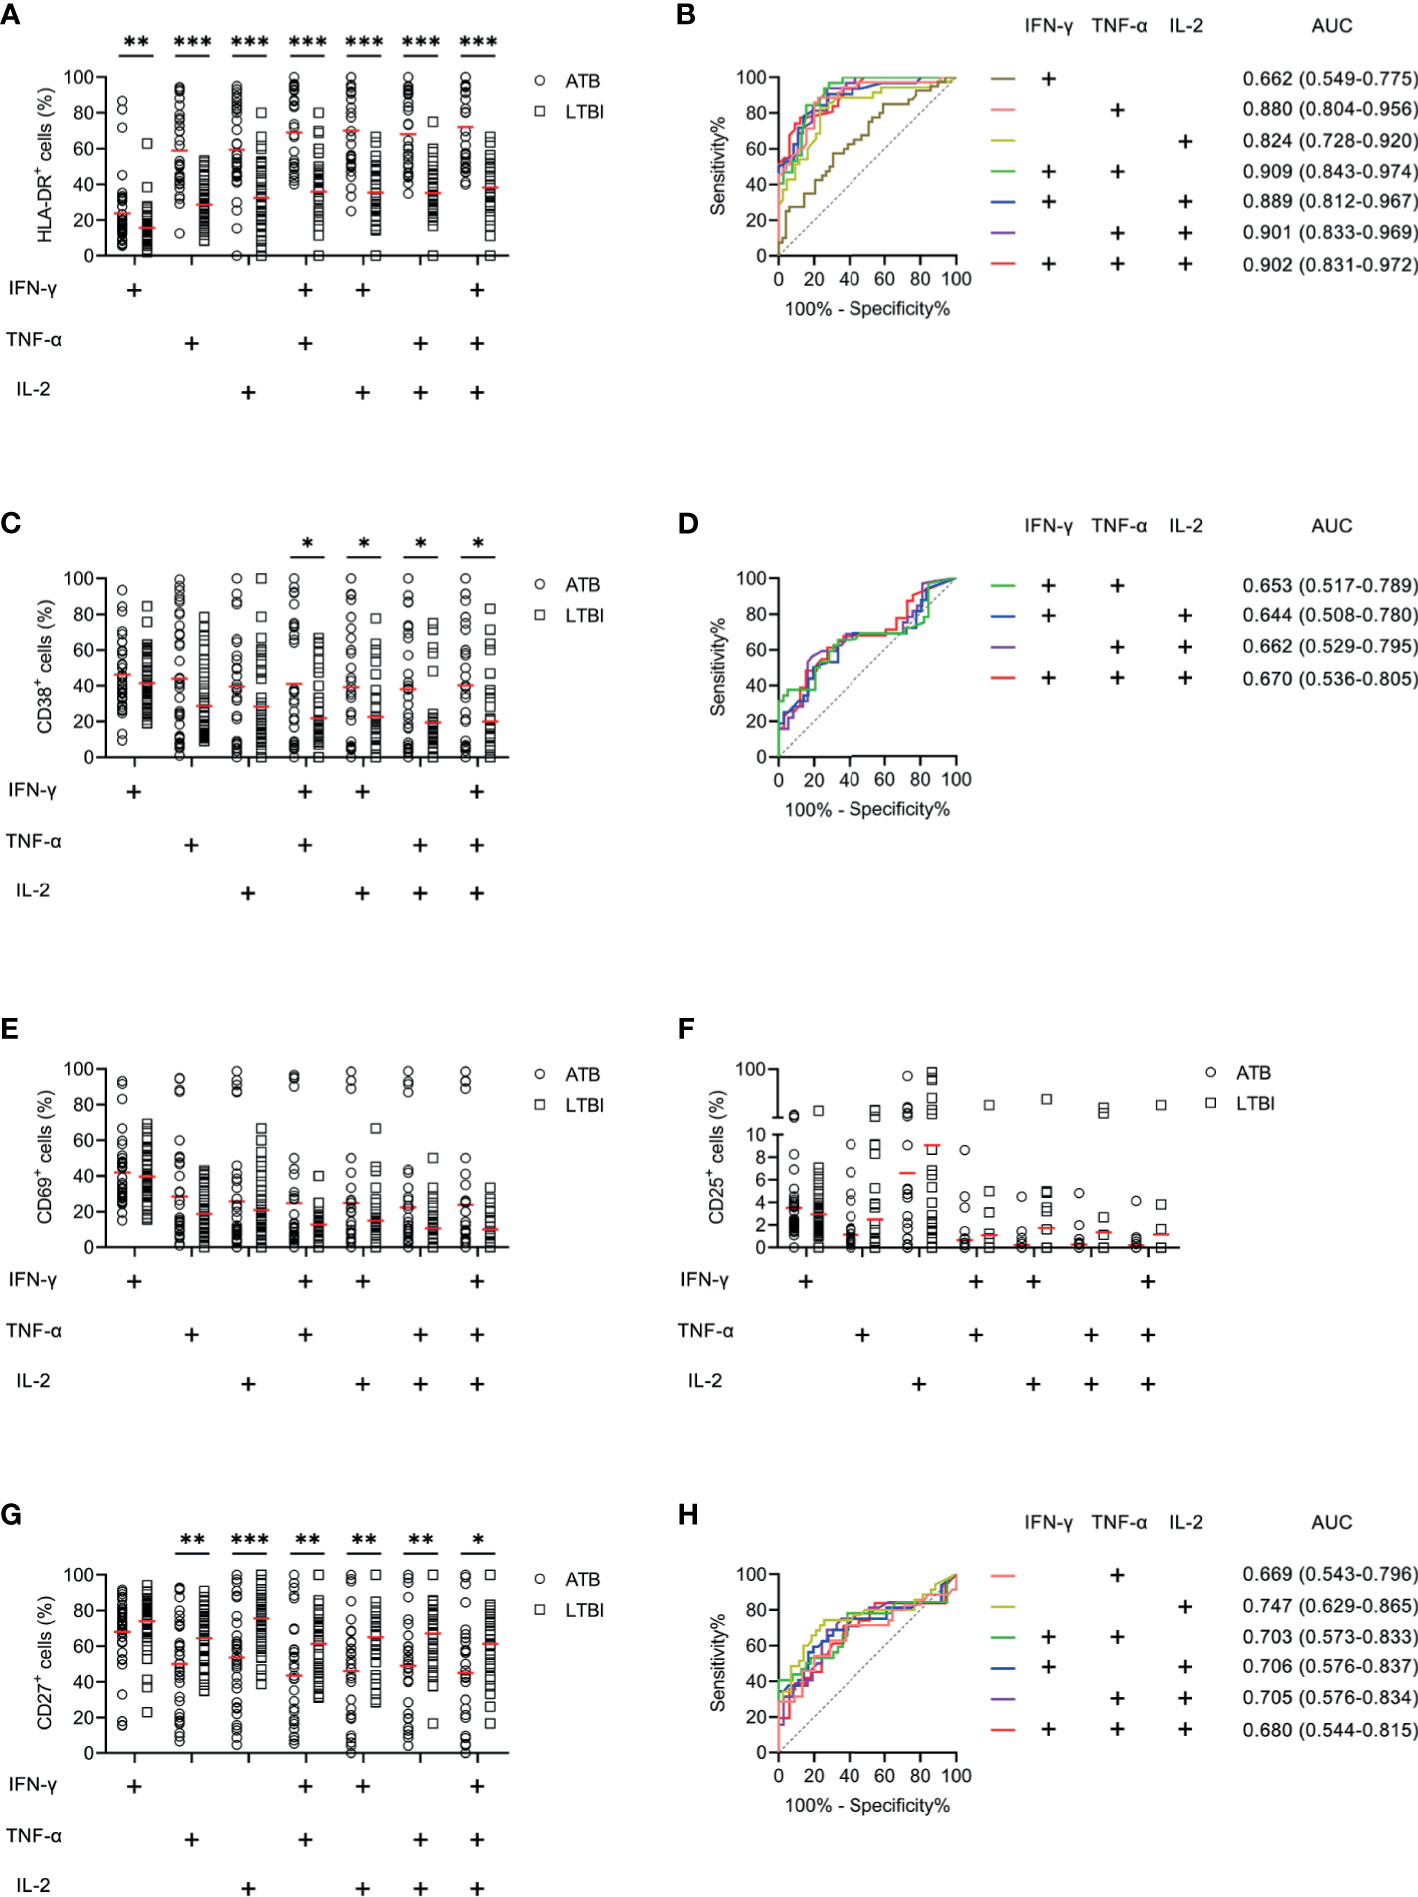
Figure 4 The performance of activation markers on MTB-specific CD4+ T cells in distinguishing ATB patients from LTBI individuals in Qiaokou cohort. (A) Aligned dot plots showing the results of HLA-DR expression on MTB-specific cells in ATB patients and LTBI individuals. Horizontal lines indicate the medians. (B) ROC analysis showing the performance of HLA-DR expression on MTB-specific cells in discriminating ATB patients from LTBI individuals. (C) Aligned dot plots showing the results of CD38 expression on MTB-specific cells in ATB patients and LTBI individuals. Horizontal lines indicate the medians. (D) ROC analysis showing the performance of CD38 expression on MTB-specific cells in discriminating ATB patients from LTBI individuals. (E) Aligned dot plots showing the results of CD69 expression on MTB-specific cells in ATB patients and LTBI individuals. Horizontal lines indicate the medians. (F) Aligned dot plots showing the results of CD25 expression on MTB-specific cells in ATB patients and LTBI individuals. Horizontal lines indicate the medians. (G) Aligned dot plots showing the results of CD27 expression on MTB-specific cells in ATB patients and LTBI individuals. Horizontal lines indicate the medians. (H) ROC analysis showing the performance of CD27 expression on MTB-specific cells in discriminating ATB patients from LTBI individuals. *P < 0.05, **P < 0.01, ***P < 0.001 (Mann-Whitney U test). MTB, Mycobacterium tuberculosis; ATB, active tuberculosis; LTBI, latent tuberculosis infection; AUC, area under the curve.
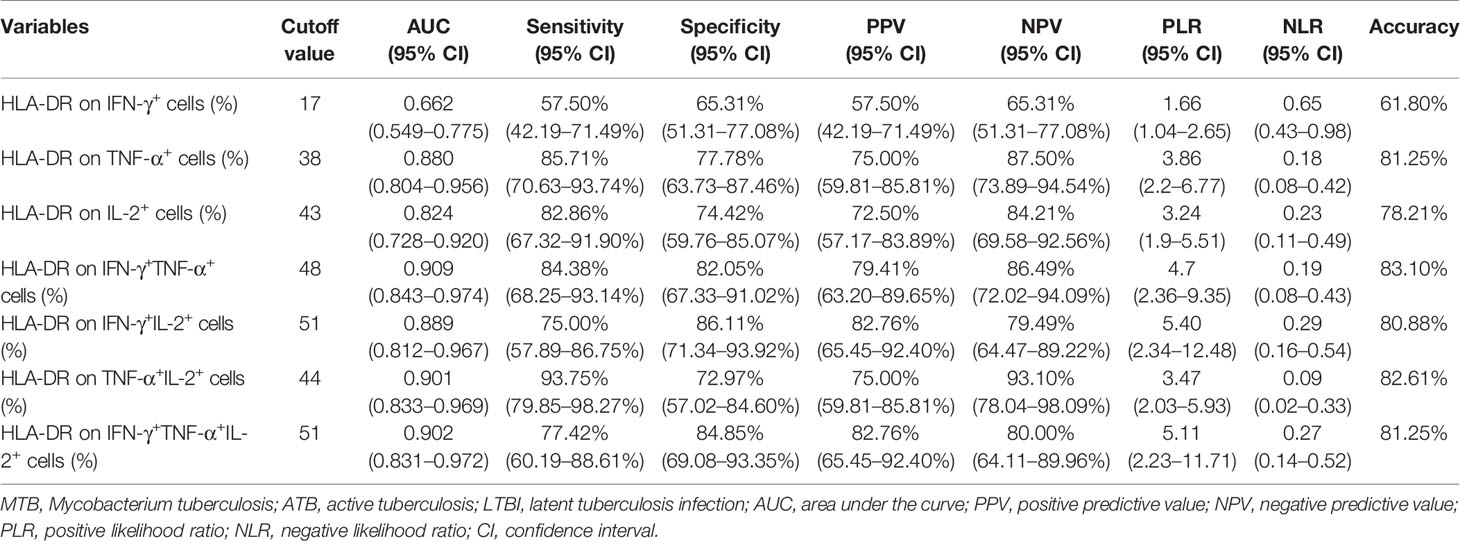
Table 2 The performance of HLA-DR on MTB-specific cells for distinguishing between ATB and LTBI in Qiaokou cohort.
Validation of Activation Markers on MTB-Specific Cells for Differential Diagnosis Between ATB and LTBI
Another blinded set (Caidian cohort) was enrolled to validate the performance of biomarkers discovered in Qiaokou cohort. Excellent performance of HLA-DR on polyfunctional MTB-specific cells was found for the differential diagnosis between ATB patients and LTBI individuals. With the threshold of 48%, the sensitivity and specificity of HLA-DR on IFN-γ+TNF-α+ cells were 82.61% (95% CI, 62.86–93.02%) and 69.70% (95% CI, 52.66–82.63%), respectively (Table 3, Figures 5A, B). Using a cut-off value of 51%, HLA-DR on IFN-γ+IL-2+ cells was able to discriminate between ATB patients and LTBI individuals with a specificity, sensitivity, and AUC of 83.33% (95% CI, 66.44–92.67%), 90.48% (95% CI, 71.09–97.35%), and 0.938 (95% CI, 0.876–1.000), respectively (Table 3 and Figures 5A, B). When a cut-off value of 44% was used, a sensitivity of 90.91% (95% CI, 72.19–97.47%) and a specificity of 68.97% (95% CI, 50.77–82.73%) were observed in HLA-DR on TNF-α+IL-2+ cells (Table 3 and Figures 5A, B). Furthermore, if using the cut-off value of 51% obtained from Qiaokou cohort, the sensitivity and specificity of HLA-DR on IFN-γ+TNF-α+IL-2+ cells were 95.00% (95% CI, 76.39–99.11%) and 82.14% (95% CI, 64.41–92.12%), respectively (Table 3 and Figures 5A, B). Meanwhile, we also analyzed the potential value of the combination of HLA-DR and CD27 for TB diagnostic issue. Consistent with Qiaokou cohort, no obvious improvement was observed after combining CD27 (Figures 5C–F). Table 3 summarized diagnostic performance of HLA-DR on MTB-specific cells when applied to the validation cohort.
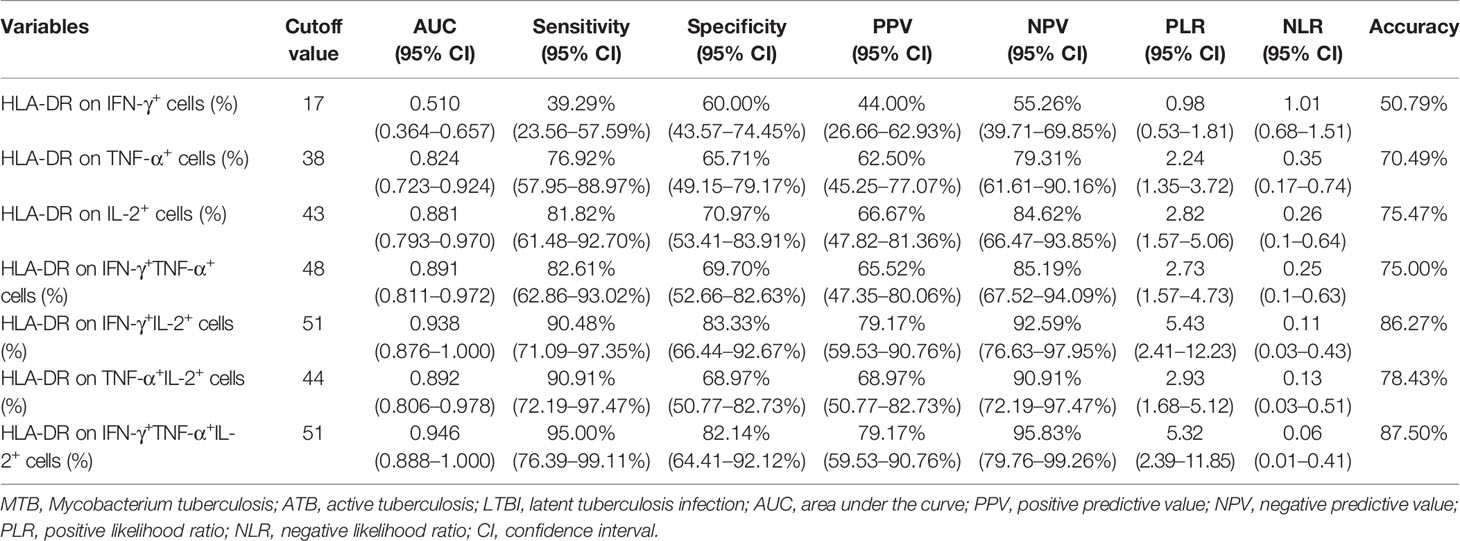
Table 3 The performance of HLA-DR on MTB-specific cells for distinguishing between ATB and LTBI in Caidian cohort.
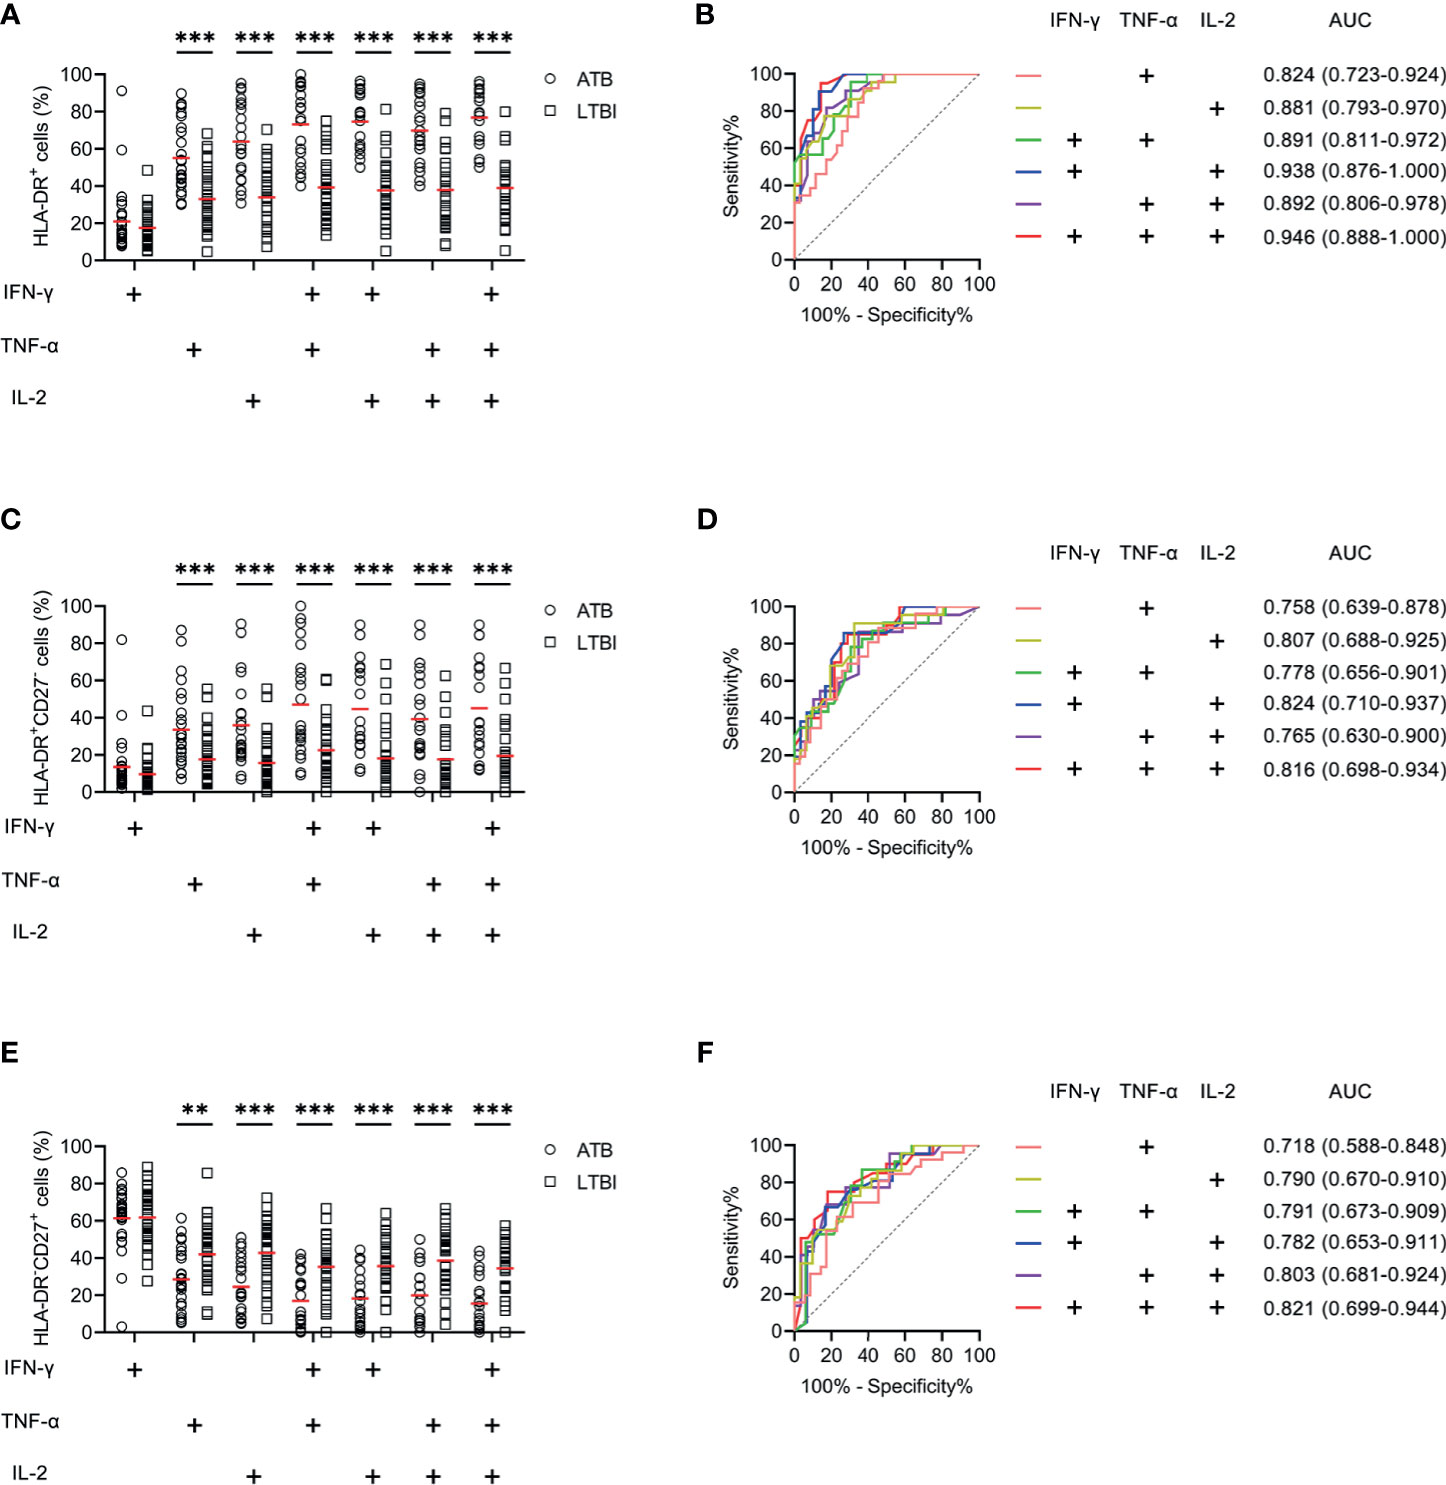
Figure 5 The performance of HLA-DR on MTB-specific cells in distinguishing ATB patients from LTBI individuals in Caidian cohort. (A) Aligned dot plots showing HLA-DR expression on MTB-specific cells in ATB patients and LTBI individuals. Horizontal lines indicate the medians. (B) ROC analysis showing the performance of HLA-DR expression on MTB-specific cells in discriminating ATB patients from LTBI individuals. (C) Aligned dot plots showing the proportions of HLA-DR+CD27- cells of MTB-specific cells in ATB patients and LTBI individuals. Horizontal lines indicate the medians. (D) ROC analysis showing the performance of the proportion of HLA-DR+CD27- cells of MTB-specific cells in discriminating ATB patients from LTBI individuals. (E) Aligned dot plots showing the proportions of HLA-DR-CD27+ cells of MTB-specific cells in ATB patients and LTBI individuals. Horizontal lines indicate the medians. (F) ROC analysis showing the performance of the proportion of HLA-DR-CD27+ cells of MTB-specific cells in discriminating ATB patients from LTBI individuals. **P < 0.01, ***P < 0.001 (Mann-Whitney U test). MTB, Mycobacterium tuberculosis; ATB, active tuberculosis; LTBI, latent tuberculosis infection; AUC, area under the curve.
Discussion
The lack of efficacious diagnostic tools poses a major challenge to control TB efforts (58, 59). Although many advances have been achieved, especially in omics field (60–62), there were some practical limitations for their clinical application, including expensive laboratory facilities and sophisticated operating procedures. Meanwhile, immunodiagnostics has received considerable attention as an alternative for discrimination of MTB infection status in recent years (63–70). Nevertheless, the identified biomarkers including proteins and cytokines in serum or plasma for diagnostic aim may not be specific for TB due to the influence brought by other immune related diseases such as infection and autoimmune diseases (71–77). Thus, an intensified search for suitable host-specific biomarkers targeting TB diagnostic purpose was urgently needed (78).
With the emergence of flow cytometry as a prominent advancement, many researchers detected makers on immune cell surface or intracellular cytokines for diagnosing infectious diseases (79–81). Some previous works showed that the immune phenotype profile was associated with MTB infection status (82). Howbeit, these evaluations might only denote the global response of the host and could not meticulously reflect the host-specific immune response to the disease. Thus, the utility of these methods is susceptible to body immunity, and their performance varies greatly in different populations, making it difficult to meet clinical diagnostic need.
Our study focused on MTB-specific cells by gating cells with Th1 cytokine secretion upon MTB antigen stimulation. It is a very small cell subset that can best reflect the host’s immune response to MTB infection. We firstly analyzed the cytokine production patterns in ATB patients and LTBI individuals. However, not as reported by previous study (83), no obvious difference was observed. Next, we simultaneously investigated the value of four activation biomarkers including HLA-DR, CD38, CD69, and CD25 on MTB-specific CD4+ T cells, for differentiating ATB patients from LTBI individuals. After ROC curve analysis, two biomarkers of activation (HLA-DR and CD38) showed discriminatory roles. Among them, HLA-DR was the better promising biomarker. Then, we compared the difference of HLA-DR on various MTB-specific cells. Interestingly, we found that the performance of HLA-DR on different MTB-specific cells defined by different cytokine combinations was inconsistent. HLA-DR on TNF-α+ or IL-2+ cells was remarkably superior to that on IFN-γ+ cells in distinguishing ATB patients from LTBI individuals. Besides, HLA-DR on polyfunctional MTB-specific cells showed a higher capability than that on MTB-specific cells defined by one cytokine secretion. These data signified the heterogeneity of MTB-specific cells, and the selection of cell subset determined the diagnostic performance of specific biomarkers. Meanwhile, an opposite trend to HLA-DR was observed in CD27 on MTB-specific cells in ATB patients and LTBI individuals. Thus, we tried to improve the efficacy for discrimination by the combination of HLA-DR with CD27. Notwithstanding, no increased or even decreased performance was obtained. Therefore, independent HLA-DR on MTB-specific cells, rather than combination with others, is more likely to be recommended as a diagnostic biomarker.
Three points should be noted: first, it was observed that HLA-DR on IFN-γ+ cells had relatively poor performance in distinguishing ATB from LTBI when comparing to that of TNF-α+ or IL-2+ cells. We found that the percentages of IFN-γ+ cells in unstimulated tubes ranged from 0.02% to 0.1%, while the percentages of TNF-α+ cells and IL-2+ cells in unstimulated tubes ranged from 0.01% to 0.04%. The background value for IFN-γ was relatively higher than that for TNF-α and IL-2. Thus, some of the IFN-γ+ cells in stimulated tubes were not MTB-specific cells. It may be one reason for the poor performance of HLA-DR on IFN-γ+ cells in differentiating ATB from LTBI. Second, the variation of HLA-DR expression in the LTBI group might be due to the different infection status. Some individuals in the LTBI group have been infected for a long time, while the others were infected with MTB recently. As indicated by previous study, some subjects with recent MTB infection would also have high HLA-DR expression on MTB-specific cells (84). Thus, another approach that could be combined with markers in the present study to improve diagnostic specificity should be developed in the future. Third, given that the increasing number of MTB antigen has been identified in recent years and the response patterns of PBMCs varied upon different antigen stimulation (85–87), the investigation targeting optimal antigen selection is needed in the future.
Several limitations should be mentioned. First, although there were two centers in the current study, the number of recruited partakers in each center was circumscribed. These biomarkers should be further validated in larger cohorts. Second, although some diseases including diabetes and tumors were involved in underlying condition of the enrolled patients in this study, further investigation is required to elucidate the influence of other diseases such as COVID-19 on the performance of these biomarkers. Finally, given the fact that the biomarkers detected in the present study were on MTB-specific cells, HLA-DR would be useless when applying to cases with few MTB-specific cells, such as T-SPOT-negative individuals (88, 89). Hence, more reasonable methods for this population should be developed in the future.
In conclusion, our study demonstrated that HLA-DR on MTB-specific cells has robust diagnostic potential for discrimination between ATB and LTBI. Notably, the detection of biomarkers discovered in the present study is amenable to the existing platforms.
Data Availability Statement
The original contributions presented in the study are included in the article/Supplementary Material. Further inquiries can be directed to the corresponding authors.
Ethics Statement
The studies involving human participants were reviewed and approved by the committee of Tongji hospital, Tongji Medical College, Huazhong University of Science and Technology. The patients/participants provided their written informed consent to participate in this study.
Author Contributions
YL designed the study. LM, QL, and GT set up the clinical cohorts at the respective hospitals. HS, LW, ST, HH, MH, and RO included patients and collected data. YL performed the main experiment. YL analyzed and interpreted the data. YL and YX did the statistical analysis. YL draft the manuscript. YL, FW, and ZS contributed to the revision of manuscript. All authors contributed to the article and approved the submitted version.
Funding
This work was funded by Graduate Innovation Fund of Huazhong University of Science and Technology (grant number 2021yjsCXCY088) and Special Foundation for National Science and Technology Basic Research Program of China (grant number 2019FY101206).
Conflict of Interest
The authors declare that the research was conducted in the absence of any commercial or financial relationships that could be construed as a potential conflict of interest.
Publisher’s Note
All claims expressed in this article are solely those of the authors and do not necessarily represent those of their affiliated organizations, or those of the publisher, the editors and the reviewers. Any product that may be evaluated in this article, or claim that may be made by its manufacturer, is not guaranteed or endorsed by the publisher.
Acknowledgments
We would like to thank all participants for contributing to this study and all the staff in the Department of Laboratory Medicine of Tongji Hospital.
Supplementary Material
The Supplementary Material for this article can be found online at: https://www.frontiersin.org/articles/10.3389/fimmu.2021.721013/full#supplementary-material
Supplementary Figure 1 | The performance of the combination of activation markers and CD27 on MTB-specific cells in distinguishing ATB patients from LTBI individuals in Qiaokou cohort. (A) Aligned dot plots showing the proportions of HLA-DR+CD27- and HLA-DR-CD27+ cells of MTB-specific cells in ATB patients and LTBI individuals. Horizontal lines indicate the medians. (B) ROC analysis showing the performance of the proportions of HLA-DR+CD27- and HLA-DR-CD27+ cells of MTB-specific cells in discriminating ATB patients from LTBI individuals. (C) Aligned dot plots showing the proportions of CD38+CD27- and CD38-CD27+ cells of MTB-specific cells in ATB patients and LTBI individuals. Horizontal lines indicate the medians. (D) ROC analysis showing the performance of the proportions of CD38+CD27- and CD38-CD27+ cells of MTB-specific cells in discriminating ATB patients from LTBI individuals. (E) Aligned dot plots showing the proportions of CD69+CD27- and CD69-CD27+ cells of MTB-specific cells in ATB patients and LTBI individuals. Horizontal lines indicate the medians. (F) ROC analysis showing the performance of the proportions of CD69+CD27- and CD69-CD27+ cells of MTB-specific cells in discriminating ATB patients from LTBI individuals. (G) Aligned dot plots showing the proportions of CD25+CD27- and CD25-CD27+ cells of MTB-specific cells in ATB patients and LTBI individuals. Horizontal lines indicate the medians. (H) ROC analysis showing the performance of the proportions of CD25+CD27- and CD25-CD27+ cells of MTB-specific cells in discriminating ATB patients from LTBI individuals. *P < 0.05, **P < 0.01, ***P < 0.001 (Mann-Whitney U test). MTB, Mycobacterium tuberculosis; ATB, active tuberculosis; LTBI, latent tuberculosis infection; AUC, area under the curve.
References
1. Cohen A, Mathiasen VD, Schön T, Wejse C. The Global Prevalence of Latent Tuberculosis: A Systematic Review and Meta-Analysis. Eur Respir J (2019) 54(3):1900655. doi: 10.2139/ssrn.3289796
2. Rajendran M, Zaki RA, Aghamohammadi N. Contributing Risk Factors Towards the Prevalence of Multidrug-Resistant Tuberculosis in Malaysia: A Systematic Review. Tuberculosis (Edinb) (2020) 122:101925. doi: 10.1016/j.tube.2020.101925
3. Tang J, Yam WC, Chen Z. Mycobacterium Tuberculosis Infection and Vaccine Development. Tuberculosis (Edinb) (2016) 98:30–41. doi: 10.1016/j.tube.2016.02.005
4. World Health Organization. Global Tuberculosis Report 2020. Geneva, Switzerland: World Health Organization (2020). Available at: https://appswhoint/iris/rest/bitstreams/1312164/retrieve.
5. Carranza C, Pedraza-Sanchez S, de Oyarzabal-Mendez E, Torres M. Diagnosis for Latent Tuberculosis Infection: New Alternatives. Front Immunol (2020) 11:2006. doi: 10.3389/fimmu.2020.02006
6. Paton NI, Borand L, Benedicto J, Kyi MM, Mahmud AM, Norazmi MN, et al. Diagnosis and Management of Latent Tuberculosis Infection in Asia: Review of Current Status and Challenges. Int J Infect Dis (2019) 87:21–9. doi: 10.1016/j.ijid.2019.07.004
7. Rao M, Ippolito G, Mfinanga S, Ntoumi F, Yeboah-Manu D, Vilaplana C, et al. Latent TB Infection (LTBI) - Mycobacterium Tuberculosis Pathogenesis and the Dynamics of the Granuloma Battleground. Int J Infect Dis (2019) 80S:S58–61. doi: 10.1016/j.ijid.2019.02.035
8. Cui X, Gao L, Cao B. Management of Latent Tuberculosis Infection in China: Exploring Solutions Suitable for High-Burden Countries. Int J Infect Dis (2020) 92S:S37–40. doi: 10.1016/j.ijid.2020.02.034
9. World Health Organization. Implementing the End TB Strategy. Geneva, Switzerland: World Health Organization (2015). Available at: https://appswhoint/iris/rest/bitstreams/916192/retrieve.
10. World Health Organization. The End TB Strategy. Geneva, Switzerland: World Health Organization (2015). Available at: https://appswhoint/iris/rest/bitstreams/1271371/retrieve.
11. World Health Organization. A Global Strategy for Tuberculosis Research and Innovation. Geneva, Switzerland: World Health Organization (2020). Available at: https://appswhoint/iris/rest/bitstreams/1312195/retrieve.
12. Furin J, Cox H, Pai M. Tuberculosis. Lancet (2019) 393(10181):1642–56. doi: 10.1016/S0140-6736(19)30308-3
13. Ngabonziza JC, Ssengooba W, Mutua F, Torrea G, Dushime A, Gasana M, et al. Diagnostic Performance of Smear Microscopy and Incremental Yield of Xpert in Detection of Pulmonary Tuberculosis in Rwanda. BMC Infect Dis (2016) 16(1):660. doi: 10.1186/s12879-016-2009-x
14. Cattamanchi A, Davis JL, Worodria W, Yoo S, Matovu J, Kiidha J, et al. Poor Performance of Universal Sample Processing Method for Diagnosis of Pulmonary Tuberculosis by Smear Microscopy and Culture in Uganda. J Clin Microbiol (2008) 46(10):3325–9. doi: 10.1128/JCM.01175-08
15. Perez-Risco D, Rodriguez-Temporal D, Valledor-Sanchez I, Alcaide F. Evaluation of the Xpert MTB/RIF Ultra Assay for Direct Detection of Mycobacterium Tuberculosis Complex in Smear-Negative Extrapulmonary Samples. J Clin Microbiol (2018) 56(9):e00659-18. doi: 10.1128/JCM.00659-18
16. Sun Q, Wang S, Dong W, Jiang G, Huo F, Ma Y, et al. Diagnostic Value of Xpert MTB/RIF Ultra for Osteoarticular Tuberculosis. J Infect (2019) 79(2):153–8. doi: 10.1016/j.jinf.2019.06.006
17. Zar HJ, Workman LJ, Prins M, Bateman LJ, Mbhele SP, Whitman CB, et al. Tuberculosis Diagnosis in Children Using Xpert Ultra on Different Respiratory Specimens. Am J Respir Crit Care Med (2019) 200(12):1531–38. doi: 10.1164/rccm.201904-0772OC
18. Sharma K, Sharma M, Shree R, Modi M, Goyal M, Narang D, et al. Xpert MTB/RIF Ultra for the Diagnosis of Tuberculous Meningitis: A Diagnostic Accuracy Study From India. Tuberculosis (Edinb) (2020) 125:101990. doi: 10.1016/j.tube.2020.101990
19. Zhang M, Xue M, He JQ. Diagnostic Accuracy of the New Xpert MTB/RIF Ultra for Tuberculosis Disease: A Preliminary Systematic Review and Meta-Analysis. Int J Infect Dis (2020) 90:35–45. doi: 10.1016/j.ijid.2019.09.016
20. Hao X, Lou H, Bai J, Ding Y, Yang J, Pan W. Cost-Effectiveness Analysis of Xpert in Detecting Mycobacterium Tuberculosis: A Systematic Review. Int J Infect Dis (2020) 95:98–105. doi: 10.1016/j.ijid.2020.03.078
21. World Health Organization. Xpert MTB/RIF Implementation Manual. Geneva, Switzerland: World Health Organization (2014). Available at: https://appswhoint/iris/rest/bitstreams/514955/retrieve.
22. World Health Organization. Xpert MTB/RIF Assay for the Diagnosis of Pulmonary and Extrapulmonary TB in Adults and Children. Geneva, Switzerland: World Health Organization (2013). Available at: https://appswhoint/iris/rest/bitstreams/514961/retrieve.
23. World Health Organization. Using the Xpert MTB/RIF Assay to Detect Pulmonary and Extrapulmonary Tuberculosis and Rifampicin Resistance in Adults and Children. Geneva, Switzerland: World Health Organization (2013). Available at: https://appswhoint/iris/rest/bitstreams/515723/retrieve.
24. Zhang M, He JQ. Is the Analysis Sufficient? Letter to the Editor Concerning the Study of Prof. Wang Titled "Xpert MTB/RIF Ultra Improved the Diagnosis of Paucibacillary Tuberculosis: A Prospective Cohort Study". J Infect (2019) 79(3):277–87. doi: 10.1016/j.jinf.2019.05.020
25. Luo Y, Tang G, Lin Q, Mao L, Xue Y, Yuan X, et al. Combination of Mean Spot Sizes of ESAT-6 Spot-Forming Cells and Modified Tuberculosis-Specific Antigen/Phytohemagglutinin Ratio of T-SPOT.TB Assay in Distinguishing Between Active Tuberculosis and Latent Tuberculosis Infection. J Infect (2020) 81(1):81–9. doi: 10.1016/j.jinf.2020.04.038
26. Sotgiu G, Saderi L, Petruccioli E, Aliberti S, Piana A, Petrone L, et al. QuantiFERON TB Gold Plus for the Diagnosis of Tuberculosis: A Systematic Review and Meta-Analysis. J Infect (2019) 79(5):444–53. doi: 10.1016/j.jinf.2019.08.018
27. Zhang H, Xin H, Wang D, Pan S, Liu Z, Cao X, et al. Serial Testing of Mycobacterium Tuberculosis Infection in Chinese Village Doctors by QuantiFERON-TB Gold Plus, QuantiFERON-TB Gold in-Tube and T-SPOT. TB J Infect (2019) 78(4):305–10. doi: 10.1016/j.jinf.2019.01.008
28. Agarwal S, Nguyen DT, Lew JD, Graviss EA. Discordance Between the QuantiFERON Gold In-Tube and QuantiFERON Gold Plus Assays Associated With Country of Birth TB Incidence. Tuberculosis (Edinb) (2019) 116S:S2–S10. doi: 10.1016/j.tube.2019.04.005
29. Lai CC, Tan CK, Lin SH, Liao CH, Huang YT, Hsueh PR. Diagnostic Performance of Whole-Blood Interferon-Gamma Assay and Enzyme-Linked Immunospot Assay for Active Tuberculosis’. Diagn Microbiol Infect Dis (2011) 71(2):139–43. doi: 10.1016/j.diagmicrobio.2011.05.013
30. World Health Organization. Guidelines on the Management of Latent Tuberculosis Infection. Geneva, Switzerland: World Health Organization (2014). Available at: https://appswhoint/iris/rest/bitstreams/607678/retrieve.
31. World Health Organization. WHO Consolidated Guidelines on Tuberculosis Module 3: Diagnosis Rapid Diagnostics for Tuberculosis Detection. Geneva, Switzerland: World Health Organization (2020). Available at: https://appswhoint/iris/rest/bitstreams/1284627/retrieve.
32. Wang S, He L, Wu J, Zhou Z, Gao Y, Chen J, et al. Transcriptional Profiling of Human Peripheral Blood Mononuclear Cells Identifies Diagnostic Biomarkers That Distinguish Active and Latent Tuberculosis. Front Immunol (2019) 10:2948. doi: 10.3389/fimmu.2019.02948
33. Sivakumaran D, Ritz C, Gjoen JE, Vaz M, Selvam S, Ottenhoff THM, et al. Host Blood RNA Transcript and Protein Signatures for Sputum-Independent Diagnostics of Tuberculosis in Adults. Front Immunol (2020) 11:626049. doi: 10.3389/fimmu.2020.626049
34. Singhania A, Wilkinson RJ, Rodrigue M, Haldar P, O’Garra A. The Value of Transcriptomics in Advancing Knowledge of the Immune Response and Diagnosis in Tuberculosis. Nat Immunol (2018) 19(11):1159–68. doi: 10.1038/s41590-018-0225-9
35. Togun T, Hoggart CJ, Agbla SC, Gomez MP, Egere U, Sillah AK, et al. A Three-Marker Protein Biosignature Distinguishes Tuberculosis From Other Respiratory Diseases in Gambian Children. EBioMedicine (2020) 58:102909. doi: 10.1016/j.ebiom.2020.102909
36. Garay-Baquero DJ, White CH, Walker NF, Tebruegge M, Schiff HF, Ugarte-Gil C, et al. Comprehensive Plasma Proteomic Profiling Reveals Biomarkers for Active Tuberculosis. JCI Insight (2020) 5(18):e137427. doi: 10.1172/jci.insight.137427
37. Albors-Vaquer A, Rizvi A, Matzapetakis M, Lamosa P, Coelho AV, Patel AB, et al. Active and Prospective Latent Tuberculosis Are Associated With Different Metabolomic Profiles: Clinical Potential for the Identification of Rapid and Non-Invasive Biomarkers. Emerg Microbes Infect (2020) 9(1):1131–9. doi: 10.1080/22221751.2020.1760734
38. Weiner J 3rd, Maertzdorf J, Sutherland JS, Duffy FJ, Thompson E, Suliman S, et al. Metabolite Changes in Blood Predict the Onset of Tuberculosis. Nat Commun (2018) 9(1):5208. doi: 10.1038/s41467-018-07635-7
39. Dai Y, Shan W, Yang Q, Guo J, Zhai R, Tang X, et al. Biomarkers of Iron Metabolism Facilitate Clinical Diagnosis in M Ycobacterium Tuberculosis Infection. Thorax (2019) 74(12):1161–67. doi: 10.1136/thoraxjnl-2018-212557
40. Riou C, Du Bruyn E, Ruzive S, Goliath RT, Lindestam Arlehamn CS, Sette A, et al. Disease Extent and Anti-Tubercular Treatment Response Correlates With Mycobacterium Tuberculosis-Specific CD4 T-Cell Phenotype Regardless of HIV-1 Status. Clin Transl Immunol (2020) 9(9):e1176. doi: 10.1002/cti2.1176
41. Musvosvi M, Duffy D, Filander E, Africa H, Mabwe S, Jaxa L, et al. T-Cell Biomarkers for Diagnosis of Tuberculosis: Candidate Evaluation by a Simple Whole Blood Assay for Clinical Translation. Eur Respir J (2018) 51(3):1800153. doi: 10.1183/13993003.00153-2018
42. Adekambi T, Ibegbu CC, Cagle S, Kalokhe AS, Wang YF, Hu Y, et al. Biomarkers on Patient T Cells Diagnose Active Tuberculosis and Monitor Treatment Response. J Clin Invest (2015) 125(5):1827–38. doi: 10.1172/JCI77990
43. Kestens L, Vanham G, Vereecken C, Vandenbruaene M, Vercauteren G, Colebunders RL, et al. Selective Increase of Activation Antigens HLA-DR and CD38 on CD4+ CD45RO+ T Lymphocytes During HIV-1 Infection. Clin Exp Immunol (1994) 95(3):436–41. doi: 10.1111/j.1365-2249.1994.tb07015.x
44. Starska K, Glowacka E, Kulig A, Lewy-Trenda I, Brys M, Lewkowicz P. Prognostic Value of the Immunological Phenomena and Relationship With Clinicopathological Characteristics of the Tumor–the Expression of the Early CD69+, CD71+ and the Late CD25+, CD26+, HLA/DR+ Activation Markers on T CD4+ and CD8+ Lymphocytes in Squamous Cell Laryngeal Carcinoma. Part II. Folia Histochem Cytobiol (2011) 49(4):593–603. doi: 10.5603/FHC.2011.0082
45. Bajnok A, Ivanova M, Rigo J Jr., Toldi G. The Distribution of Activation Markers and Selectins on Peripheral T Lymphocytes in Preeclampsia. Mediators Inflamm (2017) 2017:8045161. doi: 10.1155/2017/8045161
46. Lund FE, Cockayne DA, Randall TD, Solvason N, Schuber F, Howard MC. CD38: A New Paradigm in Lymphocyte Activation and Signal Transduction. Immunol Rev (1998) 161:79–93. doi: 10.1111/j.1600-065X.1998.tb01573.x
47. Shubinsky G, Schlesinger M. The CD38 Lymphocyte Differentiation Marker: New Insight Into Its Ectoenzymatic Activity and Its Role as a Signal Transducer. Immunity (1997) 7(3):315–24. doi: 10.1016/S1074-7613(00)80353-2
48. Ziegler SF, Ramsdell F, Alderson MR. The Activation Antigen CD69. Stem Cells (1994) 12(5):456–65. doi: 10.1002/stem.5530120502
49. Rea IM, McNerlan SE, Alexander HD. CD69, CD25, and HLA-DR Activation Antigen Expression on CD3+ Lymphocytes and Relationship to Serum TNF-Alpha, IFN-Gamma, and sIL-2R Levels in Aging. Exp Gerontol (1999) 34(1):79–93. doi: 10.1016/S0531-5565(98)00058-8
50. Yacyshyn MB, Poppema S, Berg A, MacLean GD, Reddish MA, Meikle A, et al. CD69+ and HLA-DR+ Activation Antigens on Peripheral Blood Lymphocyte Populations in Metastatic Breast and Ovarian Cancer Patients: Correlations With Survival Following Active Specific Immunotherapy. Int J Cancer (1995) 61(4):470–4. doi: 10.1002/ijc.2910610407
51. Radulovic K, Rossini V, Manta C, Holzmann K, Kestler HA, Niess JH. The Early Activation Marker CD69 Regulates the Expression of Chemokines and CD4 T Cell Accumulation in Intestine. PloS One (2013) 8(6):e65413. doi: 10.1371/journal.pone.0065413
52. Kmieciak M, Gowda M, Graham L, Godder K, Bear HD, Marincola FM, et al. Human T Cells Express CD25 and Foxp3 Upon Activation and Exhibit Effector/Memory Phenotypes Without Any Regulatory/Suppressor Function. J Transl Med (2009) 7:89. doi: 10.1186/1479-5876-7-89
53. Prasad KV, Ao Z, Yoon Y, Wu MX, Rizk M, Jacquot S, et al. CD27, a Member of the Tumor Necrosis Factor Receptor Family, Induces Apoptosis and Binds to Siva, a Proapoptotic Protein. Proc Natl Acad Sci USA (1997) 94(12):6346–51. doi: 10.1073/pnas.94.12.6346
54. Mahnke YD, Brodie TM, Sallusto F, Roederer M, Lugli E. The Who’s Who of T-Cell Differentiation: Human Memory T-Cell Subsets. Eur J Immunol (2013) 43(11):2797–809. doi: 10.1002/eji.201343751
55. Petruccioli E, Petrone L, Vanini V, Cuzzi G, Navarra A, Gualano G, et al. Assessment of CD27 Expression as a Tool for Active and Latent Tuberculosis Diagnosis. J Infect (2015) 71(5):526–33. doi: 10.1016/j.jinf.2015.07.009
56. Latorre I, Fernandez-Sanmartin MA, Muriel-Moreno B, Villar-Hernandez R, Vila S, Souza-Galvao ML, et al. Study of CD27 and CCR4 Markers on Specific CD4(+) T-Cells as Immune Tools for Active and Latent Tuberculosis Management. Front Immunol (2018) 9:3094. doi: 10.3389/fimmu.2018.03094
57. DeLong ER, DeLong DM, Clarke-Pearson DL. Comparing the Areas Under Two or More Correlated Receiver Operating Characteristic Curves: A Nonparametric Approach. Biometrics (1988) 44(3):837–45. doi: 10.2307/2531595
58. World Health Organization. Implementing Tuberculosis Diagnostics: A Policy Framework. Geneva, Switzerland: World Health Organization (2015). Available at: https://appswhoint/iris/rest/bitstreams/720125/retrieve.
59. World Health Organization. Framework for the Evaluation of New Tests for Tuberculosis Infection (2020). Available at: https://appswhoint/iris/rest/bitstreams/1288536/retrieve.
60. Luo Y, Xue Y, Lin Q, Tang G, Yuan X, Mao L, et al. A Combination of Iron Metabolism Indexes and Tuberculosis-Specific Antigen/Phytohemagglutinin Ratio for Distinguishing Active Tuberculosis From Latent Tuberculosis Infection. Int J Infect Dis (2020) 97:190–6. doi: 10.1016/j.ijid.2020.05.109
61. Burel JG, Lindestam Arlehamn CS, Khan N, Seumois G, Greenbaum JA, Taplitz R, et al. Transcriptomic Analysis of CD4(+) T Cells Reveals Novel Immune Signatures of Latent Tuberculosis. J Immunol (2018) 200(9):3283–90. doi: 10.4049/jimmunol.1800118
62. Turner CT, Gupta RK, Tsaliki E, Roe JK, Mondal P, Nyawo GR, et al. Blood Transcriptional Biomarkers for Active Pulmonary Tuberculosis in a High-Burden Setting: A Prospective, Observational, Diagnostic Accuracy Study. Lancet Respir Med (2020) 8(4):407–19. doi: 10.1016/S2213-2600(19)30469-2
63. Lee JY, Jung YW, Jeong I, Joh JS, Sim SY, Choi B, et al. Immune Parameters Differentiating Active From Latent Tuberculosis Infection in Humans. Tuberculosis (Edinb) (2015) 95(6):758–63. doi: 10.1016/j.tube.2015.08.003
64. Luo J, Zhang M, Yan B, Li F, Guan S, Chang K, et al. Diagnostic Performance of Plasma Cytokine Biosignature Combination and MCP-1 as Individual Biomarkers for Differentiating Stages Mycobacterium Tuberculosis Infection. J Infect (2019) 78(4):281–91. doi: 10.1016/j.jinf.2018.10.017
65. Mutavhatsindi H, van der Spuy GD, Malherbe ST, Sutherland JS, Geluk A, Mayanja-Kizza H, et al. Validation and Optimization of Host Immunological Bio-Signatures for a Point-of-Care Test for TB Disease. Front Immunol (2021) 12:607827. doi: 10.3389/fimmu.2021.607827
66. Perumal P, Abdullatif MB, Garlant HN, Honeyborne I, Lipman M, McHugh TD, et al. Validation of Differentially Expressed Immune Biomarkers in Latent and Active Tuberculosis by Real-Time PCR. Front Immunol (2020) 11:612564. doi: 10.3389/fimmu.2020.612564
67. Sudbury EL, Clifford V, Messina NL, Song R, Curtis N. Mycobacterium Tuberculosis-Specific Cytokine Biomarkers to Differentiate Active TB and LTBI: A Systematic Review. J Infect (2020) 81(6):873–81. doi: 10.1016/j.jinf.2020.09.032
68. Suzukawa M, Takeda K, Akashi S, Asari I, Kawashima M, Ohshima N, et al. Evaluation of Cytokine Levels Using QuantiFERON-TB Gold Plus in Patients With Active Tuberculosis. J Infect (2020) 80(5):547–53. doi: 10.1016/j.jinf.2020.02.007
69. Luo Y, Tang G, Yuan X, Lin Q, Mao L, Song H, et al. Combination of Blood Routine Examination and T-SPOT.TB Assay for Distinguishing Between Active Tuberculosis and Latent Tuberculosis Infection. Front Cell Infect Microbiol (2021) 11:575650. doi: 10.3389/fcimb.2021.575650
70. Luo Y, Xue Y, Tang G, Cai Y, Yuan X, Lin Q, et al. Lymphocyte-Related Immunological Indicators for Stratifying Mycobacterium Tuberculosis Infection. Front Immunol (2021) 12:658843. doi: 10.3389/fimmu.2021.658843
71. Clifford V, Tebruegge M, Zufferey C, Germano S, Forbes B, Cosentino L, et al. Cytokine Biomarkers for the Diagnosis of Tuberculosis Infection and Disease in Adults in a Low Prevalence Setting. Tuberculosis (Edinb) (2019) 114:91–102. doi: 10.1016/j.tube.2018.08.011
72. Luo Y, Xue Y, Yuan X, Lin Q, Tang G, Mao L, et al. Combination of Prealbumin and Tuberculosis-Specific Antigen/Phytohemagglutinin Ratio for Discriminating Active Tuberculosis From Latent Tuberculosis Infection. Int J Clin Pract (2020) 75(4):e13831. doi: 10.1111/ijcp.13831
73. Katakura S, Kobayashi N, Hashimoto H, Kamimaki C, Tanaka K, Kubo S, et al. Identification of a Novel Biomarker Based on Lymphocyte Count, Albumin Level, and TBAg/PHA Ratio for Differentiation Between Active and Latent Tuberculosis Infection in Japan. Tuberculosis (Edinb) (2020) 125:101992. doi: 10.1016/j.tube.2020.101992
74. Kim JY, Park JH, Kim MC, Cha HH, Jeon NY, Park SY, et al. Combined IFN-Gamma and TNF-Alpha Release Assay for Differentiating Active Tuberculosis From Latent Tuberculosis Infection. J Infect (2018) 77(4):314–20. doi: 10.1016/j.jinf.2018.04.011
75. Wu J, Wang S, Lu C, Shao L, Gao Y, Zhou Z, et al. Multiple Cytokine Responses in Discriminating Between Active Tuberculosis and Latent Tuberculosis Infection. Tuberculosis (Edinb) (2017) 102:68–75. doi: 10.1016/j.tube.2016.06.001
76. Morris TC, Hoggart CJ, Chegou NN, Kidd M, Oni T, Goliath R, et al. Evaluation of Host Serum Protein Biomarkers of Tuberculosis in Sub-Saharan Africa. Front Immunol (2021) 12:639174. doi: 10.3389/fimmu.2021.639174
77. Yang Q, Chen Q, Zhang M, Cai Y, Yang F, Zhang J, et al. Identification of Eight-Protein Biosignature for Diagnosis of Tuberculosis. Thorax (2020) 75(7):576–83. doi: 10.1136/thoraxjnl-2018-213021
78. Wallis RS, Kim P, Cole S, Hanna D, Andrade BB, Maeurer M, et al. Tuberculosis Biomarkers Discovery: Developments, Needs, and Challenges. Lancet Infect Dis (2013) 13(4):362–72. doi: 10.1016/S1473-3099(13)70034-3
79. Chen YC, Chang YP, Hsiao CC, Wu CC, Wang YH, Chao TY, et al. Blood M2a Monocyte Polarization and Increased Formyl Peptide Receptor 1 Expression Are Associated With Progression From Latent Tuberculosis Infection to Active Pulmonary Tuberculosis Disease. Int J Infect Dis (2020) 101:210–9. doi: 10.1016/j.ijid.2020.09.1056
80. Tang G, Yuan X, Luo Y, Lin Q, Chen Z, Xing X, et al. Establishing Immune Scoring Model Based on Combination of the Number, Function, and Phenotype of Lymphocytes. Aging (Albany NY) (2020) 12(10):9328–43. doi: 10.18632/aging.103208
81. Luo Y, Xie Y, Zhang W, Lin Q, Tang G, Wu S, et al. Combination of Lymphocyte Number and Function in Evaluating Host Immunity. Aging (Albany NY) (2019) 11(24):12685–707. doi: 10.18632/aging.102595
82. Luo Y, Xue Y, Cai Y, Lin Q, Tang G, Song H, et al. Lymphocyte Non-Specific Function Detection Facilitating the Stratification of Mycobacterium Tuberculosis Infection. Front Immunol (2021) 12:641378. doi: 10.3389/fimmu.2021.641378
83. Tebruegge M, Ritz N, Donath S, Dutta B, Forbes B, Clifford V, et al. Mycobacteria-Specific Mono- and Polyfunctional CD4+ T Cell Profiles in Children With Latent and Active Tuberculosis: A Prospective Proof-Of-Concept Study. Front Immunol (2019) 10:431. doi: 10.3389/fimmu.2019.00431
84. Mpande CAM, Musvosvi M, Rozot V, Mosito B, Reid TD, Schreuder C, et al. Antigen-Specific T Cell Activation Distinguishes Between Recent and Remote Tuberculosis Infection. Am J Respir Crit Care Med (2021) 203(12):1556–65. doi: 10.1164/rccm.202007-2686OC
85. Zhao HM, Du R, Li CL, Ji P, Li HC, Wu K, et al. Differential T Cell Responses Against DosR-Associated Antigen Rv2028c in BCG-Vaccinated Populations With Tuberculosis Infection. J Infect (2019) 78(4):275–80. doi: 10.1016/j.jinf.2018.10.016
86. Whitworth HS, Badhan A, Boakye AA, Takwoingi Y, Rees-Roberts M, Partlett C, et al. Clinical Utility of Existing and Second-Generation Interferon-γ Release Assays for Diagnostic Evaluation of Tuberculosis: An Observational Cohort Study. Lancet Infect Dis (2019) 19(2):193–202. doi: 10.1016/S1473-3099(18)30613-3
87. Rodo MJ, Rozot V, Nemes E, Dintwe O, Hatherill M, Little F, et al. A Comparison of Antigen-Specific T Cell Responses Induced by Six Novel Tuberculosis Vaccine Candidates. PloS Pathog (2019) 15(3):e1007643. doi: 10.1371/journal.ppat.1007643
88. Pan L, Jia H, Liu F, Sun H, Gao M, Du F, et al. Risk Factors for False-Negative T-SPOT.TB Assay Results in Patients With Pulmonary and Extra-Pulmonary TB. J Infect (2015) 70(4):367–80. doi: 10.1016/j.jinf.2014.12.018
Keywords: activation phenotype, HLA-DR, Mycobacterium tuberculosis, discrimination, active tuberculosis, latent tuberculosis infection
Citation: Luo Y, Xue Y, Mao L, Lin Q, Tang G, Song H, Liu W, Tong S, Hou H, Huang M, Ouyang R, Wang F and Sun Z (2021) Activation Phenotype of Mycobacterium tuberculosis-Specific CD4+ T Cells Promoting the Discrimination Between Active Tuberculosis and Latent Tuberculosis Infection. Front. Immunol. 12:721013. doi: 10.3389/fimmu.2021.721013
Received: 05 June 2021; Accepted: 29 July 2021;
Published: 26 August 2021.
Edited by:
Harriet Mayanja Kizza, Makerere University, UgandaReviewed by:
Marco Pio La Manna, University of Palermo, ItalyElisa Nemes, University of Cape Town, South Africa
Copyright © 2021 Luo, Xue, Mao, Lin, Tang, Song, Liu, Tong, Hou, Huang, Ouyang, Wang and Sun. This is an open-access article distributed under the terms of the Creative Commons Attribution License (CC BY). The use, distribution or reproduction in other forums is permitted, provided the original author(s) and the copyright owner(s) are credited and that the original publication in this journal is cited, in accordance with accepted academic practice. No use, distribution or reproduction is permitted which does not comply with these terms.
*Correspondence: Shutao Tong, MTE3MDg3OTEyM0BxcS5jb20=; Hongyan Hou, ODE1NzM5MTk1QHFxLmNvbQ==; Min Huang, aHVhbmdtaW5yeTIwMTNAMTYzLmNvbQ==; Renren Ouyang, ODcyNDQyMzIxQHFxLmNvbQ==; Feng Wang, ZmVuZ3dhbmdAdGpoLnRqbXUuZWR1LmNu; Ziyong Sun, enlzdW5AdGpoLnRqbXUuZWR1LmNu; Ying Luo, MTMzNDk5MTcyODJAMTYzLmNvbQ==