
94% of researchers rate our articles as excellent or good
Learn more about the work of our research integrity team to safeguard the quality of each article we publish.
Find out more
ORIGINAL RESEARCH article
Front. Immunol. , 18 June 2021
Sec. Autoimmune and Autoinflammatory Disorders
Volume 12 - 2021 | https://doi.org/10.3389/fimmu.2021.683623
This article is part of the Research Topic Sjögren’s Syndrome: Pathogenicity, Novel targets and Antigens. View all 29 articles
 Adrianos Nezos1†
 Charalampos Skarlis1†
 Anna Psarrou1
 Konstantinos Markakis1
 Panagiotis Garantziotis1,2Asimina Papanikolaou3Fotini Gravani4Michael Voulgarelis5
 Athanasios G. Tzioufas5,6
 Michael Koutsilieris1
 Haralampos M. Moutsopoulos5,7
 Eleni Kotsifaki1‡
 Clio P. Mavragani1,5,6*‡
Background: B-cell non-Hodgkin’s lymphoma (B-NHL) is one of the major complications of primary Sjögren’s syndrome (SS). Chronic inflammation and macrophages in SS minor salivary glands have been previously suggested as significant predictors for lymphoma development among SS patients. Lipoprotein-associated phospholipase A2 (Lp-PLA2)—a product mainly of tissue macrophages—is found in the circulation associated with lipoproteins and has been previously involved in cardiovascular, autoimmune, and malignant diseases, including lymphoma.
Objective: The purpose of the current study was to investigate the contributory role of Lp-PLA2 in B-NHL development in the setting of primary SS.
Methods: Lp-PLA2 activity in serum samples collected from 50 primary SS patients with no lymphoma (SS-nL), 9 primary SS patients with lymphoma (SS-L), and 42 healthy controls (HC) was determined by detection of [3H]PAF degradation products by liquid scintillation counter. Moreover, additional sera from 50 SS-nL, 28 SS-L, and 32 HC were tested for Lp-PLA2 activity using a commercially available ELISA kit. Lp-PLA2 mRNA, and protein expression in minor salivary gland (MSG) tissue samples derived from SS-nL, SS-L patients, and sicca controls (SC) were analyzed by real-time PCR, Western blot, and immunohistochemistry.
Results: Serum Lp-PLA2 activity was significantly increased in SS-L compared to both SS-nL and HC by two independent methods implemented [mean ± SD (nmol/min/ml): 62.0 ± 13.4 vs 47.6 ± 14.4 vs 50.7 ± 16.6, p-values: 0.003 and 0.04, respectively, and 19.4 ± 4.5 vs 15.2 ± 3.3 vs 14.5 ± 3.0, p-values: <0.0001, in both comparisons]. ROC analysis revealed that the serum Lp-PLA2 activity measured either by radioimmunoassay or ELISA has the potential to distinguish between SS-L and SS-nL patients (area under the curve [AUC]: 0.8022, CI [95%]: 0.64–0.96, p-value: 0.004 for radioimmunoassay, and AUC: 0.7696, CI [95%]: 0.66–0.88, p-value: <0.0001, for ELISA). Lp-PLA2 expression in MSG tissues was also increased in SS-L compared to SS-nL and SC at both mRNA and protein level. ROC analysis revealed that both MSG mRNA and protein Lp-PLA2 have the potential to distinguish between SS-nL and SS-L patients (area under the curve [AUC] values of 0.8490, CI [95%]: 0.71–0.99, p-value: 0.0019 and 0.9444, CI [95%]: 0.79–1.00, p- value: 0.0389 respectively). No significant difference in either serum Lp-PLA2 activity or MSG tissue expression was observed between SS-nL and HC.
Conclusions: Lp-PLA2 serum activity and MSG tissue mRNA/protein expression could be a new biomarker and possibly a novel therapeutic target for B-cell lymphoproliferation in the setting of SS.
Sjögren’s syndrome (SS) is a chronic autoimmune disorder primarily affecting perimenopausal women. Dryness of the mouth and eyes and periductal lymphocytic cell infiltrates in the exocrine glands are the chief clinical and histopathological features. More than a half of SS patients experience systemic disease manifestations (1–3) and nearly 5% to 10% develop B-cell non-Hodgkin lymphoma resulting in increased mortality rates (4–6).
Deregulated inflammatory responses have been associated with lymphoma development in the setting of SS (7). Excessive lymphocytic infiltrates (8), heightened rates of IL-18–expressing cells (9), and tissue macrophages (10), elevated transcript levels of both interferon-γ (IFNγ) (11–13), and inflammasome molecules (14) in minor salivary gland (MSG) tissues, as well high serum levels of IL-18 and apoptosis-associated speck-like protein (ASC) (14, 15), have been all designated as key findings in SS patients at high risk for lymphoma development. Toward the same direction, several gene variants implicated in central inflammatory and IFN/B cell activation pathways, such as tumor necrosis factor alpha-induced protein 3 (TNFAIP3) variant (16, 17), three prime repair exonuclease 1 (TREX-1) (18), B-cell activating factor (BAFF) (19), and BAFF-R (20) have been shown to increase susceptibility for SS-related lymphoma.
A major inflammatory molecule, mainly produced during the process of monocyte differentiation into macrophages and involved in chronic inflammatory disorders including cardiovascular (21, 22), autoimmune/inflammatory (23, 24), and neoplastic (25) diseases, is lipoprotein-associated phospholipase A2 (Lp-PLA2), formerly called platelet-activating factor acetylhydrolase (PAF-AH). Lp-PLA2 belongs to the superfamily of esterase enzymes which mediate the production of free fatty acids and lysophospholipids from glycerophospholipids (26). Lp-PLA2 specifically functions as a catalyst in the hydrolysis of PAF, a plasma phospholipid with powerful inflammatory actions (27). Decreasing of biologically active phospholipids, such as PAF and oxidatively fragmented phospholipids (OxPL), or increasing oxidized and/or short/medium chain fatty acids and lyso-phosphatidylcholine (lyso-PC), have been postulated as key mechanisms through which Lp-PLA2 regulate signaling inflammatory events (28).
In the current study, we investigated the potential role of serum Lp-PLA2 activity, as well as MSG tissue mRNA and protein expression as a biomarker for B-NHL in the setting of primary SS.
In the present case-control study, serum samples derived from 100 primary SS patients with no history of lymphoma (SS-nL), 37 primary SS patients with a history of lymphoma (SS-L), and 74 healthy controls (HC) were included. Labial MSG biopsy tissues performed as part of the routine diagnostic evaluation of SS were available in 16 SS-nL, 12 SS-L, and 6 sicca controls (SC) (Department of Pathophysiology, School of Medicine, National and Kapodistrian University of Athens). All patients fulfilled the 2016 ACR/EULAR SS classification criteria (29) and were followed up in the Outpatient Rheumatology Clinics of the Department of Pathophysiology, Laiko General Hospital and the General Hospital of Athens G.Gennimatas, as well as by Prof HM Moutsopoulos. SC are individuals presenting with dryness of oral and/ocular mucosae without fulfilling classification criteria for SS. Based on the number of adverse predictors present at the time of diagnosis [salivary gland enlargement (SGE), lymphadenopathy, Raynaud’s phenomenon, anti-Ro/SSA or/and anti-La/SSB autoantibodies, rheumatoid factor (RF) positivity, monoclonal gammopathy, and C4 hypocomplementemia], SS patients were further classified into low risk (two or less adverse predictors), medium risk (three to six adverse predictors), and high risk for lymphoma development (seven adverse predictors) as previously described (30). SS-L patients were followed up in the Outpatient Hematology Clinic of the Department of Pathophysiology, School of Medicine, National and Kapodistrian University of Athens. Lymphoma diagnosis was based on World Health Organization classification criteria. Of the total 37 SS-L cases included in the study, 33 were of mucosa-associated lymphoid tissue type and four of diffuse large cell lymphomas (one in the first set and three in the second sample set). 15 SS-L patients had previously received either rituximab alone or combination with chemotherapy. Serum samples were collected, stored, and processed in the Department of Physiology, School of Medicine, National and Kapodistrian University of Athens. The study was approved by Laiko General Hospital of Athens and General Hospital of Athens Ethics Committee. All subjects gave informed consent in accordance with the Declaration of Helsinki.
Clinical, serological, and histopathological characteristics were recorded after thorough chart review as previously described (11). In the first SS set, data for the presence of plaque formation, measurements for intima media thickness (IMT), as a marker of subclinical atherosclerosis and classic risk factors for atherosclerosis were also available (31). The presence of subclinical atherosclerosis was defined by the presence of plaque and/or arterial wall thickening (defined as IMT score >0.90 mm in carotid and femoral arteries) as determined by ultrasound (iU22, Philips, Royal Philips Electronics of the Netherlands) (31).
Lp-PLA2 activity was measured by liquid scintillation in human serum samples derived from 50 primary SS patients with no lymphoma (SS-nL), 9 primary SS patients with lymphoma (SS-L), and 42 healthy controls (HC) stored at −80°C, in the setting of a previous study exploring mechanisms of subclinical atherosclerosis in primary SS (31). The assay measured [3H]PAF degradation products in liquid scintillation counter. Briefly, each sample was incubated with 10 μM [3H]PAF in PBS, pH 7.4, for 10 min at 37°C. The lipids were extracted at the end of incubation by the method of Folch et al. (32), and the amount of radioactivity recovered in the aqueous phase was determined by liquid scintillation as previously described (33).
Moreover, additional sera from 50 SS-nL, 28 SS-L, and 32 HC were tested for Lp-PLA2 activity using a commercially available ELISA kit (PAF Acetylhydrolase Assay Kit, Cayman Chemical, USA), according to manufacturer’s instructions. All measurements were performed in duplicate at 412 nm using a plate reader (Versamax, Molecular Devices, USA). In this case, SS patients either with a history of lymphoma or not who were followed in the last 2 years in Hematology Unit, Department of Pathophysiology and the Outpatient Clinic, Department of Pathophysiology, respectively, were contacted, and blood was drawn for the study purposes after informed consent was obtained. Patients who had received chemotherapy or rituximab in the previous year were excluded from the study. The mean duration between sampling and lymphoma diagnosis was 6.1 ± 4.1 years.
Total RNA was extracted from MSG tissue biopsies (stored at −80°C) by TRIzol Reagent (Thermo Scientific, USA) according to manufacturer’s instructions. The quantity and quality of RNA samples was spectrophotometrically recorded (Biospec Nano, Japan). A commercial preparation of total RNA from normal salivary glands pooled from 24 male/female Caucasians (ages 15–60 years; cause of death: sudden death) was used as a source of healthy RNA (Clontech Laboratories Inc, USA). Protein extraction from MSG tissues was performed by lysis of the tissue in radioimmunoprecipitation assay extraction buffer (RIPA buffer) supplemented with protease and phosphatase cocktail inhibitor and 1 mM PMSF (all reagents purchased from New England Biolabs, Canada). Pierce BCA Protein Assay Kit (Thermo Fisher Scientific, USA) was performed for determination of protein concentration of each sample.
Total RNA obtained from MSG samples was reverse-transcribed using Superscript III reverse transcriptase system from Invitrogen (Thermo Fisher, USA). Complementary DNA samples were diluted 1:10 with nuclease free water (Qiagen, Germany) immediately after synthesis and stored at −20°C.
Quantitative Real-Time Polymerase Chain Reaction (qRT-PCR) was used to quantify specific cDNAs using the Bio-Rad IQ5 thermocycler and the Kapa Biosystems SYBR Green qPCR Master Mix kit (Kapa Biosystems, South Africa). Specific primers to amplify only cDNA (exon-intron spanning) for each gene were designed using the Beacon Designer software. Lp-PLA2 is encoded by the PLA2G7 gene. The sequences of each primer set are as follows: PLA2G7 forward primer: 5′-CTGCTATTGGCATTGACCTGGC-3′ and reverse primer 5′-AGGTAGAGCCAAGACTTGTCCC-3. The normalization gene GAPDH primers were the following: forward primer 5′-CATCACTGCCACCCAGAAGA-3; and reverse primer 5′-TCCACCACCCTGTTGCTGTA-3′. The reaction was carried out in a total volume of 20 μl per reaction and constituted of 2 μl of template cDNA, 0.4 μM of each primer, 10 μl 2× KAPA SYBR Green Mix (Kapa Biosystems, South Africa), and ultra-pure water. A two-step amplification protocol was applied starting with step 1 with one cycle at 95°C for 4 min followed by step 2 with 40 cycles at 95°C for 5 s and 63°C for 30 s. The specificity of the amplified products was determined by melting curve analysis. The threshold cycles (Ct) generated by the qPCR system were used to calculate relative gene expression levels between different samples. Briefly, the Ct of the target gene (or gene of interest) was subtracted from the Ct of the reference gene for the two groups and the relative expression of each sample was determined using the 2−ΔΔCt method, as previously described (11). All reactions were performed in duplicate. MSG healthy RNA pool was the reference sample for MSG tissues.
An equal amount of total protein lysates (25 μg) was heated at 95°C for 5 min, electrophoresed on 10% sodium dodecyl sulfate (SDS)–polyacrylamide gel (29:1 acrylamide, Applichem, Germany) under denaturing conditions for 2 h, and transferred overnight at 4°C onto PVDF membranes (Bio-Rad, USA). The blots were treated with TBST blocking buffer (20 mmol/L Tris HCl, pH 7.6, 137 mmol/L NaCl, and 0.1% Tween 20) containing 5% nonfat dried milk at room temperature for 90 min and incubated overnight at 4°C with anti–Lp-PLA2 rabbit polyclonal Antibody primary antibody (Origene, USA) at 1:1.000 dilution in TBST containing 5% milk followed by GAPDH anti-mouse monoclonal antibody, as a reference protein expression (Santa Cruz Biotechnology). The blots were washed thrice for 5 min each time, followed by incubation with anti-rabbit IgG secondary goat antibody (Santa Cruz Biotechnology) or anti-mouse IgG secondary goat antibody conjugated to horseradish peroxidase at 1:2.000 dilution (Santa Cruz Biotechnology).
The blots were exposed on X-ray film after incubation with freshly made enhanced chemiluminescent substrate for 2 min (GAPDH) or 20 min (PLA2G7) (SuperSignal; Pierce/Thermo Scientific, USA). Densitometry analysis was performed using ImageJ image processing software (http://rsb.info.nih.gov/ij). As a positive control for the Lp-PLA2 protein expression was used a total protein lysate from human placenta tissue sample available in our laboratory (high RNA expression based on Human Protein Atlas, https://www.proteinatlas.org/ENSG00000146070-PLA2G7/tissue).
Thirteen formalin-fixed paraffin-embedded MSG tissue sections (5 μm) derived from four SS patients, 5 SS-L patients and four patients complaining of sicca symptoms without fulfilling histopathological diagnosis for SS served as SC were also included. A lymph node biopsy derived from a non-SS patient with marginal zone lymphoma was also included.
Immunohistochemical detection of Lp-PLA2 (PLA2G7) and CD68 was performed by a standard immunoperoxidase technique using the SignalStain Boost IHC Detection Reagent (HRP, Rabbit) (Cell Signaling, USA). Briefly, paraffin sections were rehydrated in successive baths of xylene, 100%, 96%, 80%, 70% ethanol, and distilled water and washed thrice with PBS (phosphate-buffered saline). Antigen retrieval was performed by microwaving for 10 min in 0.01 M citrate buffer (pH 6.0). Incubation for 10 min at room temperature with Power block Universal Blocking Reagent (BioGenex, USA) and 10 min with 3% H2O2 (BioGenex, USA) were performed to block non-specific antibody binding and endogenous peroxidase activity, respectively. Incubation of serial sections with Lp-PLA2 (PLA2G7 gene) rabbit polyclonal antibody (Origene, USA) at 1:25 dilution, CD68/PGM1 (DAKO, USA) mouse monoclonal antibody at 1:30 dilution and concentration-matched isotype control antibody (PharMingen, San Diego, CA) was performed for 30 min at room temperature. Polymer–horseradish peroxidise (HRP) Reagent (Cell Signaling, USA) was applied for 30 min at room temperature and after a washing step the substrate diaminobenzidine (DAB) solution (Cell Signalling, USA) was performed for 5 to 10 min. Biopsy sections were counterstained with hematoxylin for 2 min (Mayers Haematoxylin solution, Sigma Aldrich Inc, USA), dehydrated in successive baths of water, 70%, 80%, 96%, 100% ethanol, and xylene and coverslip mounted with two drops of Aqueous Mounting Media (Chembiotin, Canada). Negative control staining was performed by replacing primary antibody with PBS. Positive immunoreactivity appears as brown color. The intensity of immunoreactivity for Lp-PLA2 was determined as follows: 0 for no staining, 1 for weak intensity staining, 2 for intermediate intensity staining, 3 for strong intensity staining, as previously suggested (34).
As a positive control a human tonsil section sample was used, according to Lp-PLA2 (PLA2G7 gene) rabbit polyclonal antibody (Origene, USA) datasheet (data not shown).
Two-group comparisons of continuous data were assessed using t-tests, or the Mann-Whitney test, when the data did not have a normal distribution. For the comparison of numerical variables between three groups, analysis of variance (ANOVA) test was implemented. For the comparison of categorical variables, Fisher’s exact test was implemented. Receiver operating characteristic (ROC) curve and corresponding area under the curve (AUC) were calculated. Difference was considered statistically significant if p<0.05. Statistical analysis was performed by SPSS v.25 package and Graph Pad Prism 8.0.
Clinical, hematological, serological, and histopathological characteristics of SS-nL and SS-L patients included in the study are displayed in Supplementary Tables 1, 2. Demographics from healthy controls are also presented in Supplementary Tables 1, 2. Supplementary Table 3 summarizes the clinical characteristics of SS patients in radioimmunoassay and ELISA cohorts.
Serum Lp-PLA2 activity measured by liquid scintillation was found to be significantly increased in patients with SS-L compared to SS-nL group (Figure 1A), [mean ± SD (nmol/min/ml): 62.0 ± 13.4 vs 47.6 ± 14.4, p-value: 0.003], and HC [mean ± SD (nmol/min/ml): 62.0 ± 13.4 vs 50.7 ± 16.6, p-value: 0.04]. No statistically significant difference in Lp-PLA2 activity was observed between SS-nL patients and HC. Following comparison of the three groups by ANOVA testing, the resulting p-value was 0.036. ROC analysis showed that the serum Lp-PLA2 activity has the potential to distinguish between SS-L and SS-nL patients (area under the curve [AUC] = 0.8022, CI (95%): 0.64–0.96, p-value: 0.004 (Figure 1B). The corresponding value between SS-L and HC was 0.7196, CI (95%): 0.56–0.88, p-value: 0.04 (Figure 1C). As shown in Supplementary Figure 1A, no significant differences between low and medium risk were detected. No patient included in the present study belonged to the high risk for lymphoma development group. Only one patient from the SS-L patients in the first set of samples had previously received combination treatment with rituximab and chemotherapy.
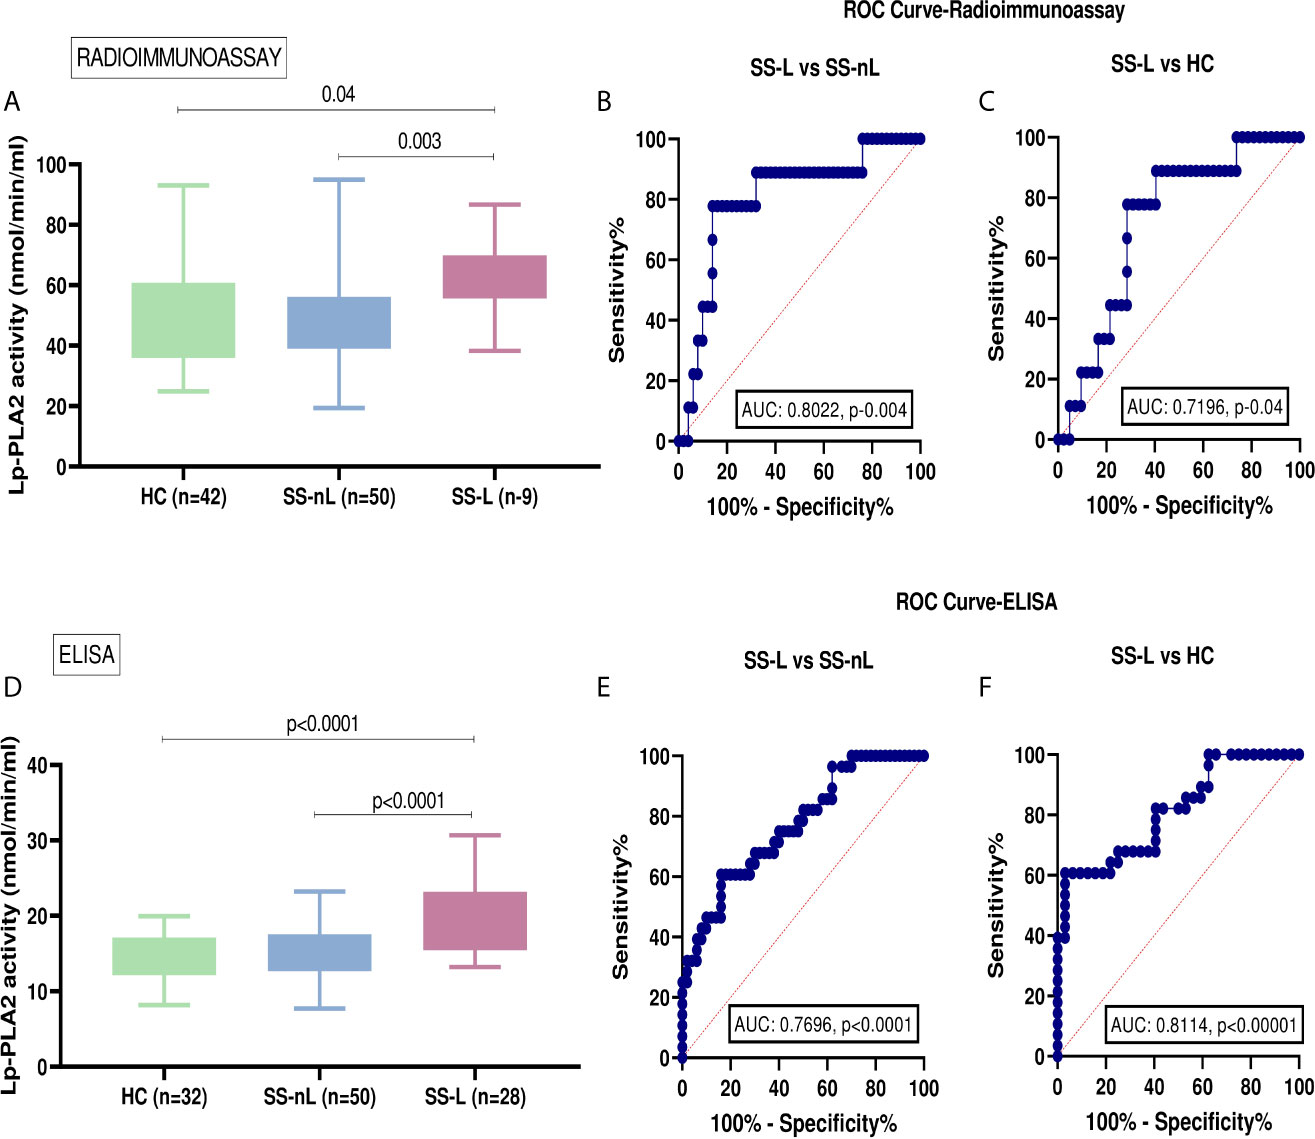
Figure 1 Serum Lp-PLA2 activity in the two SS sets of samples and receiver-operating characteristic analysis (ROC) curve analysis for both radioimmunoassay and ELISA protocols. (A) Increased Lp-PLA2 activity measured by liquid scintillation in SS-L patients compared to SS-nL (p-value: 0.003) and HC (p=0.04). (B) ROC analysis revealed that serum Lp-PLA2 activity measured by radioimmunoassay has the potential to distinguish between SS-L and SS-nL patients [area under the curve (AUC) = 0.8022, CI (95%): 0.64–0.96, p-value: 0.004]. (C) When ROC curves for the predictive models were fitted, AUC were 0.7196, CI (95%): 0.56–0.88, p-value: 0.04 for SS-L vs HC. (D) Increased Lp-PLA2 activity measured by ELISA in patients with SS-L compared to SS-nL patients (p-value: <0.0001) and HC (p-value: <0.0001). (E) ROC analysis showed that serum Lp-PLA2 activity measured by ELISA has the potential to distinguish between SS-L and SS-nL patients with AUC 0.7696, CI (95%): 0.66–0.88, p-value <0.0001 and (F) For SS-L patients vs HC, ROC curves showed an AUC 0.8114, CI (95%): 0.70–0.92, p-value < 0.0001. HC, healthy controls; SS-nL, Sjogren’s syndrome without lymphoma; SS-L, Sjogren’s syndrome complicated by lymphoma; ROC, receiver operating characteristic; AUC, area under the curve.
The activity of Lp-PLA2 as measured by ELISA was also found to be significantly higher in SS-L compared to the SS-nL group (Figure 1D) (mean ± SD [nmol/min/ml]: 19.4 ± 4.5 vs 15.2 ± 3.3, p<0.0001). A similar difference was also observed when SS-L patients were compared to HC (mean ± SD [nmol/min/ml]: 19.4 ± 4.5 vs 14.5 ± 3.0, p-value: <0.0001). Lp-PLA2 activity did not differ between SS-nL patients and HC. After comparison of the three groups by ANOVA testing, the resulting p-value was less than 0.0001. When ROC curves were constructed to evaluate the distinguishing ability of Lp-PLA2 activity between SS-nL, SS-L, and HC, the corresponding AUC were 0.7696, CI (95%): 0.66–0.88, p-value: <0.0001 (Figure 1E) and 0.8114, CI (95%): 0.70–0.92, p-value: < 0.0001 for SS-L vs HC (Figure 1F). Among SS-nL patients of low or medium risk for lymphoma development no significant difference was detected (Supplementary Figure 1B). No statistically significant differences in Lp-PLA2 activity between SS-L patients previously treated with rituximab and/or chemotherapy compared to those with no previous treatment (Supplementary Figure 2).
The mRNA expression of the PLA2G7 gene was significantly increased in MSG tissues derived from SS-L compared to both SS-nL patients and SC (4.7 ± 4.4 vs 1.3 ± 2.1 vs 0.4 ± 0.3, p-values: 0.0012 and 0.0013, respectively). No significant difference was observed between SS-nL patients and sicca controls (p-value: 0.48) (Figure 2A). Following comparison of the three groups by ANOVA testing, the resulting p-value was 0.006. When ROC curves for the predictive models were fitted, AUC were 0.8490, CI (95%): 0.71–0.99, p-value: 0.0019 for SS-L vs SS-nL patients (Figure 2B) and 0.9444, CI (95%): 0.84–1.00, p-value: 0.0027 for SS-L vs SC (Figure 2C). A marginally significant association between focus score and Lp-PLA2 MSG gene expression was detected (r = 0.38, p-value: 0.06).
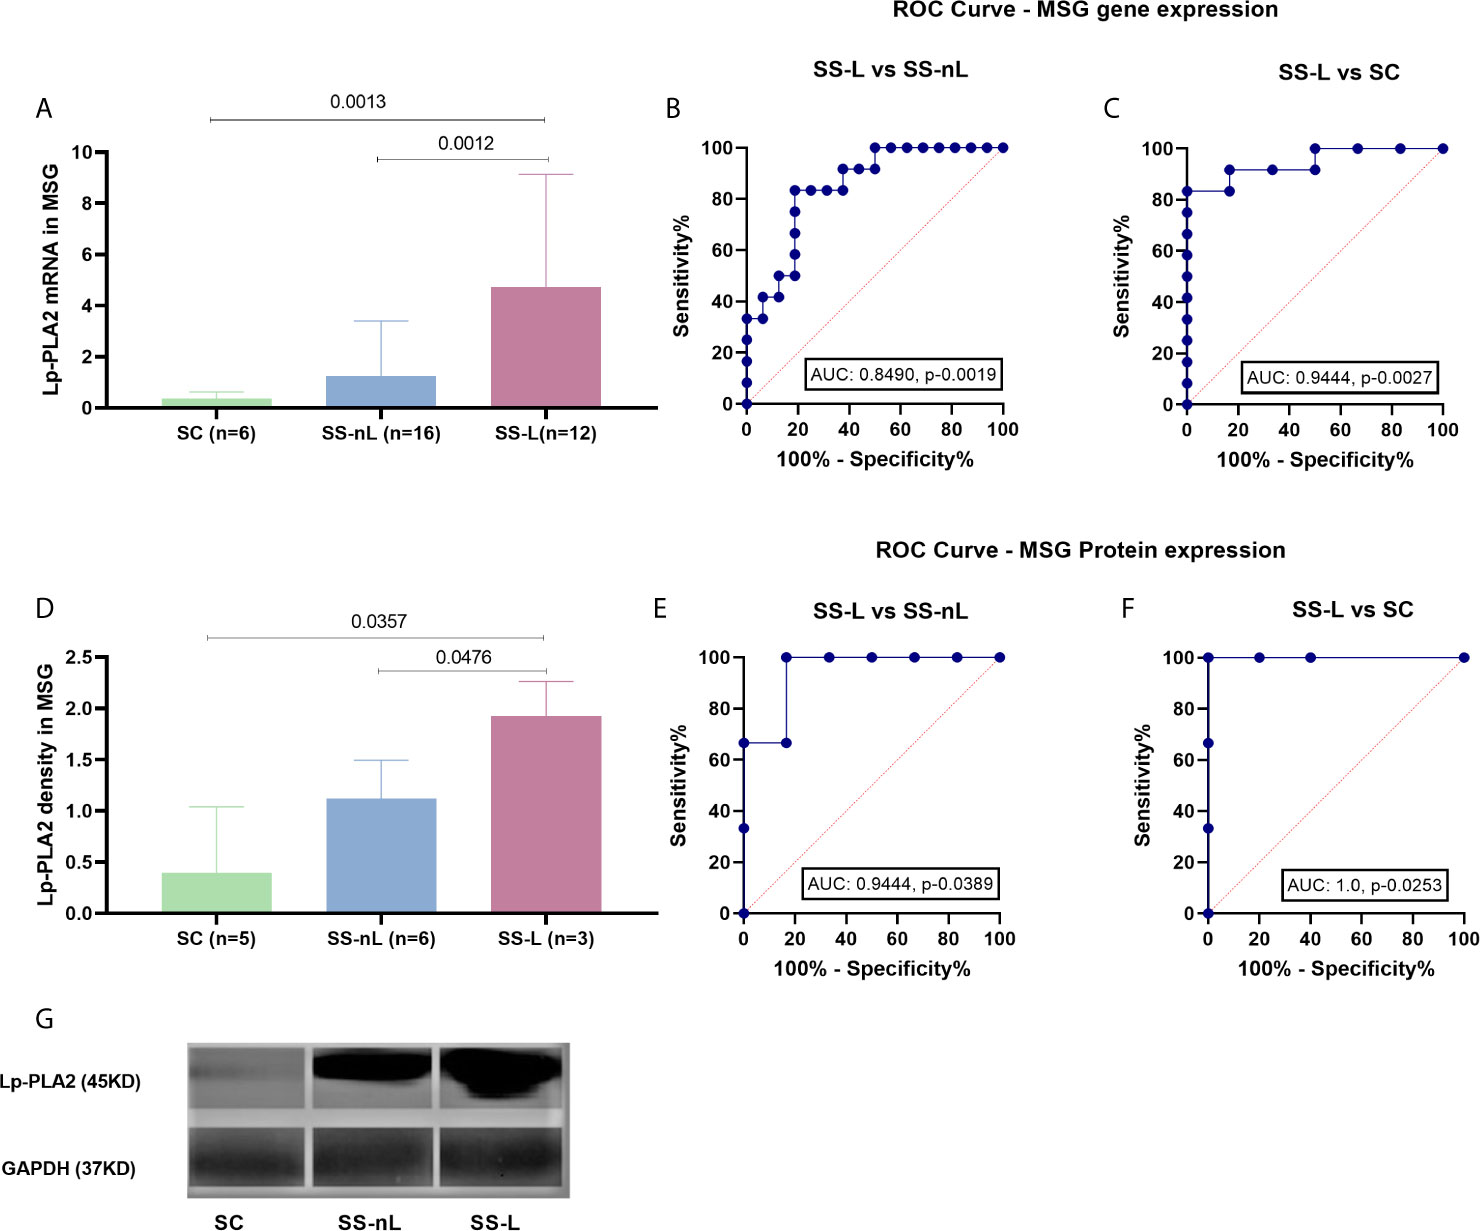
Figure 2 Lp-PLA2 (encoded by the PLA2G7 gene) mRNA expression (measured by real-time PCR) and protein density (tested by Western blot) in MSG tissues of our study participants and ROC curve analysis for both methods. (A) PLA2G7 gene expression was significantly increased in SS-L patients compared to both SS-nL patients and SC (p-values: 0.0012 and 0.0013, respectively). (B) ROC analysis could distinguish between SS-L and SS-nL patients with an AUC 0.8490, CI (95%): 0.71–0.99, p-value: 0.0019. (C) For SS-nL vs SC patients ROC curves showed an AUC 0.9444, CI (95%): 0.84–1.00, p- value: 0.0027. (D) Increased Lp-PLA2 protein expression was found in MSG total protein extracts derived from SS-L patients compared to both SS-nL patients and SC as tested by Western Blot (p-values: 0.0476 and 0.0357, respectively). (E) ROC analysis for Lp-PLA2 protein expression depicted an AUC of 0.94, CI (95%): 0.79–1.00, p-value: 0.0389 for SS-L vs SS-nL patients. (F) ROC analysis revealed an AUC of 1.00, CI (95%): 1.00–1.00, p-value: 0.0253. (G) Representative image of Lp-PLA2 and GAPDH MSG protein expression by Western Blot. SC, controls with sicca complaints; SS-n, Sjogren’s syndrome; SS-L, Sjogren’s syndrome complicated by lymphoma; ROC, receiver operating characteristic; AUC, area under the curve.
Concomitant LpLA2 salivary gland tissue gene expression and serum Lp-PLA2 activity was available for eight patients included in the study (four measured by liquid scintillation and four by ELISA). The corresponding Spearman’s correlation coefficients and p-values for the liquid scintillation and ELISA cohorts were r = 0.40, p-value = 0.75 and r = 0.80, p-value = 0.33.
Increased Lp-PLA2 protein expression was observed in MSG total protein extracts derived from SS-L patients compared to both SS-nL patients and SC, as shown by Western blot analysis (1.93 ± 0.34 vs 1.12 ± 0.37 vs 0.39 ± 0.65, p-values 0.0476 and 0.0357, respectively, Figure 2D). No significant differences were detected between SS-nL and SC groups (SS-nL, 1.12 ± 0.37 vs SC, 0.39 ± 0.65, p-value: 0.08; Figure 2D). Following comparison of the three groups by ANOVA testing, the calculated p-value was 0.004. When ROC curves for the predictive models were fitted, AUC were 0.9444, CI (95%): 0.79–1.00, p-value: 0.0389 between SS-L vs SS-nL patients (Figure 2E) and 1.00, CI (95%): 1.00–1.00, p-value: 0.0253 for SS-L vs SC (Figure 2F). A representative image of Lp-PLA2 and GAPDH MSG protein expression by Western Blot is shown in Figure 2G.
Increased Lp-PLA2 protein expression was found in MSG tissue sections derived from SS-L patients compared to both SS-nL patients and SC as tested by immunohistochemistry. Figure 3A displays a section of an MSG tissue derived from an SS-nL patient stained with isotype control. Lp-PLA2 protein expression was found mainly within lymphocytic infiltrates including tissue macrophages (the major Lp-PLA2–producing cell type) and lower expression was reported in salivary gland epithelial cells (Figures 3B–F). Of interest, immunohistochemical detection of Lp-PLA2 was detected in a lymph node derived from a non-SS patient with marginal zone lymphoma (Figures 3G, H).
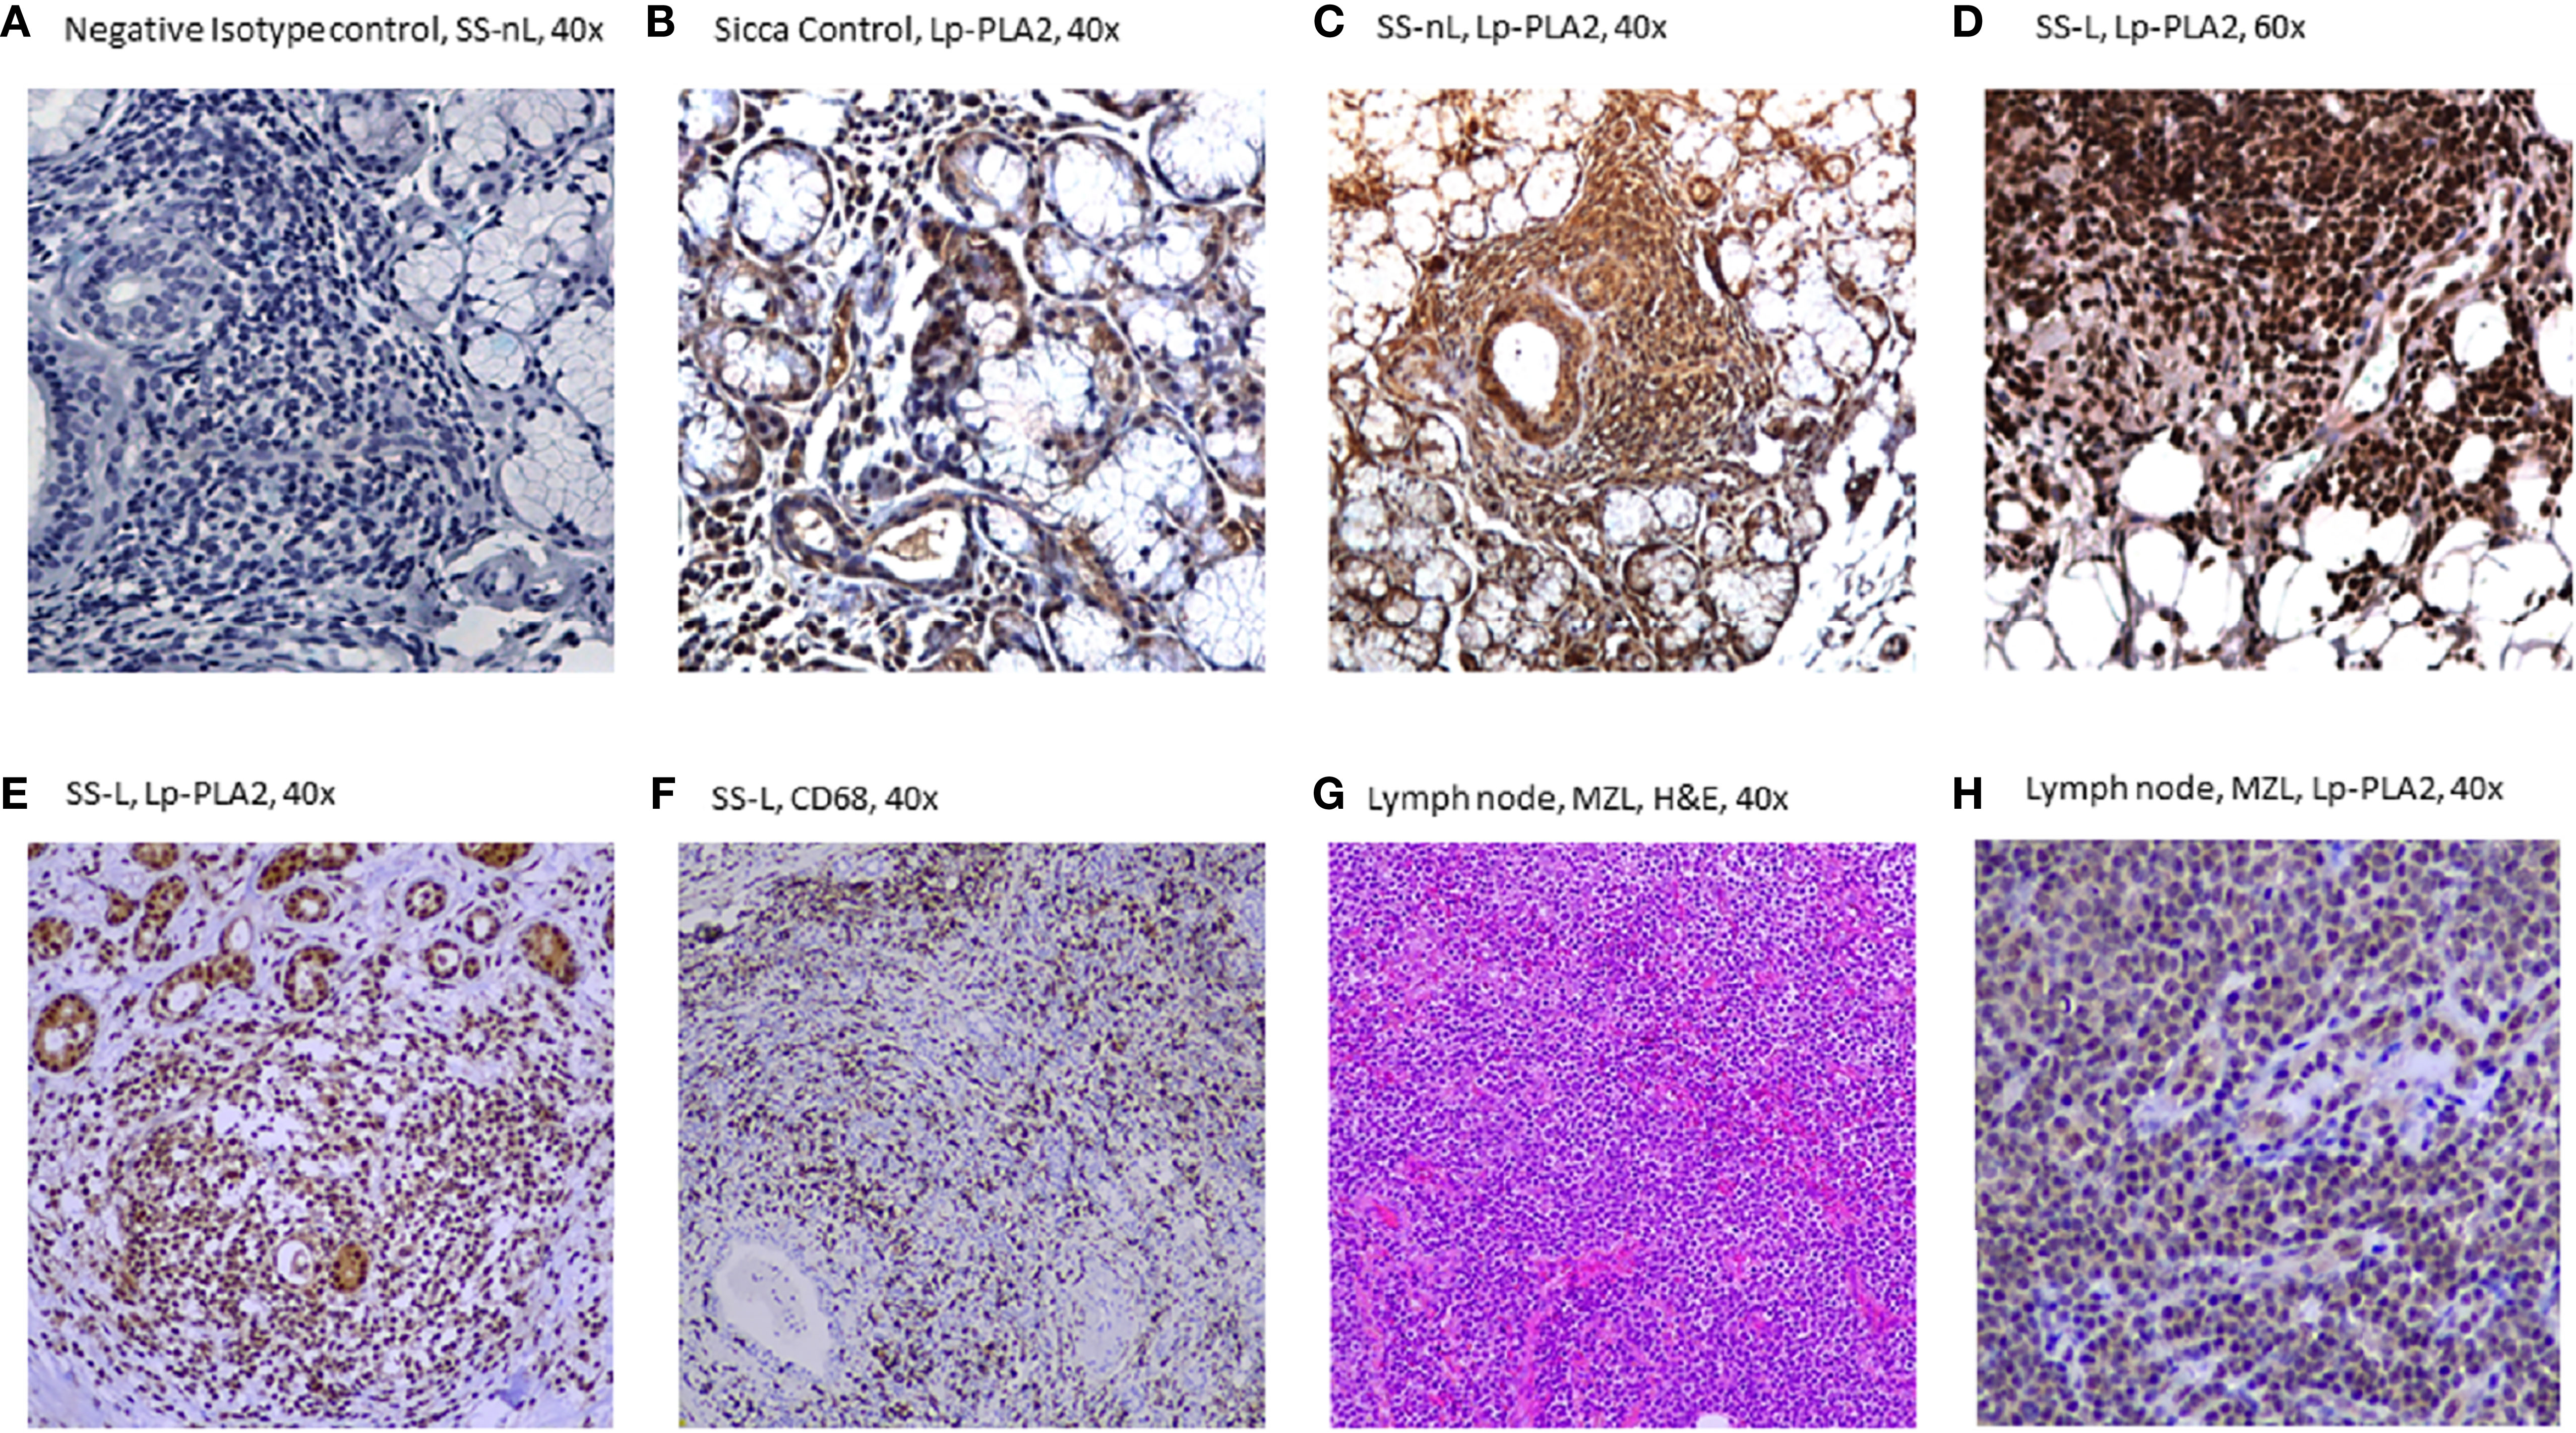
Figure 3 Lp-PLA-2 immunohistochemical expression in minor salivary gland (MSG) tissue sections from patients with sicca features (SC), Sjögren’s syndrome with no lymphoma (SS-nL), Sjogren’s syndrome with lymphoma (SS-L) (A–F), as well as in a lymph node derived from a patient with marginal zone lymphoma (G, H). (A) Isotype Control staining (grade 0), (B) Lp-PLA2 staining in SC (grade 1), (C) Lp-PLA2 staining in SS-nL (grade 2), (D) Lp-PLA2 staining in SS-L (grade 3), (E) Lp-PLA2 in SS-L, (F) CD68 staining (denoting the presence of tissue macrophages) in SS-L (same patient as E), (G) Hematoxylin & Eosin (H&E staining), marginal zone lymphoma (MZL), (H) Lp-PLA2 in a lymph node from a non-SS patient with MZL (same patient as G).
Since the role of Lp-PLA2 activity in atherosclerosis is well established in the literature, we checked whether our results were influenced by the presence of atherosclerosis or risk factors for atherosclerosis in our groups. As shown in Supplementary Table 1, no significant differences in BMI, lipid, fibrinogen, or erythrocyte sedimentation rate (ESR) levels were detected between SS and SS-L groups. Additionally, no significant correlations were detected between serum Lp-PLA2 activity and systemic inflammation markers (fibrinogen, ESR) or lipid levels (Supplementary Table 4). While a borderline significant difference was detected in the frequency of elevated C-reactive protein (CRP) levels between SS-L and SS-nL patients (57.1 vs 18.4, p=value: 0.05) (Supplementary Table 1), no statistically significant difference in serum Lp-PLA2 activity levels was observed between patients with high vs normal CRP serum levels (57.9 ± 20.8 vs 47.7 ± 13.8, p=value: 0.20, data not shown). No significant differences were observed between SS patients (with or without the presence of lymphoma) and markers of subclinical atherosclerosis (plaque formation, presence of mean intima media thickness>0.9 in carotid and femoral arteries) (Supplementary Figure 3). No patient with lymphoma was on steroids at the time of blood sampling.
This is the first study to our knowledge in which a potential role of the Lp-PLA2 molecule in SS-related lymphomagenesis is revealed. After we applied two different methods, serum Lp-PLA2 activity was found to be significantly increased in SS patients complicated by lymphoma compared to both SS non lymphoma patients and healthy controls. In accord with the serum results, mRNA and protein expressions of the Lp-PLA2 molecule were also significantly increased in MSG tissue biopsy samples derived from SS patients with lymphoma compared to both SS patients with no lymphoma and sicca controls.
While liquid scintillation initially implemented in the first set of patients is considered the gold standard for Lp-PLA2 activity measurement by quantitation of [3H]PAF degradation products, there are certain limitations for widespread use in daily routine given the production of radioactive byproducts, the need for specific equipment and its time consuming nature. In this context, the extraction of similar results after application of the much easier and faster to perform ELISA method in an independent set of SS samples, holds promise for the use of Lp-PLA2 serum activity in clinical practice. Moreover, the high AUC values as determined by ROC analysis, as well the easy access to peripheral serum sample, imply Lp-PLA2 serum activity as a highly valuable serum predictive biomarker for lymphoma development in the context of SS.
While the mechanism through which deregulation of the Lp-PLA2 enzyme contributes to lymphoma development in the context of SS is not apparently clear, previous work supported a role for several phospholipases in tumorigenesis through generation of lipid mediators. The latter seem to get involved in cellular proliferation, migration, invasion and angiogenesis, previously designated as main pathogenic processes promoting malignant transformation (35).
Heightened Lp‐PLA2 expression has been found to be upregulated in several cancerous tissues including breast, colon, kidney, liver, or lung (36–38). Of note, in human and murine colon cancer cell lines, silencing of the gene expressing Lp-PLA2 (PLA2G7) led to reduction of tumor size by 42% in vivo and the PLA2G7 knockout Apc Min/+ mice displayed vigorous suppression of intestinal polyposis and colon tumor formation (37). In patients with prostate cancer, Lp‐PLA2 has been shown to promote cancer cell migration and invasion, possibly through generation of oxidized nonesterified fatty acids and lysophosphatidylcholine (LPC) (38). The latter is a phospholipid derivative following hydrolysis of oxidized phospholipids by Lp-PLA2 and has been previously shown to augment cell-to-cell adhesion molecules on endothelial cells, induce migration and proliferation of smooth muscle cells (39, 40) and along with oxidized non esterified fatty acids promote inflammatory effects (41). Collectively, these data reinforce the idea of the contribution of the inflammatory microenvironment in promoting malignant transformation.
Plasma Lp-PLA2 activity was previously measured in plasma derived from several autoimmune and inflammatory disorders. While modest increases have been earlier observed in patients with rheumatoid arthritis compared to controls with non-inflammatory arthritides (42), systemic sclerosis (43), or lupus anticoagulant-positive or aβ2GPI IgG positive sera (44), other studies in rheumatoid arthritis (45), systemic lupus erythematosus (23), juvenile rheumatoid arthritis (46), and Crohn’s disease (24), showed opposite results with a reduced Lp-PLA2 plasma activity being detected. Whether this is a primary defect or a result of increased disease activity leading to Lp-PLA2 inactivation through increased oxidation -known to occur in these disorders- remains to be elucidated (24). No data on SS have been so far available.
Given that Lp-PLA2 activity has been previously designated as a biomarker for atherosclerosis (47), we considered the possibility that different levels detected in Lp-PLA2 activity between SS-L and SS could be influenced by different levels of atherosclerotic burden or traditional risk factors for atherosclerosis. Since no associations between plaque formation, arterial wall thickening or cardiovascular contributors was detected, we assume that the increased Lp-PLA2 activity observed in SS patients with lymphoma are not influenced by underlying subclinical cardiovascular disease. Nevertheless, the relatively small number of sicca controls and the lack of available sera prior to lymphoma development are limitations of the current study.
Taken together, our results support a putative role of Lp-PLA2 serum activity, as well as salivary gland tissue Lp-PLA2 expression as novel contributors for lymphoma development in the setting of SS. The underlying molecular pathogenetic pathways leading to lymphomagenesis and the potential of serving as novel biomarker and therapeutic target remain to be explored in further longitudinal multicenter studies.
The original contributions presented in the study are included in the article/Supplementary Material. Further inquiries can be directed to the corresponding author.
The studies involving human participants were reviewed and approved by the Laiko General Hospital of Athens and “G. Gennimatas” General Hospital of Athens Ethics Committee. The patients/participants provided their written informed consent to participate in this study.
EK, CM, and AN designed the study. All authors contributed to data collection. AN, CS, APs, KM, PG, AP, EK, and CM analyzed the data. AN, CS, PG, and EK critically interpreted the results and drafted the first version of the manuscript. All authors contributed to the article and approved the submitted version.
Hellenic Rheumatology Society, Athens, Greece. Financial support by many donors to the Institute of Applied Physiology and Exercise in Medicine and HarmonicSS EU project 731944.
The authors declare that the research was conducted in the absence of any commercial or financial relationships that could be construed as a potential conflict of interest.
The Supplementary Material for this article can be found online at: https://www.frontiersin.org/articles/10.3389/fimmu.2021.683623/full#supplementary-material
1. Skopouli FN, Dafni U, Ioannidis JP, Moutsopoulos HM. Clinical Evolution, and Morbidity and Mortality of Primary Sjogren’s Syndrome. Semin Arthritis Rheum (2000) 29(5):296–304. doi: 10.1016/s0049-0172(00)80016-5
2. Malladi AS, Sack KE, Shiboski S, Shiboski C, Baer AN, Banushree R, et al. Primary Sjogren’s Syndrome as a Systemic Disease: A Study of Participants Enrolled in an International Sjogren’s Syndrome Registry. Arthritis Care Res (2012) 64(6):911–8. doi: 10.1002/acr.21610
3. Mavragani CP, Moutsopoulos HM. The Geoepidemiology of Sjogren’s Syndrome. Autoimmun Rev (2010) 9(5):A305–10. doi: 10.1016/j.autrev.2009.11.004
4. Zintzaras E, Voulgarelis M, Moutsopoulos HM. The Risk of Lymphoma Development in Autoimmune Diseases: A Meta-Analysis. Arch Internal Med (2005) 165(20):2337–44. doi: 10.1001/archinte.165.20.2337
5. Kassan SS, Thomas TL, Moutsopoulos HM, Hoover R, Kimberly RP, Budman DR, et al. Increased Risk of Lymphoma in Sicca Syndrome. Ann Internal Med (1978) 89(6):888–92. doi: 10.7326/0003-4819-89-6-888
6. Lazarus MN, Robinson D, Mak V, Moller H, Isenberg DA. Incidence of Cancer in a Cohort of Patients With Primary Sjogren’s Syndrome. Rheumatology (2006) 45(8):1012–5. doi: 10.1093/rheumatology/kei281
7. Nezos A, Evangelopoulos ME, Mavragani CP. Genetic Contributors and Soluble Mediators in Prediction of Autoimmune Comorbidity. J Autoimmun (2019) 104:102317. doi: 10.1016/j.jaut.2019.102317
8. Risselada AP, Kruize AA, Goldschmeding R, Lafeber FP, Bijlsma JW, van Roon JA. The Prognostic Value of Routinely Performed Minor Salivary Gland Assessments in Primary Sjogren’s Syndrome. Ann Rheum Dis (2014) 73(8):1537–40. doi: 10.1136/annrheumdis-2013-204634
9. Manoussakis MN, Boiu S, Korkolopoulou P, Kapsogeorgou EK, Kavantzas N, Ziakas P, et al. Rates of Infiltration by Macrophages and Dendritic Cells and Expression of Interleukin-18 and Interleukin-12 in the Chronic Inflammatory Lesions of Sjogren’s Syndrome: Correlation With Certain Features of Immune Hyperactivity and Factors Associated With High Risk of Lymphoma Development. Arthritis Rheum (2007) 56(12):3977–88. doi: 10.1002/art.23073
10. Christodoulou MI, Kapsogeorgou EK, Moutsopoulos HM. Characteristics of the Minor Salivary Gland Infiltrates in Sjogren’s Syndrome. J Autoimmun (2010) 34(4):400–7. doi: 10.1016/j.jaut.2009.10.004
11. Nezos A, Gravani F, Tassidou A, Kapsogeorgou EK, Voulgarelis M, Koutsilieris M, et al. Type I and II Interferon Signatures in Sjogren’s Syndrome Pathogenesis: Contributions in Distinct Clinical Phenotypes and Sjogren’s Related Lymphomagenesis. J Autoimmun (2015) 63:47–58. doi: 10.1016/j.jaut.2015.07.002
12. Boumba D, Skopouli FN, Moutsopoulos HM. Cytokine mRNA Expression in the Labial Salivary Gland Tissues From Patients With Primary Sjogren’s Syndrome. Br J Rheumatol (1995) 34(4):326–33. doi: 10.1093/rheumatology/34.4.326
13. Mitsias DI, Tzioufas AG, Veiopoulou C, Zintzaras E, Tassios IK, Kogopoulou O, et al. The Th1/Th2 Cytokine Balance Changes With the Progress of the Immunopathological Lesion of Sjogren’s Syndrome. Clin Exp Immunol (2002) 128(3):562–8. doi: 10.1046/j.1365-2249.2002.01869.x
14. Vakrakou AG, Boiu S, Ziakas PD, Xingi E, Boleti H, Manoussakis MN. Systemic Activation of NLRP3 Inflammasome in Patients With Severe Primary Sjogren’s Syndrome Fueled by Inflammagenic DNA Accumulations. J Autoimmun (2018) 91:23–33. doi: 10.1016/j.jaut.2018.02.010
15. Baldini C, Santini E, Rossi C, Donati V, Solini A. The P2X7 receptor-NLRP3 Inflammasome Complex Predicts the Development of Non-Hodgkin’s Lymphoma in Sjogren’s Syndrome: A Prospective, Observational, Single-Centre Study. J Internal Med (2017) 282(2):175–86. doi: 10.1111/joim.12631
16. Nezos A, Gkioka E, Koutsilieris M, Voulgarelis M, Tzioufas AG, Mavragani CP. Tnfaip3 F127C Coding Variation in Greek Primary Sjogren’s Syndrome Patients. J Immunol Res (2018) 2018:6923213. doi: 10.1155/2018/6923213
17. Nocturne G, Boudaoud S, Miceli-Richard C, Viengchareun S, Lazure T, Nititham J, et al. Germline and Somatic Genetic Variations of TNFAIP3 in Lymphoma Complicating Primary Sjogren’s Syndrome. Blood (2013) 122(25):4068–76. doi: 10.1182/blood-2013-05-503383
18. Nezos A, Makri P, Gandolfo S, De Vita S, Voulgarelis M, Crow MK, et al. TREX1 Variants in Sjogren’s Syndrome Related Lymphomagenesis. Cytokine (2019) 132:154781. doi: 10.1016/j.cyto.2019.154781
19. Nezos A, Papageorgiou A, Fragoulis G, Ioakeimidis D, Koutsilieris M, Tzioufas AG, et al. B-Cell Activating Factor Genetic Variants in Lymphomagenesis Associated With Primary Sjogren’s Syndrome. J Autoimmun (2014) 51:89–98. doi: 10.1016/j.jaut.2013.04.005
20. Papageorgiou A, Mavragani CP, Nezos A, Zintzaras E, Quartuccio L, De Vita S, et al. A BAFF Receptor His159Tyr Mutation in Sjogren’s Syndrome-Related Lymphoproliferation. Arthritis Rheumatol (2015) 67(10):2732–41. doi: 10.1002/art.39231
21. Anderson JL. Lipoprotein-Associated Phospholipase A2: An Independent Predictor of Coronary Artery Disease Events in Primary and Secondary Prevention. Am J Cardiol (2008) 101(12A):23F–33F. doi: 10.1016/j.amjcard.2008.04.015
22. Sofogianni A, Alkagiet S, Tziomalos K. Lipoprotein-Associated Phospholipase A2 and Coronary Heart Disease. Curr Pharm Des (2018) 24(3):291–6. doi: 10.2174/1381612824666180111110550
23. Tetta C, Bussolino F, Modena V, Montrucchio G, Segoloni G, Pescarmona G, et al. Release of Platelet-Activating Factor in Systemic Lupus Erythematosus. Int Arch Allergy Appl Immunol (1990) 91(3):244–56. doi: 10.1159/000235124
24. Kald B, Smedh K, Olaison G, Sjodahl R, Tagesson C. Platelet-Activating Factor Acetylhydrolase Activity in Intestinal Mucosa and Plasma of Patients With Crohn’s Disease. Digestion (1996) 57(6):472–7. doi: 10.1159/000201376
25. Stafforini DM. Diverse Functions of Plasma Paf-AH in Tumorigenesis. Enzymes (2015) 38:157–79. doi: 10.1016/bs.enz.2015.09.005
26. Casale J, Kacimi SEO, Varacallo M. Biochemistry, Phospholipase A2. Treasure Island, FL: Statpearls (2020).
27. Dennis EA, Cao J, Hsu YH, Magrioti V, Kokotos G. Phospholipase A2 Enzymes: Physical Structure, Biological Function, Disease Implication, Chemical Inhibition, and Therapeutic Intervention. Chem Rev (2011) 111(10):6130–85. doi: 10.1021/cr200085w
28. McIntyre TM, Prescott SM, Stafforini DM. The Emerging Roles of PAF Acetylhydrolase. J Lipid Res (2009) 50(Suppl):S255–9. doi: 10.1194/jlr.R800024-JLR200
29. Shiboski CH, Shiboski SC, Seror R, Criswell LA, Labetoulle M, Lietman TM, et al. 2016 American College of Rheumatology/European League Against Rheumatism Classification Criteria for Primary Sjogren’s Syndrome: A Consensus and Data-Driven Methodology Involving Three International Patient Cohorts. Arthritis Rheumatol (2017) 69(1):35–45. doi: 10.1002/art.39859
30. Fragkioudaki S, Mavragani CP, Moutsopoulos HM. Predicting the Risk for Lymphoma Development in Sjogren Syndrome: An Easy Tool for Clinical Use. Medicine (2016) 95(25):e3766. doi: 10.1097/MD.0000000000003766
31. Gravani F, Papadaki I, Antypa E, Nezos A, Masselou K, Ioakeimidis D, et al. Subclinical Atherosclerosis and Impaired Bone Health in Patients With Primary Sjogren’s Syndrome: Prevalence, Clinical and Laboratory Associations. Arthritis Res Ther (2015) 17:99. doi: 10.1186/s13075-015-0613-6
32. Folch J, Lees M, Sloane Stanley GH. A Simple Method for the Isolation and Purification of Total Lipides From Animal Tissues. J Biol Chem (1957) 226(1):497–509. doi: 10.1016/S0021-9258(18)64849-5
33. Markakis KP, Koropouli MK, Grammenou-Savvoglou S, van Winden EC, Dimitriou AA, Demopoulos CA, et al. Implication of Lipoprotein Associated Phospholipase A2 Activity in oxLDL Uptake by Macrophages. J Lipid Res (2010) 51(8):2191–201. doi: 10.1194/jlr.M003558
34. Meyerholz DK, Beck AP. Principles and Approaches for Reproducible Scoring of Tissue Stains in Research. Lab Invest (2018) 98(7):844–55. doi: 10.1038/s41374-018-0057-0
35. Park JB, Lee CS, Jang JH, Ghim J, Kim YJ, You S, et al. Phospholipase Signalling Networks in Cancer. Nat Rev Cancer (2012) 12(11):782–92. doi: 10.1038/nrc3379
36. Lehtinen L, Vainio P, Wikman H, Huhtala H, Mueller V, Kallioniemi A, et al. PLA2G7 Associates With Hormone Receptor Negativity in Clinical Breast Cancer Samples and Regulates Epithelial-Mesenchymal Transition in Cultured Breast Cancer Cells. J Pathol Clin Res (2017) 3(2):123–38. doi: 10.1002/cjp2.69
37. Xu C, Reichert EC, Nakano T, Lohse M, Gardner AA, Revelo MP, et al. Deficiency of Phospholipase A2 Group 7 Decreases Intestinal Polyposis and Colon Tumorigenesis in Apc(Min/+) Mice. Cancer Res (2013) 73(9):2806–16. doi: 10.1158/0008-5472.CAN-12-2374
38. Vainio P, Lehtinen L, Mirtti T, Hilvo M, Seppanen-Laakso T, Virtanen J, et al. Phospholipase PLA2G7, Associated With Aggressive Prostate Cancer, Promotes Prostate Cancer Cell Migration and Invasion and Is Inhibited by Statins. Oncotarget (2011) 2(12):1176–90. doi: 10.18632/oncotarget.397
39. Yokote K, Morisaki N, Zenibayashi M, Ueda S, Kanzaki T, Saito Y, et al. The Phospholipase-A2 Reaction Leads to Increased Monocyte Adhesion of Endothelial Cells Via the Expression of Adhesion Molecules. Eur J Biochem (1993) 217(2):723–9. doi: 10.1111/j.1432-1033.1993.tb18298.x
40. Mannori G, Barletta E, Mugnai G, Ruggieri S. Interaction of Tumor Cells With Vascular Endothelia: Role of Platelet-Activating Factor. Clin Exp Metastasis (2000) 18(1):89–96. doi: 10.1023/a:1026548700247
41. Huang F, Wang K, Shen J. Lipoprotein-Associated Phospholipase A2: The Story Continues. Med Res Rev (2020) 40(1):79–134. doi: 10.1002/med.21597
42. Dulioust A, Hilliquin P, Menkes CJ, Benveniste J, Arnoux B. Paf-Acether Acetylhydrolase Activity Is Increased in Patients With Rheumatic Diseases. Scand J Rheumatol (1992) 21(4):161–4. doi: 10.3109/03009749209099215
43. Yanaba K, Asano Y, Tada Y, Sugaya M, Kadono T, Sato S. Clinical Significance of Circulating Platelet-Activating Factor Acetylhydrolase Levels in Systemic Sclerosis. Arch Dermatol Res (2012) 304(3):203–8. doi: 10.1007/s00403-011-1196-y
44. Fabris M, Cifu A, Pistis C, Siega-Ducaton M, Fontana DE, Giacomello R, et al. Exploring the Plasmatic Platelet-Activating Factor Acetylhydrolase Activity in Patients With Anti-Phospholipid Antibodies. Auto- Immun Highlights (2017) 8(1):5. doi: 10.1007/s13317-017-0092-7
45. Lourida ES, Georgiadis AN, Papavasiliou EC, Papathanasiou AI, Drosos AA, Tselepis AD. Patients With Early Rheumatoid Arthritis Exhibit Elevated Autoantibody Titers Against Mildly Oxidized Low-Density Lipoprotein and Exhibit Decreased Activity of the Lipoprotein-Associated Phospholipase A2. Arthritis Res Ther (2007) 9(1):R19. doi: 10.1186/ar2129
46. Tselepis AD, Elisaf M, Besis S, Karabina SA, Chapman MJ, Siamopoulou A. Association of the Inflammatory State in Active Juvenile Rheumatoid Arthritis With Hypo-High-Density Lipoproteinemia and Reduced Lipoprotein-Associated Platelet-Activating Factor Acetylhydrolase Activity. Arthritis Rheum (1999) 42(2):373–83. doi: 10.1002/1529-0131(199902)42:2<373::AID-ANR21>3.0.CO;2-3
Keywords: Sjögren’s syndrome, lymphomagenesis, lipoprotein-associated phospholipase A2 (Lp-PLA2), serum biomarker, novel therapeutic target
Citation: Nezos A, Skarlis C, Psarrou A, Markakis K, Garantziotis P, Papanikolaou A, Gravani F, Voulgarelis M, Tzioufas AG, Koutsilieris M, Moutsopoulos HM, Kotsifaki E and Mavragani CP (2021) Lipoprotein-Associated Phospholipase A2: A Novel Contributor in Sjögren’s Syndrome-Related Lymphoma? Front. Immunol. 12:683623. doi: 10.3389/fimmu.2021.683623
Received: 21 March 2021; Accepted: 24 May 2021;
Published: 18 June 2021.
Edited by:
Alan Baer, Johns Hopkins University, United StatesReviewed by:
Gaetane Nocturne, U1184 Centre de recherche en Immunologie des Infections virales et des maladies auto-immunes (INSERM), FranceCopyright © 2021 Nezos, Skarlis, Psarrou, Markakis, Garantziotis, Papanikolaou, Gravani, Voulgarelis, Tzioufas, Koutsilieris, Moutsopoulos, Kotsifaki and Mavragani. This is an open-access article distributed under the terms of the Creative Commons Attribution License (CC BY). The use, distribution or reproduction in other forums is permitted, provided the original author(s) and the copyright owner(s) are credited and that the original publication in this journal is cited, in accordance with accepted academic practice. No use, distribution or reproduction is permitted which does not comply with these terms.
*Correspondence: Clio P. Mavragani, a21hdXJhZ2FuQG1lZC51b2EuZ3I=
†These authors have contributed equally to this work and share first authorship
‡These authors have contributed equally to this work and share last authorship
Disclaimer: All claims expressed in this article are solely those of the authors and do not necessarily represent those of their affiliated organizations, or those of the publisher, the editors and the reviewers. Any product that may be evaluated in this article or claim that may be made by its manufacturer is not guaranteed or endorsed by the publisher.
Research integrity at Frontiers
Learn more about the work of our research integrity team to safeguard the quality of each article we publish.