 Yumeng Qi
 Liming Zhang
 Xiaonan Yang2
 Biao Tang
 Ting Xiao
95% of researchers rate our articles as excellent or good
Learn more about the work of our research integrity team to safeguard the quality of each article we publish.
Find out more
ORIGINAL RESEARCH article
Front. Immunol. , 03 September 2021
Sec. Autoimmune and Autoinflammatory Disorders
Volume 12 - 2021 | https://doi.org/10.3389/fimmu.2021.681714
Background: Chronic spontaneous urticaria (CSU) is a common autoimmune skin disease. Little is known about the role of epigenetics in the pathogenesis of CSU. This study aimed to investigate genome-wide DNA methylation profile in whole blood of patients with CSU.
Patients and Methods: Genome-wide DNA methylation levels in whole blood samples of 95 Chinese Han ethnicity adult CSU patients and 95 ethnicity-, age- and sex-matched healthy controls were analyzed using Illumina 850K methylation chip. The differentially methylated genes (DMGs) were screened out and then functionally annotated by the gene ontology and the Kyoto encyclopedia of genes and genomes databases.
Results: A total of 439 differentially methylated positions (DMPs) (p < 0.01 and |Δβ| ≥ 0.06) were identified with 380 hypomethylated and 59 hypermethylated. The average global DNA methylation levels of the 439 DMPs in the CSU patients were significantly lower than those in the healthy controls (p < 0.001). The distribution of the 439 DMPs was wide on chromosome 1 to 22 and chromosome X. Chromosome 6 embodied the largest number of DMPs (n = 51) and their annotated genes were predominantly related to autoimmunity. The 304 annotated DMGs were mainly enriched in autoimmune disease- and immune-related pathways. A total of 41 DMPs annotated to 28 DMGs were identified when p < 0.01 and |Δβ| ≥ 0.1. Of the 28 DMGs, HLA-DPB2, HLA-DRB1, PPP2R5C, and LTF were associated with autoimmunity. CSU cases with elevated total IgE, positive anti-thyroid peroxidase IgG autoantibodies, positive anti-thyroglobulin IgG autoantibodies, angioedema, UASday > 4, or recurrent CSU showed phenotype-specific DMPs as compared with cases with normal total IgE, negative anti-thyroid peroxidase IgG autoantibodies, negative anti-thyroglobulin IgG autoantibodies, no angioedema, UASday ≤ 4, or non-recurrent CSU respectively.
Conclusion: This study shows a distinct genome-wide DNA methylation profile in Chinese Han ethnicity adult CSU patients and indicates a role of epigenetics in the pathogenesis of CSU. The predominant enrichment of the CSU-associated DMGs in immunological pathways provides supportive evidence for the immunopathogenesis of CSU. Future research on the CSU-associated DMPs and DMGs will help discover potential therapeutic targets for CSU.
Chronic spontaneous urticaria (CSU) is a common mast cell-driven allergic dermatosis characterized by spontaneous wheals, angioedema, or both lasting for at least 6 weeks (1). CSU is a polygenic autoimmune skin disease and has a multi-factorial pathogenesis. Although previous candidate gene studies have reported some CSU-associated genetic variants (Supplementary Table 1), so far, no widely accepted susceptibility or risk loci of CSU have been identified. The interaction of genetic and environmental factors in the pathogenesis of CSU suggests a possibility of epigenetic dysregulation as a contributor of development of CSU. Although autoimmune theories of skin mast cell activation in CSU have been widely accepted (2), epigenetic pathomechanisms in CSU remain unclear.
CSU has been reported to be associated with autoimmune diseases including autoimmune thyroid diseases (ATDs), inflammatory bowel diseases (IBDs), rheumatoid arthritis (RA), type I diabetes (TID), and vitiligo (3). Dysregulated DNA methylation is related to the pathogenesis of systemic lupus erythematosus (SLE) and RA (4) and differentially methylated genes (DMGs) have been used as biomarkers for disease activity, treatment response and prognosis of SLE, ATDs and IBDs (5–7).
To the best of our knowledge, so far, no genome-wide DNA methylation study of CSU has been published. In this study, we performed a genome-wide DNA methylation analysis using whole blood samples of a Chinese Han ethnicity adult CSU population. The potential target signal pathways of the DMGs were bioinformatically analyzed.
Ninety-five Chinese Han ethnicity adult outpatients with active CSU diagnosed according to the criteria of the EAACI/GA2LEN/EDF/WAO guideline were enrolled from June 2014 to April 2018 (8). Recurrent CSU was defined as occurrence of CSU after absence of symptoms for at least 1 year without administering any medications. Patients with chronic inducible urticaria, urticarial vasculitis, or CSU patients who had been treated by systemic corticosteroids and/or immunosuppressants were excluded. CSU patients who simultaneously suffered from active autoimmune diseases or allergic diseases were excluded. Demographic data, medical histories, and clinical data were obtained using a questionnaire on presentation. Physical examinations and urticaria activity score of 1 day (UASday) were performed and evaluated by a dermatologist and a postgraduate. Ninety-five ethnicity-, age-, and sex-matched healthy controls with serum total IgE (tIgE) <100 IU/ml, negative specific IgEs (sIgEs), negative anti-thyroid peroxidase (TPO) IgG autoantibodies (AAbs), and negative anti-thyroglobulin (TG) IgG AAbs were recruited. This study was approved by the institutional ethics committee of The First Hospital of China Medical University. Each participant signed a written informed consent.
We used a therapeutic regimen as previously described (9). Second-generation H1-antihistamines (sgAHs) in licensed doses were used as the first-step treatment. An increase in the dose of the sgAHs to a maximum of fourfold dose or combinations of sgAHs up to a fourfold equivalent dose comprised the second-step treatments. H2-antihistamines (ranitidine or famotidine) and/or leukotriene receptor antagonist (montelukast) was added as the third-step treatments. Before complete control was achieved, or during the dose-increment stage, patients were assessed weekly and UASday was recorded at each visit. CSU cases failing to be completely controlled by fourfold doses or fourfold equivalent doses of sgAHs for at least 2 weeks were designated as sgAHs-refractory cases.
Serum levels of tIgE (Euroimmun, Lübeck, Germany) were measured using ELISA kits according to the manufacturer’s protocols (normal range: 0–100 IU/ml). Serum sIgEs were detected using immunoblotting (Euroimmun) as previously described (10). The detected sIgEs included 8 inhalant sIgEs and 10 food sIgEs. A test result of < 0.70 kU/L was considered negative. Serum levels of anti-TPO (normal range: 0.00–5.61 IU/ml) and anti-TG (normal range: 0.00–4.11 IU/ml) IgG AAbs were measured according to the manufacturer’s protocols (Abbott Park, Middletown, USA).
Genomic DNA was isolated from whole blood using QIAamp DNA MiniKit (Qiagen, Hilden, Germany). The purity and concentration of DNA was estimated using Nanodrop 2000 (Thermo)/Quibt 3.0. Then, 500 ng DNA of each sample was used to bisulfite converted using EZ DNA Methylation Kits (Zymo Research, USA), and the converted products were put into Illumina Infinium Human Methylation 850K BeadChip (Illumina Inc, CA, USA) in accordance with the manufacturer’s guidelines and protocol.
The array data of Illumina methylation chip (.IDAT files) were analyzed using ChAMP package in the R software for deriving the methylation level. Firstly, CpG probe filtering of raw data was performed by removing (1) CpG probes with a detection p ≥ 0.01 in 1% of samples; (2) CpG probes with bead count < 3 in 5% of samples; (3) non-CpG probes; (4) CpG probes with single-nucleotide polymorphisms (SNPs) relation; and (5) CpG probes that aligned to multiple locations. Secondly, beta-mixture quantile normalization adjustments for correcting type I and type II probe design bias were used to standardize the methylation data (11). Thirdly, we used singular value decomposition (SVD) analysis to analyze the batch effect caused by BeadChip slide and array, then applied Combat to correct this batch effect (12). SVD analysis was also used to analyze the effect of confounders including age, sex and smoking status on the DNA methylation of the samples.
As genomic DNA was extracted from clustering leukocytes, we estimated leukocyte compositions including CD4+ T lymphocytes, CD8+ T lymphocytes, natural killer (NK) cells, B lymphocytes, monocytes, and granulocytes, by the RefbaseEWAS method for inferring changes in the distribution of leukocytes between the CSU patients and the healthy controls using DNA methylation signatures, in combination with a previously obtained external validation set consisting of signatures from purified leukocyte samples (13).
Differential methylated CpG positions were calculated by differentially methylated position (DMP) analysis of ChAMP, and the corrected p values were computed using the Benjamini–Hochberg method (14). The methylation level of each CpG probe was denoted as a β value. The Δβ of each CpG site represents the difference in average β values of the CSU patients and the healthy controls. A CpG site with |Δβ| ≥ 0.06 and p < 0.01 was considered as a DMP or a differentially methylated CpG site. A CpG site was considered hypermethylated if Δβ ≥ 0.06 or hypomethylated when Δβ ≤ −0.06.
Since there are many different cell types in the whole blood, the difference caused by the change of a single cell type is not significant in the whole blood. Therefore, the cutoff value for β of the whole blood sample is generally low. In previous literature, 0.1 was commonly used as a cutoff value for β in peripheral blood samples. In this study, we used 0.06 as the cutoff value for β (simultaneously p < 0.01) for bioinformatic analysis and 0.1 as the cutoff value for β for single CpG site analysis. Moreover, 0.06 was used as the cutoff value for β to avoid the chip-based error of 0.05 in this study.
To explore the potential biological functions of target genes of DMPs or differentially methylated CpG sites, we performed gene ontology enrichment analysis including molecular function, cellular component, and biological process using the Annotation, Visualization, and Integrated Discovery (DAVID) database as well as pathway enrichment analysis using the Kyoto Encyclopedia of Genes and Genomes (KEGG) database. A p value < 0.05 was used as the threshold to select the significantly enriched gene ontology terms and pathways.
Data were processed using GraphPad Prism 8.0 and SPSS 23.0. Normally distributed continuous variables were compared by using Student’s t-test while Mann–Whitney U-test was used for comparison of non-normally distributed continuous variables. The associations between categorical variables were analyzed using Pearson’s chi-squared test. p < 0.05 was considered statistically significant. We use p-value in the test of the entire article rather than corrected p-value.
Demographic, clinical, and laboratory data of the 95 CSU patients and the 95 healthy controls are summarized in Supplementary Table 2. The 95 CSU patients achieved complete control using different treatment regimens. Among the 95 patients, 36 were refractory. The therapeutic regimens and characteristics of the 36 refractory cases and 59 non-refractory cases are listed in Supplementary Tables 3–5.
A total of 832,347 CpG sites were analyzed following quality filtering and data normalization. The raw data will be available at https://www.biosino.org/node with accession number OEP002482 upon approval by Ministry of Science and Technology, China. Density plot showed relatively similar methylation levels in the samples from the CSU patients and the healthy controls (Figure 1A). Principal component analysis (PCA) based on all 832,347 CpG sites did not reveal any discernable separation of the CSU patients from the healthy controls (Figure 1B). Leukocyte composition analysis showed that the percentages of CD8+ T lymphocytes, NK cells, and monocytes were significantly lower in the CSU patients than those in the healthy controls, whereas the percentage of granulocytes was significantly higher in the CSU patients than that in the healthy controls (Table 1).
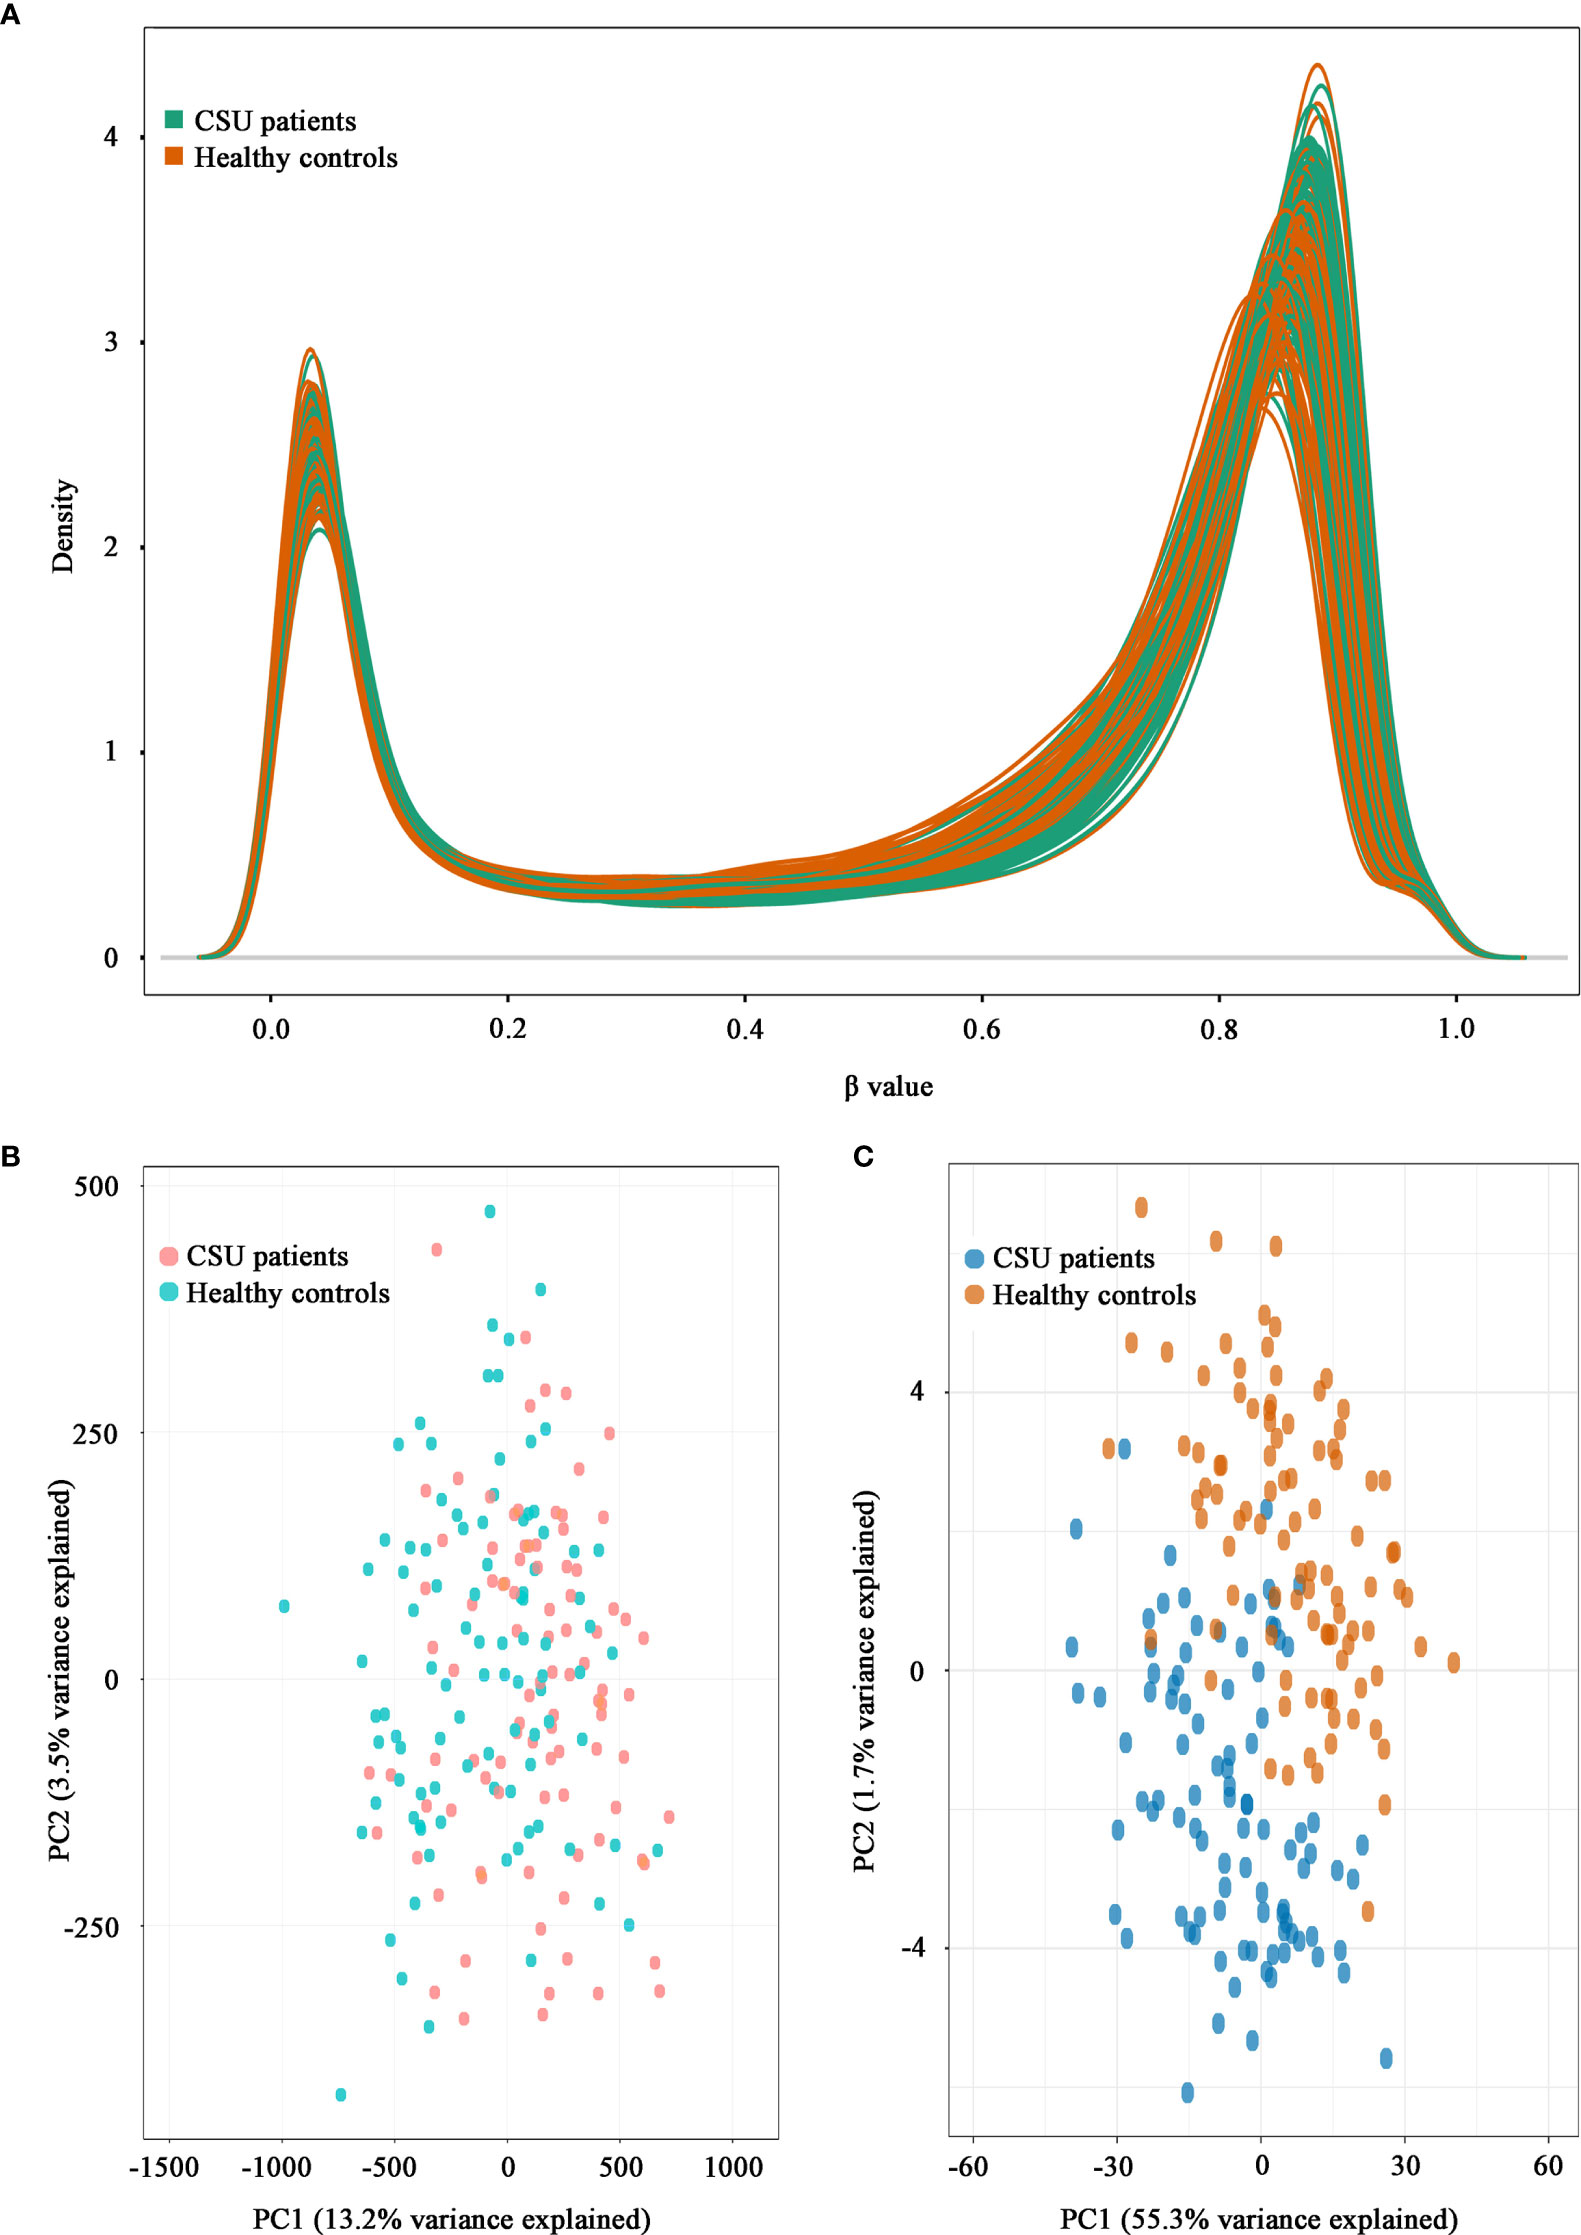
Figure 1 Density plot and principal component analysis (PCA) plot. (A) Density plot. The methylation levels of the 95 CSU patients (green lines) and the 95 healthy controls (red lines) are expressed as β values. (B) PCA plot based on all 832,347 CpG sites. No discernable separation is observed between the CSU patients (red dots) and the healthy controls (green dots). PC1, principal component 1 (13.2% variance explained); PC2, principal component 2 (3.5% variance explained). (C) PCA plot based on 439 differentially methylated positions (DMPs). Two different clusters are observed between the CSU patients (blue dots) and the healthy controls (red dots). PC1, principal component 1 (55.3% variance explained); PC2, principal component 2 (1.7% variance explained).
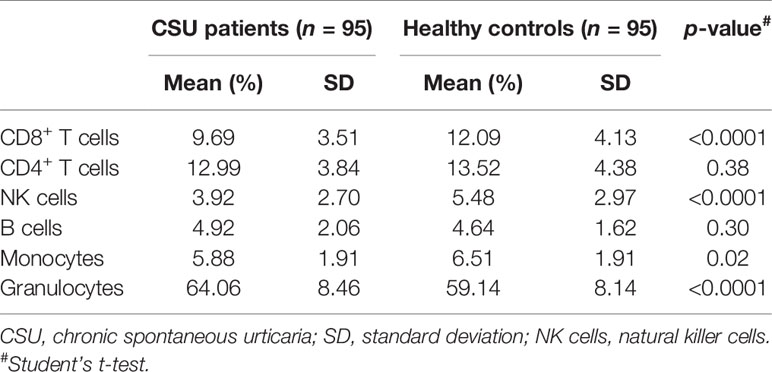
Table 1 Comparisons of the percentages of the leukocyte components in the CSU patients and the healthy controls.
The methylation levels of the CpG sites in the CSU patients and the healthy controls were strongly correlated (R2 = 0.999, p < 0.0001, Figure 2A). Compared with the 95 healthy controls, 439 DMPs (p < 0.01 and |Δβ| ≥ 0.06) were identified in the 95 CSU patients. Among the 439 DMPs, 380 (86.56%) were hypomethylated (p < 0.01 and Δβ ≤ −0.06) and 59 (13.44%) were hypermethylated (p < 0.01 and Δβ ≥ 0.06) (Supplementary Table 6). Volcano plot of the differential DNA methylation analysis showed obviously that the number of hypomethylated DMPs were far more than that of hypermethylated DMPs (Figure 2B). Although there was some overlap between the CSU patients and the healthy controls, the PCA based on the 439 DMPs showed two different clusters between the CSU patients and the healthy controls (Figure 1C).
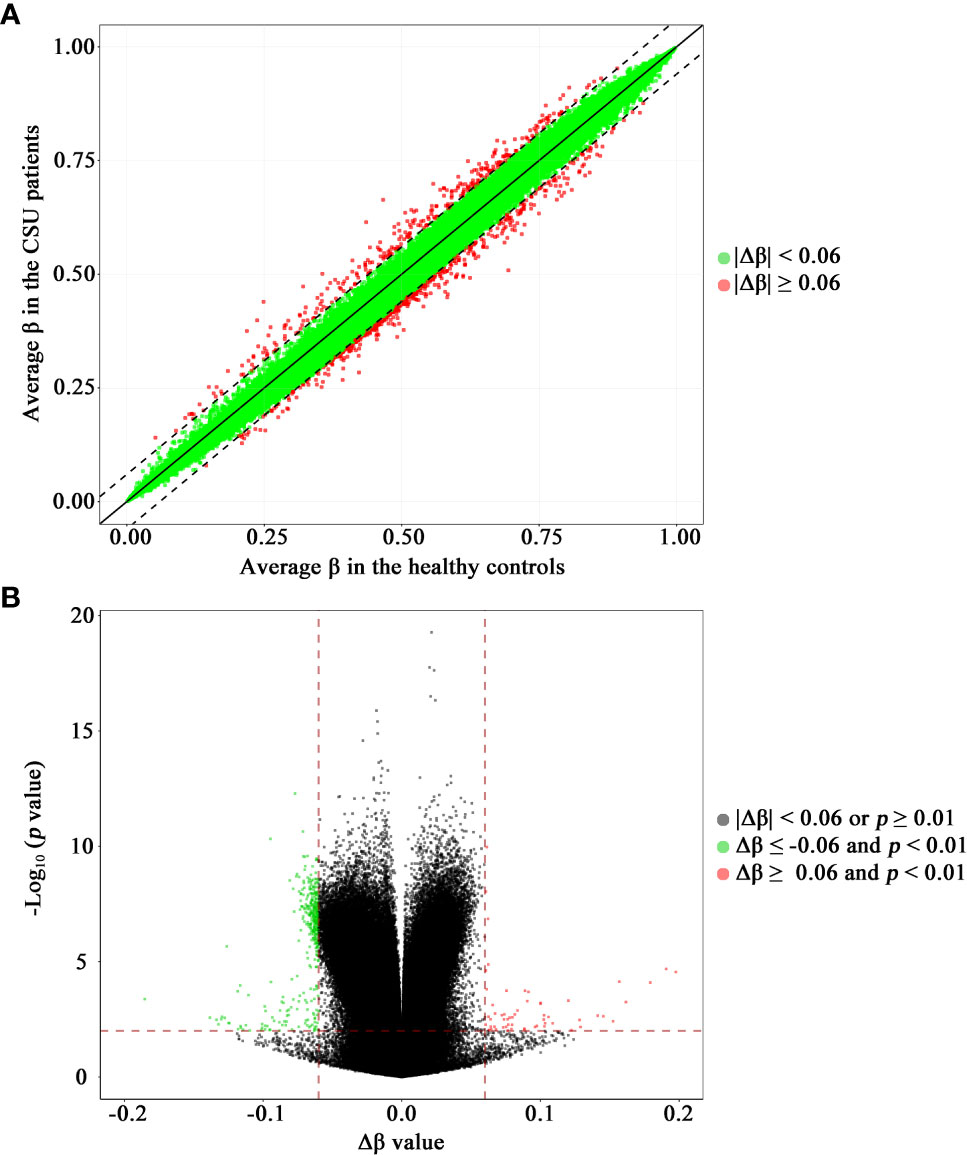
Figure 2 Scatter plot and volcano plot of the 832,347 CpG sites between the CSU patients and the healthy controls. (A) Scatter plot. This scatter plot indicates the overall correlation of the average methylation levels between the CSU patients and the healthy controls. The ordinate and abscissa represent the average β value for each CpG site of the 95 CSU patients and the 95 healthy controls, respectively. A CpG site with |Δβ| < 0.06 and a CpG site with |Δβ| ≥ 0.06 is signed by a green circle and a red circle, respectively. (B) Volcano plot. The ordinate represents the p-value (−log10 scale) for each CpG site and the abscissa represents the Δβ value of each CpG site. Thresholds are shown as dashed lines. The vertical red dashed lines represent 6% change in Δβ values. The horizontal red dashed line represents the significant cutoff of p = 0.01. A gray circle represents a CpG site with |Δβ| < 0.06 or p ≥ 0.01. A green circle represents a hypomethylated differentially methylated position (DMP) with Δβ ≤ −0.06 and p < 0.01. A red circle represents a hypermethylated DMP with Δβ ≥ 0.06 and p < 0.01. CSU, chronic spontaneous urticaria.
The average global DNA methylation levels of the 832,347 CpG sites between the 95 CSU patients and the 95 healthy controls showed no significant difference (Figure 3A). The average global DNA methylation levels of the 439 DMPs in the 95 CSU patients were significantly lower than those in the 95 healthy controls (p < 0.0001) (Figure 3B). The average methylation levels of the 59 hypermethylated DMPs in the 95 CSU patients were significantly higher than those in the 95 healthy controls (p = 0.02) and the average methylation levels of the 380 hypomethylated DMPs in the 95 CSU patients were significantly lower than those in the 95 healthy controls (p < 0.0001) (Figures 3C, D).
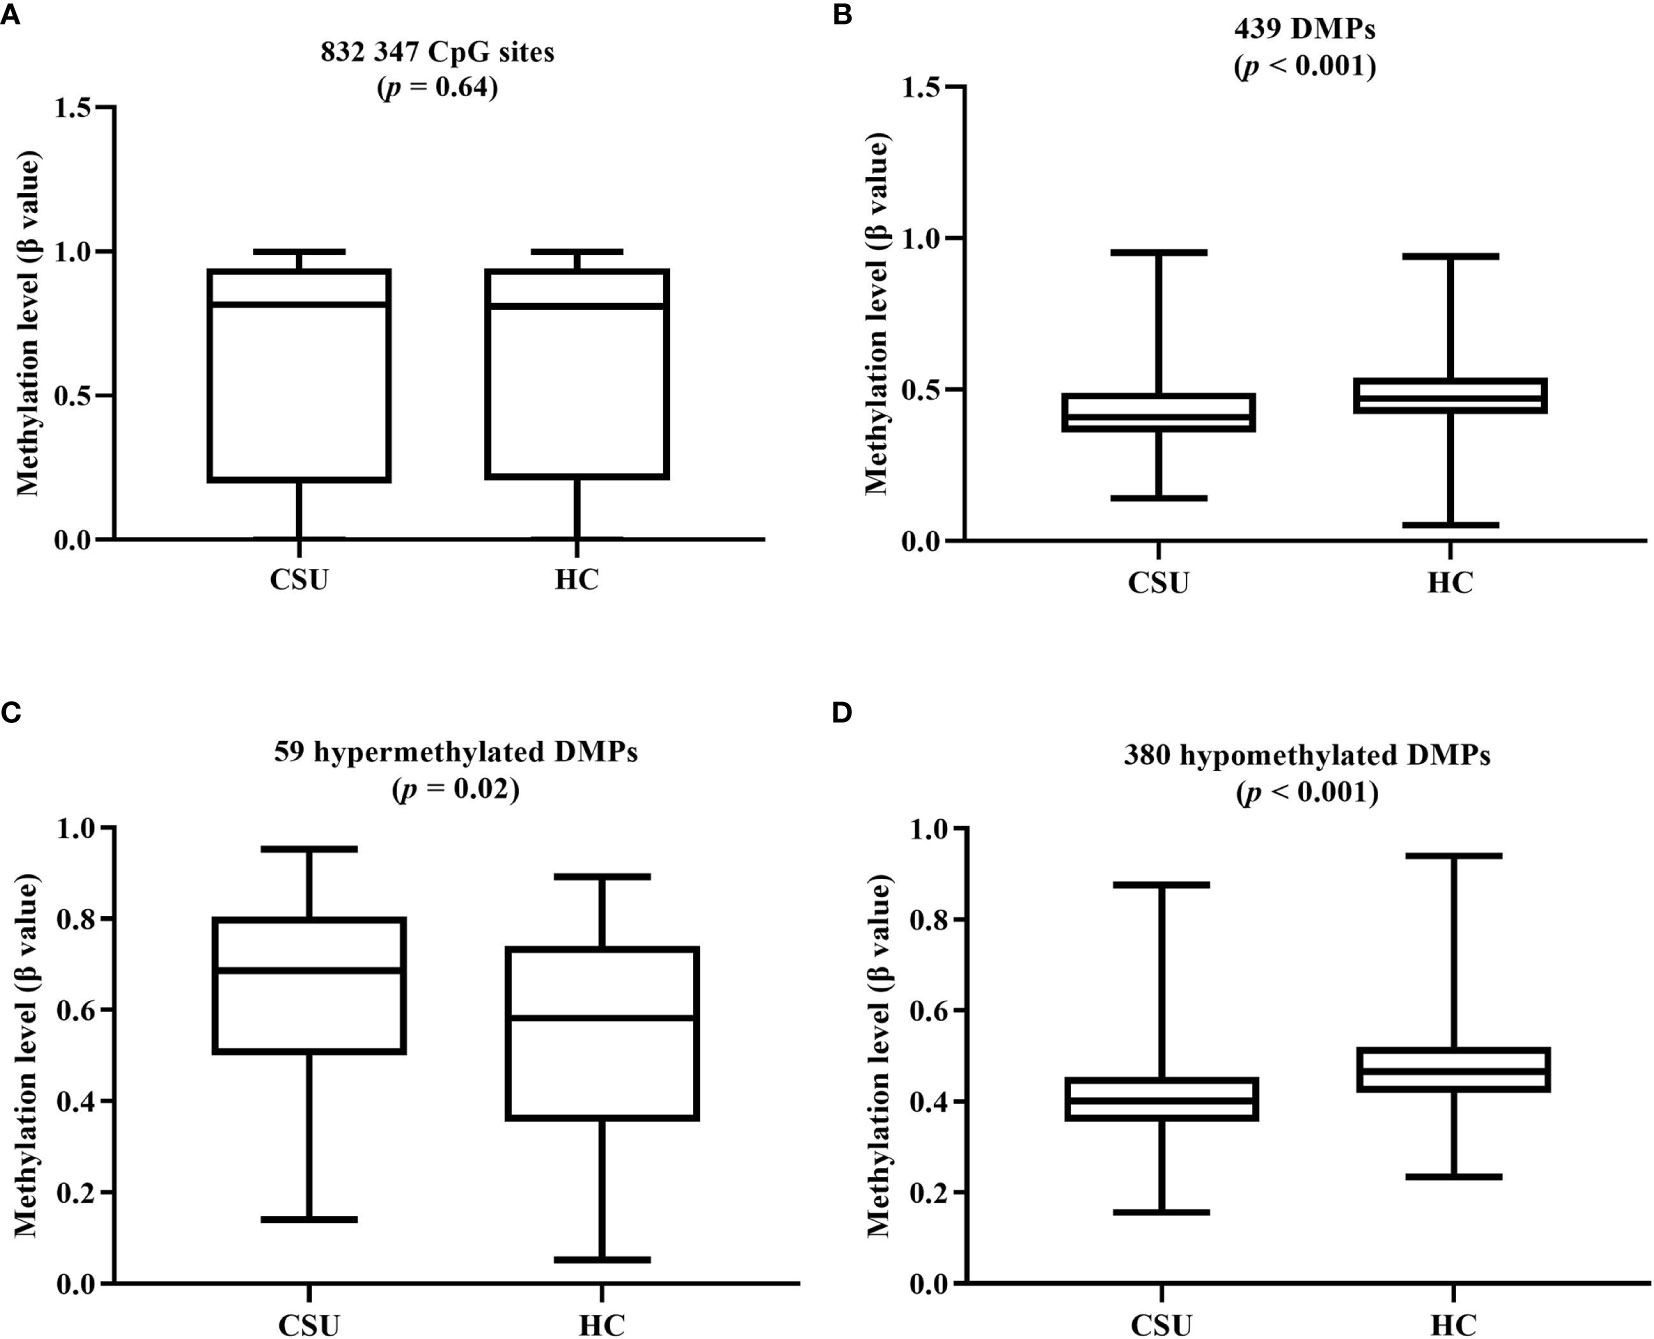
Figure 3 (A) The average global levels of DNA methylation for the 832,347 CpG sites between the CSU patients and the healthy controls (HCs) showed no significant difference (p = 0.64). (B) The average methylation levels (β values) of the 439 differentially methylated positions (DMPs) in the 95 CSU patients were significantly lower than those in the 95 HCs (p < 0.0001). (C) With regard to the 59 hypermethylated DMPs, the average methylation levels of the 95 CSU patients were significantly higher than those of the HCs (p = 0.02). (D) Concerning the 380 hypomethylated DMPs, the average methylation levels of the 95 CSU patients were significantly lower than those of the HCs (p < 0.0001).
We used SVD analysis to analyze the effect of confounders including age, sex, and smoking status on the DNA methylation of the samples. From the statistical p values corresponding to the color blocks (Supplementary Figure 1), age, sex and smoking status (28 CSU patients and 4 healthy controls were active smokers) showed significant correlation with DNA methylation of the samples. Then, we searched in PubMed for previously reported age-, sex-, and smoking-related CpGs and used the online tool of Venny 2.1 assisted by manual checking to identify overlapped DMPs. No overlapped DMP was found between the 439 DMPs discovered in our study and previously reported age-related CpGs (15) or smoking-related CpGs (16). In the 439 DMPs, 5 CpGs (cg04732279, cg12873598, cg16158408, cg11887420, and cg18105467) were located on chromosome X. However, none of the 5 CpGs was overlapped with previously reported sex-related CpGs (17). Therefore, the effect of confounders including age, sex, and smoking status on the DNA methylation of the 439 DMPs discovered in our study was excluded.
The 439 DMPs in the 95 CSU patients were distributed widely on chromosome 1 to 22 and chromosome X (Figure 4A). Among the 23 chromosomes, chromosome 6 contained the largest number of DMPs (n = 51), among which 15 DMPs-annotated genes TRIM38, MAP3K5, ARG1, C6orf106, SRPK1, MAPK14, COL11A2, HLA-DRB1, HLA-DPB2, HLA-DQB1, HLA-C, C6orf10, BAT3, HLA-DPB1, and COL21A1 were definitely involved in autoimmunity in the literature. Moreover, the comparisons between the distribution intensity of the 439 DMPs on each chromosome and the corresponding distribution intensity of the 832,347 CpG sites on each chromosome showed that only the ratio of chromosome 6 had a significant elevation (Table 2). With regard to corresponding gene regions (Figure 4B), 79 (16.70%) DMPs were located in proximal promoter regions including TSS1550 (200–1,500 bp upstream of the transcription starting site), TSS200 (200 bp upstream of the transcription starting site), 5’UTR, and 1st exon. We observed significant differences in the distribution percentages of the 439 DMPs on the TSS1500, the TSS200, the 1st Exon, the gene body, and the 3’ UTR as compared with the distribution percentages of the 832,347 CpG sites on each gene region, respectively. While the distribution percentages of the 439 DMPs and the 832,347 CpG sites on the 5’UTR and the intergenic region were not significantly different (Supplementary Table 7). Concerning CpG island regions in relation to the 439 DMPs (Figure 4C), 350 (79.73%) DMPs were located in the Open Sea (DNA outside the CpG island regions), 15 were located in the CpG island, 43 were located on the CpG shores (0–2 kb upstream and downstream of the CpG island, also called North and South Shore), and 31 were located on the Shelves (2–4 kb upstream and downstream of the CpG island, also called North and South Shelf). Significant differences were observed between the distribution percentages of the 439 DMPs and the 832,347 CpG sites on the island, S shore, and the open sea (Supplementary Table 8).
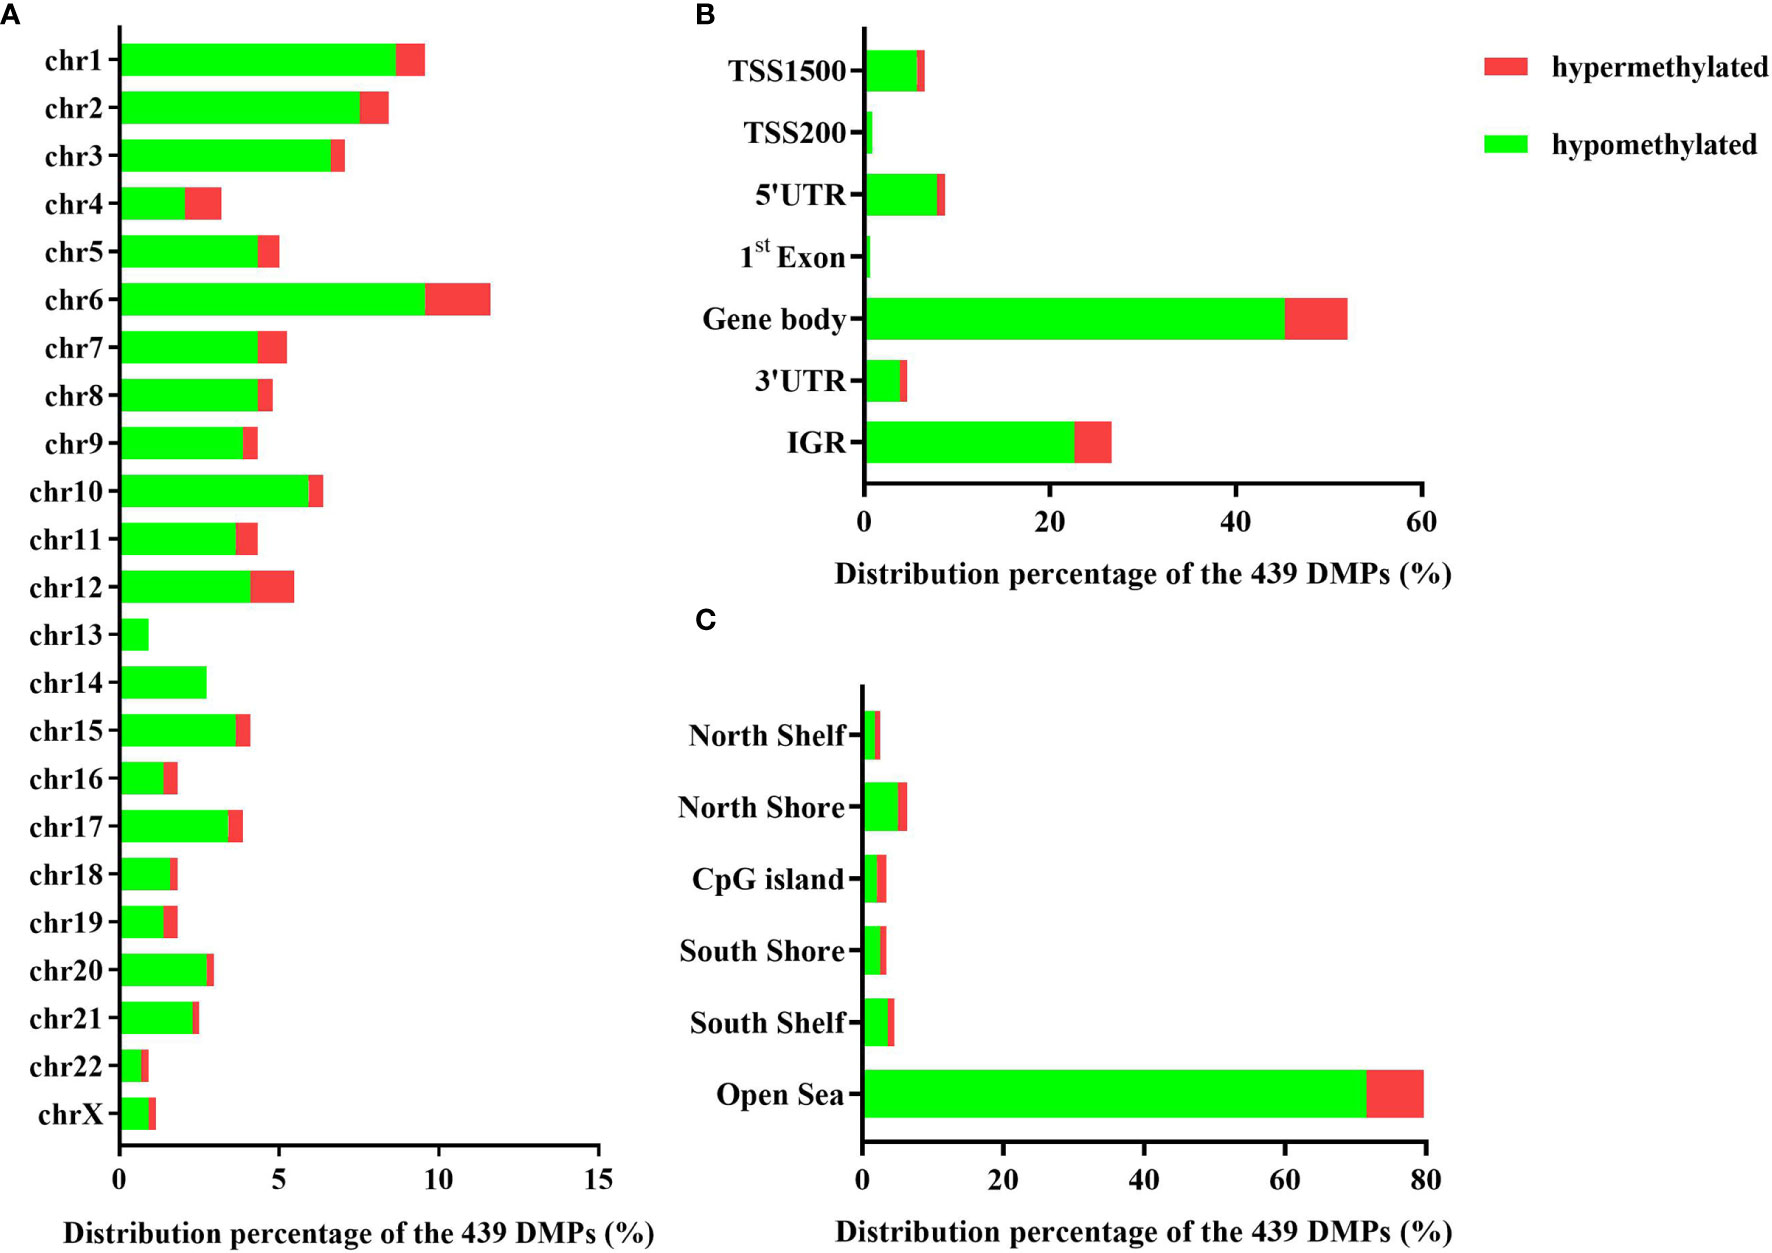
Figure 4 (A) The distribution percentages of the 439 differentially methylated positions (DMPs) on different chromosomes. (B) The distribution percentages of the 439 DMPs on different gene regions including TSS1500, TSS200, 5’UTR, 1st Exon, gene body, 3’UTR, and intergenic regions (IGR). The red bars represent hypermethylated DMPs whereas the blue bars represent hypomethylated DMPs. (C) The distribution percentages of the 439 DMPs in different CpG island regions including North Shelf, North Shore, CpG island, South Shore, South Shelf, and Open Sea.
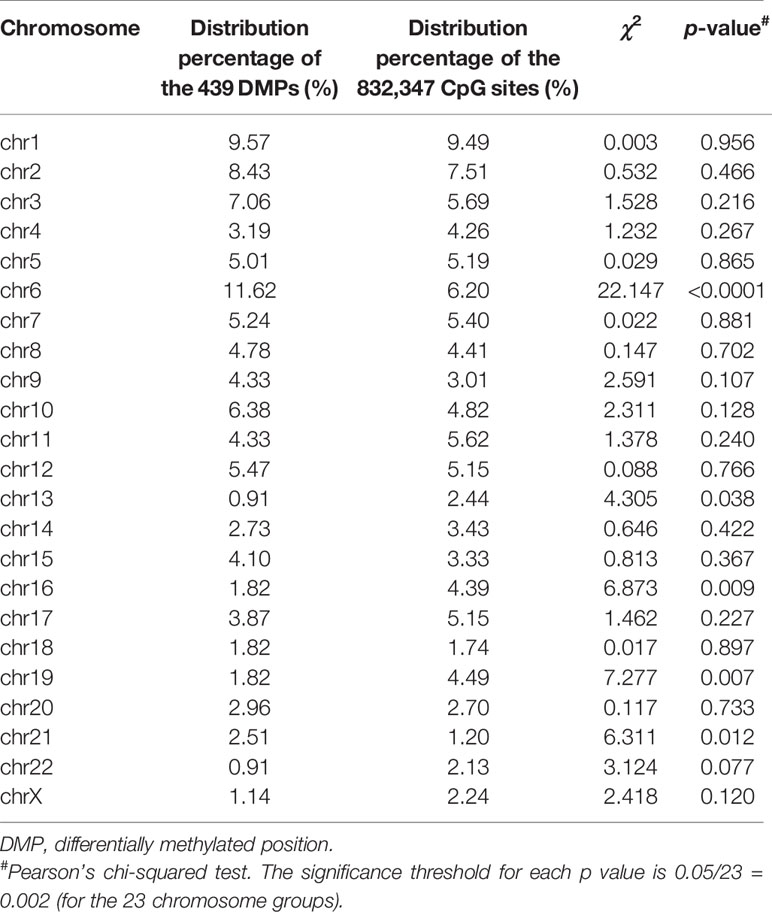
Table 2 Comparisons of the distribution percentages of the 439 DMPs and the 832,347 CpG sites on each chromosome.
According to the Illumina annotated CpGs and transcript pairs, all CpGs in the Open Sea were excluded from the 439 DMPs. Finally, 313 DMPs including 273 hypomethylated DMPs and 40 hypermethylated DMPs were annotated to genes. As some CpG sites were annotated to more than one gene, 304 DMGs were identified after the duplicate genes were removed. In the 18 DMGs that mapped from more than one CpG site, 15 DMGs were hypomethylated, 2 DMGs were hypermethylated, and only 1 DMG showed mixed methylation (Supplementary Table 9). Of the 18 DMGs, when Δβ ≥ 0.1, HLA-DPB2, HLA-DRB1, PPP2R5C, and LTF were identified.
Across the whole genome, the CpG site cg07052231 located on the PEX5 gene had the highest association with CSU (p = 5.16E−13, Δβ = −0.08). Compared with the 95 healthy controls, 41 (22 hypomethylated, 19 hypermethylated) DMPs annotated to 28 DMGs (p < 0.01 and |Δβ| ≥ 0.1) were identified in the 95 CSU patients (Table 3). The heatmap of the 41 DMPs between the 95 CSU patients and the 95 healthy controls (p < 0.01 and |Δβ| ≥ 0.1) is shown in Figure 5. The 41 DMP-level differential methylation analysis results (DMP specific violin plots) are shown in Supplementary Figure 2.
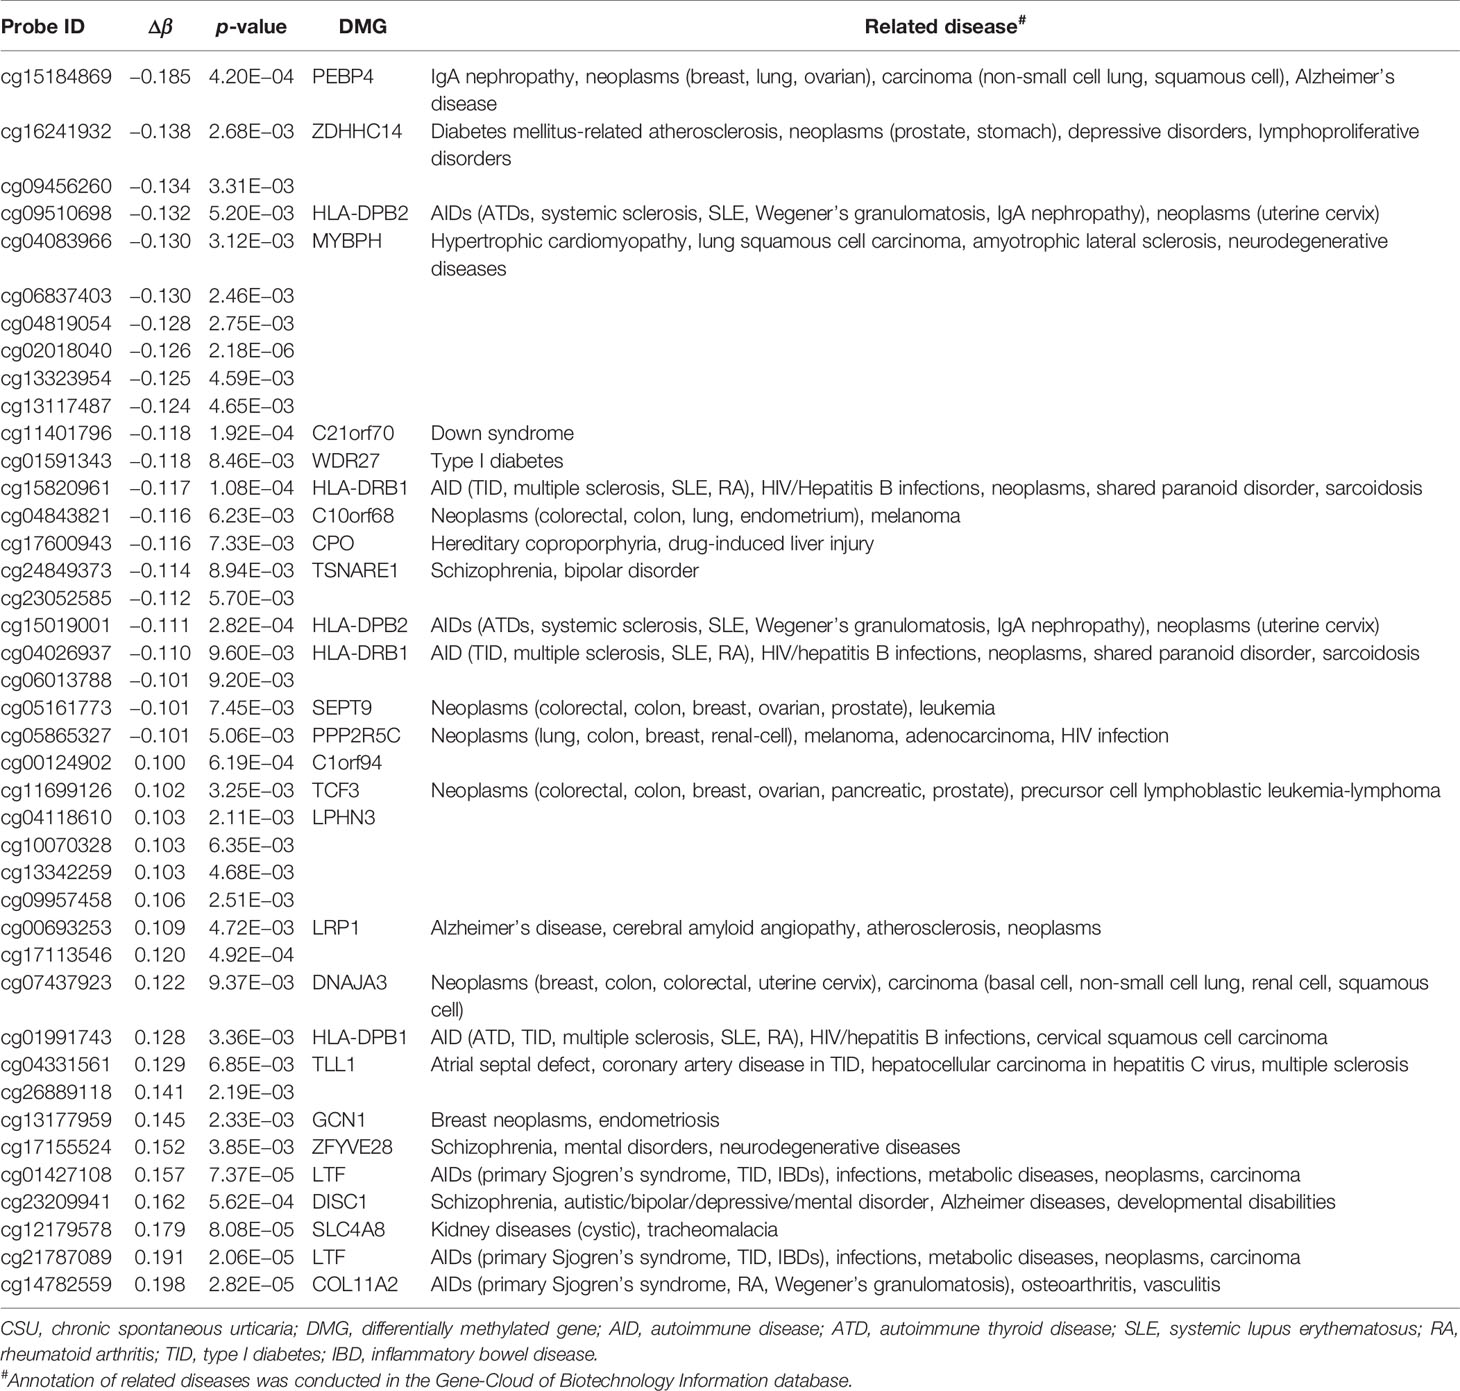
Table 3 The 41 differentially methylated positions (p < 0.01 and |Δβ| ≥ 0.1) between the CSU patients and the healthy controls.
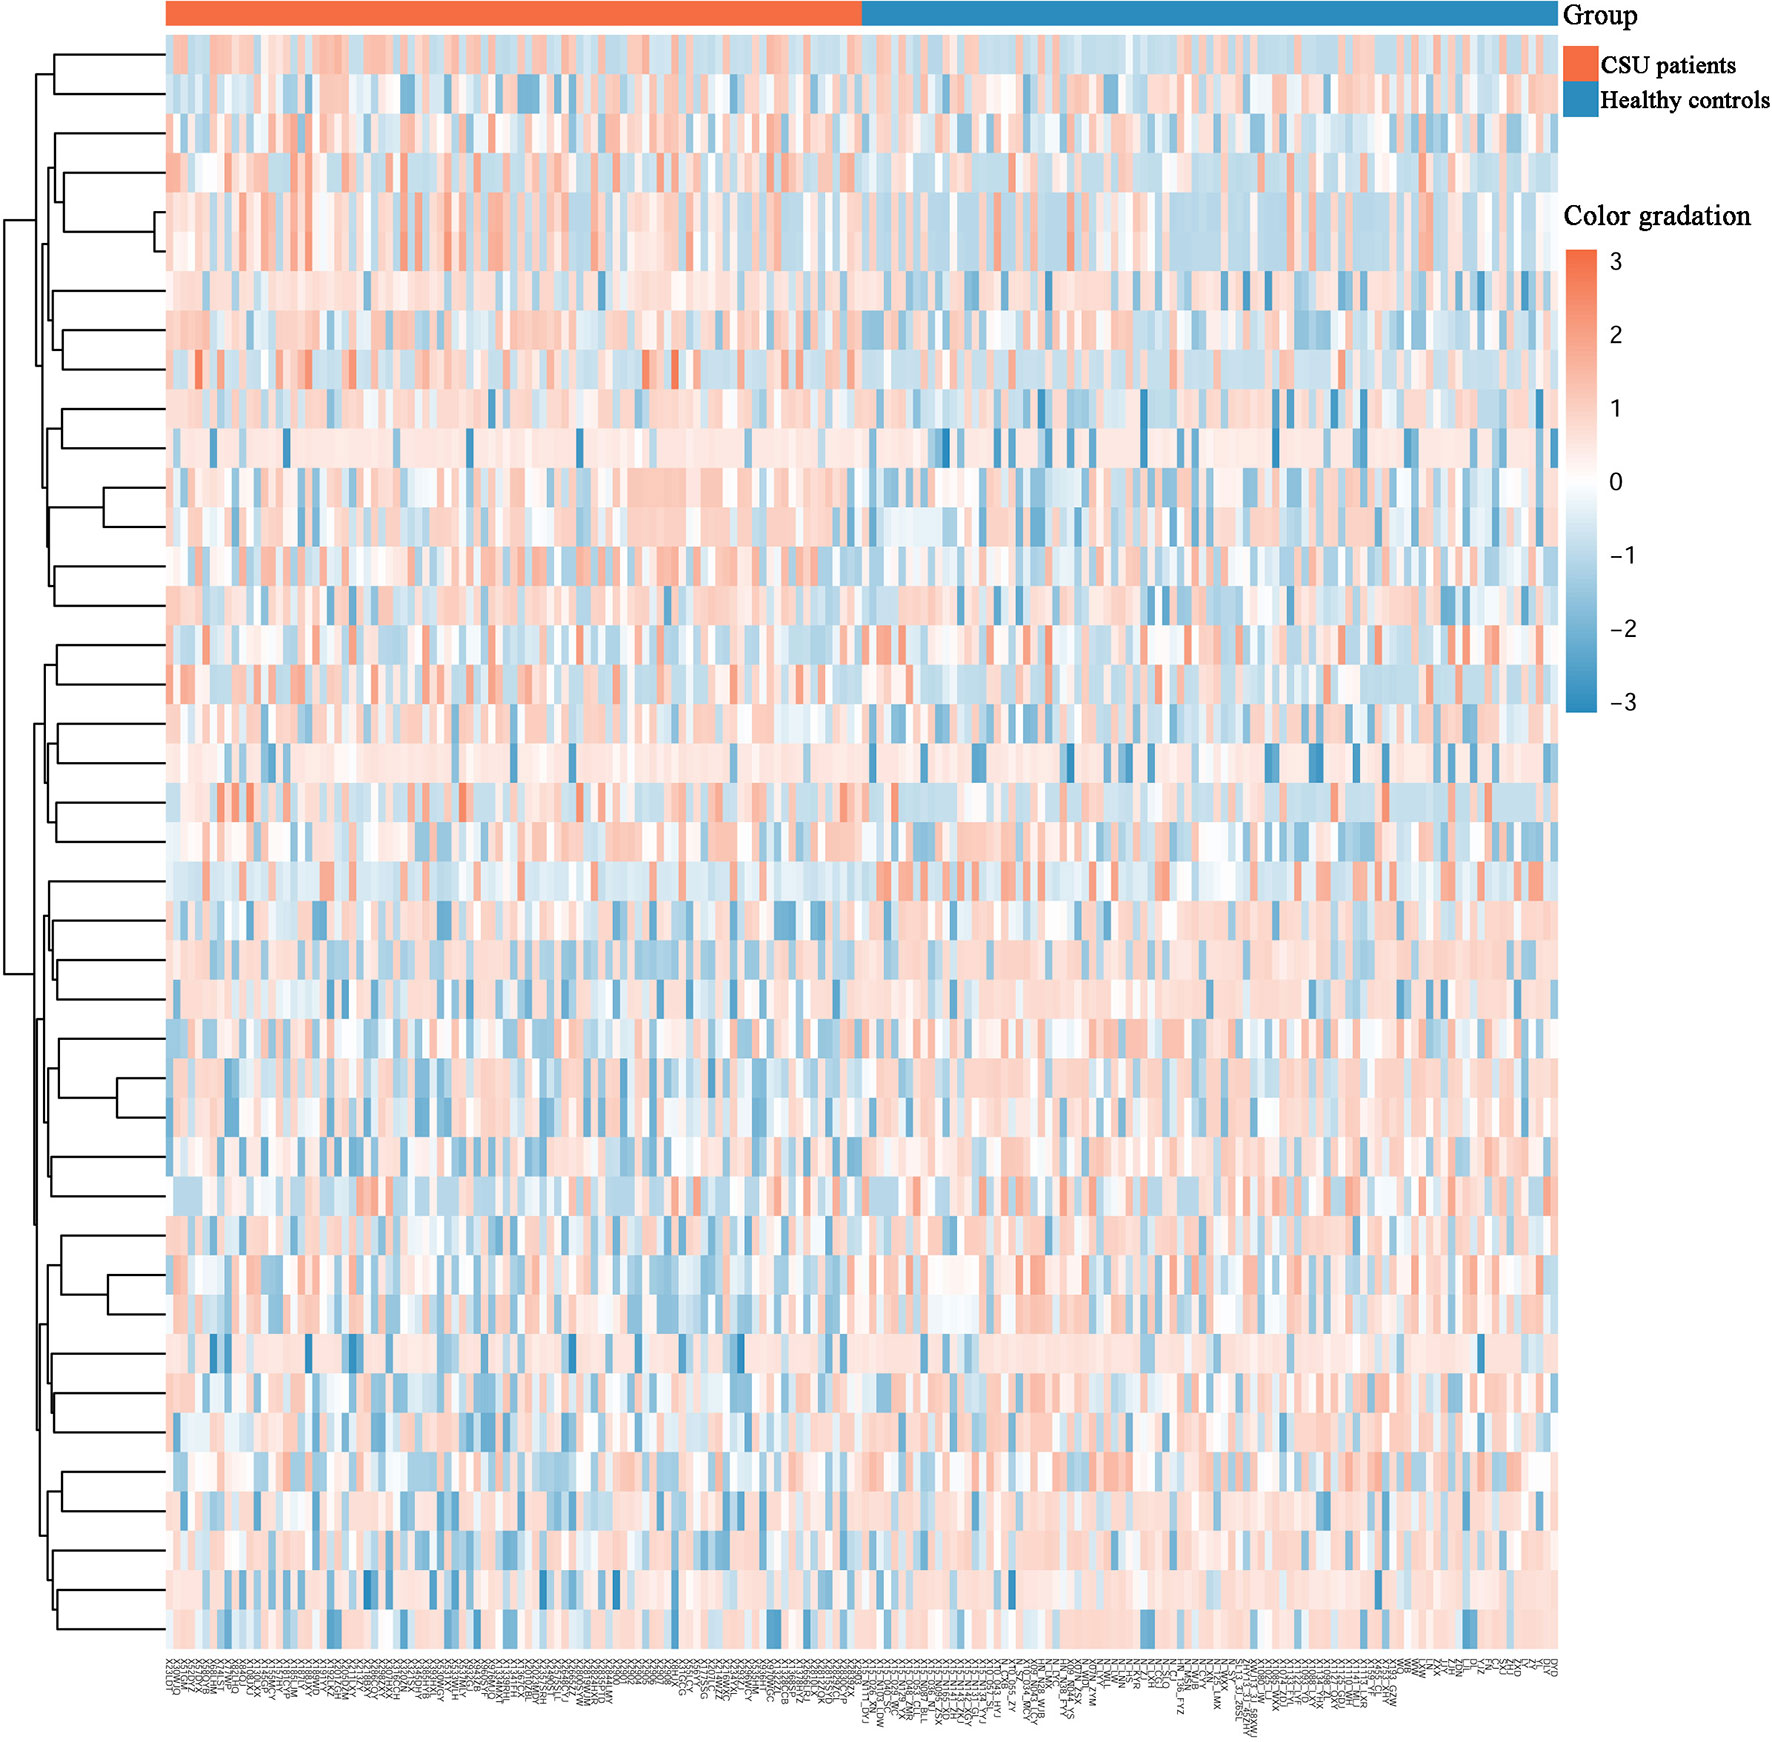
Figure 5 Heatmap of the 41 differentially methylated positions (DMPs) between the CSU patients and the healthy controls (p < 0.01 and |Δβ| ≥ 0.1). Two-dimensional hierarchical clustering of the 41 DMPs between the 95 CSU patients and the 95 healthy controls. Each row represents an individual DMP and each column represents a participant. There are 41 rows (41 DMPs) and 190 columns (95 CSU patients vs. 95 healthy controls) in this figure. On the top, the CSU patients and the healthy controls are represented by red bars and blue bars, respectively. Color gradation from red to blue means from higher methylation levels to lower methylation level. CSU, chronic spontaneous urticaria.
We divided the 95 CSU patients into eight pairs of subgroups according to eight aspects: elevated/normal tIgE, positive/negative anti-TPO IgG, positive/negative anti-TG IgG, with/without angioedema, refractory/non-refractory, UASday > 4/UASday ≤ 4, disease duration > 6 months/disease duration ≤ 6 months, and recurrent/non-recurrent. Except for the refractory/non-refractory subgroup and the disease duration > 6 months/disease duration ≤ 6 months subgroup, phenotype-specific DMPs were generated in the 439 DMPs in the other six subgroups (Table 4).
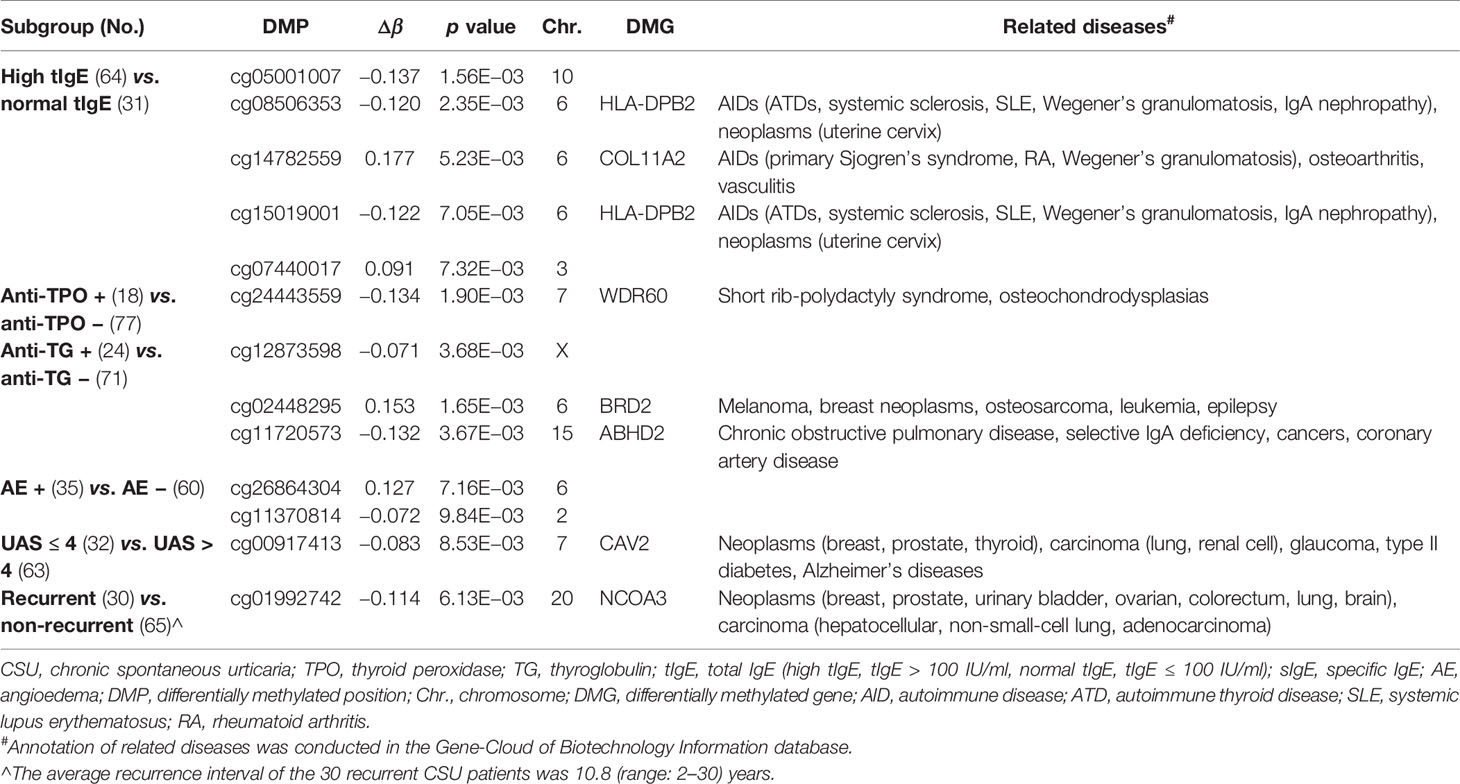
Table 4 Number of differentially methylated positions (DMPs) (p < 0.01 and |Δβ| ≥ 0.06) in the six pairs of subgroups of CSU patients.
Biological process analysis of the 304 DMGs showed that these genes were mainly enriched in regulation of cell signaling, cellular and intracellular compounds’ catabolic and metabolic processes, and cellular response to and regulation of endogenous and exogenous stimulus. Cellular component analysis of the 304 DMGs showed that these genes were significantly enriched in the intracellular part including cytoplasm and organelles. Molecular function analysis of the 304 DMGs showed that these genes were significantly enriched in catalytic activity, protein binding, pyrophosphatase, and hydrolase activity. Gene ontology enrichment analyses in above three aspects were displayed with the top 10 significant p values, respectively (Supplementary Table 10).
The top 30 prominently enriched KEGG pathways of the 304 DMGs are shown in Table 5. The DMGs were enriched in the pathways related to autoimmune diseases including IBD, ATD, and TID, as well as important immune-related pathways including antigen processing and presentation, Th17 cell differentiation, Th1 and Th2 cell differentiation, PI3K-Akt signaling pathway, TNF signaling pathway, and AMPK signaling pathway, which play important roles in autoimmune diseases. Among these pathways, the most significant one was the sphingolipid signaling pathway (p = 9.08E−05). The pathway with the most number of DMGs was the PI3K-Akt signaling pathway (13 DMGs, p = 3.29E−03).
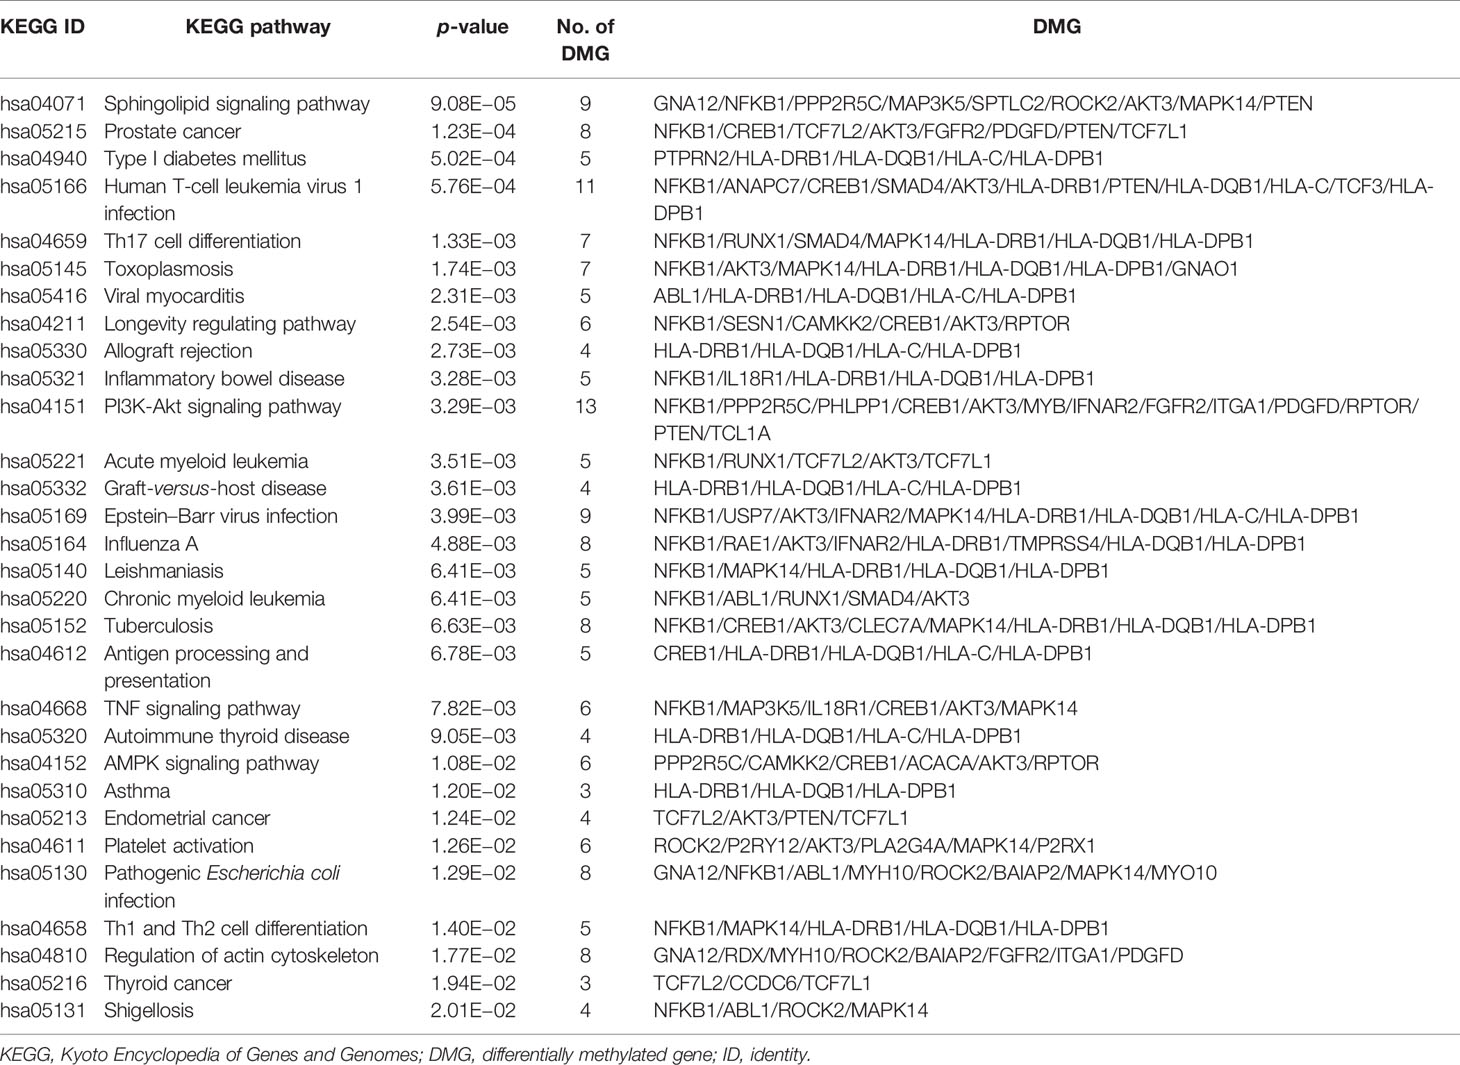
Table 5 The top 30 prominently enriched KEGG pathways for the 304 DMGs.
Genome-wide DNA methylation is one of the best-studied mechanisms in the field of epigenetics, which is closely related to the development of autoimmune diseases (4, 5). To the best of our knowledge, this study is the first comprehensive analysis to reveal a distinct genome-wide DNA methylation profile in adult patients with CSU from adult healthy subjects, suggesting the involvement of DNA methylation in the development of CSU.
With regard to the 439 DMPs, CSU patients exhibited significantly lower global methylation levels than those of the 95 healthy controls and 86.6% of the 439 DMPs were hypomethylated. There is increasing evidence that global and focal hypomethylation is an important feature of autoimmune diseases including multiple sclerosis, SLE, and RA (18, 19). The 439 DMPs in the CSU patients distributed widely on autosomal chromosomes. The numbers of these DMPs on different chromosomes varied greatly. Chromosome 6 embodied the largest number and the highest distribution intensity of DMPs whose annotated genes were considerably involved in autoimmunity (20). It has been reported that HLA-DRB1 and HLA-DQB1 are susceptible to CSU (21, 22). Overall, the analysis of the distribution of DMPs across the location distributions revealed that the DMPs were not randomly distributed.
The 41 DMPs (p < 0.01 and |Δβ| ≥ 0.1) between the CSU patients and the healthy controls are annotated to 28 DMGs and most of the DMGs are related to autoimmune diseases. Interestingly, when |Δβ| ≥ 0.1 (simultaneously p < 0.01), 4 of the 28 DMGs—HLA-DPB2, HLA-DRB1, PPP2R5C, and LTF, which all mapped from more than one CpG site—are all associated with autoimmunity. Moreover, HLA-DRB1 has been reported to be related to the DNA methylation of multiple autoimmune diseases including Crohn’s disease, multiple sclerosis, SLE, and TID (23–26). A recent study has revealed that the only one DMG with mixed methylation, fibrinogen-like protein 2 (FGFR2), is a mast cell mediator with potential relevance in CSU (27). Desai et al. have demonstrated that IL-6 promotes mast cell maturation and reactivity with downregulation of the suppressor of cytokine signaling 3 autoinhibitory pathway by promotor methylation (28). Their findings explain that CSU might be related to DNA methylation.
Although whole blood contains various mixed cell components, DNA methylation profiles in whole blood are extremely relevant to circulatory biomarkers for autoimmune disorders (29). In this study, leukocyte composition analysis showed the proportions of CD8+ T lymphocytes decreased in the CSU patients. Our results are consistent with those of a previous study (30, 31). In our study, the percentage of granulocytes was significantly higher in the blood samples of the CSU patients than that in the blood samples of the healthy controls. With regard to specific type of granulocyte, there is no doubt that basophils and eosinophils play important roles in the pathology of CSU. Basophil histamine release assay (BHRA) and basophil activation test (BAT) aid identification of autoimmune CSU (32). It has been reported that positive BHRA results and low levels of total IgE are predictors of a good response to cyclosporine for CSU (33). However, one of the main pharmacodynamic mechanisms responsible for CSU patients’ clinical response to omalizumab is to rapidly correct the basopenia in CSU patients and downregulate the expression of FcϵRI on basophils (34). On the other side, possible mechanisms of the peripheral blood eosinopenia observed in active CSU patients may include the depletion of blood eosinophils by recruitment into the skin (35). Recent clinical studies have shown that eosinopenia in patients with CSU is associated with type IIb autoimmunity, high disease activity, and poor response to treatment (36).
Compared with corresponding negative phenotype subgroups, CSU patients with elevated tIgE, positive anti-TPO IgG, positive anti-TG IgG, angioedema, UASday > 4, or recurrent CSU possessed phenotype-specific DMPs. Our findings indicate that these phenotype-specific DMPs or DMGs will become potential biomarkers of the corresponding CSU subtypes. According to the study of Altrichter et al., low tIgE may suggest type IIb autoimmune CSU, poor response to treatment with omalizumab, and a better chance to benefit from cyclosporine treatment (37). The study of Kolkhir et al. showed that 28% of CSU patients had at least one autoimmune disease and the most prevalent comorbid autoimmune disease was Hashimoto’s thyroiditis (21%) (38). In our study, CSU patients with comorbid autoimmune diseases were excluded. In our 95 CSU patients, 64 had tIgE > 100 IU/ml and 15 had tIgE < 40 IU/ml, among the 15 low-tIgE patients, only one was positive for anti-TPO IgG AAbs (32). Because autologous serum skin test (ASST), BHRA, BAT, and tests for FcεRI autoantibodies were not performed in this study, the exact numbers of patients with type IIb autoimmune CSU could not be obtained. However, it is obvious that most of the CSU patients in this study were type I autoimmune CSU, not type IIb autoimmune CSU, even though predominant enrichment of the CSU-associated DMGs in immunological pathways was shown in this study. So, our results provide supportive evidence for the immunopathogenesis of CSU mainly based on type I autoimmune CSU patients. Unfortunately, anti-IL24-IgE and anti-dsDNA-IgE were not detected in this study because the related reagents were not commercially available in China.
In this study, gene ontology functional annotation and KEGG pathway analysis showed that the 304 DMGs in the CSU patients involved mainly in the pathways related to immunological functions and autoimmune disorders. Our findings implicate similar pathogenic mechanisms between CSU and other autoimmune disorders (39). We found that sphingolipid signaling pathway was the most significantly clustered pathway associated with CSU. Sphingolipids have emerged as critical structural and signaling molecules that regulate cell growth, survival, signal transduction, immune cell trafficking, and inflammation (40). Multiple sphingolipids produced by antigen-stimulated mast cells exert their complex functions in regulating metabolism through a variety of signaling mechanisms and specific cell surface receptors and in turn fine-tune the maturity and phenotype of mast cells, thereby regulating their reactivity (40, 41). A recent study has indicated that sera of CSU patients induce production of vascular endothelial growth factor in mast cells through the PI3K/Akt/p38MAPK/HIF-1α axis in an IgE-dependent way (42). Activation of the TNF-α/TNF-α receptor signaling pathway has also been reported to be associated with CSU, marked by increased circulating concentrations of TNF-α, sTNF-R1, and sTNF-R2 (43). In this study, significantly enriched pathways of CSU included Th17 cell differentiation as well as Th1 and Th2 cell differentiation pathways. Our findings were consistent with the results of previous studies (44–46). Th2 cells, Th17 cells (44), and Th2 cytokine IL-31 are highly expressed in skin lesions of CSU (47). Th1-/Th2- and Th17-related cytokines are significantly elevated in plasma of CSU patients and correlate with disease activity of CSU (45). We compared our result of the 439 DMPs and the 304 DMGs with previous studies of DNA methylation in whole blood of other allergies or IgE-driven diseases. CpG cg24788483 that annotated to transcription factor 7-like 2 (TCF7L2) was reported to be related to complete remission of asthma (48). The TCF7L2 gene product is a transcription factor that plays a role in the Wnt signaling pathway (49). In addition, we compared our result of the 439 DMPs and the 304 DMGs with previous studies of DNA methylation in whole blood of other autoimmune diseases. Anaparti et al. demonstrated a negative association between differentially methylated CpG in the C6ORF10 gene and RA risk and confirmed differential abundance of C6ORF10 mRNA in patients with RA by qPCR analysis (50). Differentially methylated regions in HLA-DRB1 were observed in CD4+ and CD8+ T cells purified from peripheral blood of 94 women with multiple sclerosis and 94 healthy women, and differential gene expression for HLA-DRB1 gene was detected in whole blood (51).
Our study has several limitations. First, DNA methylation profile of each cellular component especially basophils and eosinophils in whole blood was not performed in our study. Second, lack of validation of DMPs and gene expression (mRNA) data is another limitation. Moreover, methylation alterations vary greatly across ethnicity, so our findings in Chinese populations may not be universally applicable. So far, DNA methylation studies in other phenotypes of urticaria such as chronic inducible urticaria or CSU patients from other ethnicities and populations have not been carried out. Further studies in different populations are needed to discern the heterogeneity among methylation markers that correlate with CSU. Finally, ASST, BHRA, BAT, anti-FcεRI/IgE autoantibodies, anti-IL24 IgE, and anti-dsDNA IgE were not detected in this study.
In conclusion, this study provides a preliminary genome-wide DNA methylation profile for Chinese Han ethnicity adult patients with CSU. Our findings provide supportive evidence of immunological pathomechanisms of CSU. Further studies on histone modification and DNA acetylation are needed for exploring the epigenetic pathomechanisms behind CSU.
The original contributions presented in the study are included in the article/Supplementary Material. Further inquiries can be directed to the corresponding author.
The studies involving human participants were reviewed and approved by the Ethics Committee of the First Hospital of China Medical University. The patients/participants provided their written informed consent to participate in this study.
TX conceived the study design and funding acquisition. YQ, LZ, and TX recruited participants and prepared samples. YQ, XY, and BT conducted lab experiments. YQ contributed to writing—original draft. TX contributed to writing—review and editing. All authors contributed to the article and approved the submitted version.
This study was supported by the Basic Research Project from the Department of Education, Liaoning Province, China (LZ2015078) and the National Key Clinical Specialist Subject Construction Project on Urticaria from National Health Commission [(2012)649].
XY and BT were employed by Sinotech Genomics Co., Ltd.
The remaining authors declare that the research was conducted in the absence of any commercial or financial relationships that could be construed as a potential conflict of interest.
All claims expressed in this article are solely those of the authors and do not necessarily represent those of their affiliated organizations, or those of the publisher, the editors and the reviewers. Any product that may be evaluated in this article, or claim that may be made by its manufacturer, is not guaranteed or endorsed by the publisher.
The Supplementary Material for this article can be found online at: https://www.frontiersin.org/articles/10.3389/fimmu.2021.681714/full#supplementary-material
1. Zuberbier T, Aberer W, Asero R, Abdul Latiff AH, Baker D, Ballmer-Weber B, et al. The EAACI/GA²LEN/EDF/WAO Guideline for the Definition, Classification, Diagnosis and Management of Urticaria. Allergy (2018) 73(7):1393–414. doi: 10.1111/all.13397
2. Bracken SJ, Abraham S, MacLeod AS. Autoimmune Theories of Chronic Spontaneous Urticaria. Front Immunol (2019) 10:627. doi: 10.3389/fimmu.2019.00627
3. Kolkhir P, Borzova E, Grattan C, Asero R, Pogorelov D, Maurer M. Autoimmune Comorbidity in Chronic Spontaneous Urticaria: A Systematic Review. Autoimmun Rev (2017) 16(12):1196–208. doi: 10.1016/j.autrev.2017.10.003
4. Calle-Fabregat C, Morante-Palacios O, Ballestar E. Understanding the Relevance of DNA Methylation Changes in Immune Differentiation and Disease. Genes (Basel) (2020) 11(1):110. doi: 10.3390/genes11010110
5. Dolcino M, Friso S, Selmi C, Lunardi C. Editorial: Role of Epigenetics in Autoimmune Diseases. Front Immunol (2020) 11:1284. doi: 10.3389/fimmu.2020.01284
6. Guo Q, Wu D, Yu H, Bao J, Peng S, Shan Z, et al. Alterations of Global DNA Methylation and DNA Methyltransferase Expression in T and B Lymphocytes From Patients With Newly Diagnosed Autoimmune Thyroid Diseases After Treatment: A Follow-Up Study. Thyroid (2018) 28(3):377–85. doi: 10.1089/thy.2017.0301
7. Annese V. Genetics and Epigenetics of IBD. Pharmacol Res (2020) 159:104892. doi: 10.1016/j.phrs.2020.104892
8. Zuberbier T, Aberer W, Asero R, Bindslev-Jensen C, Brzoza Z, Canonica GW, et al. The EAACI/GA(2) LEN/EDF/WAO Guideline for the Definition, Classification, Diagnosis, and Management of Urticaria: The 2013 Revision and Update. Allergy (2014) 69(7):868–87. doi: 10.1111/all.12313
9. Zhang L, Wu J, Qi Y, Zhu H, Yao X, Li M, et al. Long-Term Combinations and Updosing of Second-Generation H(1)-Antihistamines Show Efficacy and Safety in the Treatment of Chronic Spontaneous Urticaria: A Multicenter Real-Life Pilot Study. J Allergy Clin Immunol Pract (2020) 8(5):1733–6.e11. doi: 10.1016/j.jaip.2019.12.006
10. Zhang L, Qi R, Yang Y, Gao X, Chen H, Xiao T. Serum miR-125a-5p and CCL17 Upregulated in Chronic Spontaneous Urticaria and Correlated With Treatment Response. Acta Derm Venereol (2019) 99(6):571–8. doi: 10.2340/00015555-3149
11. Teschendorff AE, Marabita F, Lechner M, Bartlett T, Tegner J, Gomez-Cabrero D, et al. A Beta-Mixture Quantile Normalization Method for Correcting Probe Design Bias in Illumina Infinium 450 K DNA Methylation Data. Bioinformatics (2013) 29(2):189–96. doi: 10.1093/bioinformatics/bts680
12. Johnson WE, Li C, Rabinovic A. Adjusting Batch Effects in Microarray Expression Data Using Empirical Bayes Methods. Biostatistics (2007) 8(1):118–27. doi: 10.1093/biostatistics/kxj037
13. Houseman EA, Accomando WP, Koestler DC, Christensen BC, Marsit CJ, Nelson HH, et al. DNA Methylation Arrays as Surrogate Measures of Cell Mixture Distribution. BMC Bioinf (2012) 13:86. doi: 10.1186/1471-2105-13-86
14. Hochberg Y, Benjamini Y. More Powerful Procedures for Multiple Significance Testing. Stat Med (1990) 9(7):811–8. doi: 10.1002/sim.4780090710
15. Horvath S. DNA Methylation Age of Human Tissues and Cell Types. Genome Biol (2013) 14(10):R115. doi: 10.1186/gb-2013-14-10-r115
16. Zhu X, Li J, Deng S, Yu K, Liu X, Deng Q, et al. Genome-Wide Analysis of DNA Methylation and Cigarette Smoking in a Chinese Population. Environ Health Perspect (2016) 124(7):966–73. doi: 10.1289/ehp.1509834
17. Kananen L, Marttila S. Ageing-Associated Changes in DNA Methylation in X and Y Chromosomes. Epigenet Chromatin (2021) 14(1):33. doi: 10.1186/s13072-021-00407-6
18. Wilson AS, Power BE, Molloy PL. DNA Hypomethylation and Human Diseases. Biochim Biophys Acta (2007) 1775(1):138–62. doi: 10.1016/j.bbcan.2006.08.007
19. Klein K, Gay S. Epigenetics in Rheumatoid Arthritis. Curr Opin Rheumatol (2015) 27(1):76–82. doi: 10.1097/bor.0000000000000128
20. Mungall AJ, Palmer SA, Sims SK, Edwards CA, Ashurst JL, Wilming L, et al. The DNA Sequence and Analysis of Human Chromosome 6. Nature (2003) 425(6960):805–11. doi: 10.1038/nature02055
21. Doğan N, Çildağ S, Yenisey Ç, Şentürk T. The Association Between Chronic Spontaneous Urticaria and HLA Class I and Class II Antigen. Turk J Med Sci (2020) 50(5):1231–5. doi: 10.3906/sag-1907-159
22. O'Donnell BF, O'Neill CM, Francis DM, Niimi N, Barr RM, Barlow RJ, et al. Human Leucocyte Antigen Class II Associations in Chronic Idiopathic Urticaria. Br J Dermatol (1999) 140(5):853–8. doi: 10.1046/j.1365-2133.1999.02815.x
23. Li Y, Wang Z, Wu X, Wang G, Gu G, Ren H, et al. Intestinal Mucosa-Derived DNA Methylation Signatures in the Penetrating Intestinal Mucosal Lesions of Crohn's Disease. Sci Rep (2021) 11(1):9771. doi: 10.1038/s41598-021-89087-6
24. Maltby VE, Lea RA, Burnard S, Xavier A, Van Cao T, White N, et al. Epigenetic Differences at the HTR2A Locus in Progressive Multiple Sclerosis Patients. Sci Rep (2020) 10(1):22217. doi: 10.1038/s41598-020-78809-x
25. Miller S, Tsou PS, Coit P, Gensterblum-Miller E, Renauer P, Rohraff DM, et al. Hypomethylation of STAT1 and HLA-DRB1 Is Associated With Type-I Interferon-Dependent HLA-DRB1 Expression in Lupus CD8+ T Cells. Ann Rheum Dis (2019) 78(4):519–28. doi: 10.1136/annrheumdis-2018-214323
26. Kindt ASD, Fuerst RW, Knoop J, Laimighofer M, Telieps T, Hippich M, et al. Allele-Specific Methylation of Type 1 Diabetes Susceptibility Genes. J Autoimmun (2018) 89:63–74. doi: 10.1016/j.jaut.2017.11.008
27. Cildir G, Toubia J, Yip KH, Zhou M, Pant H, Hissaria P, et al. Genome-Wide Analyses of Chromatin State in Human Mast Cells Reveal Molecular Drivers and Mediators of Allergic and Inflammatory Diseases. Immunity (2019) 51(5):949–65.e6. doi: 10.1016/j.immuni.2019.09.021
28. Desai A, Jung MY, Olivera A, Gilfillan AM, Prussin C, Kirshenbaum AS, et al. IL-6 Promotes an Increase in Human Mast Cell Numbers and Reactivity Through Suppression of Suppressor of Cytokine Signaling 3. J Allergy Clin Immunol (2016) 137(6):1863–71.e6. doi: 10.1016/j.jaci.2015.09.059
29. Holbrook JD, Huang RC, Barton SJ, Saffery R, Lillycrop KA. Is Cellular Heterogeneity Merely a Confounder to be Removed From Epigenome-Wide Association Studies? Epigenomics (2017) 9(8):1143–50. doi: 10.2217/epi-2017-0032
30. Huilan Z, Runxiang L, Bihua L, Qing G. Role of the Subgroups of T, B, Natural Killer Lymphocyte and Serum Levels of Interleukin-15, Interleukin-21 and Immunoglobulin E in the Pathogenesis of Urticaria. J Dermatol (2010) 37(5):441–7. doi: 10.1111/j.1346-8138.2010.00805.x
31. Akdogan N, Demirel Ogut N, Dogan S, Atakan N. Long-Term Effects of Omalizumab on Peripheral Blood Cells and C-Reactive Protein Levels in Patients With Chronic Spontaneous Urticaria. Dermatol Ther (2019) 32(4):e12966. doi: 10.1111/dth.12966
32. Schoepke N, Asero R, Ellrich A, Ferrer M, Gimenez-Arnau A, EHG C, et al. Biomarkers and Clinical Characteristics of Autoimmune Chronic Spontaneous Urticaria: Results of the PURIST Study. Allergy (2019) 74(12):2427–36. doi: 10.1111/all.13949
33. Fok JS, Kolkhir P, Church MK, Maurer M. Predictors of Treatment Response in Chronic Spontaneous Urticaria. Allergy (2021). doi: 10.1111/all.14757
34. Poddighe D, Vangelista L. Effects of Omalizumab on Basophils: Potential Biomarkers in Asthma and Chronic Spontaneous Urticaria. Cell Immunol (2020) 358:104215. doi: 10.1016/j.cellimm.2020.104215
35. Altrichter S, Frischbutter S, Fok JS, Kolkhir P, Jiao Q, Skov PS, et al. The Role of Eosinophils in Chronic Spontaneous Urticaria. J Allergy Clin Immunol (2020) 145(6):1510–6. doi: 10.1016/j.jaci.2020.03.005
36. Kolkhir P, Church MK, Altrichter S, Skov PS, Hawro T, Frischbutter S, et al. Eosinopenia, in Chronic Spontaneous Urticaria, Is Associated With High Disease Activity, Autoimmunity, and Poor Response to Treatment. J Allergy Clin Immunol Pract (2020) 8(1):318–25.e5. doi: 10.1016/j.jaip.2019.08.025
37. Altrichter S, Fok JS, Jiao Q, Kolkhir P, Pyatilova P, Romero SM, et al. Total IgE as a Marker for Chronic Spontaneous Urticaria. Allergy Asthma Immunol Res (2021) 13(2):206–18. doi: 10.4168/aair.2021.13.2.206
38. Kolkhir P, Altrichter S, Asero R, Daschner A, Ferrer M, Giménez-Arnau A, et al. Autoimmune Diseases Are Linked to Type IIb Autoimmune Chronic Spontaneous Urticaria. Allergy Asthma Immunol Res (2021) 13(4):545–59. doi: 10.4168/aair.2021.13.4.545
39. Dionigi PC, Menezes MC, Forte WC. A Prospective Ten-Year Follow-Up of Patients With Chronic Urticaria. Allergol Immunopathol (Madr) (2016) 44(4):286–91. doi: 10.1016/j.aller.2015.10.004
40. Schauberger E, Peinhaupt M, Cazares T, Lindsley AW. Lipid Mediators of Allergic Disease: Pathways, Treatments, and Emerging Therapeutic Targets. Curr Allergy Asthma Rep (2016) 16(7):48. doi: 10.1007/s11882-016-0628-3
41. Kulinski JM, Muñoz-Cano R, Olivera A. Sphingosine-1-Phosphate and Other Lipid Mediators Generated by Mast Cells as Critical Players in Allergy and Mast Cell Function. Eur J Pharmacol (2016) 778:56–67. doi: 10.1016/j.ejphar.2015.02.058
42. Zhao JW, Ping JD, Wang YF, Liu XN, Li N, Hu ZL, et al. Vitamin D Suppress the Production of Vascular Endothelial Growth Factor in Mast Cell by Inhibiting PI3K/Akt/p38 MAPK/HIF-1α Pathway in Chronic Spontaneous Urticaria. Clin Immunol (2020) 215:108444. doi: 10.1016/j.clim.2020.108444
43. Grzanka R, Damasiewicz-Bodzek A, Kasperska-Zajac A. Tumor Necrosis Factor-Alpha and Fas/Fas Ligand Signaling Pathways in Chronic Spontaneous Urticaria. Allergy Asthma Clin Immunol (2019) 15:15. doi: 10.1186/s13223-019-0332-7
44. Moy AP, Murali M, Nazarian RM. Identification of a Th2- and Th17-Skewed Immune Phenotype in Chronic Urticaria With Th22 Reduction Dependent on Autoimmunity and Thyroid Disease Markers. J Cutan Pathol (2016) 43(4):372–8. doi: 10.1111/cup.12673
45. Chen Q, Zhong H, Chen WC, Zhai Z, Zhou Z, Song Z, et al. Different Expression Patterns of Plasma Th1-, Th2-, Th17- and Th22-Related Cytokines Correlate With Serum Autoreactivity and Allergen Sensitivity in Chronic Spontaneous Urticaria. J Eur Acad Dermatol Venereol (2018) 32(3):441–8. doi: 10.1111/jdv.14541
46. Chen T, Fu LX, Sun QM, Zhou PM, Guo ZP. Decreased Interleukin-35 Serum Levels in Patients With Chronic Spontaneous Urticaria. Ann Allergy Asthma Immunol (2018) 121(4):503–4. doi: 10.1016/j.anai.2018.06.002
47. Murdaca G, Greco M, Tonacci A, Negrini S, Borro M, Puppo F, et al. IL-33/IL-31 Axis in Immune-Mediated and Allergic Diseases. Int J Mol Sci (2019) 20(23):5856. doi: 10.3390/ijms20235856
48. Qi C, Vonk JM, van der Plaat DA, Nieuwenhuis MAE, Dijk FN, Aïssi D, et al. Epigenome-Wide Association Study Identifies DNA Methylation Markers for Asthma Remission in Whole Blood and Nasal Epithelium. Clin Transl Allergy (2020) 10(1):60. doi: 10.1186/s13601-020-00365-4
49. Grant SF, Thorleifsson G, Reynisdottir I, Benediktsson R, Manolescu A, Sainz J, et al. Variant of Transcription Factor 7-Like 2 (TCF7L2) Gene Confers Risk of Type 2 Diabetes. Nat Genet (2006) 38(3):320–3. doi: 10.1038/ng1732
50. Anaparti V, Agarwal P, Smolik I, Mookherjee N, El-Gabalawy H. Whole Blood Targeted Bisulfite Sequencing and Differential Methylation in the C6ORF10 Gene of Patients With Rheumatoid Arthritis. J Rheumatol (2020) 47(11):1614–23. doi: 10.3899/jrheum.190376
Keywords: chronic spontaneous urticaria, DNA methylation, epigenetics, autoimmune, whole blood
Citation: Qi Y, Zhang L, Yang X, Tang B and Xiao T (2021) Genome-Wide DNA Methylation Profile in Whole Blood of Patients With Chronic Spontaneous Urticaria. Front. Immunol. 12:681714. doi: 10.3389/fimmu.2021.681714
Received: 17 March 2021; Accepted: 12 August 2021;
Published: 03 September 2021.
Edited by:
Nobuo Kanazawa, Hyogo College of Medicine, JapanReviewed by:
Koremasa Hayama, Nihon University, JapanCopyright © 2021 Qi, Zhang, Yang, Tang and Xiao. This is an open-access article distributed under the terms of the Creative Commons Attribution License (CC BY). The use, distribution or reproduction in other forums is permitted, provided the original author(s) and the copyright owner(s) are credited and that the original publication in this journal is cited, in accordance with accepted academic practice. No use, distribution or reproduction is permitted which does not comply with these terms.
*Correspondence: Ting Xiao, Y211eHRAMTI2LmNvbQ==
Disclaimer: All claims expressed in this article are solely those of the authors and do not necessarily represent those of their affiliated organizations, or those of the publisher, the editors and the reviewers. Any product that may be evaluated in this article or claim that may be made by its manufacturer is not guaranteed or endorsed by the publisher.
Research integrity at Frontiers
Learn more about the work of our research integrity team to safeguard the quality of each article we publish.