
95% of researchers rate our articles as excellent or good
Learn more about the work of our research integrity team to safeguard the quality of each article we publish.
Find out more
ORIGINAL RESEARCH article
Front. Immunol. , 18 May 2021
Sec. Molecular Innate Immunity
Volume 12 - 2021 | https://doi.org/10.3389/fimmu.2021.678201
 Dong Ni1
 TingTing Tang2
 Yifan Lu1†
 Keman Xu1†
 Ying Shao1†
 Fatma Saaoud1†
 Jason Saredy2†
 Lu Liu2Charles Drummer IV1
 Yu Sun1Wenhui Hu2
 Jahaira Lopez-Pastrana3
 Jin J. Luo4Xiaohua Jiang1,2Eric T. Choi5
 Hong Wang2
 Xiaofeng Yang1,2,6*
We performed a transcriptomic analyses using the strategies we pioneered and made the following findings: 1) Normal lymphoid Tregs, diseased kidney Tregs, splenic Tregs from mice with injured muscle have 3, 17 and 3 specific (S-) pathways, respectively; 2) Tumor splenic Tregs share 12 pathways with tumor Tregs; tumor splenic Tregs and tumor Tregs have 11 and 8 S-pathways, respectively; 3) Normal and non-tumor disease Tregs upregulate some of novel 2641 canonical secretomic genes (SGs) with 24 pathways, and tumor Tregs upregulate canonical secretomes with 17 pathways; 4) Normal and non-tumor disease tissue Tregs upregulate some of novel 6560 exosome SGs with 56 exosome SG pathways (ESP), tumor Treg ESP are more focused than other Tregs; 5) Normal, non-tumor diseased Treg and tumor Tregs upregulate some of novel 961 innate immune caspase-1 SGs and 1223 innate immune caspase-4 SGs to fulfill their tissue/SG-specific and shared functions; 6) Most tissue Treg transcriptomes are controlled by Foxp3; and Tumor Tregs had increased Foxp3 non-collaboration genes with ROS and 17 other pathways; 7) Immune checkpoint receptor PD-1 does, but CTLA-4 does not, play significant roles in promoting Treg upregulated genes in normal and non-tumor disease tissue Tregs; and tumor splenic and tumor Tregs have certain CTLA-4-, and PD-1-, non-collaboration transcriptomic changes with innate immune dominant pathways; 8) Tumor Tregs downregulate more immunometabolic and innate immune memory (trained immunity) genes than Tregs from other groups; and 11) ROS significantly regulate Treg transcriptomes; and ROS-suppressed genes are downregulated more in tumor Tregs than Tregs from other groups. Our results have provided novel insights on the roles of Tregs in normal, injuries, regeneration, tumor conditions and some of canonical and innate immune non-canonical secretomes via ROS-regulatory mechanisms and new therapeutic targets for immunosuppression, tissue repair, cardiovascular diseases, chronic kidney disease, autoimmune diseases, transplantation, and cancers.
Immune responses including innate immune macrophages (1), antigen-specific responses (2–13), CD4+Foxp3+ regulatory T cells (Treg) (14–18) and cosignaling- and immune checkpoint receptors (19) play significant roles in suppressing tumor growth and development. Although cancer immunotherapy is very promising (10, 20), new anti-cancer drugs and vaccines fail to show promising benefits against cancer, which is at least partially due to the infiltration of Treg into the tumor region and suppression of anti-cancer activities of the drugs and vaccines (21). Thus, careful characterizations of Treg in tumor regions and Treg from tumor-bearing models would improve our understanding on transcription changes of Treg in tumor-specific environments (22).
In addition, cardiovascular disease (CVD) risk factors such as hyperhomocysteinemia (23, 24), chronic kidney disease (25–29), hyperlipidemia (30, 31), and hyperglycemia (32, 33) promote vascular inflammation and atherosclerosis via several mechanisms. These novel mechanisms include decreased/transdifferentiated Treg (15, 16, 34–36), endothelial cell (EC) function as innate immune cells activation (30, 37–42); caspase-1/inflammasome activation (25, 27, 41, 43), proton leak-regulated mitochondrial reactive oxygen species (ROS) (31, 44, 45); Ly6Chigh mouse monocyte and CD40+ human monocyte differentiation (24, 33, 46, 47); impaired vascular repairability of bone marrow-derived progenitor cells (43, 48); downregulated histone modification enzymes (49) and increased histone 3 lysine 14 acetylation (44), increased expressions of trained immunity pathway enzymes (50, 51) and non-coding RNA regulation (40, 52–54). Due to the significant progress on identification of Treg roles implicated in ischemic injury and repair including myocardial, limb, cerebral ischemia, and apoB autoreactive Treg (55), Treg hold significant therapeutic promise for cardiovascular diseases (56), cardiovascular repair and regeneration (57).
Peripheral differentiations of CD4+ T helper cells (Th) result from T cell response to stimulation, via innate immune mechanisms (36), by several different inducing cytokines such as interferon-γ (IFN-γ), interleukin-12 (IL-12), and IL-4, and also anatomical locations (58). Naïve CD4+ T cells can be differentiated/polarized into at least nine terminally-differentiated Th cell subsets. These subsets include Th1, Th2, Th9, follicular T (Tfh) (58), Tfh-13 (59), Th17, Treg, Th22 (36, 60), Th25 (61), CD4+ cytotoxic T cells (CD4+ CTL) (62), tissue-resident memory T cells (Trm), circulating effector memory T cells (Tem), central memory T cells (Tcm) (63), CD28null T cells (64) as well as other T cell subsets including CD8+ T cells and γδ T cells (64), suggesting that antigen epitopes-independent innate immune inducing cytokine environments play critical roles for naïve Th0 polarization/differentiation into Treg and other Th subsets (16). We previously reported that Treg cell death pathways (17, 34–36, 65–70), Treg generated IL-35 (30, 37, 44, 45, 71–73), and epigenetic pathways (49, 74) may be novel therapeutic targets for maintaining Treg survival (17), preventing immunosuppressive Tregs from becoming pathological Tregs (36), plastic Tregs and even antigen-presenting Tregs (16), and suppressing inflammation (75). Recently, we proposed a novel concept, which suggests that pathological conditions/environments, via antigen epitopes-dependent or independent cellular interactions, re-shape physiological Tregs into pathological Tregs that have weakened immuno-suppressive functions and increased plasticity (36). The following supporting evidence published by other investigators validate our proposed model: First, Th1-like Treg phenotype (76, 77), and pro-inflammatory IL-17A cytokine secreting Treg (78), which weaken Treg suppression; Second, immunosuppression-compromised Treg after myocardial infarction (79); Third, four different types of “lymphoma Treg” (15), among which some Treg become malignant; Fourth, self-reactive T cells, termed anti-Treg (80), which suppress immune-suppressive cells and secrete pro-inflammatory cytokines; Fifth, FOXO3-expressed in tolerogenic dendritic cells (DCs) in modulating Treg and activating anti-Treg (81), and sixth, six aspects such as thymic development, peripheral development, homeostasis, function, differentiation, and plasticity of Treg are modulated by 15 cytokines including interleukin-2 (IL-2), IL-15, IL-7, transforming growth factor-β (TGF-β), tumor necrosis factor-α (TNF-α), IL-33, IL-4, IL-1β, IL-6, IL-21, IL-23, IL-12, IL-27, IL-35 (71) and interferon γ (IFNγ) (82, 83), among which proinflammatory cytokines weaken Treg suppression. It is accepted that Tregs undergo phenotypic and functional plastic changes into other Th subsets under pathological conditions (60, 84), which are modulated by co-inhibitory/immune checkpoint receptors (85).
Foxp3 is the major transcription factor (TF), and co-expression of lineage-specifying transcription factors alters the potential function and flexibility of subsets of CD4+ T cell; this, in turn, favors the autoimmune pathology (86). Tregs are specialized in the suppression of immuno-pathological reactions in the host immune system against antigens and dangers (36). In addition to inhibition of adaptive immune response, Tregs also play a critical role in controlling various innate immune responses involved in cancers (15), inflammatory diseases including cardiovascular diseases and atherosclerosis (64, 75). However, an important question remained whether Treg have innate immune response machinery. To address this question, we recently reported that Treg secretomes (in lymph nodes and spleen) and transcription factors shared with stem cells contribute to a Treg niche to maintain Treg-ness with 80% innate immune pathways, and functions of immunosuppression and tissue repair (87). Additionally, Tregs play a highly broad spectrum of versatile anti-pathophysiological roles. For example, Tregs facilitate blood flow recovery after ischemia (88), control adipose tissue inflammation, promote muscle repair (89) and maintain tissue/organ homeostasis (90). Treg’s roles in maintaining self-tolerance and prevention of autoimmune responses and chronic inflammation are mediated by various mechanisms including: a) Treg killing of target cells (15); b) modulation of target cells via cell-cell contact; c) inhibition of target cells by exosome-carried microRNAs (36); and d) secretion of anti-inflammatory/immunosuppressive cytokines (38) including IL-10, IL-35 (30, 71, 72), and TGF-β. Therefore, cellular therapies using Tregs are currently undergoing clinical trials for the treatment of autoimmune diseases, transplant rejection and graft-versus-host disease (91).
In addition to the secretion of anti-inflammatory/immunosuppressive cytokines (38), including IL-10, IL-35 (30, 71, 72), and TGF-β, Treg play a highly tissue- and context-specific roles in angiogenesis either pro- or anti-angiogenic effects (92). Similarly, we recently reported that Treg-secreted IL-35 delays hindlimb ischemia-induced angiogenesis through regulating ROS-extracellular matrix but spares later regenerative angiogenesis (73), indicating that Treg-secreted IL-35 plays roles in a pathological process/phase-specific manner (30, 37, 44, 45, 71–73). Recent progress suggests that Treg secretory proteins could be also much bigger than a list of cytokines and chemokines, since the secretomes from various cell types have been reported (93, 94). The secretome, defined as a portion of total proteins secreted by cells to the extracellular space, secures a proper micro-environmental niche, thus maintaining tissue homeostasis (95, 96). Secreted molecules are key mediators in cell-cell interactions, via autocrine, and paracrine manners, and influence the cross-talk with the surrounding tissues in addition to their endocrine functions in long-distance by hormones, growth factors, cytokines, adipokines, myokines, cardiokines (97), and chemokines (98). There is strong evidence supporting that crucial cellular functions such as proliferation, differentiation, communication and migration are regulated strictly by the cell secretome (99). Among the secretomes, we recently reported canonical secretomes of human peripheral blood mononuclear cells (28). Similarly, Treg from mouse spleen, lymph nodes, intestine and visceral adipose tissue may use canonical secretomes (all the human proteins with signal peptide sequence) to fulfill their functions (87). In addition, exosome secretomes, due to their content enriched in proteins, mRNAs and noncoding RNAs, carry out cell-cell communication and promote tissue regeneration, wound healing, extracellular matrix remodeling, immunomodulation (100), angiogenesis, anti-apoptotic activity and cell migration, proliferation and differentiation (101). Moreover, we reported that Treg may use their secretomes shared with stem cells to maintain their Treg-ness with 80% innate immune pathways (87), thus, Treg may also use innate immunity-related secretomes such as caspase-1-gasdermin D (GSDMD) dependent secretome (102), and caspase-4 (humans)/caspase-11 (mice)-GSDMD dependent secretome (103), to carry out their functions. However, it remains unknown that Treg may use canonical secretomes, non-canonical secretomes including exosome secretomes (100), innate immune caspase-1-GSDMD secretomes and innate immune caspase-4/11-GSDMD secretomes for their immune regulatory functions (100).
However, several important knowledge gaps remain: 1) are there differences in Treg transcriptomes between Tregs from normal lymphoid and non-lymphoid tissues, injured tissues, regenerative tissues, tissues from mouse carrying tumor, tumor tissues; 2) are secretomes generated in Tregs in various tissues and pathological conditions; and 3) how Treg transcription factor Foxp3, immune checkpoint receptors cytotoxic T lymphocyte associate protein-4 (CTLA-4, CD152) and programmed cell death-1 (PD-1, CD279) (19), immunometabolic pathways and innate immune memory (trained immunity) and ROS pathways regulate tissue Treg heterogeneity and Treg various secretomes. The major differences between our current study and previous reports on the roles of cytokines and chemokines in Treg are that secretome analyses provide a panoramic view on all the secreted genes in Treg, as opposed to focusing on only one or a few cytokines/chemokines (28).
An overview on the connection logic of the manuscript sections and structure in organizing this manuscript was provided as follows. In the first major part (the Results sections 1, 2, 3, and 4), we compared normal lymphoid tissue Treg, non-tumor diseased kidney Treg and splenic Treg in mouse with injured muscle in the Section 1. In the Section 2, we extended our analysis to examine splenic Treg in mouse with tumors and Treg from tumor tissues. In the Section 3, we summarized all the findings in Treg pathways in normal tissues, non-tumor diseased organs and mouse with injured muscles for comparison. In the Section 4, we identified the differences between tumor Treg and Treg from normal tissues, diseased organs and spleen from the mouse with tumor. Taken together, the sections 1-4 as the first part focused on the transcriptomic heterogeneity of Treg in healthy environments, non-tumor disease conditions and tumors. Treg suppressive functions to inhibit other immune cells depends on several effector mechanisms including secretion of anti-inflammatory/immunosuppressive cytokines such as IL-10, IL-35 and transforming growth factor-β (TGF-β). The second major part in the sections 5, 6 and 7 focused on examining how tissue Treg heterogeneity from normal tissues, non-tumor disease conditions and tumors affect Treg secretory functions; and how Treg secretomes could also potentially affect tissue Treg heterogeneity. We attempted for the first time to introduce all the recent cellular protein secretomic findings to Treg field by examining canonical secretomes with secretory proteins carrying signal peptide, non-canonical secretomes with secretory proteins with no signal peptide such as IL-1β including caspase-1 dependent secretome, caspase-4 dependent secretome and exosome-based secretome. The third major part of this manuscript focused on examining potential molecular mechanisms underlying the Treg heterogeneity and secretomic function differences identified in the first and second major parts from four different angles. These four angles (mechanisms) include Treg-specific transcription factor Foxp3 (nuclear) dependence in the Section 8, major Treg-related immune checkpoint receptors (T cell co-inhibition receptors) on the cell membrane such as PD-1-, CTLA-4- signaling dependence in the Section 9, intracellular immune metabolism/trained immunity (innate immune memory) regulation in the Section 10, and intracellular reactive oxygen species (ROS, a newly reported metabolic sensor system) regulation in the Section 11. Although significant amounts of work in the future are required to verify the -omic data analyses-based findings presented in this paper, similar to other papers with the data generated with -omics such as RNA-sequencing (RNA-Seq) and single cell-RNA-Seq (scRNA-Seq), our results to address the three major questions provide novel insights on tissue Treg heterogeneity in normal, diseased/injured, regenerative, and tumors, Treg secretomes and immunometabolic/trained immunity and ROS regulation of tissue Tregs.
Microarray datasets were collected from National Institutes of Health (NIH)-National Center for Biotechnology Information (NCBI)-Gene Expression Omnibus (GEO) databases (https://www.ncbi.nlm.nih.gov/gds/) and analyzed with an online software GEO2R (https://www.ncbi.nlm.nih.gov/geo/geo2r/). The logic flow of this study was presented in Figure 1.
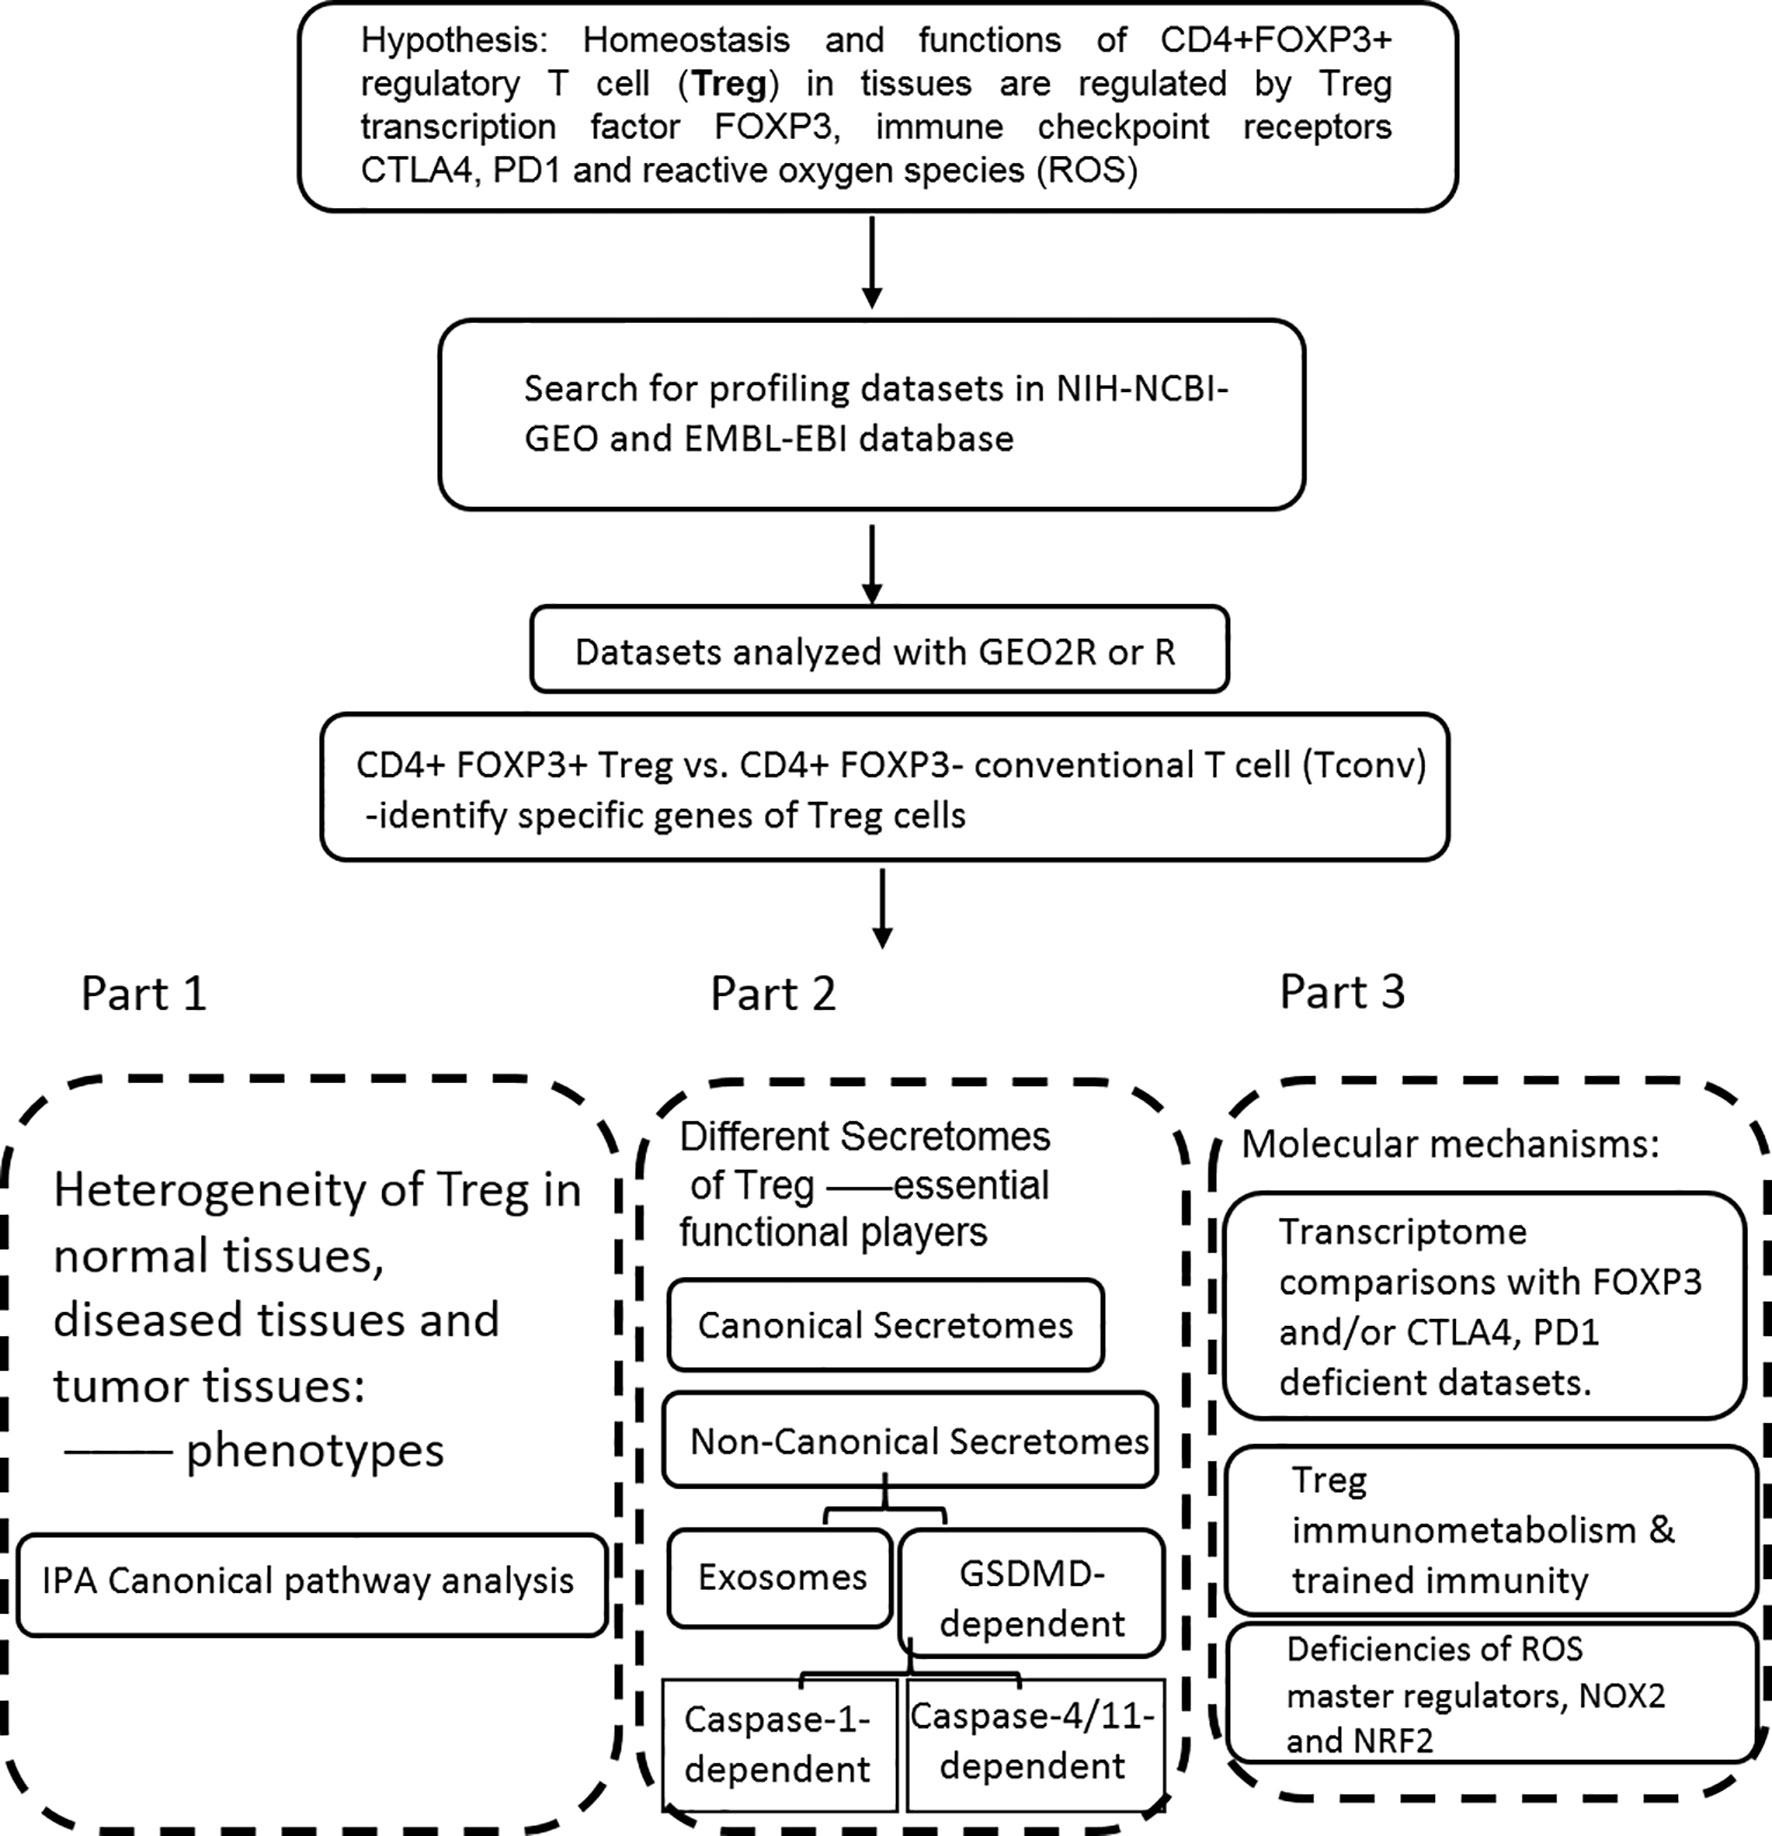
Figure 1 The flow chart of CD4+Foxp3+ regulatory T cell (Treg) transcriptomic and secretomic analyses from normal tissues, diseased tissues and tumor tissues. Two most comprehensive gene expression databases were used in this study: NIH-NIBI-GEO: National Institutes of Health (NIH)-National Center for Biotechnology Information (NCBI)- Gene Expression Omnibus (GEO) databases https://www.ncbi.nlm.nih.gov/gds/; EMBL-EBI: European Molecular Biology Laboratory (EMBL)-European Bioinformatics Institute(EBI) https://www.ebi.ac.uk/arrayexpress/. The gene expression analyses were performed by using the bioinformatic tool/database GEO2R: https://www.ncbi.nlm.nih.gov/geo/geo2r/R: version 3.6.1.
We applied a statistical method similar to our previously reported meta-analysis (28, 50, 104). We designed a robust house-keeping gene list (Supplemental Table 1 of housekeeping genes) with help from Eisenberg and Levanon’s (105) excellent work, including ACTB, GAPDH, PGK1, PPIA, B2M, YWHAZ, SDHA, HMBS, and TBP. Briefly, the mean log fold change (LogFC) of house-keeping genes between treatment and control groups vary from -1.27 to 1.28. The target genes with expression changes more than 2-folds were defined as the upregulated genes, while genes with their expression decreased more than 2-folds were defined as downregulated genes |logFC|>1).
We utilized Ingenuity Pathway Analysis (IPA, Qiagen, https://www.qiagenbioinformatics.com/products/ingenuity-pathway-analysis/) to characterize clinical relevance and molecular and cellular functions related to the identified genes in our microarray analysis. Differentially expressed genes were identified and uploaded into IPA for analysis. The core and pathways analysis was used to identify molecular and cellular pathways, as we have previously reported (28, 104, 106). For the groups with small numbers of genes modulated, the Metascape analysis (https://metascape.org/gp/index.html#/main/step1) was used for determining signaling pathways involved.
We recently reported that Treg-specific transcription factor Foxp3 is expressed in trachea, thymus, spleen, mammary gland, lymph node, lung, eye, and blood (16). Six aspects involved in development, homeostasis, function, differentiation, and plasticity of Treg are modulated by 15 cytokines including IL-2, IL-15, IL-7, TGF-β, TNF-α, IL-33, IL-4, IL-1b, IL-6, IL-21, IL-23, IL-12, IL-27, IL-35 (71) and IFNγ (82). Since these cytokine expression levels are varied among tissues, thus, various Treg populations in these tissues have been identified (90), which are similar to what we reported on tissue macrophages that 20 novel disease group-specific and 12 new shared macrophage pathways have been found in eight groups of 34 diseases including 24 inflammatory organ diseases and 10 types of tumors (1). We hypothesized that tissue Treg have different signaling pathways and Treg from non-malignant diseases have also different signaling pathways. To test this hypothesis, we collected 20 Treg microarrays and RNA-Seq datasets from two comprehensive databases such as NIH-NCBI-Geo Datasets database (https://www.ncbi.nlm.nih.gov/geo/) and EMBL-EBI Arrayexpress (https://www.ebi.ac.uk/arrayexpress/). As shown in Table 1, 20 datasets included one from spleen, one from lymph nodes (LN), one from brown adipose tissue (BAT), one from kidney, two from spleens in mouse with injured skeletal muscles for four days and two weeks, respectively, two from mouse injured skeletal muscles for four days and two weeks, respectively, one from kidney fibrosis, one from kidney regeneration, four from spleens of tumor bearing mouse (BL6, MC38, CT26 and TC-1), respectively, seven tumor tissue Treg from hepatocellular carcinoma, melanoma, lung tumor (TC-1), breast cancer, tumor bearing Bl6, tumor bearing MC38, and tumor bearing CT26, respectively. Of note, As the original paper reported (107), tumor infiltrating Treg and tumor splenic Treg were sorted as live, CD45+TCRb+CD4+Foxp3+CD8-DUMP-). Tumor Treg were distinguished from tumor splenic Treg using RNA-Seq analysis (107). In addition, one of our recent manuscripts mainly focused on profile on Treg transcription markers, CD markers, kinome, of tissue Treg from mouse spleen, lymph nodes, small intestines and white adipose tissues, which are not overlapped in this study (87). As shown in Figure 2A two third of the datasets were collected from RNA-Seq, suggesting that new techniques were used. Total differentially expressed genes (DEGs) were varied among Treg datasets, ranging from 113 (brown adipose tissue Treg) to 2608 (regeneration kidney Treg). The upregulated genes in total DEGs among Treg datasets were ranging from 31.8% (melanoma skin Treg) to 85.0% (brown adipose tissue Treg). As shown in Figure 2B, there were more downregulated genes in Treg from tumor tissue groups than normal tissue Treg, diseased tissue Treg groups and tumor splenic Treg groups.
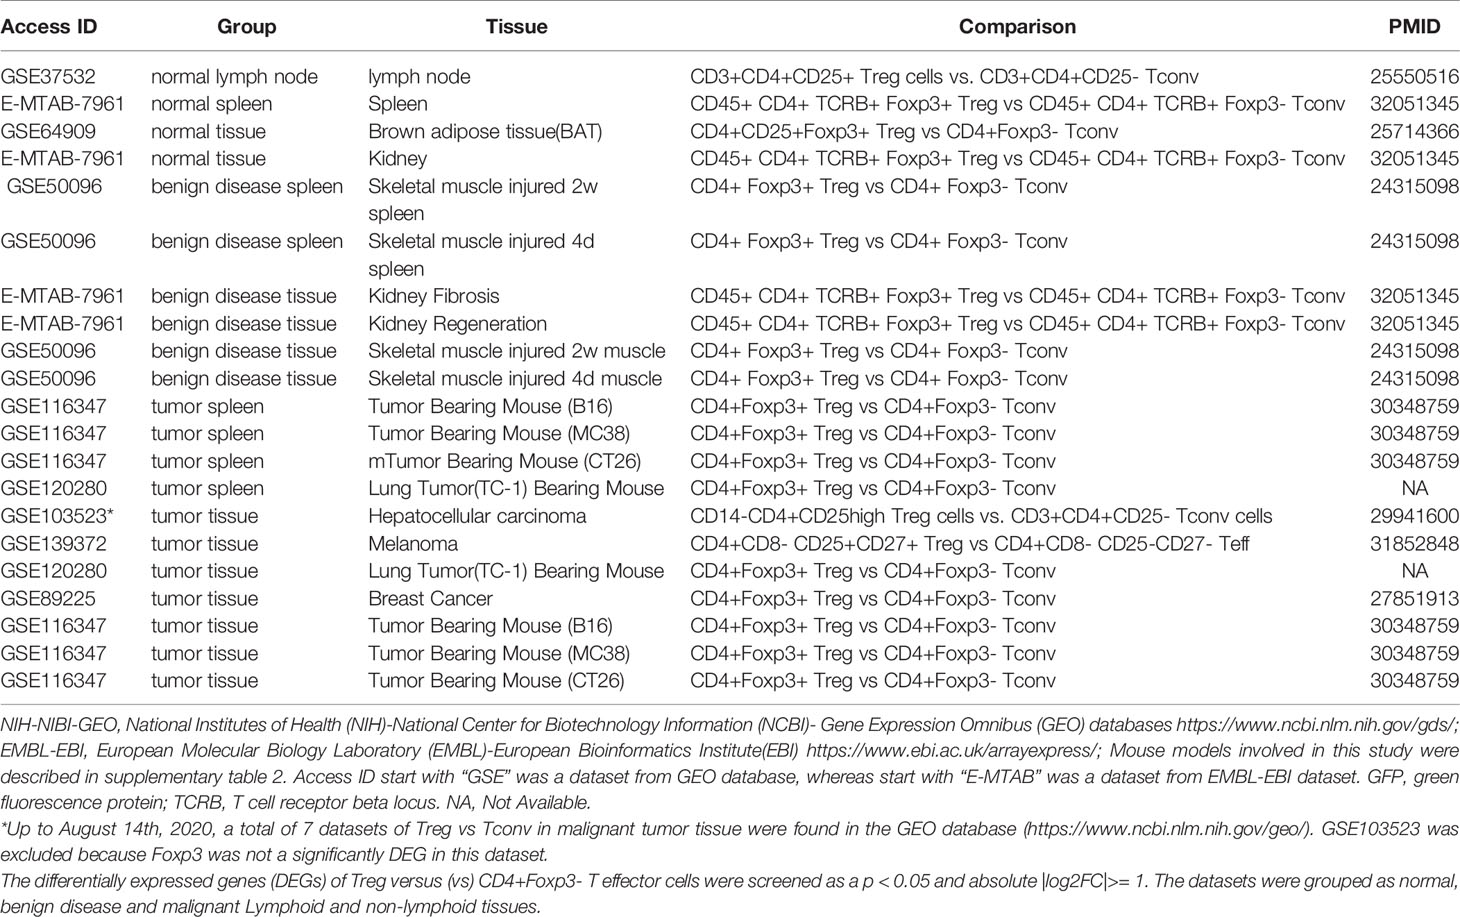
Table 1 Twenty-three Treg transcriptomic datasets collected from the NIH-NCBI-GEO and EMBL-EBI databases were analyzed.
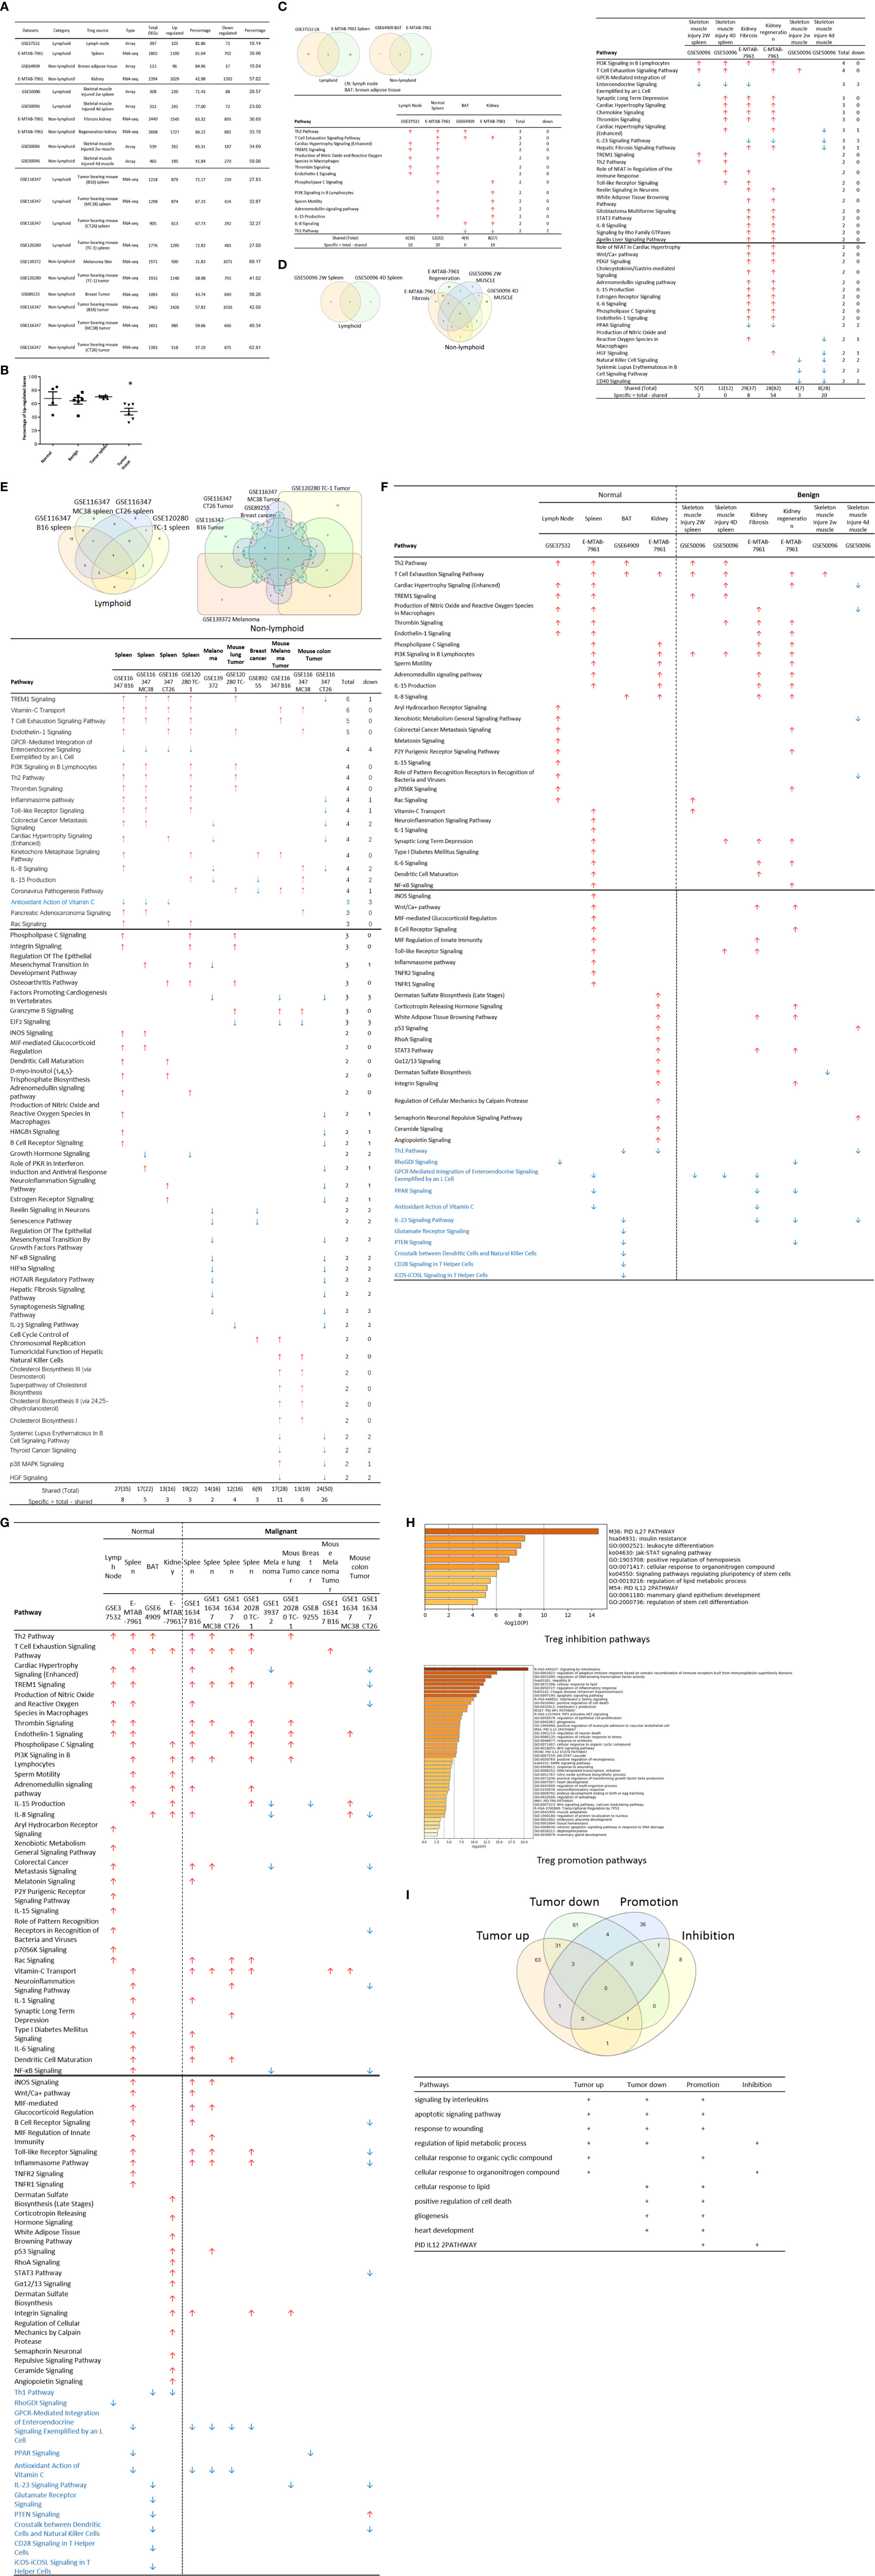
Figure 2 (A) Comparisons of regulatory T cells (Treg) versus conventional T cells (Tconv) in tissues enrolled in Table 1 led to identification of differentially expressed genes (DEGs) in each dataset. The type of results from datasets enrolled including Array data and RNA-seq data. (Cut off: p < 0.05; |Log2FC| ≥ 1). (B) There were more suppressed DEGs of Treg in Tumor tissues than other 3 groups. The mean percentages of up-regulated genes in tumor tissue Treg groups were 48.22 ± 5.004, lower than that in normal, benign, and tumor spleen groups (67.71 ± 9.806, 64.20 ± 4.891, 70.04 ± 1.458, respectively). *Significantly changed. (C) The majority (73.8%, 59/80) of enriched pathways in normal tissue Treg groups were tissue Treg-specific in lymphoid and non-lymphoid tissues. The ingenuity Pathway Analysis (IPA, Qiagen, https://www.qiagenbioinformatics.com/products/ingenuity-pathway-analysis/) using the differentially expressed gene (DEG) from datasets enrolled in this study showed the activated (↑) and inhibited (↓) canonical pathways in normal tissue Treg groups (p < 0.05, |Z-score| >= 2). In addition, Venn diagram analysis was performed to find the commonly shared pathways in this group. The specifically enriched pathways in GSE37532 Lymph node (LN), E-MTAB-7961 spleen, and E-MTAB-7961 Kidney were shown in Supplementary Table 3A. In the normal Treg groups, there were a total of 80 pathways enriched including 64 activated and 16 inhibited. There were no dual regulated pathways in normal Treg groups. The most common shared pathway was Th2 Pathway, which was activated in 71.2% (5/7) datasets. TREM1 Signaling, Production of Nitric Oxide and Reactive Oxygen Species in Macrophages, Cardiac Hypertrophy Signaling (Enhanced), and Thrombin Signaling where activated only in Treg from lymphoid tissues. Whereas Th1 Pathway and tRNA Splicing were inhibited, and IL-8 Signaling was activated only in Treg in non-lymphoid tissues. (D) Non-lymphoid tissue Treg enriched more specific pathways than lymphoid tissue Treg in benign disease groups. (85 specific pathways in 4 non-lymphoid Treg datasets vs. 2 specific pathways in 2 lymphoid Treg datasets). IPA analysis using the DEG from datasets enrolled in this study showed the activated (↑) and inhibited (↓) canonical pathways in different benign disease tissue Treg groups (p < 0.05, |Z-score| >= 2). Venn diagram analysis was performed to find the commonly shared pathways in this groups. The specifically enriched pathways in various Treg groups were showed in Supplementary Table 3B. A total of 124 pathways were enriched in benign disease Treg groups, including 90 activated and 30 inhibited pathways. Cardiac Hypertrophy Signaling (Enhanced), Hepatic Fibrosis Signaling Pathway, Reactive Oxygen Species in Macrophages, and HGF Signaling were dual regulated pathways in non-lymphoid tissue Treg. The percentages of specifically enriched pathways in this group was 70.2% (87/124). 97.7% (85/87) specific pathways were in non-lymphoid tissue Treg datasets. The most commonly shared pathway in benign disease Treg groups were T Cell Exhaustion Signaling Pathway and PI3K Signaling in B Lymphocytes, activating in 67% (4/6) datasets. TREM1 Signaling and Th2 Pathway were only activated in spleen tissue Treg in this group. Whereas IL-23 Signaling Pathway, PPAR Signaling, Natural Killer Cell Signaling, Systemic Lupus Erythematosus In B Cell Signaling Pathway, and CD40 Signaling were inhibited in non-lymphoid tissue Treg. (E) Malignant Treg groups enriched more inhibited and dual pathways than normal and benign disease Treg groups. IPA analysis using the DEG from Treg datasets enrolled in this study showed the activated (↑) and inhibited (↓) canonical pathways in different malignant disease tissue Treg groups (p < 0.05, |Z-score| >= 2). Venn diagram analysis was performed to find the commonly shared pathways in this Treg group. The specifically enriched pathways in each dataset were showed in Supplementary Table 3C. There were a total of 128 pathways enriched in the malignant Treg groups, including 62 activated, 50 inhibited, and 16 dual regulated pathways. There were 19 specifically enriched pathways in 4 lymphoid Treg datasets (mean 4.8 per dataset), 52 specifically enriched pathways in 6 non-lymphoid Treg datasets (mean 8.7 per dataset). TREM1 Signaling and Vitamin-C Transport were the most commonly shared pathways. In addition, TREM1 Signaling was activated in all the lymphoid tissue Treg and dual regulated in the non-lymphoid tissue Treg. Vitamin-C Transport was activated both in lymphoid and non-lymphoid tissue Treg. (F) The Dataset GSE50096 Treg from skeletal muscle injured 4d enriched more down regulated pathways than normal and other benign disease tissue Treg. The pathways enriched in normal lymphoid and non-lymphoid tissue Treg were compared with benign tissue Treg. The 5 pathways all of which were activated in normal tissue Treg were suppressed in Treg from skeletal muscle injured 4d and 2w tissues. All the suppressed pathways in normal tissue Treg groups were also suppressed or non-statistically enriched in benign disease tissue Treg. (G) Malignant tissue Treg enriched more down regulated pathways than normal tissue Treg. The Pathways enriched in normal lymphoid and non-lymphoid tissue Tregs were compared with malignant tissue Treg. The 13 pathways all of which were activated in normal tissue Tregs were suppressed in at least one malignant Treg datasets, more specifically, in malignant non-lymphoid tissue Treg. However, only one of the 11 suppressed pathways in normal tissue Treg, PTEN Signaling, was activated in GSE116347 CT26 dataset. (H) Metascape analysis of 18 Treg inhibition genes and 57 Treg promotion genes (PMID:32680511) identified 11 Treg inhibition GO and pathways and 45 Treg promotion GO and pathways. Moreover, M54: PID IL12 2PATHWAY was a dual regulated pathway, which was enriched both in Treg promotion and inhibition pathways. (I) There were 4 suppressed and 1 activated Treg promotion pathways in malignant Treg datasets whereas there was only 1 activated Treg inhibition pathway in malignant Treg datasets. DEGs in malignant Treg datasets enrolled in this study were analyzed by metascape and compared with Treg promotion and inhibition pathways. Tumor Treg upregulated pathways included up-regulated DEGs in malignant Treg datasets whereas tumor downregulated pathways included down-regulated DEGs in malignant Treg datasets. The 4 downregulated Treg promotion pathways were cellular response to lipid, positive regulation of cell death gliogenesis, gliogenesis, and heart development. One up-regulated Treg inhibition pathway was cellular response to organonitrogen compound. The 61 Tumor downregulated, 31 dual, and 63 tumor upregulated pathways were summarized in Supplementary Table 4.
The Ingenuity Pathway Analyses were performed based on the DEGs in Treg in comparison to that of CD4+Foxp3- T effector cells (Teff). As shown in Figure 2C, Treg from lymphoid tissues, LN and spleen, shared six pathways including Th2 pathway, cardiac hypertrophy signaling, TREM1 signaling, nitric oxide and reactive oxygen species, thrombin signaling and endothelin signaling. Treg from BAT (108) and kidney shared upregulation of two pathways, including T cell exhaustion signaling and IL-8 signaling, and downregulation of Th1 pathway. Of note, it has been reported that visceral adipose tissue (VAT) Treg are Foxp3+ peroxisome proliferator-activated receptor-γ (PPARγ)+ Treg with increased lipid metabolism (109), which are enhanced by IL33-ST2 axis (110); and among 194 significantly upregulated genes in BAT Treg, 148 genes are identified as VAT Treg-specific, whereas only 10 genes are BAT Treg-specific (108). Interestingly, Treg from spleen shared five pathways with kidney, such as phospholipase C signaling, phosphoinositide 3-kinase (PI3K) signaling, sperm motility, adrenomedullin signaling, and IL-15 production. As shown in Figure 2D, Treg from the spleens of mouse with skeletal muscle injury 2 weeks, the spleen of mouse with skeletal muscle injury 4 days, kidney fibrosis, kidney regeneration shared PI3K signaling. Treg from the spleens of mouse with skeletal muscle injury 2 weeks, the spleen of mouse with skeletal muscle injury 4 days, kidney regeneration, and mouse skeletal muscle injury 2 weeks shared T cell exhaustion signaling. Treg from the spleen of mouse with skeletal muscle injury 4 days, kidney regeneration shared four pathways such as synaptic long term depression, cardiac hypertrophy, chemokine signaling and thrombin signaling. Two pathways such as TREM1 signaling and Th2 pathway showed in Treg from the spleens of mouse with skeletal muscle injury 2 weeks, and the spleen of mouse with skeletal muscle injury 4 days. Of note, it has been reported that skeletal muscle Treg promote skeletal muscle regeneration by producing amphiregulin (Areg), to member of the epidermal growth factor family whose receptor is expressed on satellite cells in the skeletal muscles (110). Other two pathways such as role of NFAT and Toll-like receptor signaling showed in Treg from the spleens of mouse with skeletal muscle injury 4 days and kidney fibrosis. Of note, Treg play significant roles in maintaining normal kidney and suppressing acute ischemic kidney injury, preconditioning prevention of ischemia reperfusion injury, inhibition of cisplatin-induced renal injury and adrianmycin nephropathy, suppression of autoimmune glomerulopathies, lupus glomerulonephritis, nephrotoxic nephritis and diabetic kidney disease (111). In addition, 17 pathways were shared by Treg from kidney fibrosis and kidney regeneration. These kidney Treg-specific pathways include: reelin signaling, white adipose tissue browning, glioblastoma multiform, STAT3, IL-8, Rho GTPases, apelin liver, role of NFAT in cardiac hypertrophy, Wnt/Ca2+, PDGF, cholecystokinin/gastrin, adrenomedullin, IL-15 production, estrogen receptor, IL-6, phospholipase C and endothelin-1. Moreover, three pathways including natural killer cells, systemic lupus and CD40 signaling were downregulated in Treg from skeletal muscle injury 2 weeks and skeletal muscle injury 4 days, which were muscle injury Treg-specific. Of note, although tissue Treg heterogeneity has been identified, Treg-specific signatures remain including Treg markers such as CD4+Foxp3+. These common Treg signatures allow us to study the effects of transcriptomic differences of tissue Treg, Treg from diseased conditions, tumor environments and tumor-carrying mouse on secretomic pathways as well as Treg niche-secretomes interactions. Similar approaches were reported by other investigators (110, 112). Taken together, Treg from normal lymphoid tissues such as lymph nodes (LN) and spleen have five specific pathways, Treg from brown adipose tissue have no specific pathways, Treg from kidney fibrosis and kidney regeneration have 17 specific pathways, and Treg from spleen of mouse with injured skeletal muscle have three muscle injury-specific pathways.
We then hypothesized that Treg from spleens of mouse bearing tumors and Treg isolated from tumor tissues have specific signaling pathways. To test this hypothesis, the Ingenuity Pathway Analyses (IPA) were performed based on the DEGs in Treg in comparison to that of CD4+Foxp3- T effector cells (Teff). As shown in Figure 2E, 12 pathways were shared by Treg from spleens of mouse bearing tumors and Treg from tumor tissues including TREM1, Vitamin C transport, T cell exhaustion, endothelin-1, PI3K signaling, Th2 pathway, thrombin, kinetochore metaphase, pancreatic adenocarcinoma, phospholipase C, integrin, and osteoarthritis. Of note, the sources of Tregs were specified in Figure 2E and were also detailed in Table 1. Eleven pathways were tumor-bearing spleen Treg-specific including inflammasome, Toll-like receptor, colorectal cancer metastasis, cardiac hypertrophy, Rac, epithelial-mesenchymal transition, iNOS, MIF-mediated glucocorticoid regulation, dendritic cell maturation, inositol (1,4,5)-triphosphate biosynthesis, and adrenomedullin. Treg from tumor tissues had eight specific pathways including coronavirus pathogenesis, granzyme B, cell cycle control, Natural killer cell, cholesterol biosynthesis III, superpathway of cholesterol biosynthesis, cholesterol biosynthesis II and cholesterol biosynthesis I.
Taken together, our results have demonstrated that first, Treg from spleens of mouse bearing tumors share 12 pathways with Treg from tumor tissues; second, Treg from spleens of mouse bearing tumors have 11 specific pathways, suggesting that tumorigenesis affect distal splenic Treg significantly; and third, Treg from tumor tissues have eight specific pathways. Our new findings are correlated with previous reports that Treg compartmentalization and trafficking may be tissue or/and organ specific, in which distinct chemokine receptor and integrin expression may contribute to selective retention and trafficking of Treg cells to sites where regulation is required (113). These Treg trafficking receptors include chemokine receptors and other G-protein coupled receptors, integrins, as well as selectins and their ligands. These receptors enable Treg to: 1) enter appropriate tissues from the bloodstream via post-capillary venules, 2) navigate these tissues to locally execute their immune-regulatory functions, and 3) seek out the right antigen-presenting cells to interact with in order to receive the signals that sustain their survival, proliferation, and functional activity (114).
We hypothesized that Treg from normal tissues and non-malignant disease tissues have shared upregulated pathways and downregulated pathways. As shown in Figure 2F, 52 upregulated pathways were shared by Treg from normal tissues and non-malignant disease tissues and 11 pathways were downregulated in Treg from normal tissues and non-malignant disease tissues including Th1 pathway, RhoGDI signaling, GPCR-mediated integration of enteroendocrine signaling, PPAR signaling, antioxidant action of vitamin C, IL-23 signaling, glutamate receptor, PTEN, cross-talk between dendritic cells and natural killer cells, CD28 signaling, and iCOS-iCOSL signaling. Of note, the sources of Tregs were specified in Figure 2F and were also detailed in Table 1. Previous report showed that systemic ablation of Treg compromises the adaptation of whole body energy expenditure to cold exposure, correlating with impairment in thermogenic gene expression and massive invasion of proinflammatory macrophages in BAT (108). The four pathways were downregulated only in Treg from BAT including glutamate receptor, cross-talk between dendritic cells and natural killer cells, CD28 signaling, and iCOS-iCOSL signaling. Our results may suggest that first, thermogenic environment in BAT may play significant roles in downregulating those four pathways; and second, these pathway downregulation in BAT Treg may play important roles.
We then hypothesized that Treg from injured tissues have pathway changes from that of normal tissues. To examine this hypothesis, we compared four datasets from Treg in normal tissues such as LN, spleen, BAT and kidney to that of six Treg datasets including spleen Treg of mouse with injured muscles for 2 weeks and Treg from mouse with injured muscles for four days, kidney fibrosis, kidney regeneration, Treg from injured muscle for two weeks and Treg from injured muscle for four days. As shown in Figure 2F, five pathways were upregulated in normal tissues but downregulated in injured muscles including cardiac hypertrophy signaling (enhanced), production of nitric oxide and reactive oxygen species, xenobiotic metabolism signaling, role of pattern recognition receptors, and dermatan sulfate biosynthesis.
Taken together, our results have demonstrated that fifty two pathways are upregulated in Treg from normal lymphoid, non-lymphoid tissues and non-malignant diseases; eleven pathways are downregulated in Treg from normal lymphoid, non-lymphoid tissues and non-malignant diseases; four pathways are downregulated only in Treg from BAT; and five pathways upregulated in Treg from normal tissues are downregulated in injured muscles.
It has been reported that Treg depletion alters the tumor microenvironment and accelerates pancreatic carcinogenesis (115), suggesting that Treg play critical roles in controlling tumor growth. We hypothesized that Treg transcriptomes from normal tissues are different from that of Treg from tumor tissues; and some pathways in Treg from normal tissues are different from that in malignant tissues (116). As shown in Figure 2B, upregulated gene numbers in Treg from tumor tissues in comparison to that Teff cells in the same tissues were significantly lower than that of Treg from normal tissues, non-malignant diseases and spleens of mouse with tumors. These results have demonstrated that Treg transcriptomes undergo significant remodeling in tumor tissues.
As shown in Figure 2G, 13 pathways upregulated in normal tissue Treg were downregulated in Treg from malignant tissues including cardiac hypertrophy signaling (Enhanced), TREM-1 signaling, production of nitric oxide and reactive oxygen species in macrophages, IL-15 signaling, IL-8 signaling, colorectal cancer metastasis signaling, role of pattern recognition receptors in recognition of bacteria and viruses, neuroinflammation signaling pathway, NF-kB signaling, B cell receptor signaling, Toll-like receptor signaling, inflammasome pathway, and STAT3 pathway. Of note, the sources of Tregs were specified in Figure 2G and were also detailed in Table 1. It has been reported that 18 regulators are downregulated in Treg in tumors including GATA3, STAT3, STAT4, RORγ, IL-6, IL-17, IL-1β, DNMT3a, Stub1, Id2, E47, Spi-B, SOCS3, AKT, mTORC1, Raptor, and Glut1 (116). In addition, one pathway, PTEN signaling, was downregulated in normal tissue Treg and upregulated in Treg from mouse colon tumor. Of note, 13 out of 14 pathways are innate immune pathways, suggesting that innate immune pathways play significant roles in maintaining Treg suppressive functions. As recent review reported several pathways in Treg from cancers including Foxp3, IRF4, PI3/AKT/FoxO axis, Helios, Eos, Nr4a, Bach2, E proteins and their inhibitor of DNA-binding (Id) counterparts, STAT3, and NF-kB (22). In addition, it has been reported that 57 regulators are promoted in Treg in tumors, including CCL2, CCR2, IL-2, IL-27, IL-33, IL-10, TGF-β, NFAT, SMAD3/4, AP1, PP2A, TLR8, Id3, Nr4a, CD36, ST2, YAP, Mst1/2, KAP1, TRAF3IP3, CnB, NLK, Tram, Neuropilin-1, Calcineurin, TAK1, VHL, C-Rel, NF-kBp65, RelA, P100, PI3Kp110z, IKKb, CREB, CBP/p300, STAT5, TRAF6, TNFR2, AMBRA1, HIC1, HIF1-HRF8, Demethylated TSDR, EZH2, SENP3, ATF-CNS2, C-RelCNS3, Blimp1, MALT1, LKB1, mTORC2, Rictor, Foxp1, Foxo3, Foxp3, Helios, Hypoxia, and Fatty acid (116). Using IPA analysis, our results have identified 11 new signaling pathways including cardiac hypertrophy signaling (Enhanced), TREM-1 signaling, production of nitric oxide and reactive oxygen species in macrophages, IL-15 signaling, IL-8 signaling, colorectal cancer metastasis signaling, role of pattern recognition receptors in recognition of bacteria and viruses, neuroinflammation signaling pathway, B cell receptor signaling, Toll-like receptor signaling, and inflammasome pathway. Of note, due to missing expression data of reported Treg genes, we could not use IPA for the pathway analysis. As shown in Figure 2H, by using the Metascape pathway analysis, we found 45 pathways associated with 57 reported Treg upregulated genes and 11 pathways associated with 18 reported Treg downregulated genes (116). For the comparison, we also re-analyzed the pathways of tumor Tregs in our study with the Metascape pathway analysis. As shown in Figure 2I, 100 upregulated pathways were found for tumor Treg, 100 downregulated pathways were found for tumor Treg and 35 dual pathways were found to be shared by upregulated pathways of tumor Treg and downregulated pathways of tumor Treg. Additional Venn Diagram analysis showed that by comparison of our Metascape pathway data on tumor Treg to that of reported tumor Treg, our results have demonstrated 63 new upregulated tumor Treg pathways, 61 new downregulated tumor Treg pathways and 31 new dual pathways shared by upregulated tumor Treg pathways and downregulated tumor Treg pathways.
Taken together, our results have demonstrated that Treg from tumors are different from Treg from normal tissues, non-malignant disease tissues and spleens of mouse with tumors in thirteen innate immune IPA pathways and one adaptive immune IPA pathway. In addition, we have also identified 63 new tumor Treg upregulated Metascape pathways, 61 new tumor Treg downregulated Metascape pathways, and 31 new dual Metascape pathways. Moreover, we found that four Metascape pathways including signaling by interleukins, apoptotic signaling pathway, response to wounding, and regulation of lipid metabolic process are shared by three groups of tumor Treg pathways and seven Metascape pathways are shared by two groups of tumor Treg pathways. These results suggest that tumor microenvironments modulate Treg transcriptomes in specific manners; shared pathways may be tumor Treg essential pathways; and tumors modulate Treg and suppress anti-tumor immune responses and immunosurveillance mechanisms as we and other reported (15).
It has been reported that IL-2 is important for Treg survival (17), IL-2 and TGF-β are critical for Treg induction (16), IL-33/ST2 axis is important for VAT Treg (109) and IL-35 is essential for iTreg 35 induction (36, 71, 117, 118). In addition, IL-37 is highly expressed in Treg of patients with melanoma and enhanced by melanoma secretome. However, it remains poorly understood that Treg secretomic changes in normal tissue Treg, disease tissue Treg and tumor Treg. It has been reported that the Nod-like receptor family 3 (NLRP3) promotes gastro-intestinal CD11b+ dendritic cell differentiation and Treg response in inflammasome-independent manner (119). In contrast, NLRP3 has also been reported to inhibits the expression of Foxp3 independent of inflammasome activation in Tregs. NLRP3- deficient mice elevate Treg generation in various tissues in the de novo pathway. NLRP3 deficiency increases the amount and suppressive activity of Treg populations, whereas NLRP3 overexpression decreases Foxp3 expression and Treg levels (120).The inflammatory cell death (pyroptosis) (121) carried out by caspase-1 (122) canonical, caspase-4 (humans)/caspase-11 (mice) non-canonical inflammasomes-Gasdermin D (123) pathway has been reported to mediate T cell death (124–127). Due to their content enriched in proteins, mRNAs and noncoding RNAs, exosome secretomes carry out cell-cell communication and promote tissue regeneration, wound healing, extracellular matrix remodeling, immunomodulation (100), angiogenesis, anti-apoptotic activity and cell migration, proliferation and differentiation (101). However, it remains unknown that Treg use caspase-1-Gasdermin D secretome, caspase-4-Gasdermin D secretome and exosome secretomes (100). We hypothesized that the expressions of Treg canonical secretome, three types of non-canonical secretomes such as caspase-1-Gasdermin D, caspase-4-Gasdermin D and exosome secretome are modulated in normal tissues, diseases and tumors. To examine this hypothesis, as shown in Figures 3A, B, we collected four types of secretomes with total 11,385 proteins including canonical secretome (signal peptide-mediated exocytic secretory pathway; 2,641 proteins) (28), caspase-1-dependent non-canonical secretome (non-signal peptide-mediated;961 proteins) (102), caspase-4-dependent non-canonical secretome (1,223 proteins) (103), and exosome secretome (6,560 proteins, downloaded from a comprehensive exosome database http://exocarta.org/download) (100). As shown in Figure 4A, canonical secretomic genes were upregulated in splenic Treg (8 genes), LN Treg (47 genes), splenic Treg (RNA-Seq, 135 genes), small intestine Treg (28 genes), BAT Treg (22 genes), VAT Treg (85 genes) and kidney Treg (189 genes), respectively. Of note, the sources of Tregs were specified in the Figure 4 and were also detailed in Table 1. We then performed the IPA for signaling pathways that upregulated secretomic genes are involved in. A total of 14 canonical secretome pathways were enriched in the normal Treg group (cut off: p < 0.05 and |Z-score| >= 2). There were no pathways enriched in splenic Treg (GSE119169) (not shown). As shown in Figure 4B, small intestine Treg, and BAT Treg. LPS/IL-1 mediated inhibition of RXR function was enriched in LN Treg. IL-6 signaling and type I diabetes mellitus signaling were enriched in splenic Treg (E-MTAB-7961). Toll-like receptor signaling and leukocyte extravasation signaling were enriched in VAT Treg. LN Treg and splenic Treg (E-MTAB-7961) shared a common p38 MAPK signaling pathway. Seven pathways such as VEGF family ligand-receptor interactions, nitric oxide signaling in the cardiovascular system, VEGF signaling, eNOS signaling, white adipose tissue browning pathway, ovarian cancer signaling, and BEX2 signaling pathway were enriched in kidney Treg (E-MTAB-7961). Taken together, these results have demonstrated that 1) lymphoid tissue Treg secretomes carry four inflammation-related functions such LPS/IL-1, IL6 signaling, type I diabetes signaling and p38 MAPK signaling; 2) VAT Treg play significant roles in Toll-like receptor signaling and leukocyte extravasation signaling; and 3) regeneration kidney Treg secretomic genes play critical roles in promoting kidney regeneration.
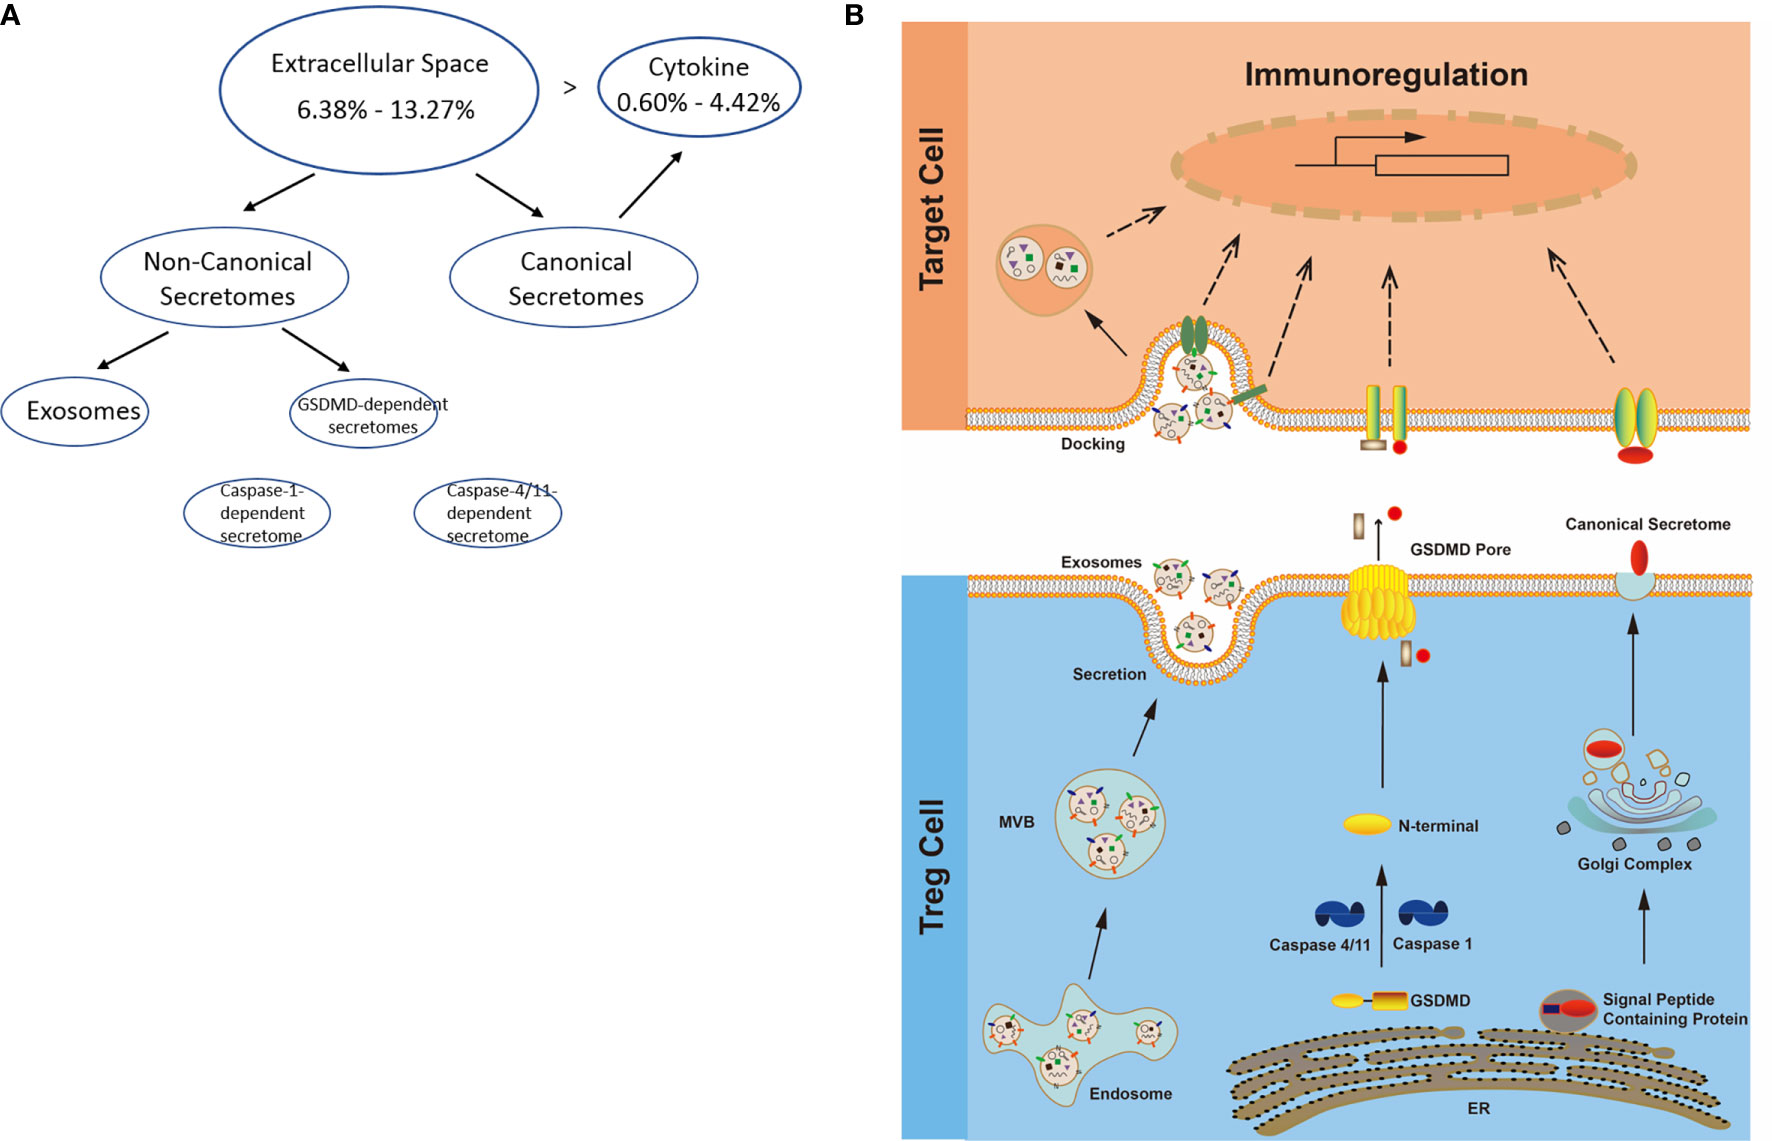
Figure 3 (A) Several secretomic pathways of Treg may contribute to the compositions of extracellular space molecules from Treg. In all the datasets, the percentages of extracellular space molecules were varied from 6.38 to 13.27%, which were much higher than the percentages of cytokines. Therefore, numerous additional non-canonical secretome molecules were existed in the extracellular space. The mechanisms of canonical and non-canonical secretome transportation were shown in Figure 1B. (B) The secretion mechanisms such as canonical (proteins with signal peptide) and non-canonical secretomes (proteins with no signal peptide) may contribute to the Treg secretory molecule repertoire. The proteins in canonical secretory pathway are secreted via endoplasmic reticulum (ER)-Golgi complexes-plasma membrane pathway (right in the lower panel). In contrast, proteins having no signal peptide are secreted via caspase-1-gasdermin D (GSDMD) pore/channel-dependent pathway (center in the lower panel), caspase-4 (humans)/11 (mice)-GSDMD-dependent pathway (center in the lower panel) and exosome pathway (left in the lower panel). Treg may use these secretomic proteins (including all the cytokines and chemokines) to fulfill their immunoregulatory functions by binding to their receptors or docking on exosome up-taking mechanisms on the plasma membrane.
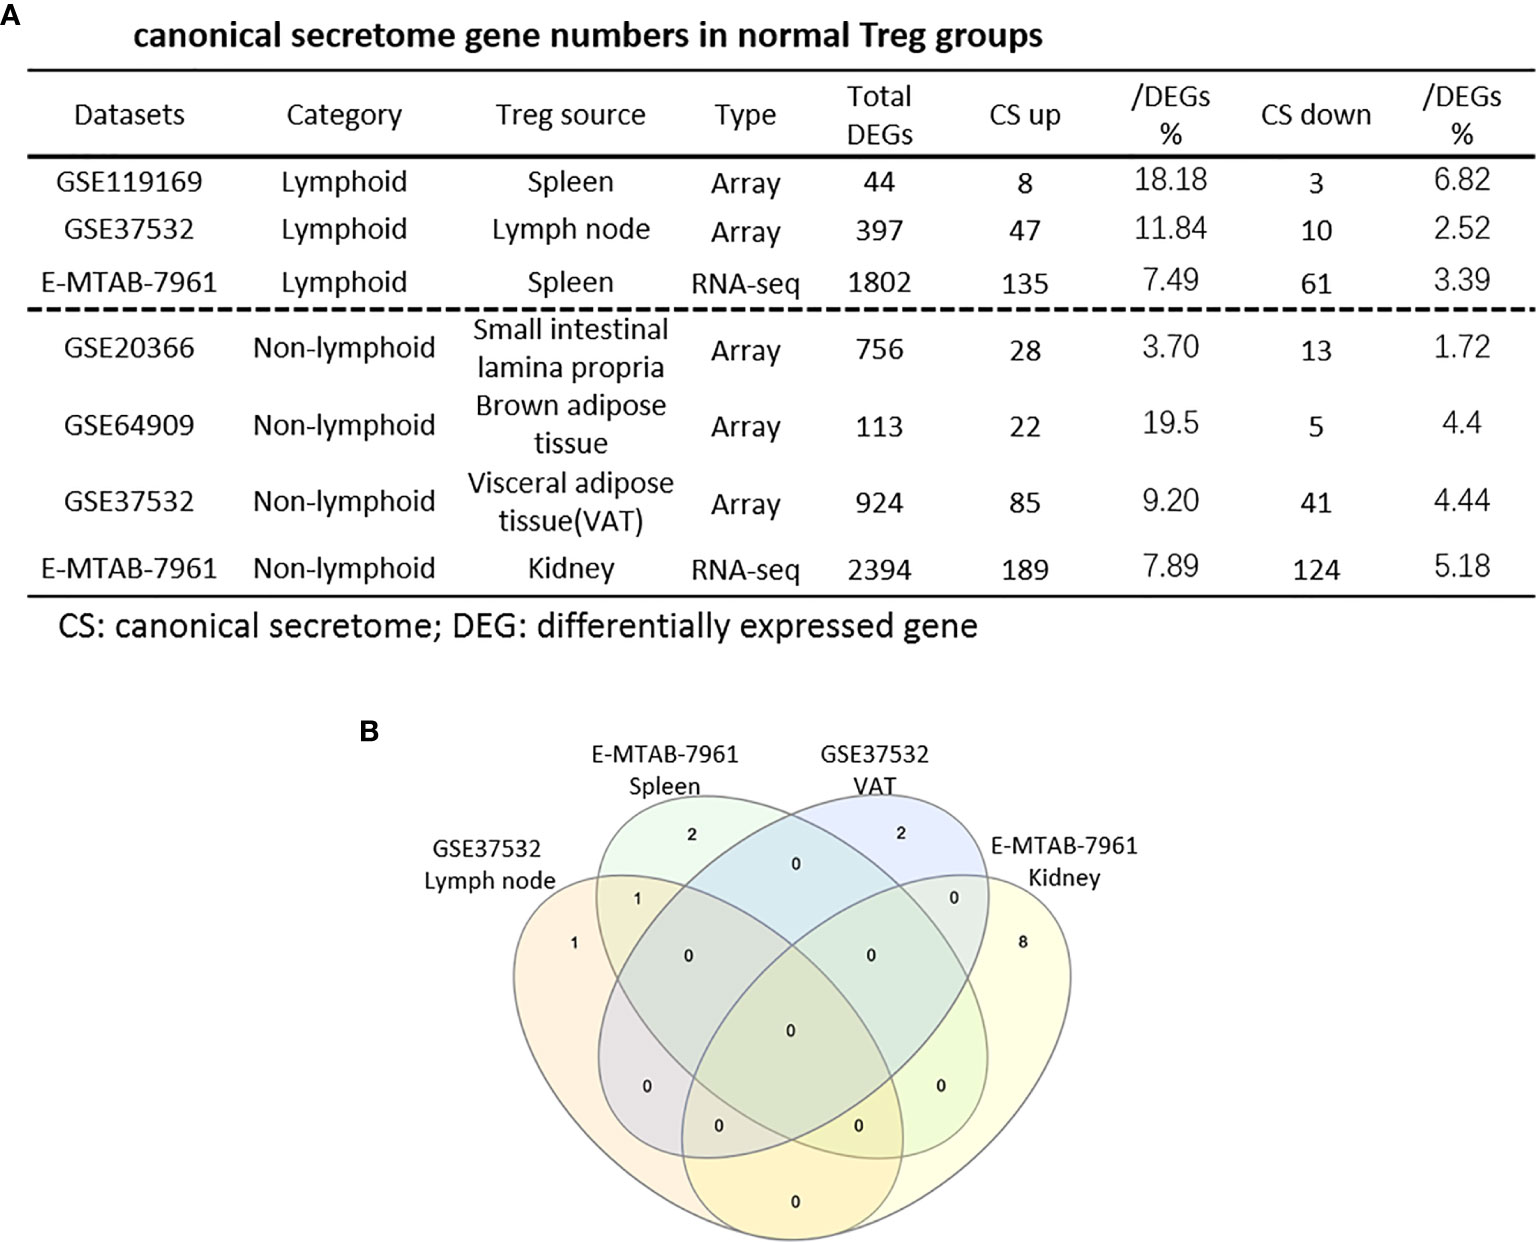
Figure 4 (A) The majority (13/14) of canonical secretome pathways in normal Treg groups were specific in lymphoid and non-lymphoid tissue Treg. A list of human 2640 canonical secretome (CS) genes were collected from our previous report (PMID: 32179051). The pathways associated with the DEGs in the Treg canonical secretome in each datasets were analyzed by IPA. (B) A total of 14 canonical secretome pathways were enriched in the normal Treg groups. There were no pathways enriched in GSE119169 spleen Treg, GSE20366 Small intestinal lamina propria Treg, and GSE64909 brown adipose tissue Treg. GSE37532 Lymph node Treg and E-MTAB-7961 spleen Treg shared a common p38 MAPK Signaling pathway. LPS/IL-1 Mediated Inhibition of RXR Function was enriched in GSE37532 lymph node Treg. IL-6 Signaling and Type I Diabetes Mellitus Signaling were enriched in E-MTAB-7961 spleen Treg. Toll-like Receptor Signaling and Leukocyte Extravasation Signaling were enriched in GSE37532 visceral adipose tissue (VAT) Treg. VEGF Family Ligand-Receptor Interactions, Nitric Oxide Signaling in the Cardiovascular System, VEGF Signaling, eNOS Signaling, White Adipose Tissue Browning Pathway, Ovarian Cancer Signaling, and BEX2 Signaling Pathway were enriched in E-MTAB-7961 Kidney tissue Treg. These specifically enriched canonical secretome pathways indicate that Treg cells in different tissues have diverse secreting functions. (cut off: p < 0.05 and |Z-score| >= 2).
As shown in Table 2A, canonical secretomic genes were upregulated in splenic Tregs from skeletal muscle injured for 2 weeks (48 genes) and skeletal muscle injured for 4 days (47 genes), fibrosis kidney (179 genes), regeneration kidney (265 genes), Treg from skeletal muscle injured for 2 weeks (74 genes), and Treg from skeletal muscle injured for 4 days (49 genes), respectively. Of note, the sources of Tregs were specified in the Table 2A and were also detailed in Table 1. These results showed that splenic Treg from injured skeletal muscles increased more canonical secretomic genes compared to normal splenic Treg (Figure 4); Treg from injured skeletal muscles (2 weeks) increased more canonical secretomic genes compared to that of Treg from injured skeletal muscles (4 days); Treg from regeneration kidney increased more canonical secretomic genes compared to that of Treg fibrosis kidney. In the benign disease Treg group as shown in Table 2B, a total of 24 activated pathways were enriched in upregulated secretomic genes. P38 MAPK signaling were shared in five Treg groups including splenic Treg (injured muscle for 2 weeks), splenicTreg (injured muscle for 4 days), skeletal muscle Treg (injured muscle for 2 weeks), skeletal muscle Treg (injured for 4 days), and Treg from fibrosis kidney. STAT3 pathway was shared in two kidney Treg sets. IL-6 signaling was increased in skeletal muscle Treg (injured for 4 days). Four of the canonical secretome pathways were specific in E-MTAB-7961 Treg from kidney regeneration dataset, including hepatic fibrosis signaling pathway, PDGF signaling, VEGF signaling, and VEGF family ligand-receptor interactions, which may carry functions of tissue repair. IL-6 signaling was specifically enriched in GSE50096 Treg from muscle injury 4 days dataset, which was in the acute reaction phase after muscle injury.
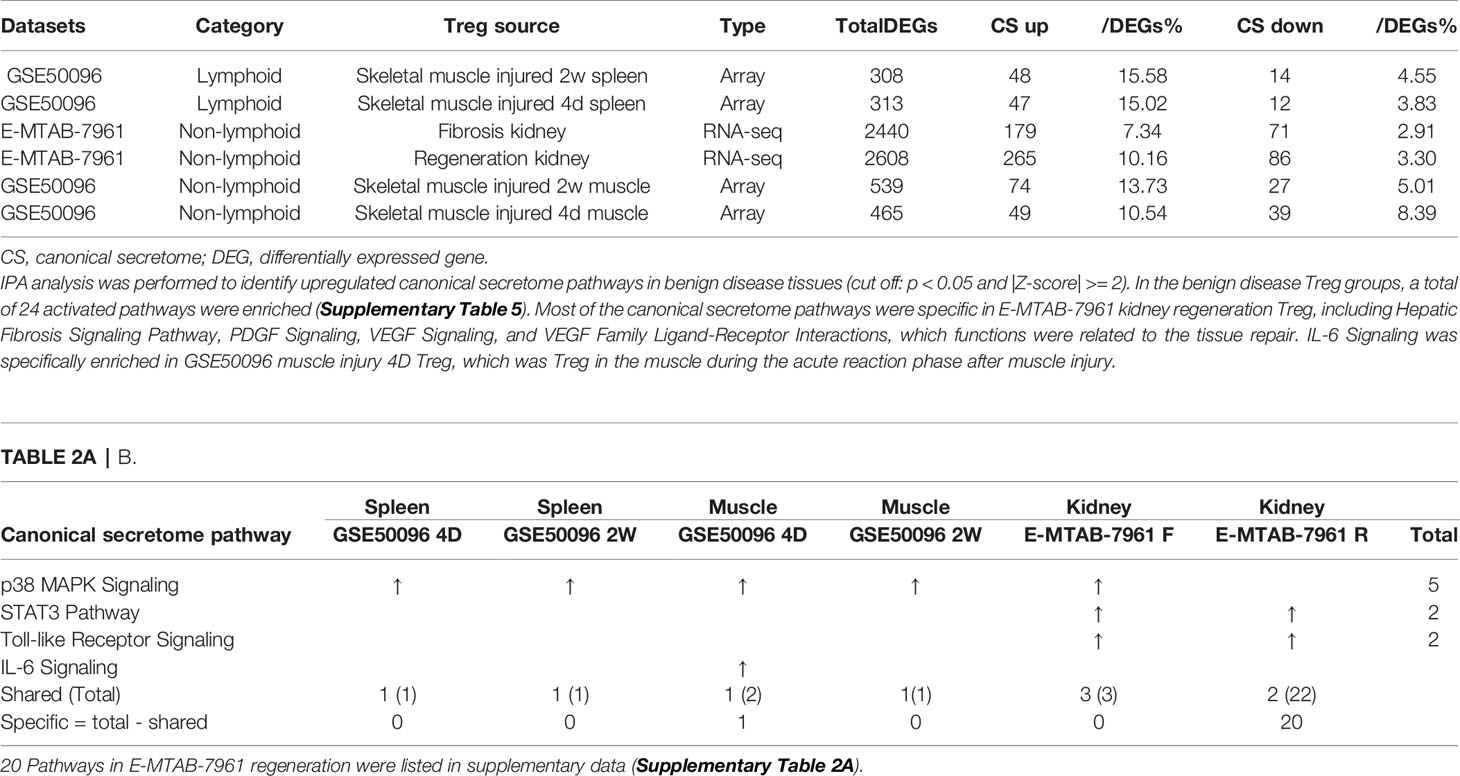
Table 2A All the specific canonical secretome pathways were enriched in the E-MTAB-7961 kidney regeneration Treg. A. Canonical secretome gene numbers in benign disease Treg groups.
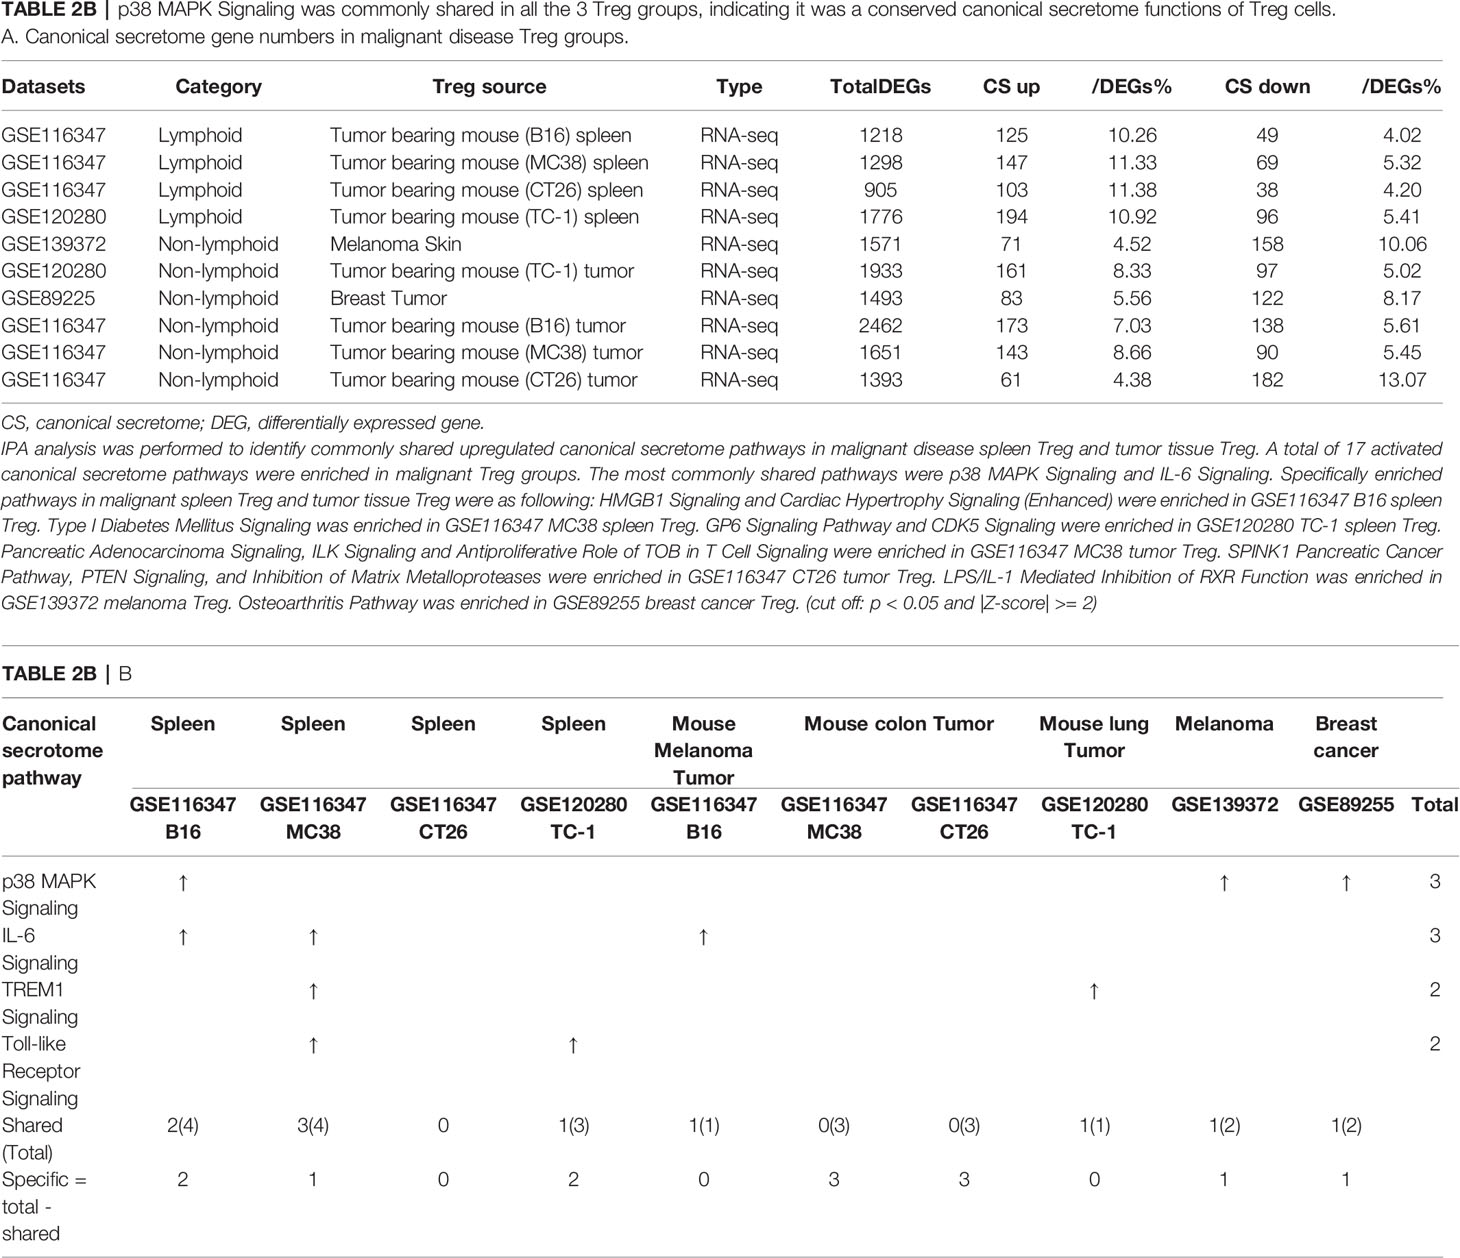
Table 2B p38 MAPK Signaling was commonly shared in all the 3 Treg groups, indicating it was a conserved canonical secretome functions of Treg cells. A. Canonical secretome gene numbers in malignant disease Treg groups.
As shown in Table 2B, canonical secretomic genes were upregulated in Treg from tumor bearing spleen (B16, 125 genes), Treg from tumor bearing spleen (MC38, 147 genes), Treg from tumor bearing spleen (CT26, 103 genes), Treg from tumor bearing spleen (TC-1, 194 genes), Treg from melanoma skin (71 genes), Treg from TC-1 tumor (161 genes), Treg from breast tumor (83 genes), Treg from B16 tumor (173 genes), Treg from MC38 tumor (143 genes) and Treg from CT26 tumor (61 genes), respectively. Of note, the sources of Tregs were specified in the Table 2B and were also detailed in Table 1. A total of 17 activated canonical secretome pathways were enriched in Treg from malignant groups. The most common shared pathways were p38 MAPK signaling and IL-6 signaling. In addition, TREM1 signaling was shared in splenic Treg from MC38 tumor bearing mouse, and Treg from TC-1 lung tumor. Toll-like receptor signaling was shared by splenic Treg from mouse bearing MC38 tumor and splenic Treg from mouse bearing TC-1 lung tumor. Specifically enriched pathways in malignant spleen and tissues were as following: Two pathways such as HMGB1 signaling and cardiac hypertrophy signaling (Enhanced) were enriched in GSE116347 B16 splenic Treg. One pathway, type I diabetes mellitus signaling, was enriched in GSE116347 MC38 splenic Treg. Two pathways including GP6 signaling pathway and CDK5 signaling were enriched in GSE120280 TC-1 splenic Treg. Three pathways including pancreatic adenocarcinoma signaling, ILK signaling and antiproliferative role of TOB in T cell signaling were enriched in GSE116347 MC38 tumor Treg. Also, three pathways including SPINK1 pancreatic cancer pathway, PTEN signaling, and inhibition of matrix metalloproteases were enriched in GSE116347 CT26 tumor Treg. One pathway, LPS/IL-1 mediated inhibition of RXR function, was enriched in GSE139372 melanoma Treg. One pathway, osteoarthritis pathway, was enriched in GSE89255 breast cancer Treg. Taken together, these results have demonstrated that 1) four Treg pathways including p38 MAPK signaling, IL-6 signaling, TREM1 signaling and Toll-like receptor signaling often found in non-malignant Treg are only shared in some tumor Treg but not all the tumor Treg groups (Table 2B); 2) splenic Treg from mouse bearing different tumors upregulated different pathways; and 3) tumor Treg upregulated specific pathways.
In the most comprehensive exosome database (http://www.exocarta.org/), we collected all the exosome proteins, 6560, which are experimentally identified in exosomes having no overlaps with other secretomes and no duplications. As shown in Table 3A, tissue Treg upregulated exosome secretomic genes including splenic Treg (9 genes), LN Treg (116 genes), splenic Treg (RNA-Seq, 301 genes), small intestine Treg (189 genes), BAT Treg (55 genes), VAT Treg (254 genes) and kidney Treg (356 genes), respectively. Of note, the sources of Tregs were specified in the Table 3A and were also detailed in Table 1. As shown in Table 3A, A total of 56 exosome pathways were enriched in normal group, including 22 shared and 34 specific pathways. Two pathways including synaptic long term depression and role of NFAT in regulation of the immune response were common in Treg from lymphoid tissues. Three pathways including cardiac hypertrophy signaling, sphingosine-1-phosphate signaling and Wnt/Ca+ pathway were common in Treg from non-lymphoid tissues. Production of nitric oxide and reactive oxygen species in macrophages was enriched in GSE37532 LN Treg. Six pathways including neuroinflammation signaling pathway, type I diabetes mellitus signaling, ERK5 signaling, NF-κB signaling, synaptic long term potentiation, and endothelin-1 signaling were enriched in E-MTAB-7961 splenic Treg. Three pathways including vitamin-C transport, FGF signaling, and senescence pathway were enriched in GSE37532 VAT Treg. 24 pathways enriched in E-MTAB-7961 kidney Treg were shown in supplementary Table 3A.
Table 3A 70.6% (20/34) specific exosome pathways were in E-MTAB-7961 kidney tissue Treg. A list of human 6560 exosome genes were collected. A. Exosome gene numbers in normal Treg groups.
As shown in Table 3B, tissue Treg upregulated exosome secretomic genes including splenic Treg from injured skeletal muscle for 2 weeks (96 genes), splenic Treg from injured skeletal muscles for 4 days (115 genes), fibrosis kidney Treg (379 genes), regeneration kidney Treg (541 genes), Treg from injured skeletal muscle for 2 weeks (147 genes), and Treg from injured skeletal muscle for 4 days (94 genes), respectively. Of note, the sources of Tregs were specified in the Table 3B and were also detailed in Table 1.As shown in Table 3B, A total of 111 exosome pathways were enriched in benign disease groups including 32 shared pathways and 79 specific pathways. Among them, 71 out of 79 specifically enriched pathway were in Treg from regeneration kidney and fibrosis kidney (E-MTAN-7961 dataset). Vitamin-C transport and Th2 pathway were enriched in splenic Treg from injured skeletal muscle for 2 weeks (GSE50096). TREM1 signaling was enriched in splenic Treg from injured skeletal muscle for 4 days (GSE50096). PTEN signaling was enriched in injured skeletal muscle Treg for 4 days (GSE50096). Three pathways including dendritic cell maturation, apelin endothelial signaling pathway, and bladder cancer signaling were enriched in Treg from fibrosis kidney (E-MTAB-7961), and 71 specifically enriched pathway in Treg from regeneration kidney (E-MTAB-7961) were shown in supplementary Table 3B.
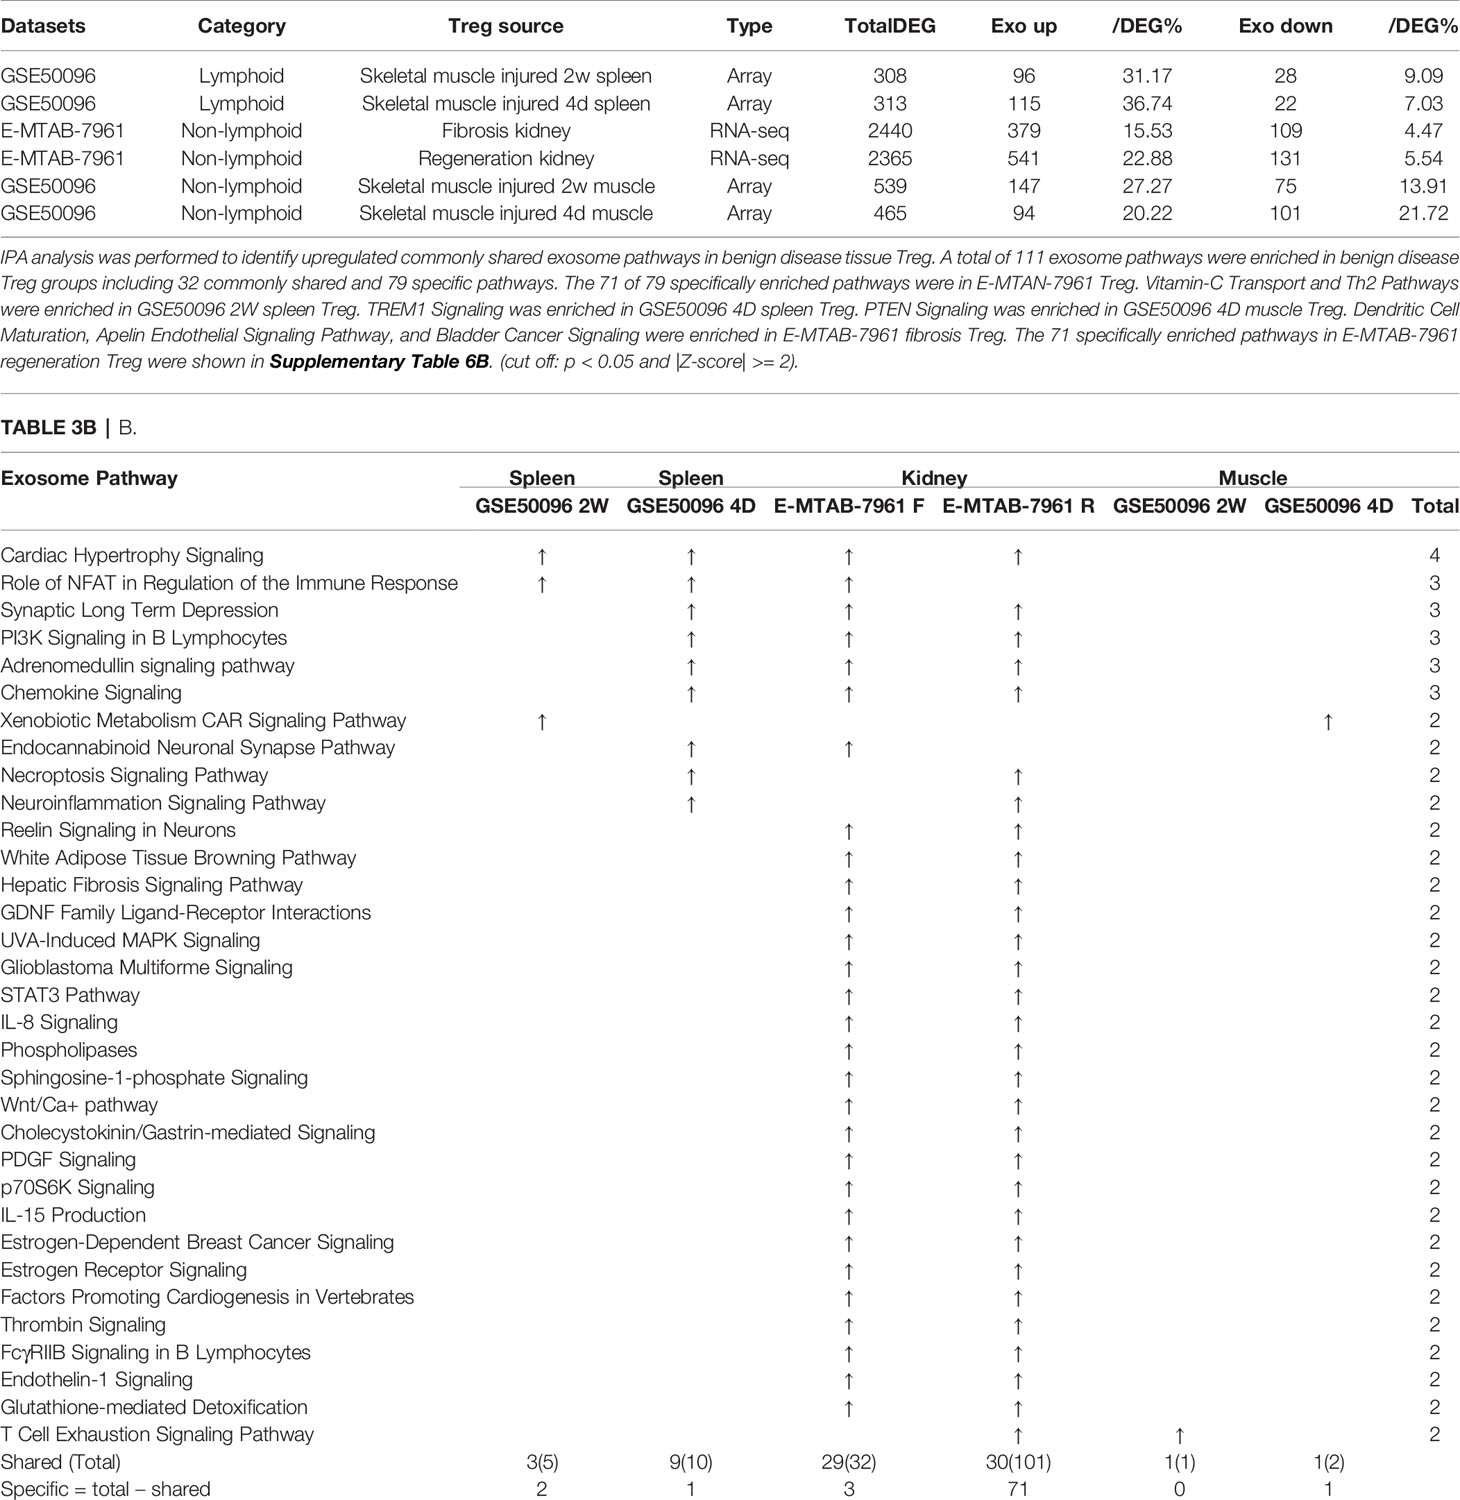
Table 3B E-MTAB-7961 Kidney regeneration Treg enriched pathways contributed to 91.0% (101/111) exosome pathways in identified benign disease Treg groups. A. Exosome gene numbers in benign disease Treg groups.
As shown in Table 3C, exosome secretomic genes were upregulated in splenic Treg from B16 tumor bearing mouse (328 genes), splenic Treg from MC38 tumor bearing mouse (331 genes), splenic Treg from CT26 tumor bearing mouse (236 genes), splenic Treg from TC-1 tumor bearing mouse (475 genes), Treg from melanoma skin (121 genes), Treg from TC-1 tumor (419 genes), Treg from breast tumor (204 genes), Treg from B16 tumor (572 genes), Treg from MC38 tumor (415 genes) and Treg from CT26 tumor (188 genes), respectively. Of note, the sources of Tregs were specified in the Table 3C and were also detailed in Table 1. As shown in Table 3C, a total of 69 exosome pathways were enriched in malignant groups, including 35 common shared and 34 specific pathways. The 42 out of 69 exosome pathways were in the lymphoid tissues. Two pathways including vitamin-C transport and endothelin-1 signaling were the most commonly enriched pathways. Eight pathways including cell cycle control of chromosomal replication, BEX2 signaling pathway, cholesterol biosynthesis III (via desmosterol), superpathway of cholesterol biosynthesis, cholesterol biosynthesis II (via 24,25-dihydrolanosterol), cholesterol biosynthesis I, and glycolysis I were only common shared in Treg from malignant non-lymphoid tissues.
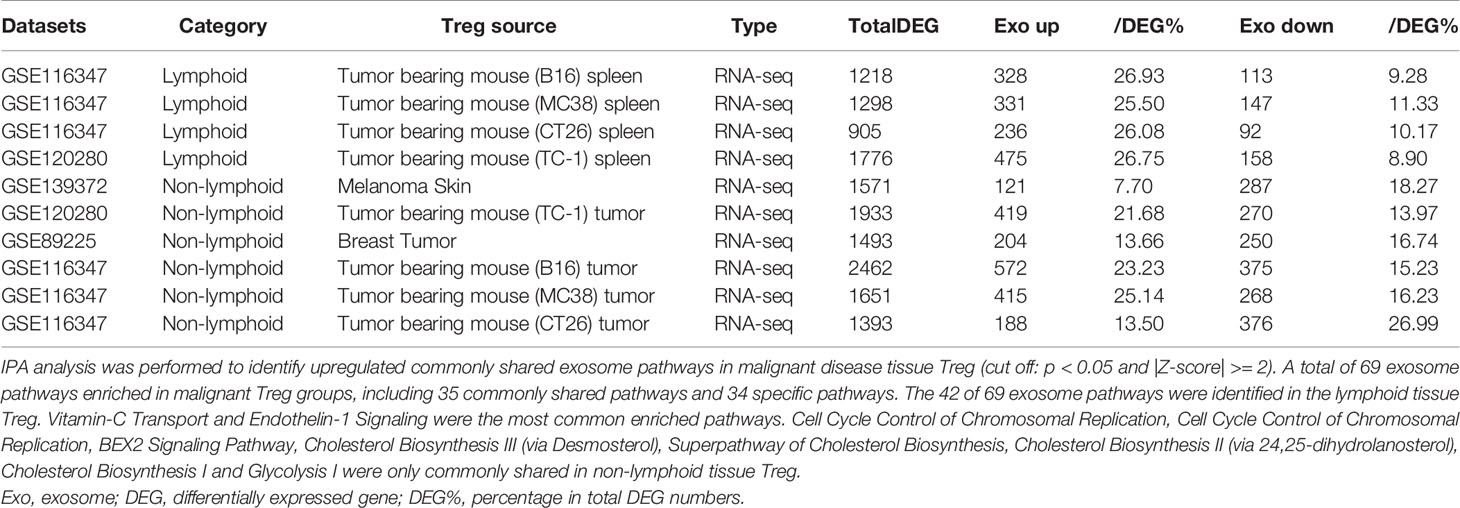
Table 3C Lymphoid tissue Treg enriched more exosome pathways than non-lymphoid tissue Treg. A. Exosome gene numbers in benign disease Treg groups.
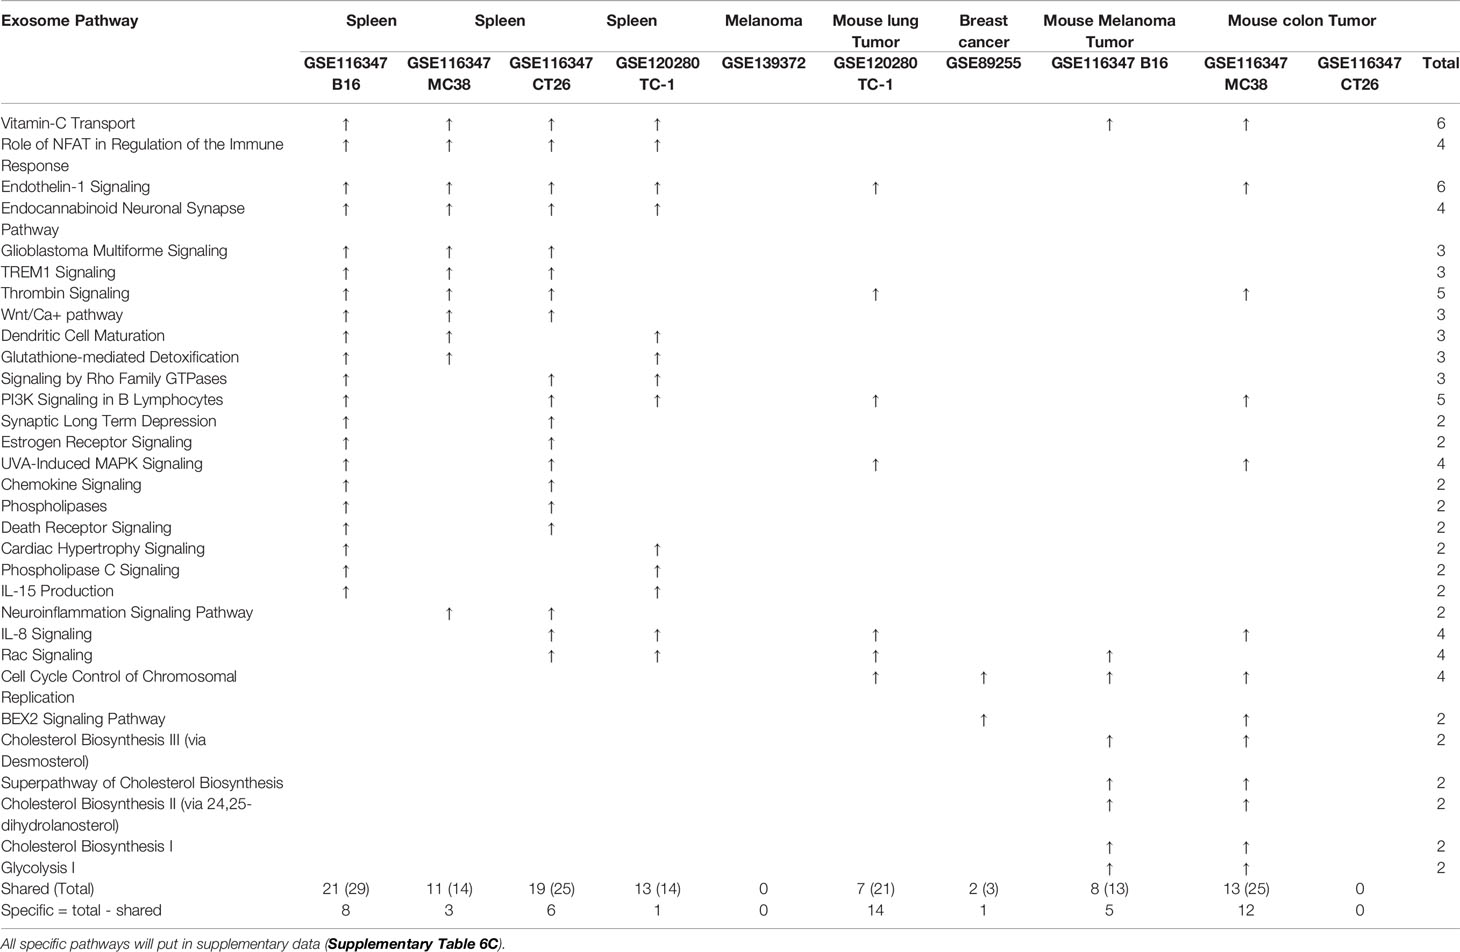
Table 3C B.
Taken together, our results have demonstrated that First, in comparison to that shown in Tables 3A, B, Treg from tumor bearing spleens and tumor tissues in Table 3C upregulate more exosome secretomic genes but less pathways, suggesting that Treg pathways from tumors are more focused than Treg from non-malignant disease tissues; Second, two pathways including synaptic long term depression and role of NFAT in regulation of the immune response were common in normal lymphoid tissue; three pathways including cardiac hypertrophy signaling, sphingosine-1-phosphate signaling and Wnt/Ca+ pathway were common in Treg from non-lymphoid tissues; Third, Treg from non-malignant disease groups have much less shared pathways than normal tissue Treg and malignant tissue Treg; and Fourth, vitamin-C transport and endothelin-1 signaling were most common enriched pathways; and eight pathways were enriched in Treg from malignant non-lymphoid tissues in cholesterol synthesis and cell cycle controls.
It has been reported that NLRP3 negatively regulate Treg differentiation through Kpna-2 mediated nuclear translocation (120); that TLR2 and TLR4 signalings induce inflammasome priming in Th1-like Treg (128); and that caspase-1 canonical inflammasome pathway and caspase-4 (humans)/caspase-11 (mice) non-canonical inflammasome pathway all cleave N-terminal Gasdermin D (123), which form a protein pore/channel on the cell membrane to release proinflammatory cytokines such as IL-1β and IL-18. It has been also reported that caspase-1-dependent non-canonical secretome (non-signal peptide-mediated) secrete 961 proteins (102), and caspase-4-dependent non-canonical secretome secrete 1,223 proteins (103). We hypothesized that caspase-1- dependent secretomic transcripts and caspase-4-dependent secretomic transcripts are modulated in Treg from normal tissues, non-malignant disease Treg, and Treg from tumor spleens and tumors. As shown in Table 3D, Treg from normal LN and spleen upregulated 8 to15 caspase-1-dependent secretomic genes and 12 to 35 caspase-4 secretomic genes, respectively. In addition, intestine Treg, BAT Treg, VAT Treg and kidney Treg upregulated 16, 8, 18 and 20 casapse-1 secretomic genes, and 15, 8, 22, and 42 casapse-4 secretomic genes, respectively. Treg from injured skeletal muscle (2 weeks) spleen and Treg from injured skeletal muscle (4 days) spleen, fibrosis kidney Treg, regeneration kidney Treg, injured skeletal muscle (2 weeks) Treg, and injured skeletal muscle (4 days) Treg upregulated 6, 7, 13, 25, 10, and 10 caspase-1 secretomic genes, and upregulated 10, 13, 37, 56, 11, and 10 caspase-4 secretomic genes, respectively. Moreover, Treg from B16 spleen, Treg from MC38 spleen, Treg from CT26 spleen, Treg from TC-1 spleen upregulated 20, 18, 14, 21 caspase-1 secretomic genes, and 35, 42, 28, and 38 caspase-4 secretomic genes, respectively. Furthermore, Treg from melanoma, Treg from TC-1 tumor, Treg from breast tumor, Treg from B16 tumor, Treg from MC38 tumor, and Treg from CT26 tumor upregulated 2, 18, 9, 42, 27, and 9 caspase-1 secretomic genes, and 8, 33, 16, 72, 39, and 11 caspase-4 secretomic genes, respectively. Of note, the sources of Tregs were specified in the Table 3D and were also detailed in Table 1.
Table 3D Gene numbers of caspase-4 dependent GSDMD secretomes were more than caspase-1 dependent GSDMD secretomes in various Treg groups.
The pathway analysis results (Table 3E and Figure 5A) showed that normal tissue Treg and non-tumor diseased tissue Treg shared seven upregulated caspase-1 secretomic gene pathways including pathways in cancer, vesicle organization, negative regulation of apoptotic signaling, myeloid leukocyte activation, striated muscle cell differentiation, cell morphogenesis, and supramolecular fiber organization. Treg from non-tumor diseased tissues and tumors shared three upregulated caspase-1 secretomic pathways including extracellular structure, response to reactive oxygen species, cell-substrate junction. Tumor spleen Treg and tumor Treg shared one upregulated caspase-1 secretomic pathway, fluid shear stress and atherosclerosis. In addition, normal spleen Treg, normal tissue Treg, non-tumor diseased spleen Treg, non-tumor diseased tissue Treg, tumor spleen Treg and tumor Treg had 2, 13, 9, 11, and 12 specific upregulated caspase-1 secretomic pathways, respectively.
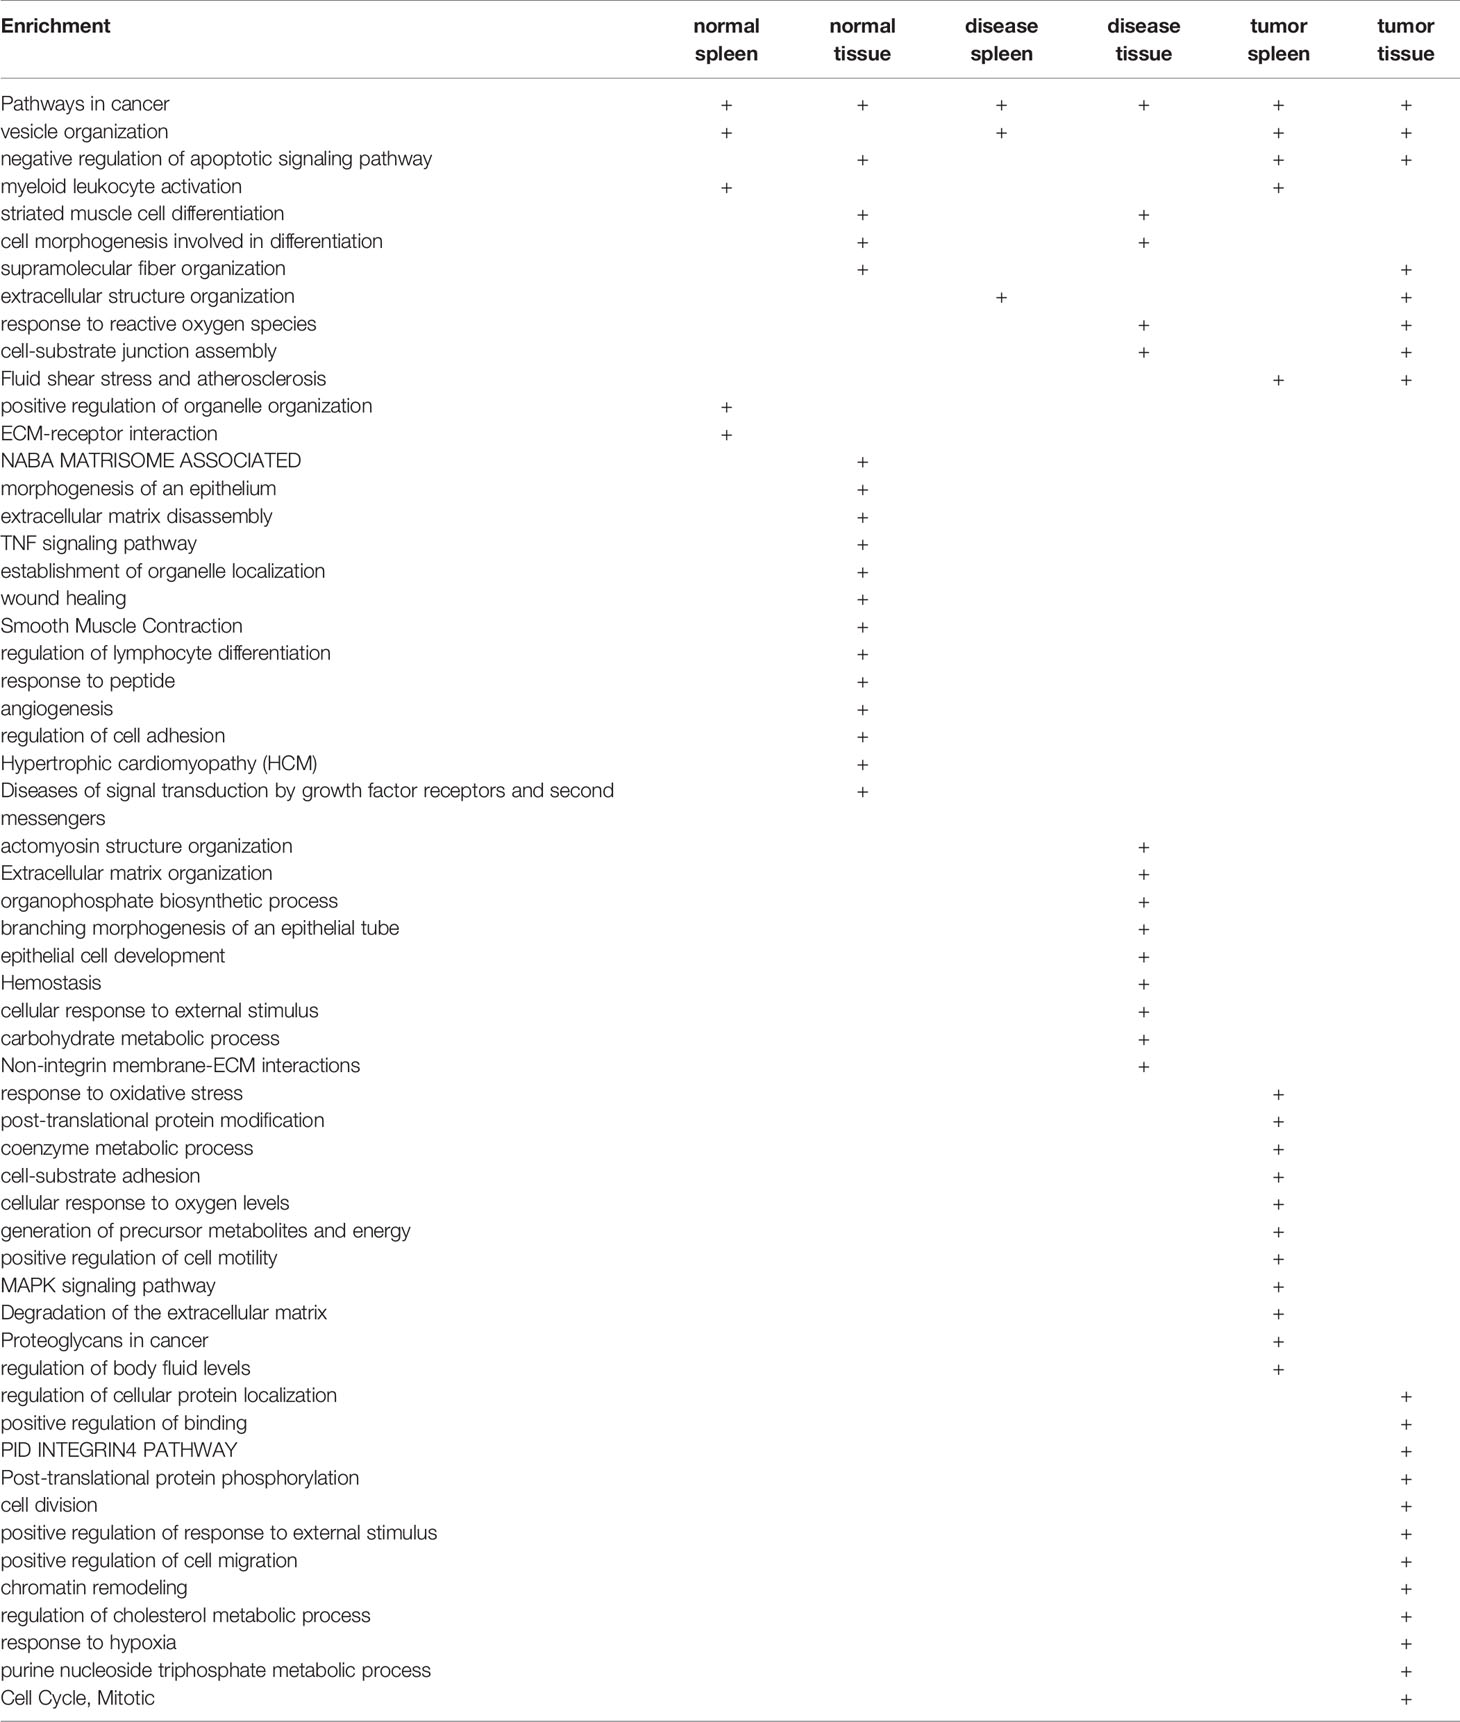
Table 3E Metascape analysis was performed to identify pathways associated with upregulated caspase-1 dependent GSDMD secretome gene lists in various Treg groups.
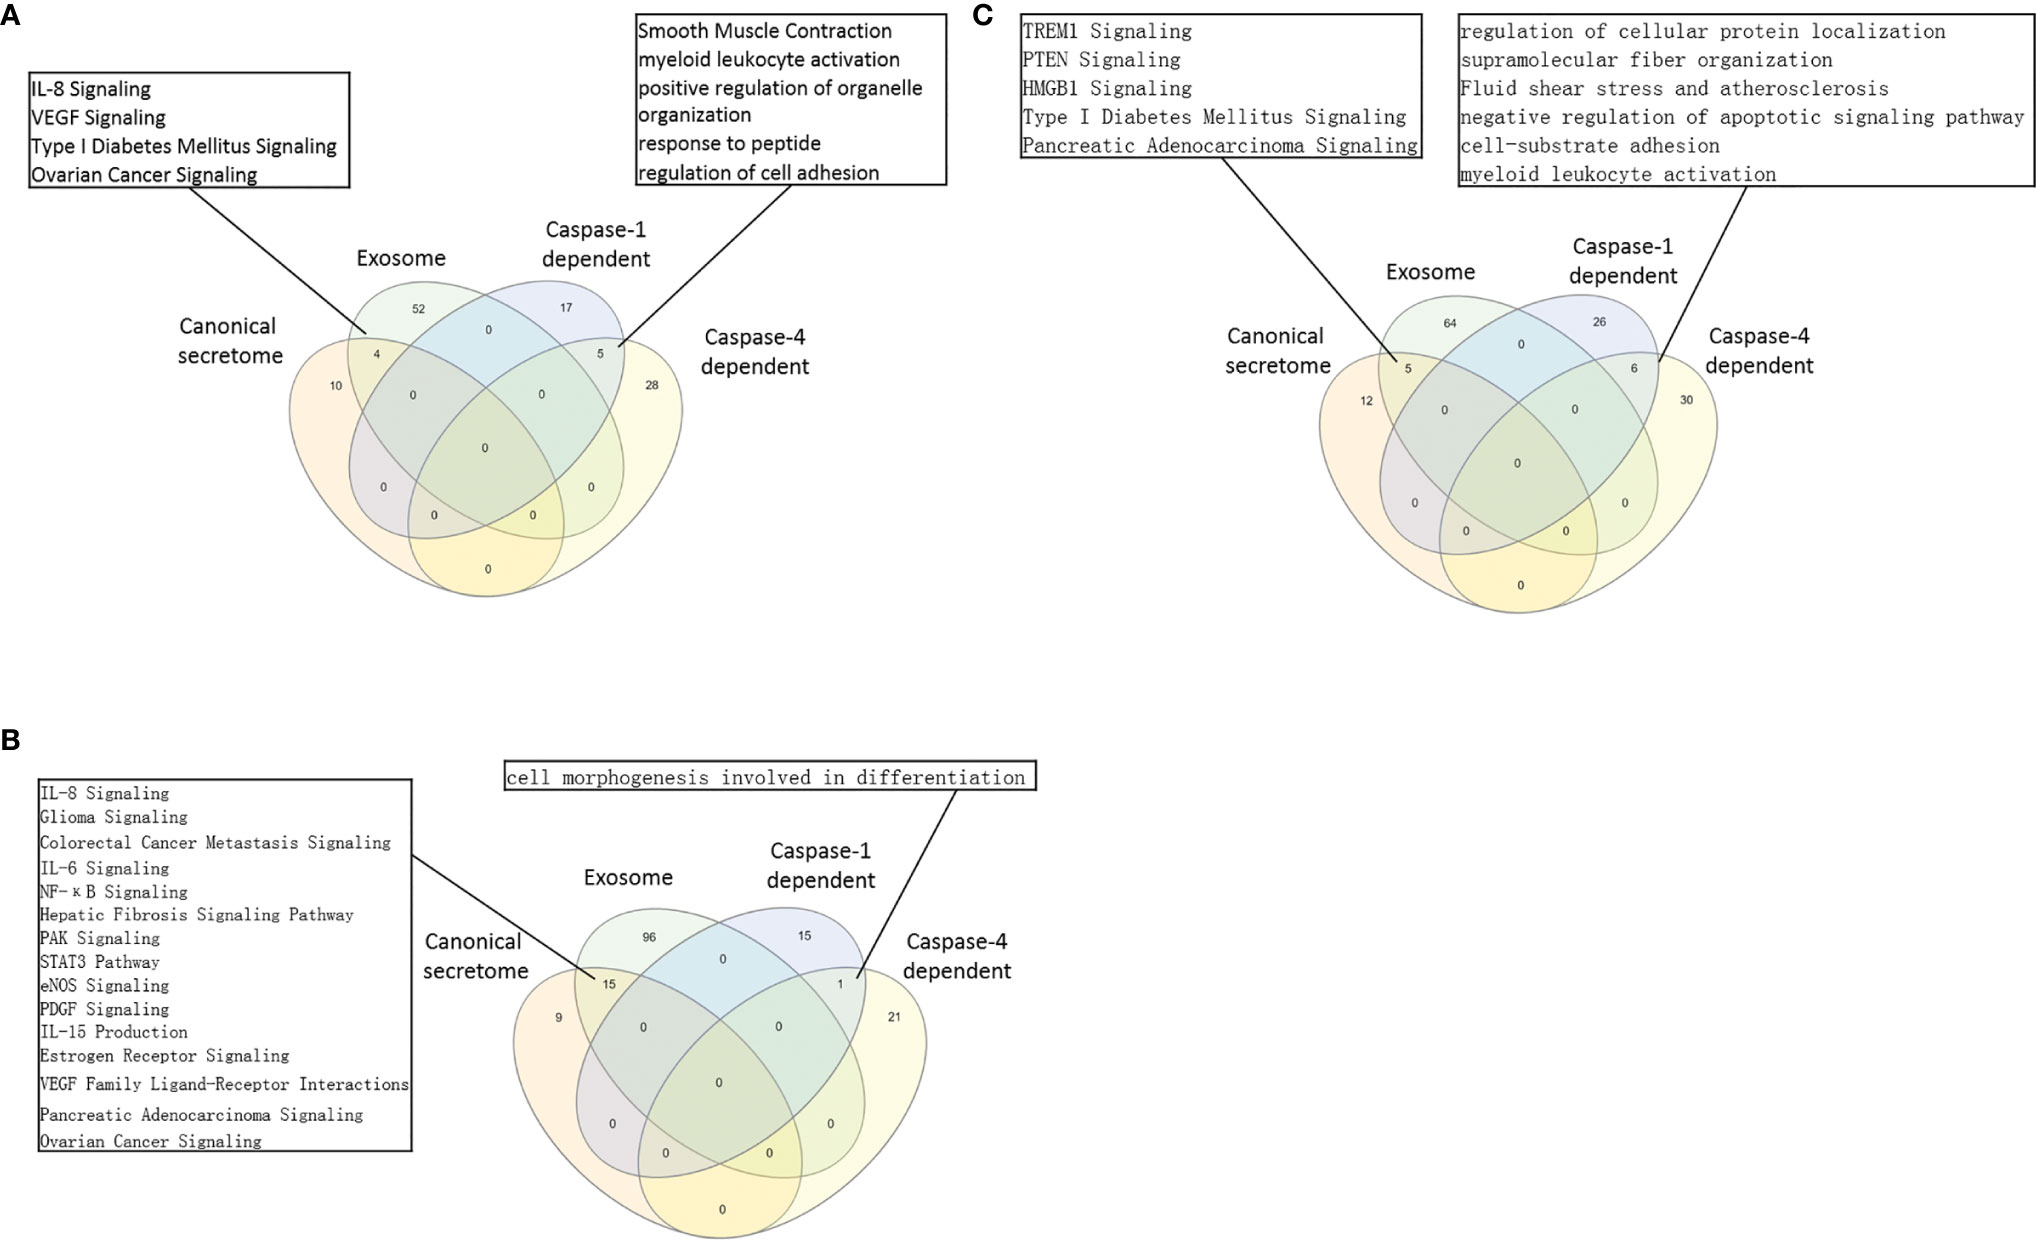
Figure 5 (A) In normal tissue Treg groups, 4 pathways were shared by Treg canonical secretomes and exosome secretomes. The 5 pathways in Treg groups were shared by caspase-1-dependent, and Caspase-4 dependent gasdermine-D secretomes. Canonical secretome, Exosome secretomes, Caspase-1-dependent and Caspase-4 dependent gasdermine-D pathways in normal spleen Treg and tissue Treg were analyzed by Venn diagram. The Treg canonical secretomes and Treg exosomes had 4 overlapped pathways. The caspase-1 dependent-gasdermin D secretomes and Caspase-4 dependent gasdermine-D secretomes had 5 overlapped pathways. (B) In benign disease tissue Treg groups, 15 pathways were shared by Treg canonical secretomes and Treg Exosome secretomes. Only one pathway was shared by Treg caspase-1-gasdermin D secretomes and Treg caspase-4 dependent gasdermine-D secretomes. (C) In malignant disease tissue Treg groups, 5 pathways were shared by Treg canonical secretomes and Treg Exosome secretomes. The 6 pathway was shared by Treg caspase-1-gasdermin D secretomes and Treg caspase-4 dependent gasdermine-D secretomes.
The pathway analysis results (Table 3F and Figure 5B) showed that normal tissue Treg and non-tumor diseased tissue Treg shared 15 upregulated caspase-4 secretomic pathways. Treg from non-tumor diseased tissues and tumors shared four upregulated caspase-4 secretomic pathways. Tumor spleen Treg and tumor Treg shared one upregulated caspase-4 secretomic pathway, fluid shear stress and atherosclerosis. In addition, normal spleen Treg, normal tissue Treg, non-tumor diseased spleen Treg, non-tumor diseased tissue Treg, tumor spleen Treg and tumor Treg had 8, 10, 2, 9, 11, and 9 specific upregulated caspase-4 secretomic pathways, respectively.
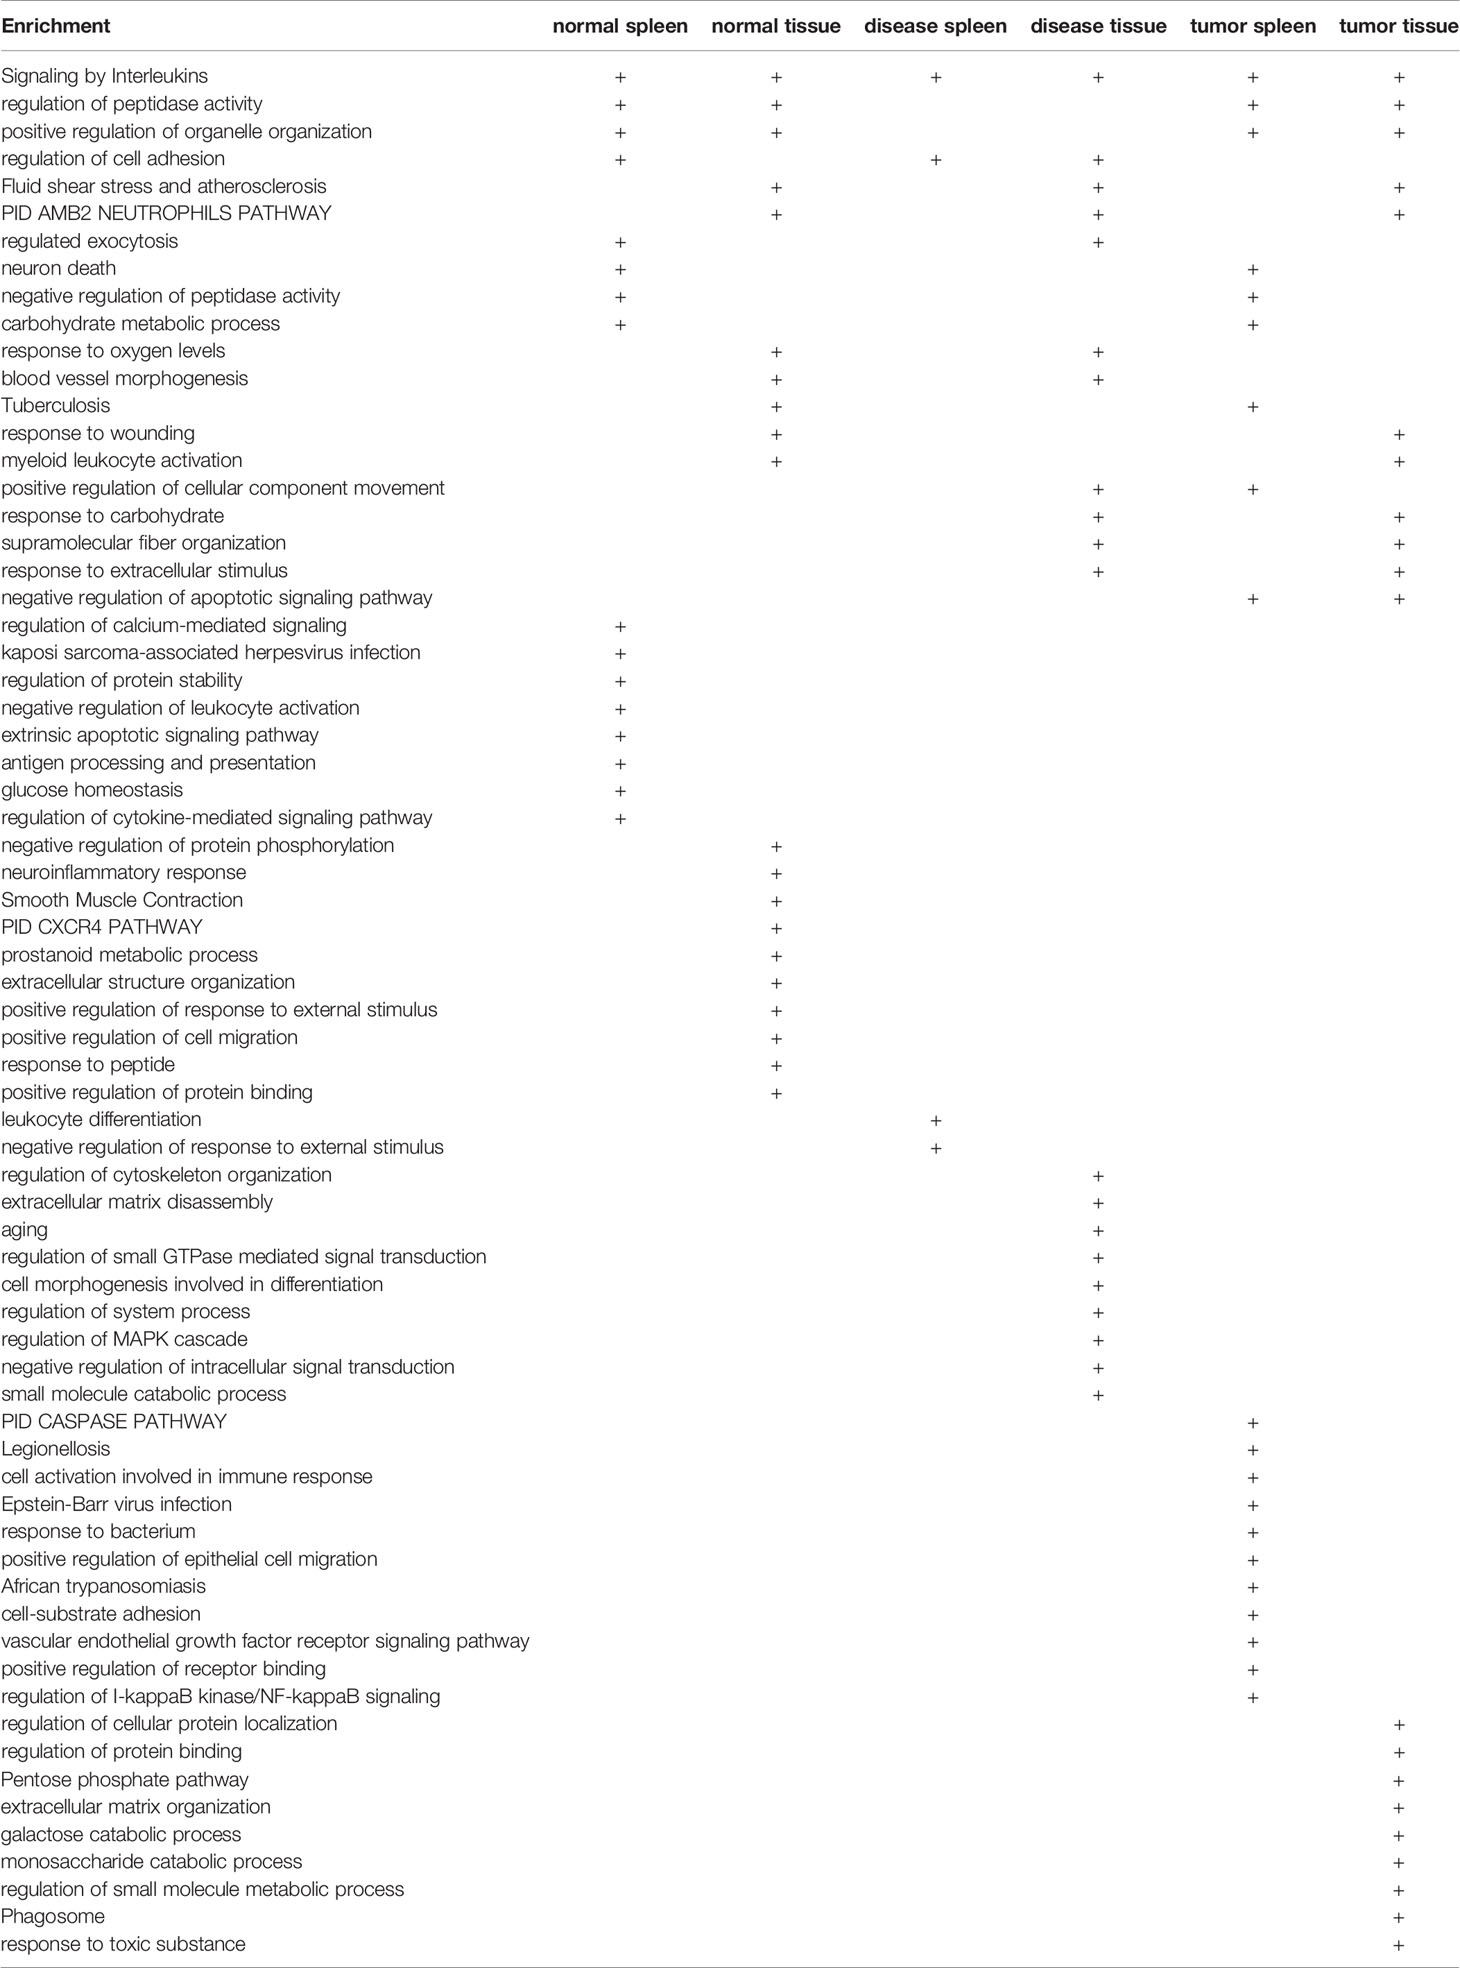
Table 3F Metascape analysis was performed to identify pathways associated with upregulated caspase-4 dependent GSDMD secretome gene lists in various Treg groups.
Taken together, our results have demonstrated that First, upregulations of caspase-1- dependent secretomic genes and caspase-4-dependent secretomic genes in Treg are more than downregulation of those secretomic genes; Second, upregulations of caspase-4-dependent secretomic genes in Treg often are more than upregulations of caspase-1 secretomic genes in Treg; Third, most of Treg caspase-1 secretomic gene pathways are different from that of Treg caspase-4 secretomic pathways (Figure 5C), suggesting that Treg caspase-1 secretomic genes play different roles in Treg from that of caspase-4 secretomes; and Fourth, the majority of caspase-1 secretomic pathways and caspase-4 secretomic pathways are tissue Treg-specific. These results suggest that normal tissue Treg, non-tumor diseased tissue Treg and tumor Treg upregulate novel caspase-1 secretomic genes and caspase-4 secretomic genes to fulfill their tissue-specific, secretomes-specific Treg functions and shared Treg functions.
It has been reported that Foxp3 plays significant roles in Treg specific gene expressions (74), and induces 58 gene upregulation and 46 gene downregulation (129). We hypothesized that Foxp3 plays significant roles in promoting DEGs in Treg from normal tissues, non-tumor diseased tissues and tumor tissues. To test this hypothesis, we placed all the DEGs of Treg versus Teffector cells with Treg upregulated genes in the >1 log2 in the Y-axis, and Foxp3 depletion-suppressed genes in the >1 log2 in the X-axis (Figure 6A). The argument was that if gene expressions are promoted by Foxp3, the genes will be showed in Foxp3 induced gene groups; otherwise, they will be showed in Foxp3 suppressed gene group. If any genes upregulated or downregulated in tissue Treg, non-tumor diseased Treg and tumor Treg are not collaborated with Foxp3 regulation, they will be placed in non-collaboration gene groups. As shown in Figure 6B, LN Treg, splenic Treg, intestine Treg, BAT Treg, VAT Treg, kidney Treg had 8, 11, 0, 2, 11, and 14 upregulated non-collaboration genes. In addition, Treg from injured skeletal muscle (2 weeks) spleen, Treg from injured skeletal muscle (4 days) spleen, Treg from fibrosis kidney, Treg from regeneration kidney, Treg from injured skeletal muscle (2 weeks), Treg from injured skeletal muscle (4 days) had 3, 4, 6, 14, 2, and 1 upregulated non-collaboration genes. Treg from B16 spleen, Treg from MC38 spleen, Treg from CT26 spleen, Treg from TC-1 spleen, Treg from melanoma, Treg from TC-1 tumor, Treg from breast tumor, Treg from B16 tumor, Treg from MC38 tumor, and Treg from CT26 tumor had 17, 16, 14, 16, 8, 17, 11, 12, 7 and 4 upregulated non-collaboration genes. Moreover, Treg from normal tissues had 0% to 12.2% non-collaboration genes, Treg from non-tumor diseased tissues had 0.6% to 7.3% non-collaboration genes, and Treg from tumor spleens and tumors had 3.6% to 36.8% non-collaboration genes (Figures 6C, D). Furthermore, as shown in the dot plots, Treg from tumor spleens and tumors had significantly increased Foxp3 non-collaboration genes. As shown in Figure 6E, 37 pathways were associated with Foxp3 non-collaboration genes, among which 18 pathways were specifically associated with tumor Treg. Our results have demonstrated that normal tissue Treg and non-tumor diseased tissue Treg have transcriptomic changes in Foxp3-dependent manners; and tumor spleen Treg and tumor Treg have certain transcriptomic changes in Foxp3 non-collaboration manners with ROS and other 17 specific pathways.
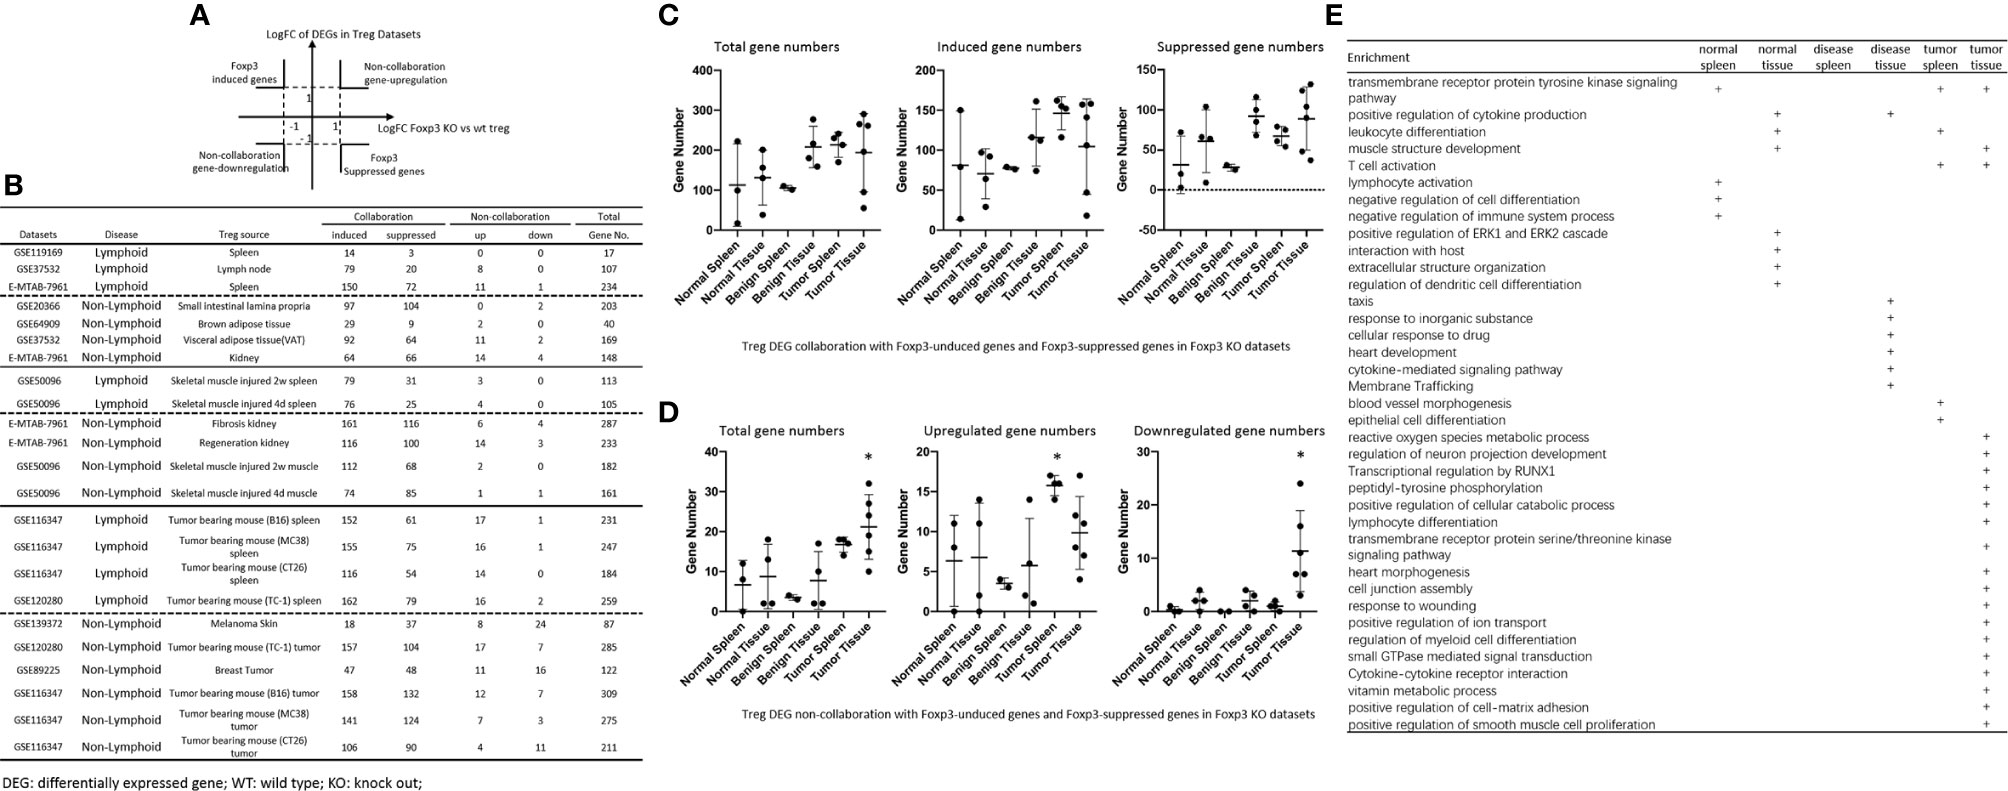
Figure 6 (A, B) All the upregulated and downregulated genes from Treg datasets were compared to Foxp3 deletion (Foxp3 KO) microarray dataset versus WT Treg dataset (GSE6681) to identify Foxp3-collaboration genes. The DEGs overlapped in the upregulated genes in Treg datasets and downregulated genes in Foxp3 KO dataset were defined as FOXP3-induced gene. The DEGs overlapped in the downregulated genes in Treg datasets and upregulated genes in Foxp3 KO datasets were defined as FOXP3-suppressed genes. Both groups of DEGs were defined as FOXP3 collaboration genes. Otherwise, the DEGs up-, or down-regulated genes that were not overlapped between Treg datasets and Foxp3 KO datasets were defined as non-collaboration genes. (C, D) In the DEGs shared between Treg datasets and Foxp3-regulated genes in Foxp3 KO datasets, the majority of which were FOXP3 collaborated genes, indicating Treg-master transcription factor FOXP3. The total non-collaboration DEG numbers were much higher in tumor tissue Treg groups (p < 0.05). The DEGs regulated in tumor tissue Treg groups were more complicated than that in benign and normal tissue Treg groups. (E) In FOXP3 non-collaboration gene pathways, normal tissue Treg groups shared 1 pathway with benign disease tissue Treg groups, and shared 3 pathways with tumor tissue Treg groups. FOXP3 non-collaboration genes in each Treg group were analyzed using the Metascape pathway analysis. The FOXP3 non-collaboration pathways in normal tissue Treg, benign tissue Treg, and malignant disease spleen and tissue Treg groups were summarized in this table. Venn diagram analysis was performed to show the overlapped pathways among the normal tissue Treg, benign diseased tissue Treg, and malignant tissue Treg groups. *Significantly changed.
It has been reported that a Treg-specific deficiency of cytotoxic T lymphocyte antigen 4 (CTLA-4) results in development of systemic lymphoproliferation, fatal autoimmune disease, hyperproduction of immunoglobulin E, and potent tumor immunity (130). Our previous report determined the expression of 28 co-signaling receptors in 32 human tissues in physiological/pathological conditions and found that the expression of inflammasome components are correlated with the expression of co-signaling receptors (19). We also reported that among 10 immune checkpoint receptors (ICRs), lung, liver, spleen and intestine macrophages (Mφ) and bone marrow (BM) Mφ express higher levels of CD274 (programmed cell death-1, PDL-1) than adipose tissue Mφ, presumably to counteract the M1 Mφ dominant status via its reverse signaling behavior (1), suggesting that tissue immune checkpoint receptor signaling may also modulate Tregs. We hypothesized that CTLA-4 play roles in modulating DEGs in Treg from normal tissues, non-tumor diseased tissues and tumor tissues. To test this hypothesis, we placed all the CLTA-4-induced Treg genes cells with Treg upregulated genes in the >1 log2 in the Y-axis, and anti-CTLA-4 antibody treated (CTLA-4 suppressed) genes in the >1 log2 in the X-axis (Figure 7). The argument was that if gene expressions are promoted by CTLA-4, the genes will be shown in CTLA-4 induced gene groups; otherwise, they will be shown in CTLA-4 suppressed gene group. If any genes upregulated or downregulated in normal tissue Treg, non-tumor diseased Treg and tumor Treg are not collaborated with CTLA-4 regulation, they will be placed in non-collaboration gene groups. As shown in Figure 7, we found that there were a few non CTLA-4 collaboration genes upregulated in normal tissue and non-tumor diseased tissue Treg in spleen (23 genes), VAT Treg (10 genes) and kidney Treg (11-16 genes). In contrast, tumor Treg had non CTLA-4 collaboration genes upregulated ranging from 10 genes to 50 genes, which were higher than that of normal tissue Treg and non-tumor diseased tissue Treg. In addition, we found, as shown in Figure 7E, that 13 pathways associated with CTLA-4 non-collaboration genes in Treg shared in various groups; 8 pathways associated with CTLA-4 non-collaboration genes in normal tissue Treg; 13 pathways associated with Treg from non-tumor diseased tissues, and 21 pathways associated with tumor Treg.
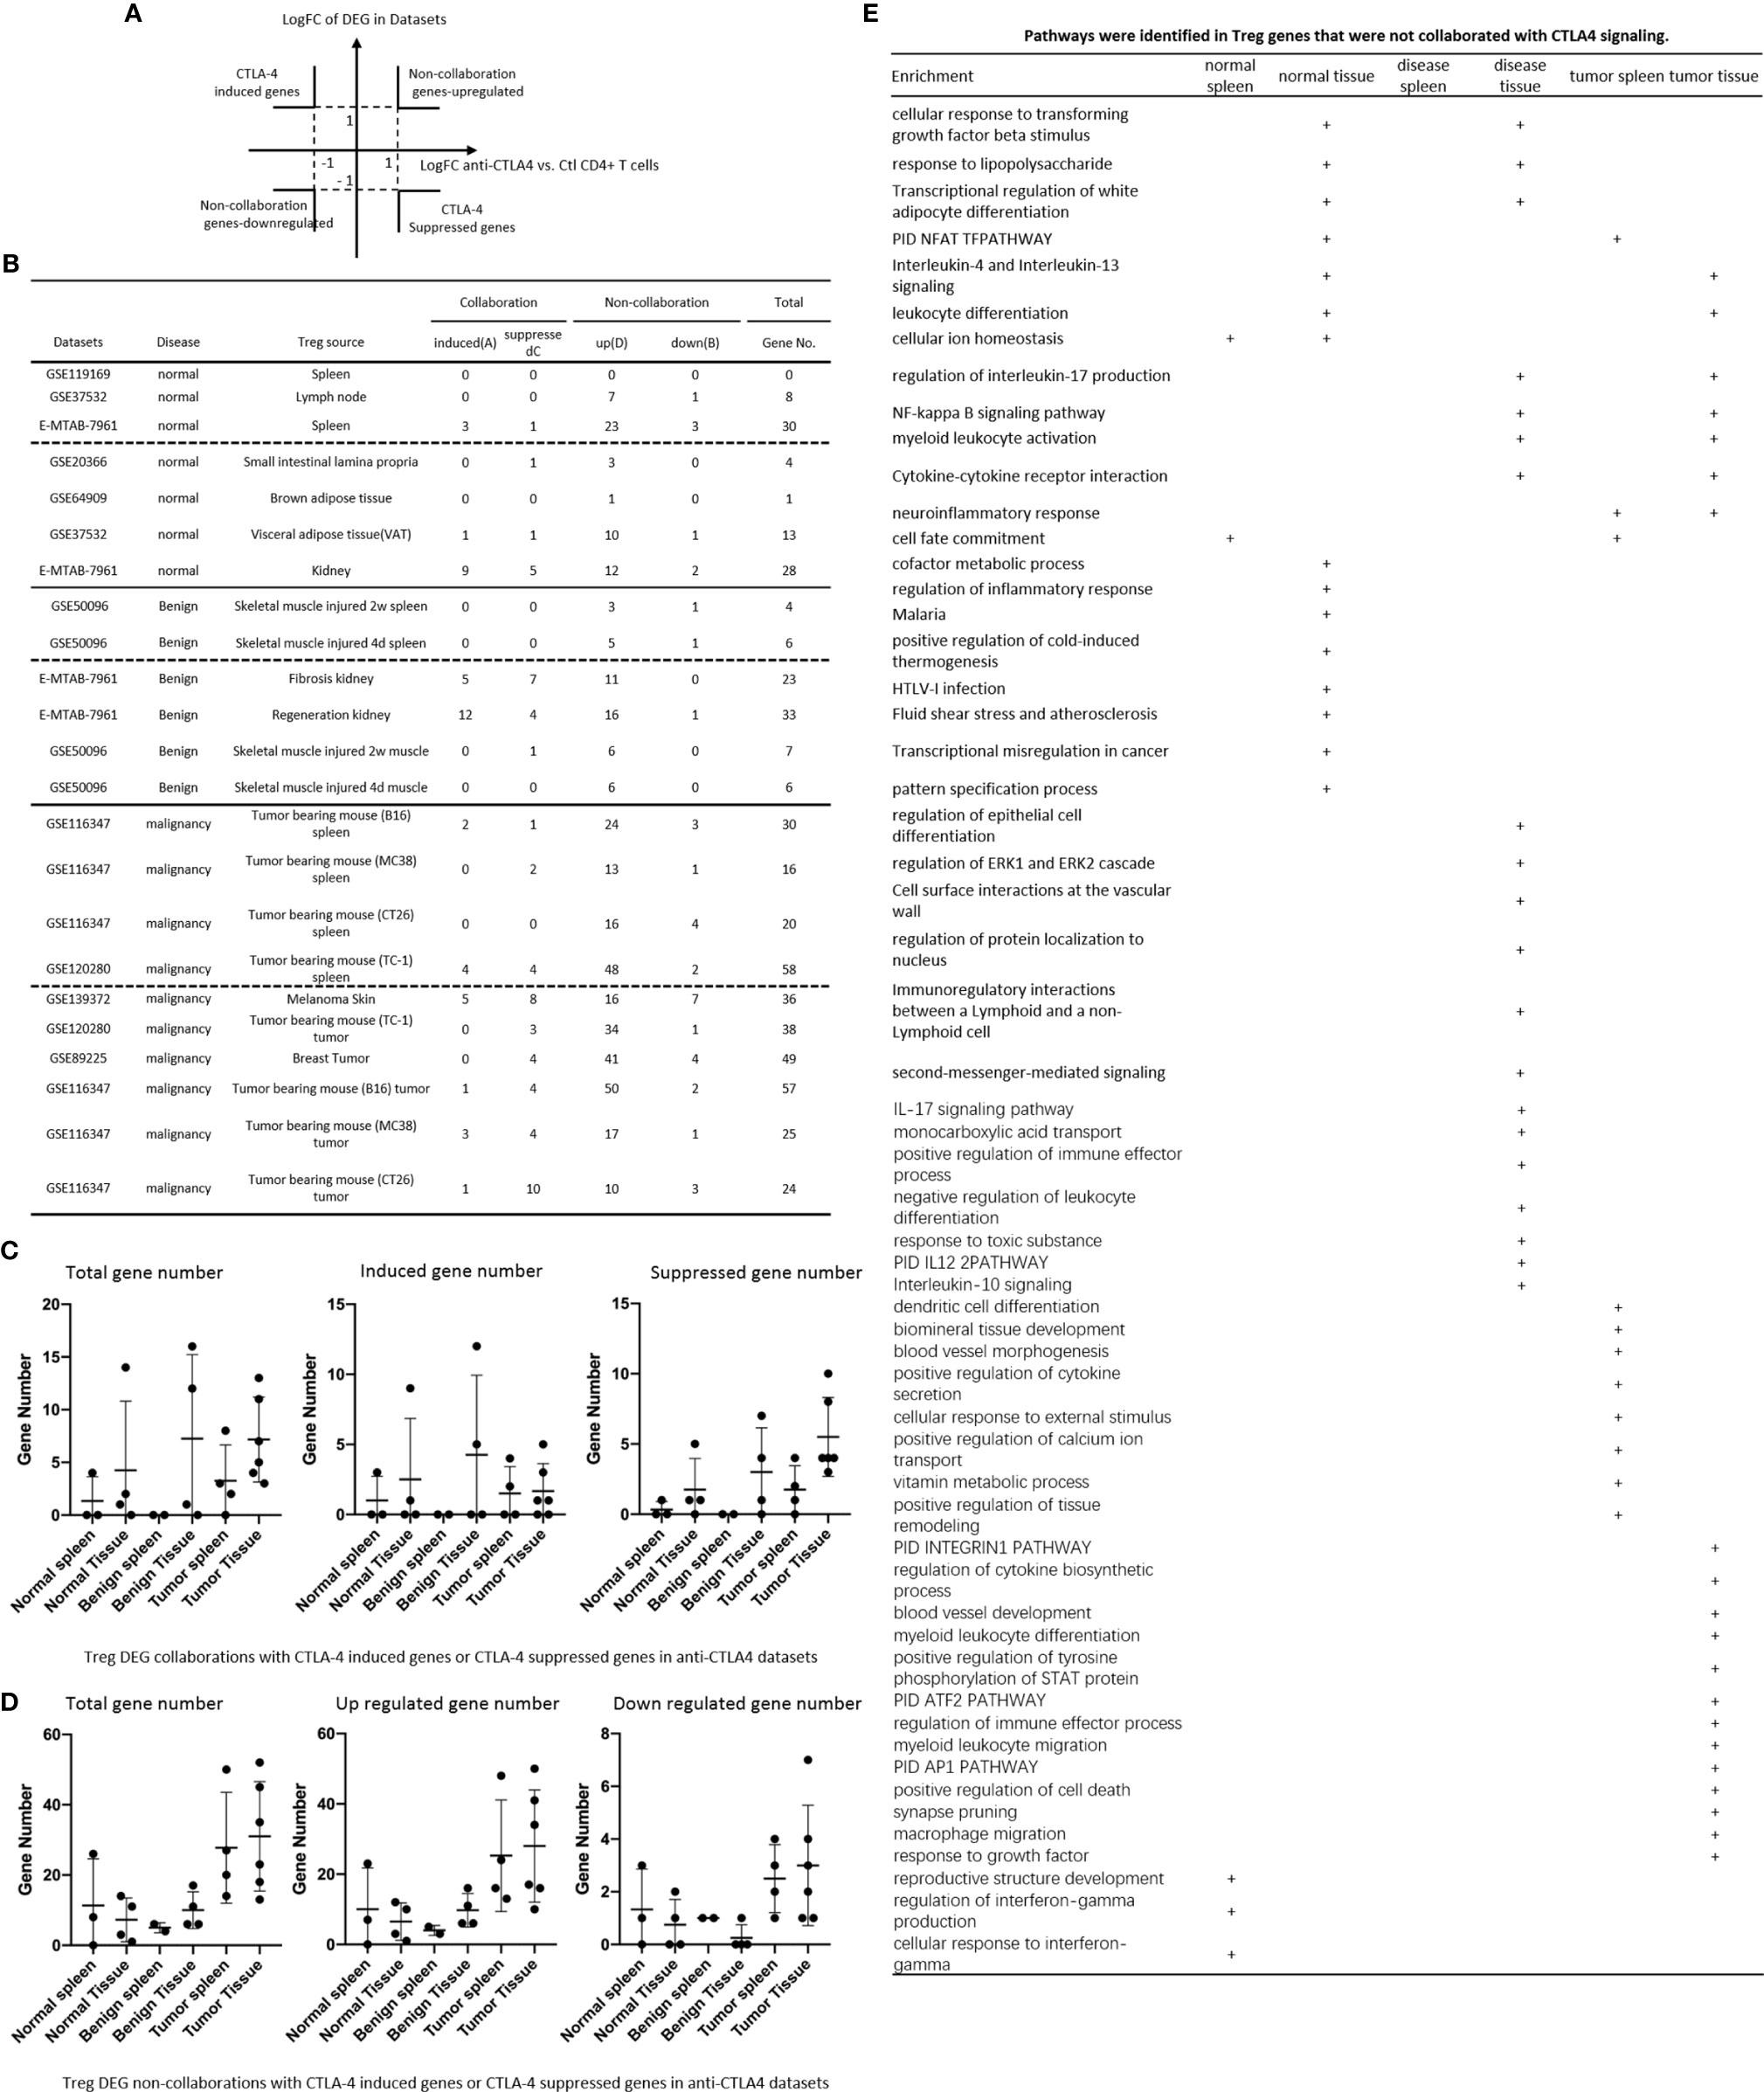
Figure 7 (A, B) All the upregulated genes and downregulated genes in tissue Treg groups were compared to anti-cytotoxic T cell antigen-4 (CTLA-4) antibody-treated Treg (CTLA-4 signaling suppressed) versus CTLA-4 signaling non-suppressed CONTROL CD4+ T cell dataset (GSE14716) to determine how many Treg genes were dependent on CTLA-4 signaling. (C) Treg DEG collaboration with CTLA-4 induced genes and CTLA-4 suppressed genes in anti-CTLA-4 datasets. (D) Treg DEG non-collaboration with CTLA-4 induced genes and CTLA-4 suppressed genes in anti-CTLA-4 datasets. (E) pathways identified in Treg genes and not collaborated with CTLA-4 signalling.
Recent report showed that non-overlapping roles of PD-1 and Foxp3 in maintaining immune tolerance, which was collaborated well with our findings (131). We hypothesized that PD-1 plays significant roles in promoting DEGs in Treg from normal tissues, non-tumor diseased tissues and tumor tissues. To test this hypothesis, we placed all the PD-1-induced Treg genes cells with Treg upregulated genes in the >1 log2 in the Y-axis, and anti-PD-1 antibody treated (PD-1 suppressed) genes in the >1 log2 in the X-axis (Figure 8A). The argument was that if gene expressions are promoted by PD-1, the genes will be shown in PD-1 induced gene groups; otherwise, they will shown in PD-1 suppressed gene group. If any genes upregulated or downregulated in tissue Treg, non-tumor diseased Treg and tumor Treg are not collaborated with PD-1 regulation, they will be placed in non-collaboration gene groups. As shown in Figure 8B, we found that there were a large numbers of PD-1 collaboration Treg genes upregulated and also significant numbers of PD-1 collaboration Treg genes downregulated in normal tissue Treg (14 – 163 genes upregulated; 3 – 48 genes downregulated). In addition, there were a large numbers of PD-1 collaboration Treg genes upregulated in non-tumor diseased tissue Treg (63-178 genes upregulated) and also significant numbers of PD-1 collaboration Treg genes downregulated (18 – 34 genes). Moreover, there were a number of PD-1 non-collaboration Treg genes upregulated in normal and non-tumor diseased tissue Treg (0 – 31 genes upregulated). Finally, there were a few numbers of PD-1 collaboration Treg genes upregulated in tumor tissue Treg (1 – 8 genes upregulated). We also found 12 pathways associated with PD-1 non-collaboration genes shared by Treg in various groups (Figure 8E); 9 pathways associated with PD-1 non-collaboration genes shared by Treg in normal tissues; 13 pathways associated with PD-1 non-collaboration genes shared by Treg in non-tumor diseased tissues; and 22 pathways with PD-1 non-collaboration genes shared by Treg in tumor tissues.
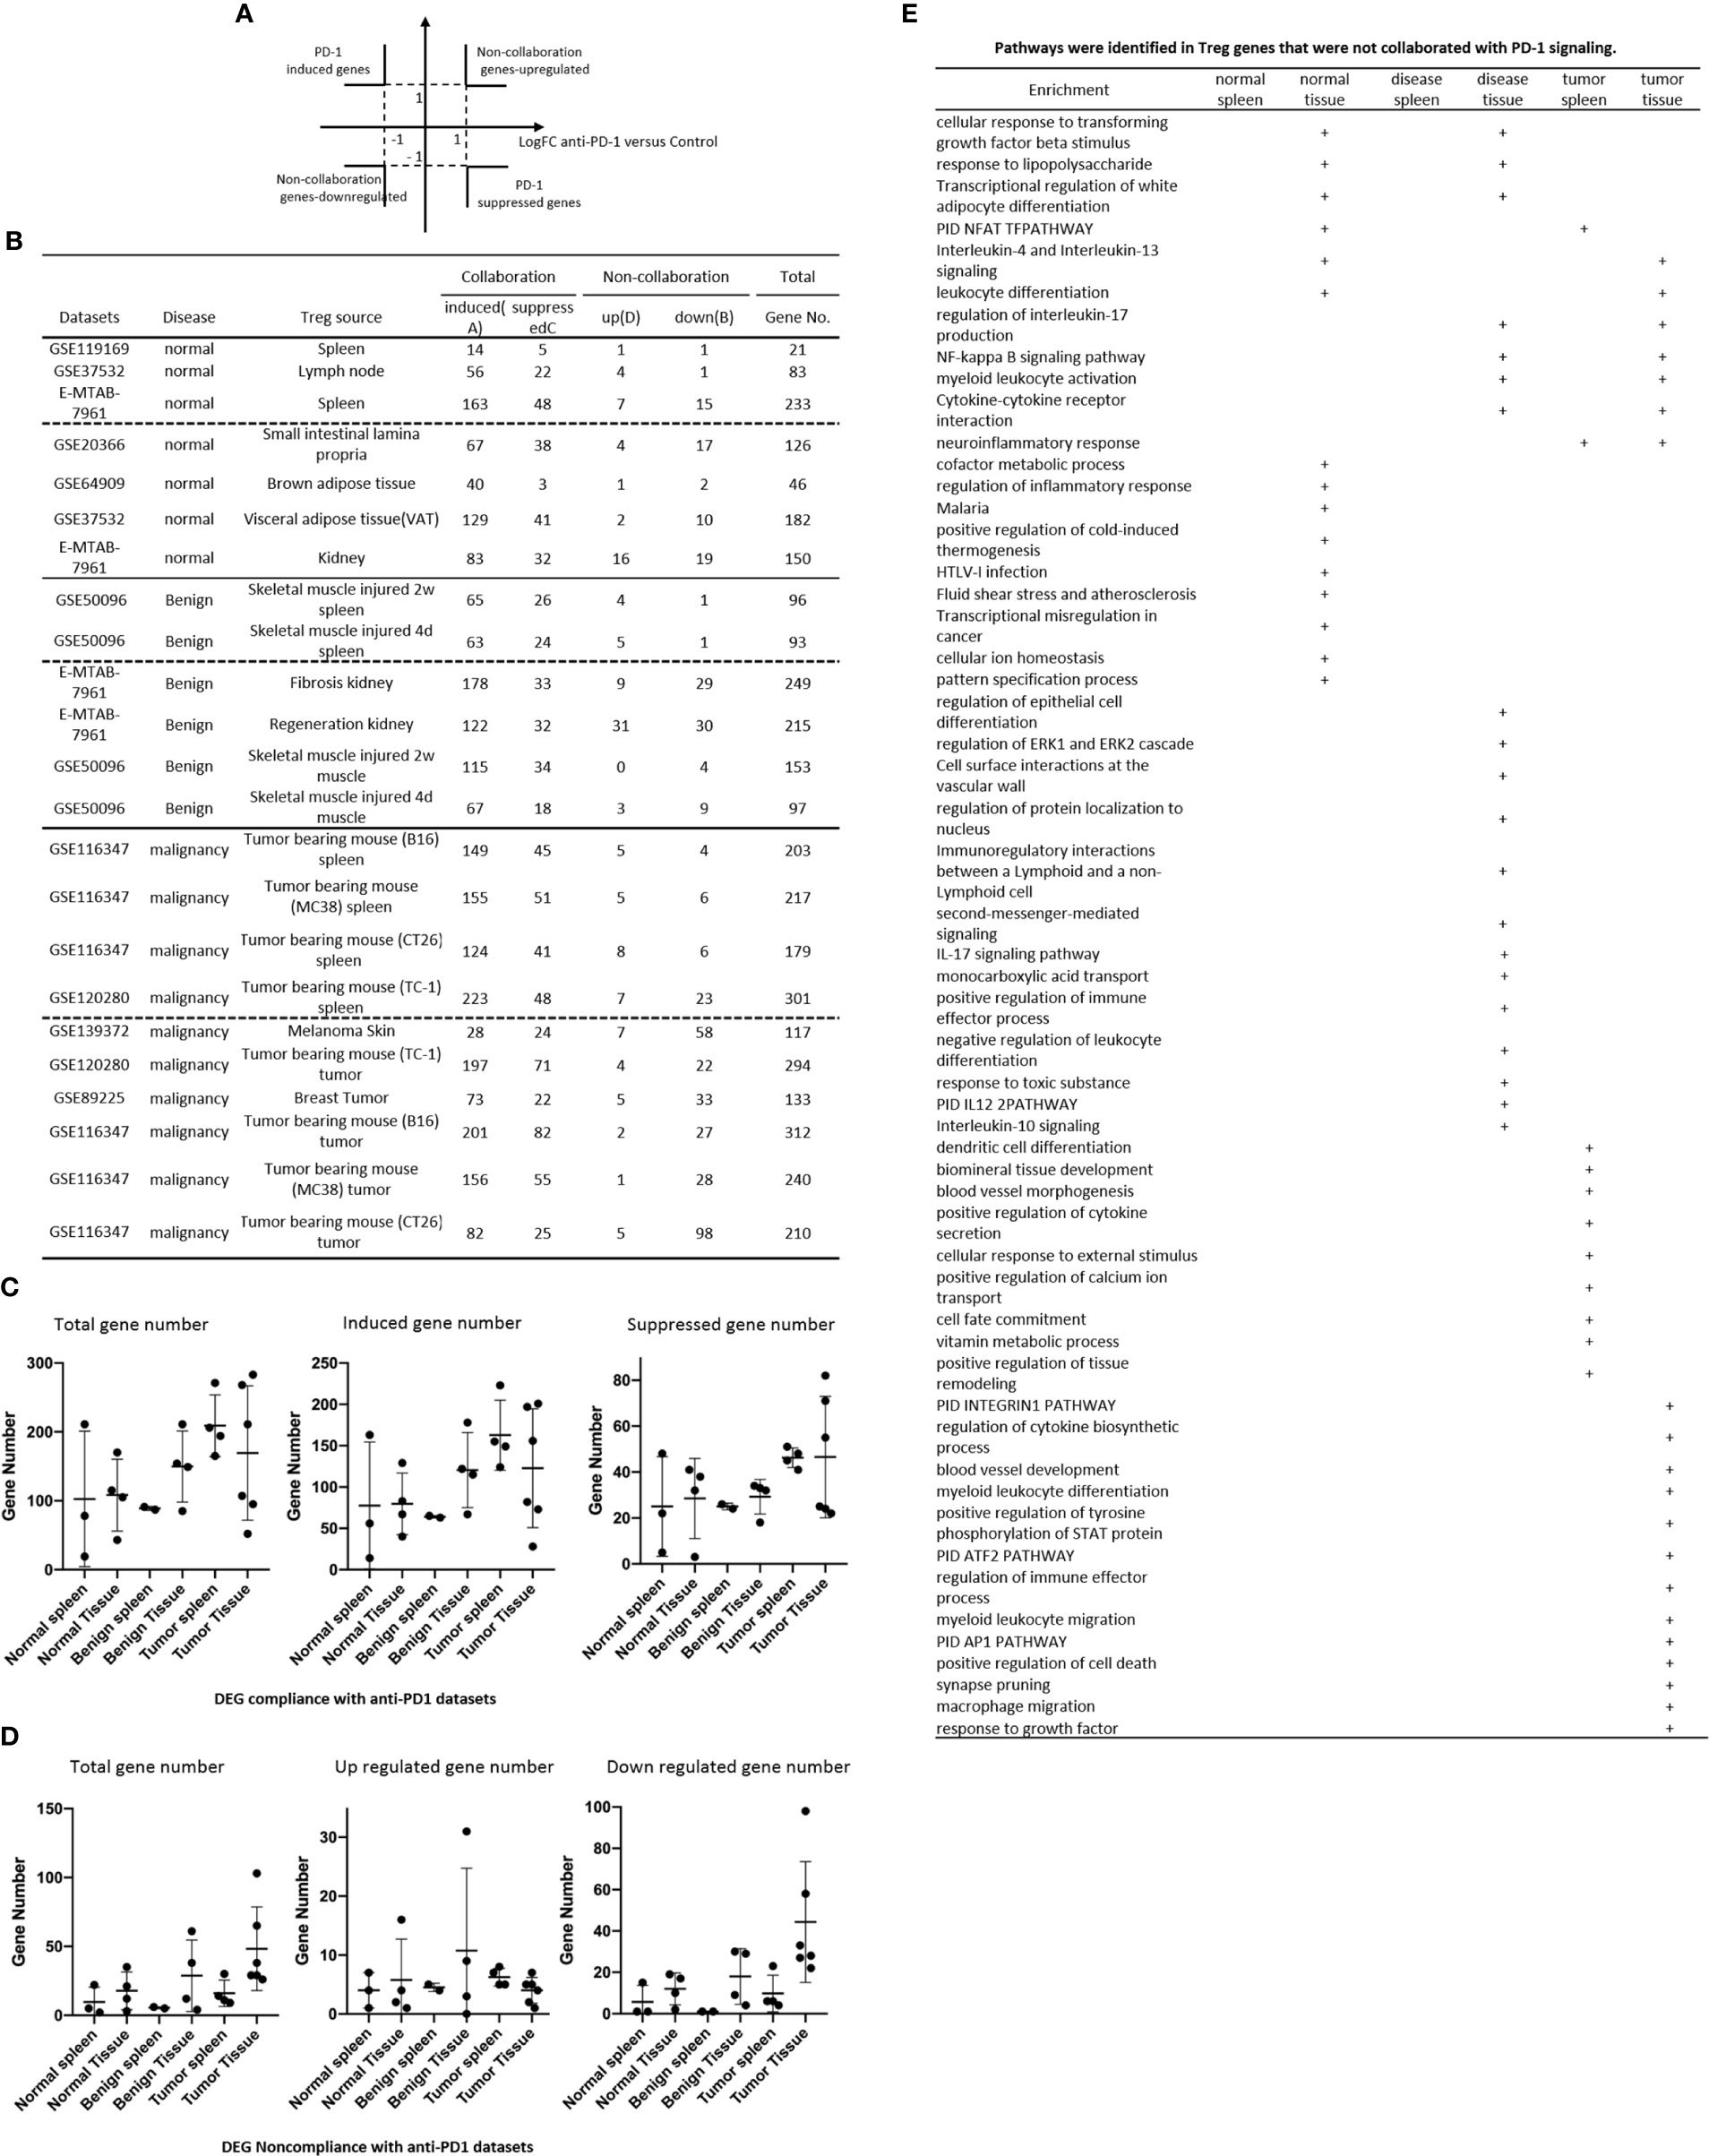
Figure 8 (A, B) All the upregulated genes and downregulated genes in tissue Treg groups were compared to anti-programmed death-1 (PD-1) antibody-treated Treg (PD-1 signaling suppressed) versus PD-1 signaling non-suppressed CONTROL CD4+ T cell dataset (GSE114300) to determine how many Treg genes were dependent on PD-1 signaling. (C) Treg DEG collaboration with PD-1 induced genes and PD-1 suppressed genes in anti-PD-1 datasets. (D) Treg DEG non-collaboration with PD-1 induced genes and PD-1 suppressed genes in anti-PD-1 datasets. (E) pathways identified in Treg genes and not collaborated with PD-1 signalling.
Our results have demonstrated that normal tissue Treg and non-tumor diseased tissue Treg have quite low CTLA-4 dependent but high PD-1 dependent transcriptomic changes, suggesting that CTLA-4 does not, but PD-1 does, play significant Foxp3-non-overlapped (131) roles in promoting Treg upregulated genes in normal and non-tumor diseased tissue Treg; and tumor spleen Treg and tumor Treg have certain transcriptomic changes in CTLA-4, and PD-1, non-collaboration manners with innate immune dominant pathways. Our results were correlated well with others reports on the effects of immune checkpoint receptors in Treg in pregnancy (132), Treg in autoimmunity (133), T cells in heart (134), and effects of immune checkpoint inhibitors on tumors (135–137).
It has been reported that while glycolysis fuels the biosynthetic and bioenergetic needs necessary for proliferation and migration of human Treg, suppressive capacity is mainly maintained by oxidative metabolism (138); that several metabolic pathways have been reported to be involved in immunometabolism (139) including glycolysis, fermentation, pentose phosphage pathway (PPP), tricarboxylic acid cycle (TCA)/mitochondrial electron transport chain (ETC), mitochondrial regulation, fatty acid metabolism, amino acid metabolism, and metabolic regulation and signaling; and that termed “trained immunity”, allows innate immune cells such as macrophages, monocytes, natural killer cells and endothelial cells (50) to shown enhanced responsiveness when they re-encounter pathogens and danger associated molecular patterns (140, 141), in which metabolic reprogrammings such as glycolysis, acetyl-CoA generation and mevalonate synthesis pathways (50, 51). We hypothesized that the expressions of immunometabolic enzyme genes can be found in Treg upregulated genes and downregulated genes in normal, non-tumor diseased and tumor tissues. To test this hypothesis, we collected 191 immunometabolic enzyme genes (50, 138, 139). As shown in Figure 9A, 0 – 7 genes, 1 – 8 genes and 2 – 25 immunometabolic enzyme genes were upregulated in normal tissue Treg, non-tumor diseased tissue Treg and tumor Treg, respectively. In addition, immunometabolic enzyme genes were downregulated more in tumor Treg than normal tissue Treg and non-tumor diseased tissue Treg (Figure 9B). When we zoomed in the expression changes of trained immunity metabolic enzyme genes in Treg, we found that, as shown in Figure 10A, trained immunity metabolic enzyme genes in Treg from fibrosis kidney (8 genes), mouse B16 tumor (21 genes) and mouse MC38 tumor (12 genes) were increased. In comparison, trained immunity metabolic enzyme genes in Treg from normal tissue Treg, non-tumor diseased tissue Treg and tumor Treg had a few genes upregulated. Once again, trained immunity metabolic enzyme genes were downregulated more in tumor Treg than normal tissue Treg and non-tumor diseased tissue Treg (Figure 10B). These results have demonstrated that the expressions of some trained immunity metabolic enzyme genes and global immunometabolic enzyme genes are downregulated in tumor Treg, suggesting that some innate immune metabolic pathways are suppressed in tumor Treg than normal tissue Treg and non-tumor diseased Treg.
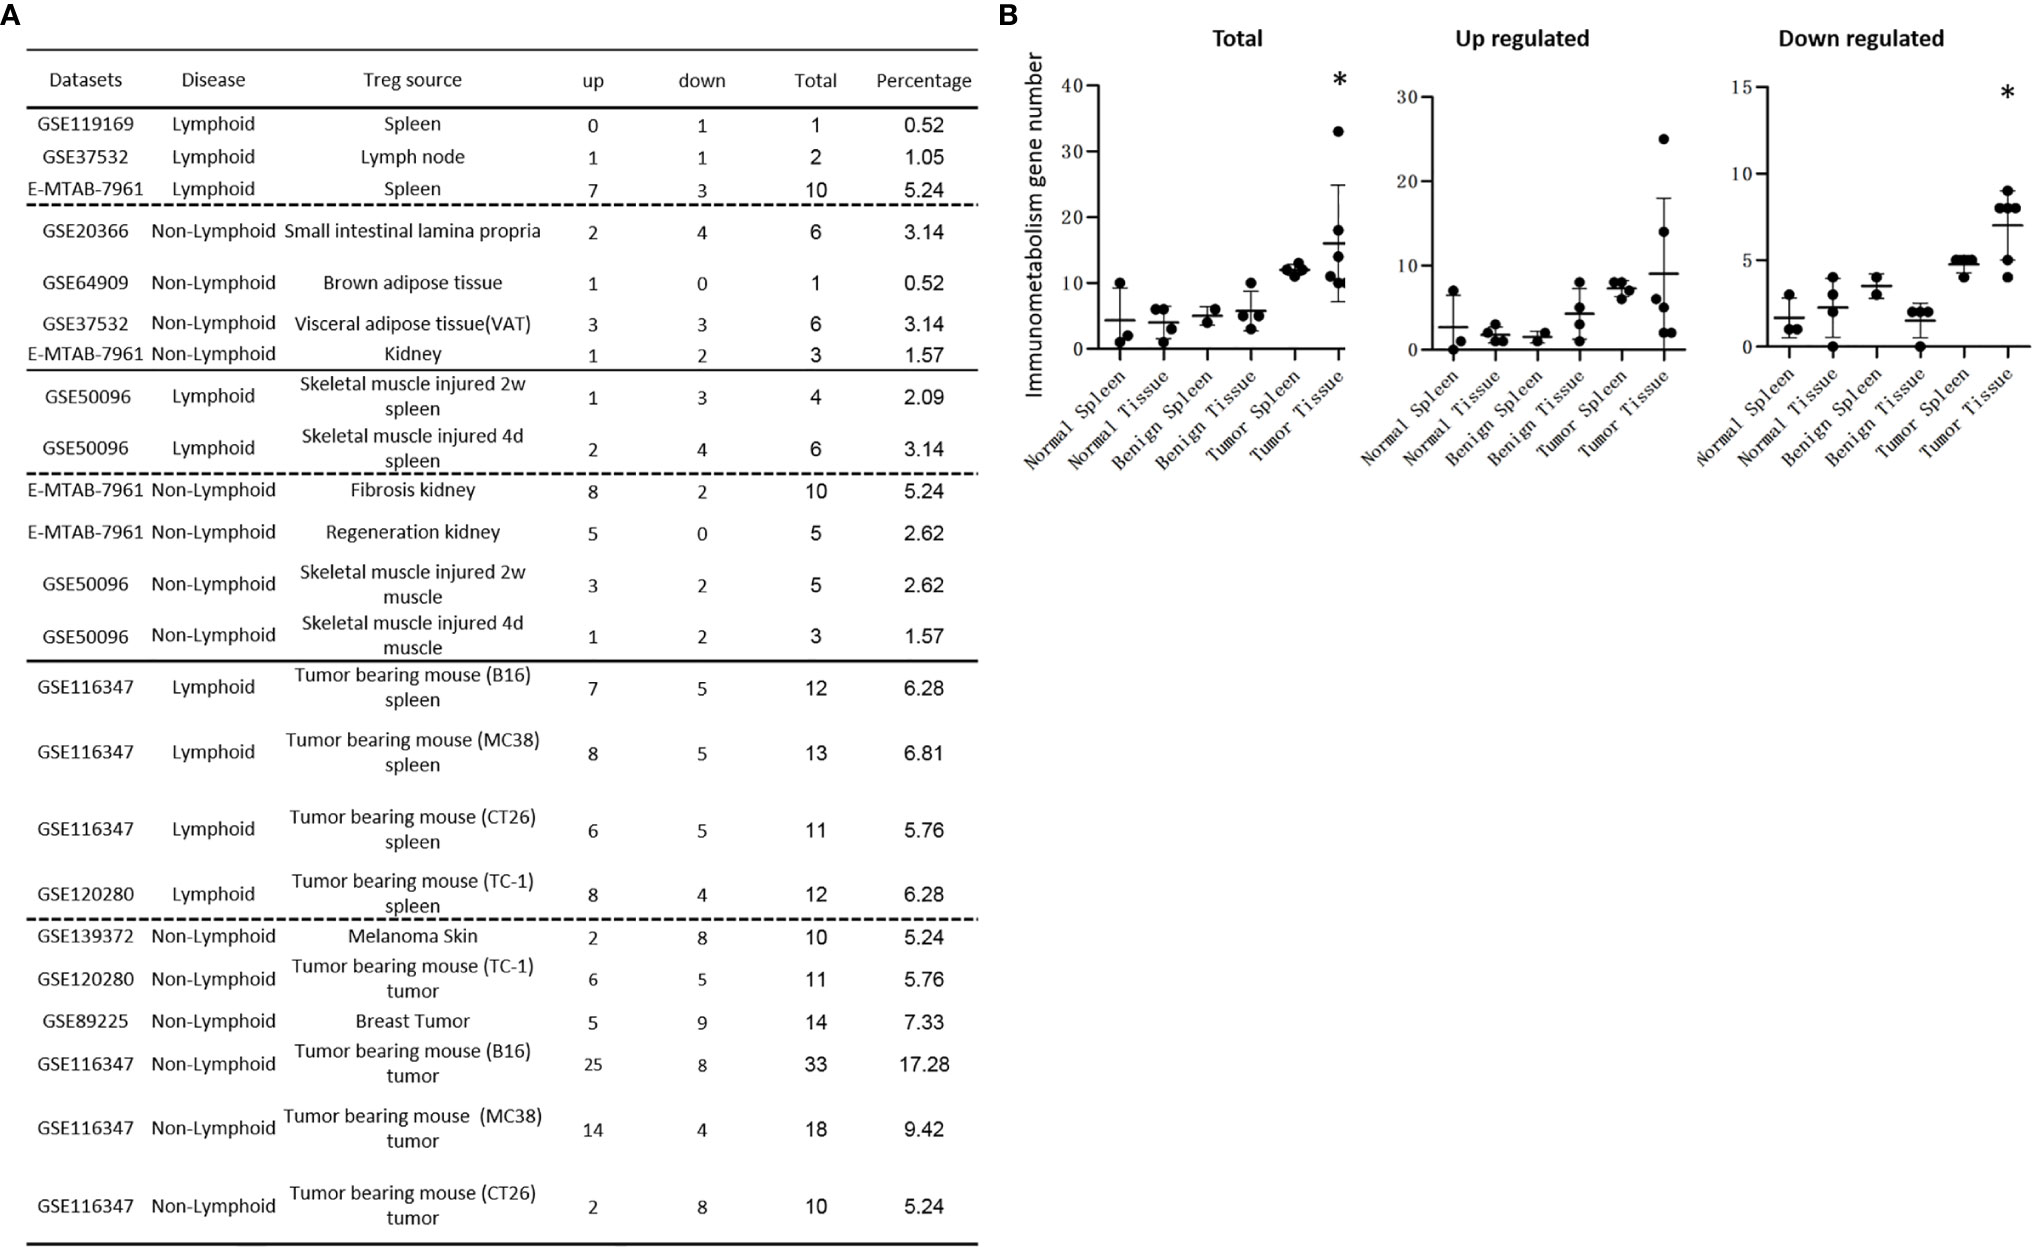
Figure 9 (A) Tumor tissue Treg groups upregulate more immunometabolism enzymes than other normal tissue Treg groups and benign disease tissue Treg groups. A total of 191 immunometabolism enzyme genes were screened in all the Treg groups. Downregulated and total immunometabolism gene numbers were more in tumor tissue Treg groups than in other Treg groups. (B) There were more differentially expressed immunometabolism enzyme genes in tumor tissue Treg groups than other Treg groups. The total regulated immunometabolism gene numbers were more in tumor tissue Treg groups than that in normal tissue Treg groups and diseased tissue Treg groups, p = 0.03. The upregulated immunometabolism gene numbers had no difference between Treg groups. The downregulated immunometabolism enzyme genes were more in tumor tissue Treg groups than other Treg groups, p < 0.05. *Significantly changed.
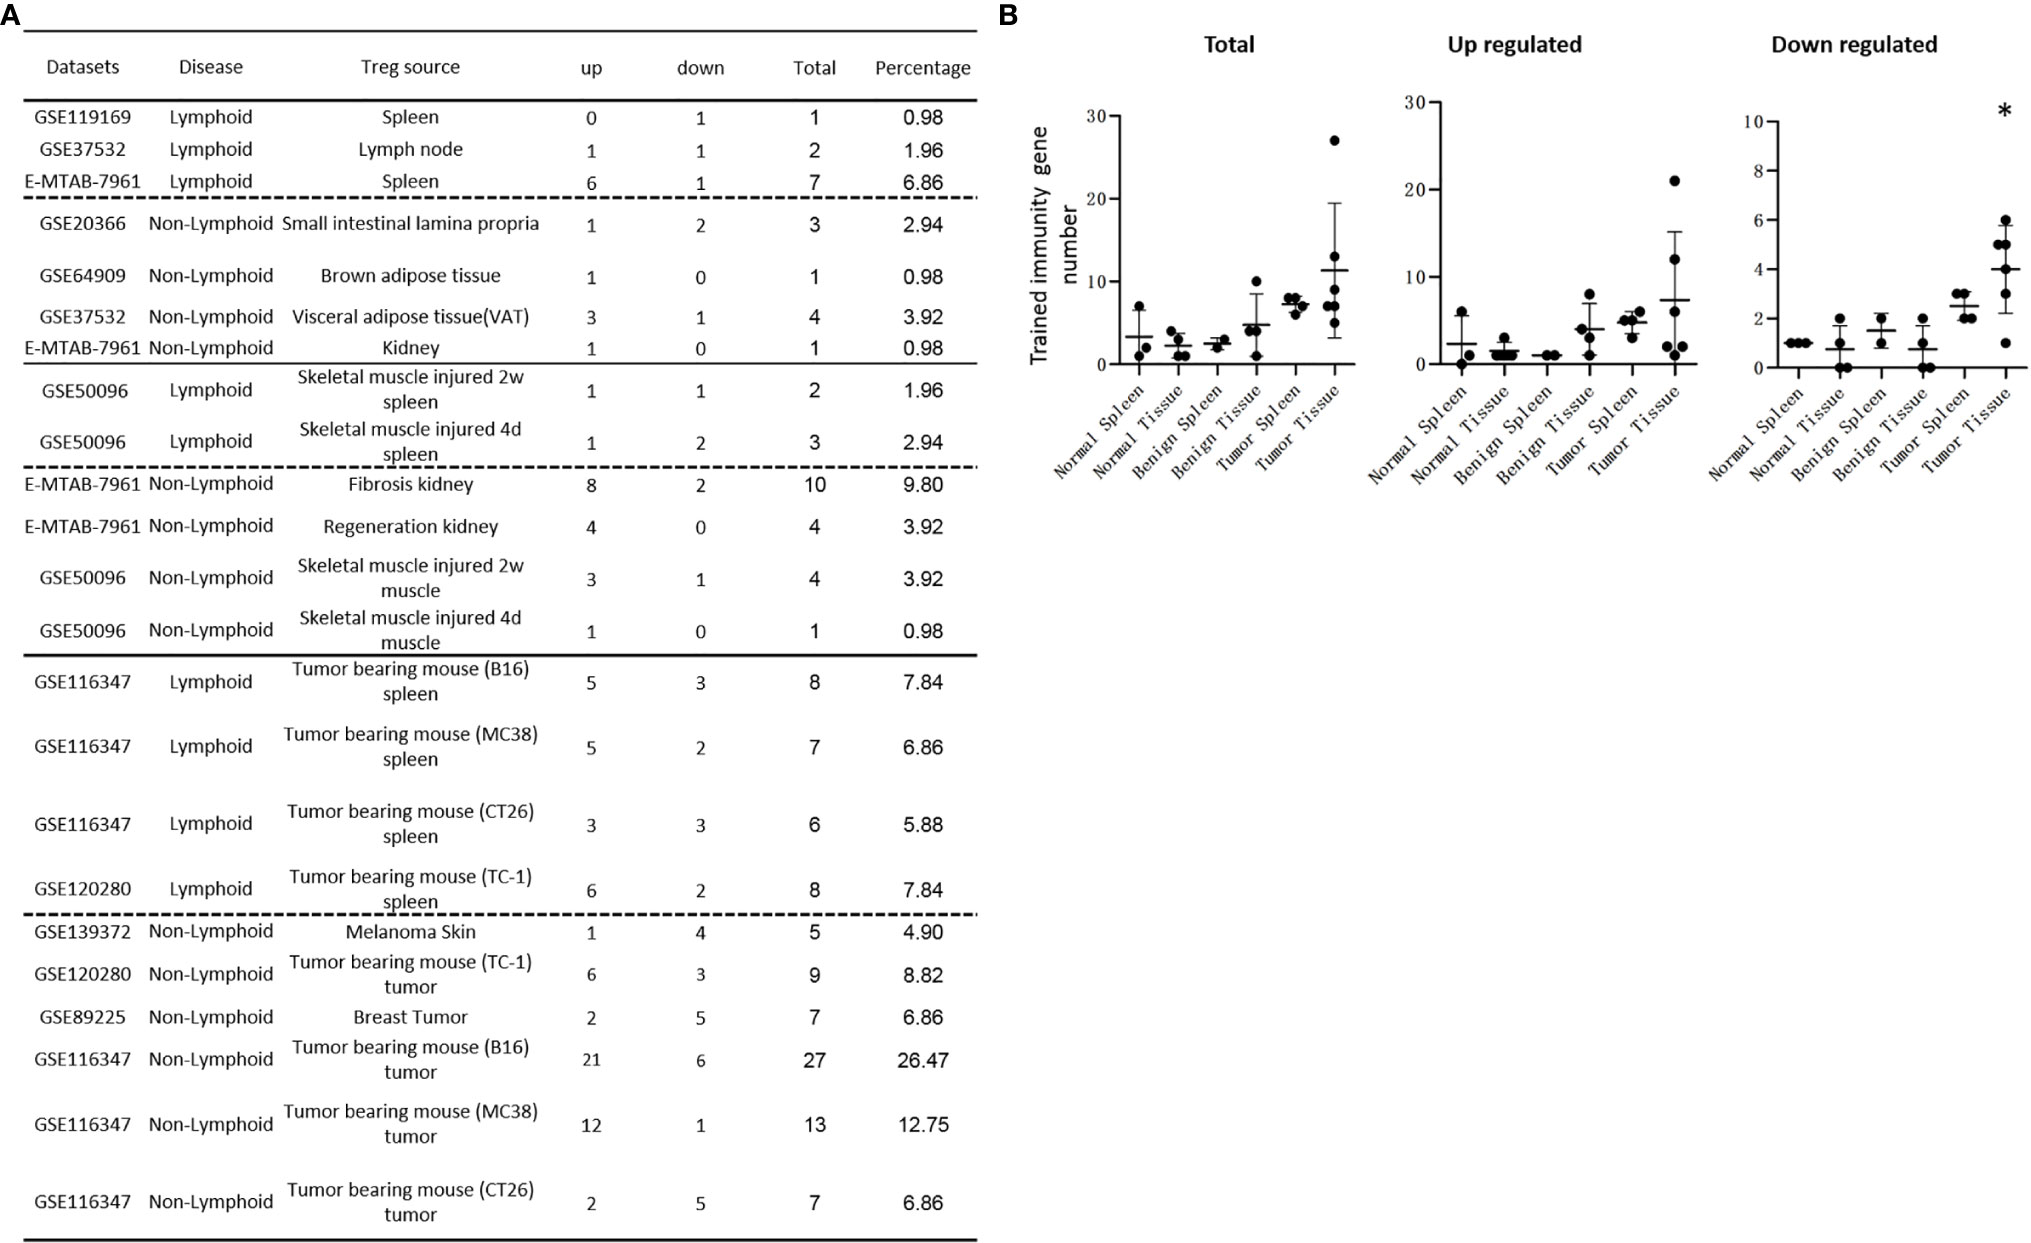
Figure 10 (A) Tumor tissue Treg groups upregulated more Trained immunity enzymes than normal tissue Treg groups and benign disease tissue Treg groups. The expressions of total of 102 trained immunity enzyme genes were screened in all the Treg groups. Upregulated Trained immunity enzyme genes in tumor spleen Treg groups were more than in the normal tissue Treg groups and benign disease tissue Treg groups. However, the differences were not statistically significant. Downregulated, and total Trained immunity enzyme genes were more in tumor tissue Treg groups than in other Treg groups. (B) There were more differentially expressed trained immunity enzyme genes in tumor tissue Treg groups than other Treg groups. The total regulated trained immunity enzyme genes were more in tumor tissue Treg groups than that in normal tissue Treg group and diseased tissue Treg groups, p = 0.06. The upregulated trained immunity gene numbers had no differences between Treg groups. The downregulated trained immunity genes in tumor tissue Treg groups were more than other Treg groups, p < 0.05.
It has been reported that DDB1- and CUL4-associated factor 1 (DCAF1, a component of E3 ubiquitin-protein ligase complex) is downregulated in aged Tregs and is critical to restrain Treg aging via ROS regulated by glutathione (GSH)-S-transferase P (GSTP1). Importantly, interfering with GSTP1 and ROS pathways re-invigorates the proliferation and function of aged Tregs (142). Another report also showed that elimination of excessive ROS by treating Treg with ROS scavengers such as N-acetyl-L-cysteine (NAC) and GSH can rejuvenate the aged Treg and reinvigorate their suppressive function (143), suggesting that DCAF-regulated ROS is the culprit underlying Treg aging and aberrant function in immune senescence and inflammaging (143). TGF-β/SRY-Box Transcription Factor 4 (SOX4) axis-mediated upregulation of ecto-nucleoside triphosphate diphosphohydrolase (NTPDase, CD39) is counteracted by ROS-driven autophagy (144). We hypothesized that ROS regulatomes are regulated in tissue Treg, non-tumor diseased tissue Treg and tumor Treg. As shown in Figure 11A, the expressions of some of 165 ROS regulatomic genes were differentially regulated in tissue Treg. The upregulations of ROS regulatomic genes were found in LN Treg (4), splenic Treg (18), intestine Treg (4), BAT Treg (0), VAT Treg (5), kidney Treg (10), injured skeletal muscle (2 weeks) splenic Treg (5), injured skeletal muscle (4 days) splenic Treg (6), fibrosis kidney Treg (18), regeneration kidney Treg (21), injured skeletal muscle (2 weeks) Treg (4), injured skeletal muscle (4 days) Treg (3), B16 splenic Treg (13), MC38 splenic Treg (16), CT26 splenic Treg (14), TC-1 splenic Treg (27), melanoma Treg (3), TC-1 tumor Treg (20), breast tumor Treg (8), B16 tumor Treg (24), MC38 tumor Treg (12) and CT26 tumor Treg (4), respectively. As shown in Figure 11B, there were no statistical differences between Treg groups in upregulated ROS regulatomic genes. However, tumor tissue Treg groups significantly downregulated some ROS regulatomic genes, which may be responsible for increased Treg suppressive functions in Treg from tumors.
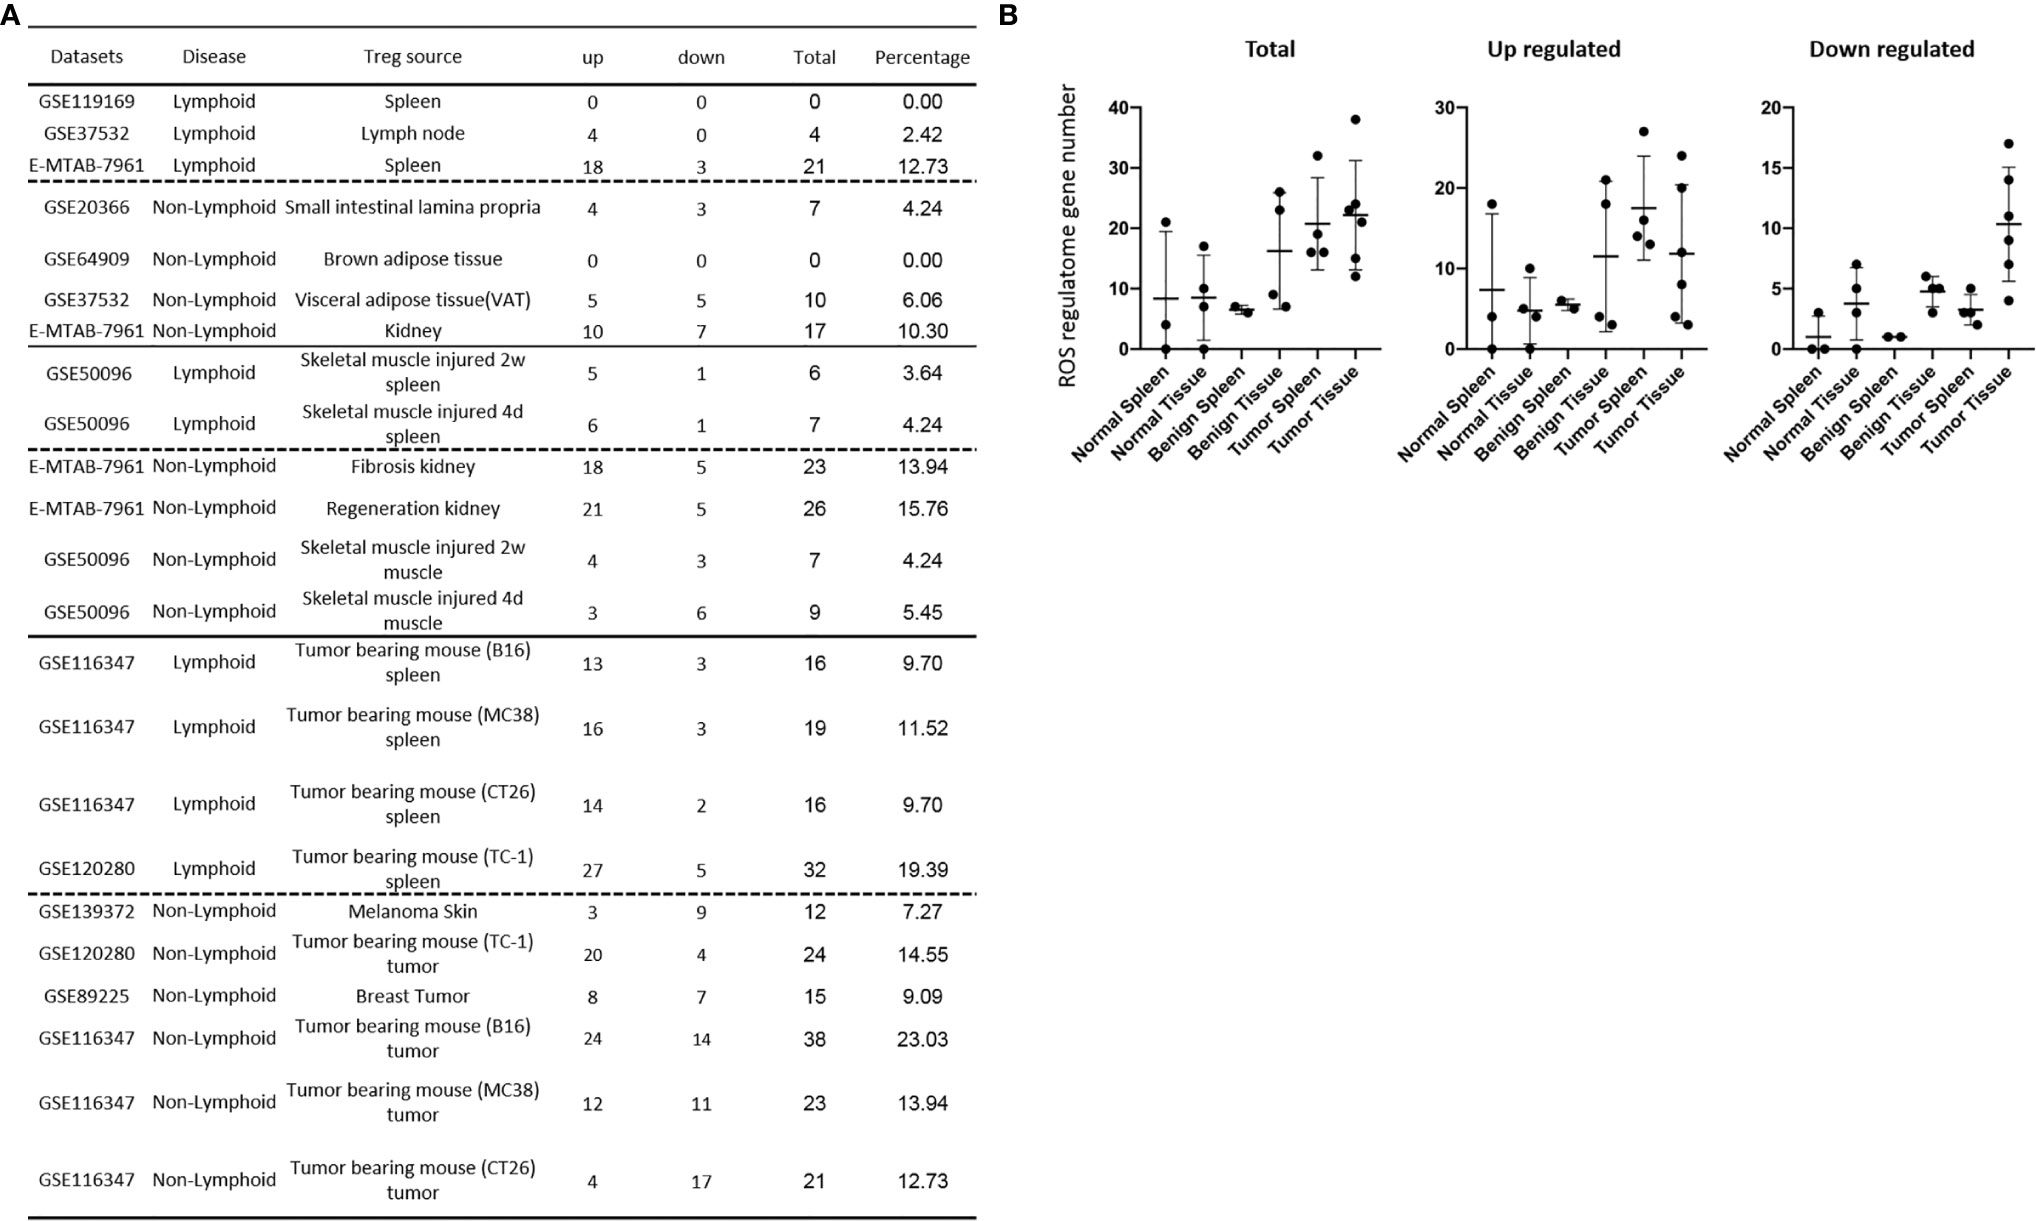
Figure 11 (A) Reactive oxygen species (ROS) regulatome DEGs in tumor tissue Treg groups were more than that in the normal tissue Treg and benign diseased tissue Treg groups. A total of 165 ROS regulatome genes (Supplementary Table 5) were screened in all the Treg groups. The upregulated ROS regulatome genes in tumor spleen Treg groups were more than that in the normal tissue Treg and benign diseased tissue Treg groups. However, the differences were not statistically significant. The downregulated ROS regulatome gene numbers were more in tumor tissue Treg groups than in other Treg groups (B) The differentially expressed ROS regultome genes in tumor tissue Treg groups were more than other Treg groups. The total regulated ROS regulatome gene numbers were more in tumor tissue Treg groups than that in normal tissue Treg groups, p = 0.16. The upregulated ROS regulatome gene numbers had no statistical differences between Treg groups. The downregulated ROS regulatome gene numbers were statistically more than other Treg groups, p < 0.05.
Recently, we proposed a new concept that ROS are an integrated sensing system for metabolic homeostasis and alarming metabolic dangers (145). Nicotinamide adenine dinucleotide phosphate (NADPH) oxidase 2 (NOX2) inhibits the suppressive ability of Tregs by limiting NF-κB and Foxp3 activation (146). Dietary extra virgin olive oil attenuates kidney injury in pristane-induced SLE model via activation of HO-1/Nuclear factor (erythroid-derived 2)-like-2 (NRF2) antioxidant pathway and suppression of JAK/STAT, NF-κB and MAPK activation (147). Epigallocatechin-3-gallate prevents lupus nephritis development in mice via enhancing the NRF2 antioxidant pathway and inhibiting NLRP3 inflammasome activation (148). We then hypothesized that ROS modulate Treg transcriptomic genes. To examine this hypothesis and identify ROS promoted genes and ROS suppressed genes, in Figure 12A, we analyzed the catalytic, membrane-bound subunit of NOX2 KO microarray dataset (GSE100671) (146) and antioxidant transcription factor NRF2 KO microarray dataset (GSE7810). As we reported recently (28), in Figure 12A, if NOX2 KO upregulated genes were co-expressed with NRF2 KO-downregulated genes, these genes were classified as ROS promoted genes. If NOX2 KO downregulated genes were co-expressed with NRF2 KO upregulated genes, those genes were classified as ROS-suppressed genes. Among 2,330 genes identified in NOX2 KO and NRF2 KO, 1384 genes were ROS promoted genes whereas 936 genes were ROS-suppressed genes, and 10 genes were ROS uncertain genes (did not follow the classification). We found that Treg in normal tissues upregulated ROS promoted genes in the range of 6 – 89 genes. Treg in non-tumor diseased tissues upregulated ROS promoted genes in the range of 22 – 108 genes. Treg in tumor tissues upregulated ROS promoted genes in the range of 33 – 99 genes. As shown in Figures 12B–D, the average numbers of upregulated ROS-promoted genes were more in Treg from benign disease tissue, Treg from tumor spleens and tumor tissues than other groups, however, the differences were not statistically significant. The average numbers of downregulated ROS-suppressed genes were more in the Treg from tumor tissues than that of Treg from other groups, p < 0.05 (Figure 12E). These results suggest that ROS-suppressed immunosuppressive genes are downregulated more in tumor Treg than Treg from other groups.
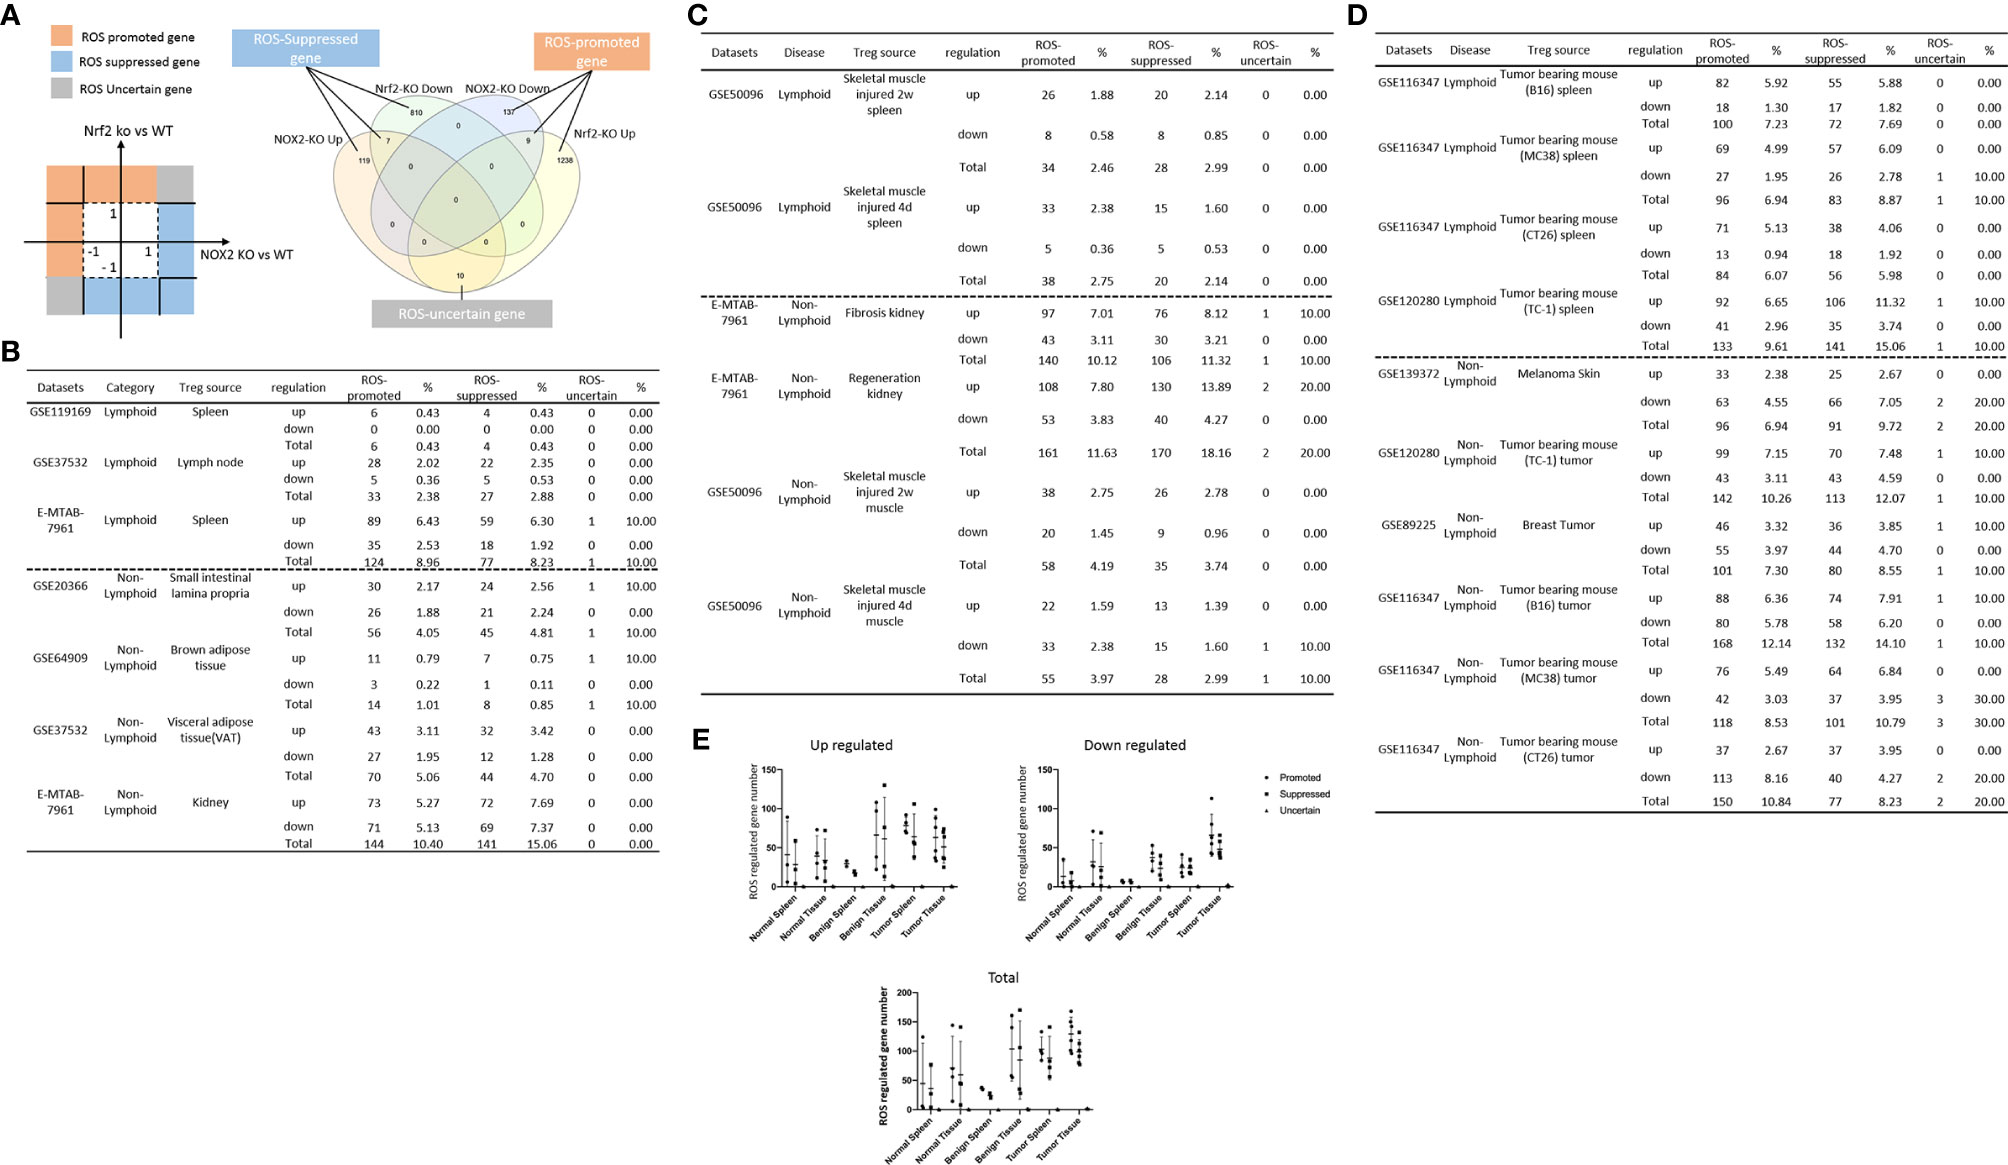
Figure 12 (A) A total of 2330 reactive oxygen species (ROS)-regulated genes were identified in the nicotinamide adenine dinucleotide phosphate (NADPH) oxidase oxidase 2 (NOX2) deficient microarray and anti-oxidant transcription factor Nuclear factor (erythroid-derived 2) factor 2 (NRF-2) deficient microarray datasets. All the ROS regulated genes were classified into 3 categories: 1) 1384 ROS-promoted genes, 2) 936 ROS suppressed gene, and 3) 10 ROS regulation-uncertain genes. All the DEGs in all the Treg groups were examined in NOX2 deficiency-regulated genes (GSE100671) and Nrf2 (GSE7810) deficiency-regulated -datasets. (B) There were no differences of ROS regulated genes between Normal spleen Treg groups and normal tissue Treg groups. (C) The benign disease tissue Treg groups had more ROS-regulated genes than the benign diseased spleen Treg groups. Both ROS-promoted genes and ROS-suppressed gene numbers in benign diseased non-lymphoid tissue Treg groups were more than that of lymphoid tissue Treg groups, p < 0.05. (D) There were no differences of ROS-regulated genes between tumor spleen Treg groups and tumor tissue Treg groups. Tumor tissue Treg groups and tumor spleen Treg groups had no significant differences in both ROS-promoted genes and ROS-suppressed genes. (E) Tumor tissue Treg groups had more downregulated reactive oxygen species (ROS)-regulated genes than other Treg groups. The average numbers of upregulated ROS promoted genes were more in the benign diseased tissue Treg groups, tumor spleen Treg groups and tumor tissue Treg groups than other Treg groups. However, the differences were not statistically significant. The average numbers of downregulated ROS-suppressed genes were more in the tumor tissue Treg groups than other Treg groups p < 0.05.
Since Treg have a great therapeutic potential for numerous diseases (149) including cardiovascular disease (150), monogenic disease (immunodysregulation polyendocrinopathy enteropathy X-linked (or IPEX) syndrome), systemic lupus erythematosus, organ-specific autoimmune diseases (type I diabetes, psoriasis, myasthenia, inflammatory bowel disease, and multiple sclerosis), transplantation, and cancers (136, 149), Treg have been under intensified investigation continuously (69) since 1995 (151). Many wonderful technological advances including single-cell RNA sequencing (152) have been made to profile lymphoid and non-lymphoid tissue Treg heterogeneity. However, some important functional issues remained poorly characterized including upregulated signaling pathways in Treg from injured tissues and regenerated tissues, tumor splenic Treg specific pathways, tumor tissue Treg’s specific pathways, Treg canonical secretome, Treg non-canonical secretomes, Foxp3 collaboration/non-collaboration transcriptomes, immune checkpoint receptors PD-1 and CTLA-4 collaboration/non-collaboration transcriptomes, and ROS regulated Treg transcriptomes. To address those issues, we performed a comprehensive transcriptomic database mining with the strategies we pioneered (7, 28, 72, 153) to compare Tregs from normal lymphoid tissues and non-lymphoid tissues to Tregs from injured tissues and regenerated tissues, tumor splenic Tregs and tumor tissue Tregs. We made the following significant findings: 1) Normal lymphoid Tregs have five specific (S-) pathways, diseased kidney Tregs have 17 S-pathways, and splenic Tregs from mouse with injured muscle have 3 S-pathways, suggesting that tissue injuries and diseases re-shape Treg transcriptomes; 2) Tumor splenic Tregs share 12 pathways with tumor Tregs; tumor splenic Tregs have 11 S-pathways; and tumor Tregs have 8 S-pathways; 3) 52 pathways are upregulated and 11 pathways are downregulated in Tregs from normal, and non-tumor disease tissues; 4) Upregulated genes in tumor Tregs are lower than that in Tregs from normal tissues, non-tumor diseased tissues, and tumor spleens; tumor Tregs are different from Tregs from normal tissues, non-tumor diseased tissues and tumor spleens in 11 new innate immune pathways; 5) Normal and non-tumor disease Tregs upregulate canonical secretomic genes (2,641) with 24 pathways, share pathways such as p38 MAPK, TLR/IL-1, and IL-6 pathways; and tumor Tregs upregulate canonical secretomic genes in 17 pathways with tumor-Treg specific manners; 6) Normal tissue Tregs and non-tumor diseased tissue Tregs upregulate 56 exosome secretomic pathways (ESP), tumor Treg ESP are enriched with vitamin-C transport and endothelin-1 signaling, and are more focused than other Treg groups; 7) Normal tissue Tregs, non-tumor diseased tissue Tregs and tumor Tregs upregulate novel innate immune caspase-1 secretomic genes and innate immune caspase-4 secretomic genes to fulfill their tissue-specific, secretomes-specific functions and shared functions. This is the first report that Treg may use canonical and innate immune non-canonical secretomes including exosomes to fulfill their immunosuppressive and tissue regeneration functions; 8) Most tissue Treg transcriptomes are controlled by Foxp3; Tumor Tregs had significantly increased Foxp3 non-collaboration genes with ROS and 17 other pathways, suggesting that ROS and 17 other pathways may promote tumor Treg in increasing Foxp3 non-collaboration genes; 9) PD-1 does, but CTLA-4 does not, play significant roles in promoting Treg upregulated genes in normal and non-tumor diseased tissue Tregs; and tumor splenic and tumor Tregs have certain CTLA-4-, and PD-1-, non-collaboration transcriptomic changes with innate immune dominant pathways; 10) Tumor Tregs downregulate more immunometabolic and trained immune metabolic enzymes genes than Tregs from other groups; and 11) ROS significantly regulate Treg transcriptomes; and ROS-suppressed genes are downregulated more in tumor Treg than Treg from other groups.
Recently, we reported that while histone deacetylase 6 (HDAC6) and follicular Th cell-specific transcription factor B-cell lymphoma 6 (Bcl6) are important regulators of Treg plasticity, Th2-specific transcription factor GATA Binding Protein 3 (GATA3) determine the fate of plastic Treg by controlling whether it will convert in to either Th1-Treg or antigen-presenting cell (APC)-Treg (16); and Treg from spleen, lymph nodes, intestine and visceral adipose tissues promote tissue repair by generating secretomes similar to that of stem cells; and sharing TFs aryl hydrocarbon receptor (AHR), ETS variant transcription factor 5 (ETV5), early growth response 1 (EGR1), and Kruppel like factor 4 (KLF4) with stem cells, and Treg canonical secretomes and transcriptomes may be regulated by 1176 cytokines, 1706 canonical secretomes, kinome (complete list of human genome-encoded 651 kinases), cell surface receptors such as the complete list of 373 clusters of differentiation (CDs), the complete list of 1496 transcription factors, and 305 cell death regulatome (87). However, several important knowledge gaps presented in the INTRODUCTION remained unknown: 1) are there differences in Treg transcriptomes between Tregs from normal lymphoid and non-lymphoid tissues, injured tissues, regenerative tissues, tissues from mouse carrying tumor, tumor tissues; 2) are secretomes generated in Tregs in various tissues and pathological conditions; and 3) how Foxp3, immune checkpoint receptors CTLA-4 and PD-1 (19), immunometabolic pathways, trained immunity metabolic reprogramming (51, 141) and ROS pathways (145) regulate tissue Treg heterogeneity and Treg various secretomes.
Based on our results, we propose a new working model. First, as shown in Figure 13, Tregs from normal lymphoid, non-lymphoid, injured muscle, fibrosis kidney, regeneration kidney, spleens from mouse with injured muscles and tumors, tumors have significant transcriptomic heterogeneity and signaling pathways; Second, in addition to immunosuppressive cytokines such as IL-10, TGF-β and IL-35, Treg may use much large secretomes such as canonical secretomes with proteins carrying signal peptide, non-canonical secretomes including caspase-1-GSDMD-dependent secretomes and innate immune caspase-4/11-GSDMD-dependent secretomes and exosome secretomes to act on target cells and Tregs themselves to maintain Treg niches for Treg heterogeneity and Treg-ness (87), fulfill immunosuppressive, tissue regeneration, tumor immunomodulatory functions; and Third, immunometabolism, innate immune memory (trained immunity) metabolic reprogramming, and ROS together with three well-characterized master regulators such as Treg transcription factor Foxp3, immune checkpoint receptors PD-1 and CTLA-4 regulate tissue transcriptomes and secretomes. Our findings have provided novel insights on tissue Treg niches for Treg heterogeneity and Treg-ness, and new therapeutic targets for immunosuppression, tissue repair, cardiovascular diseases, chronic kidney disease, autoimmune diseases, transplantation, and cancers.
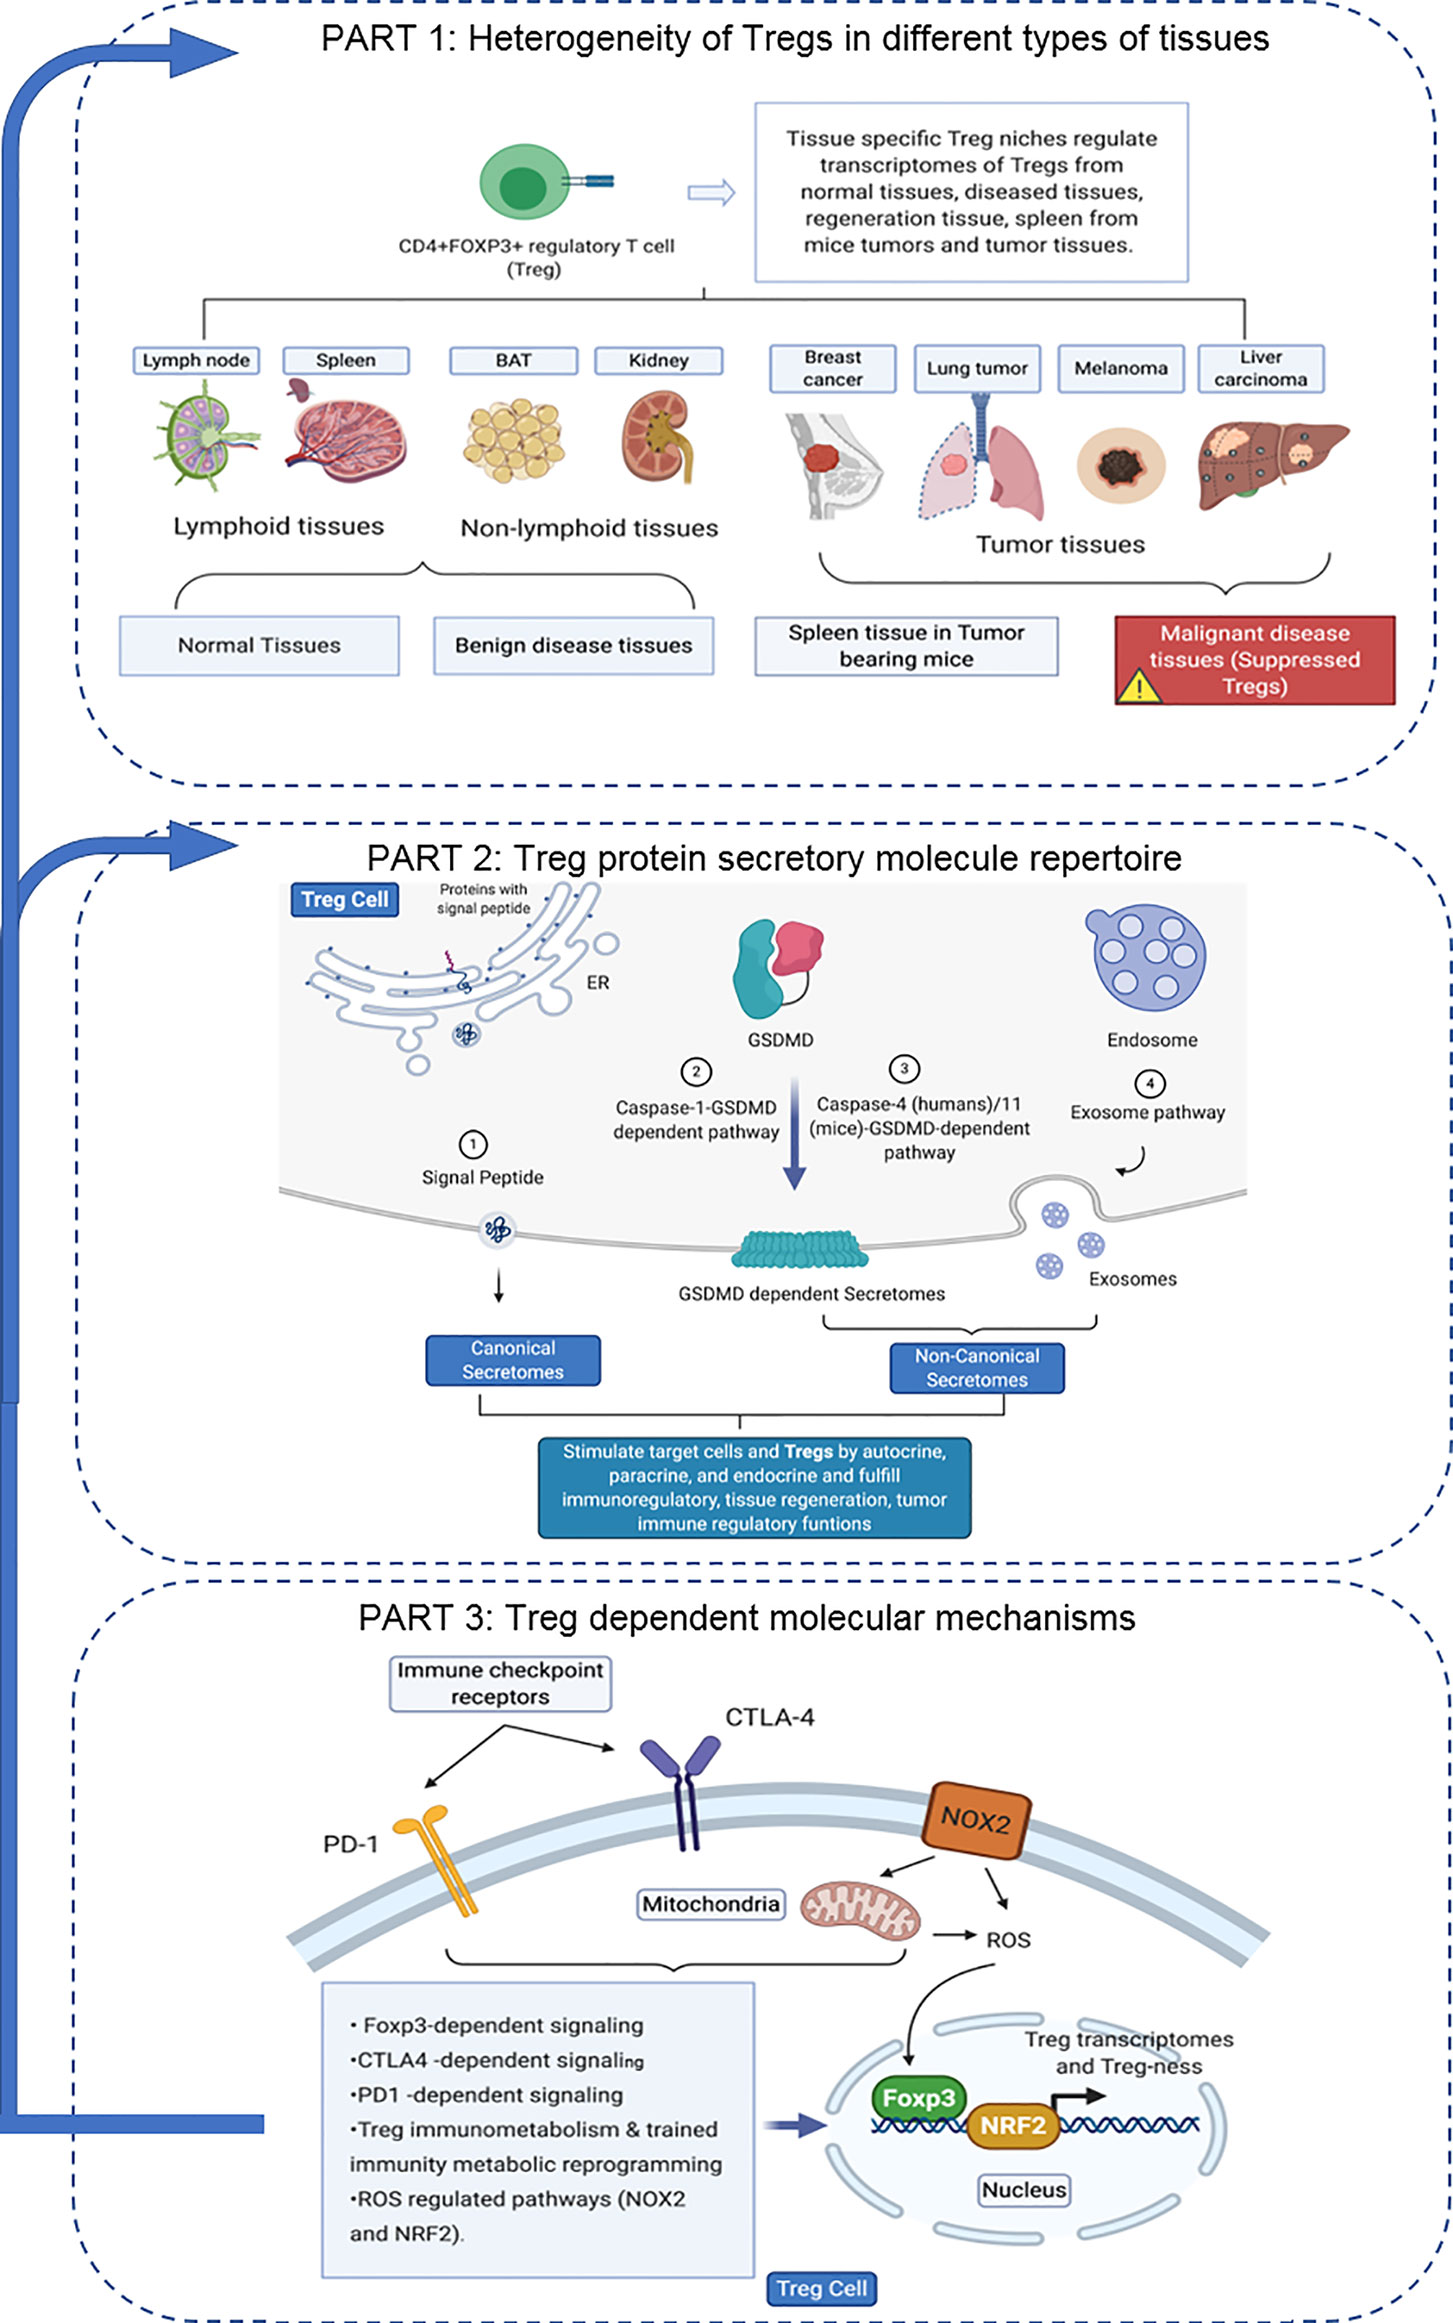
Figure 13 Canonical secretome, caspase-1-, caspase-4/11-gasdermin D non-canonical secretomes and exosomes may contribute to Treg heterogeneity, immunosuppression, tissue repair and weaken anti-tumor immune responses via ROS pathways, Foxp3, PD-1, CTLA-4, immunometabolism and trained immunity metabolic reprogramming. BAT, Brown adipose tissue; GSDMD, Gasdermin D; ER, Endoplasmic reticulum; PD-1, Programmed cell death protein 1; CTLA4, Cytotoxic T-lymphocyte-associated protein 4; ROS, Reactive oxygen species; Nox2, Nicotinamide adenine dinucleotide phosphate (NADPH) oxidase 2; Nrf2, The nuclear factor erythroid 2 (NFE2)-related factor 2; FOXP3, Forkhead box P3.
One limitation of the current study is that due to the low throughput nature of verification techniques in the laboratories, we could not verify every result we identified with the analyses of high throughput data (see Table 1 of Dr. Lai’s paper (1), and Table 10 of Dr. Zhang’s paper (28) for explanations). We acknowledge that carefully designed in-vitro and in-vivo experimental models will be needed to verify all the findings further and underlying mechanisms. Nevertheless, our findings provide novel insights on the roles of tissue Treg in controlling immune responses, and promoting tissue repair and regeneration as well as novel targets for the future therapeutic interventions for immunosuppression, cardiovascular diseases, autoimmune diseases, transplantation, cancers and tissue repair.
The original contributions presented in the study are included in the article/Supplementary Material. Further inquiries can be directed to the corresponding author.
DN carried out the data gathering, data analysis and prepared tables and figures. TT, YL, KX, YiS, FS, JS, LL, CV, YuS, WH, JL-P, JL, XJ, EC, and HW aided with analysis of the data. XY supervised the experimental design, data analysis, and manuscript writing. All authors contributed to the article and approved the submitted version.
DN was supported by the hospital fellowship.
The authors declare that the research was conducted in the absence of any commercial or financial relationships that could be construed as a potential conflict of interest.
The Supplementary Material for this article can be found online at: https://www.frontiersin.org/articles/10.3389/fimmu.2021.678201/full#supplementary-material
1. Lai B, Wang J, Fagenson A, Sun Y, Saredy J, Lu Y, et al. Twenty Novel Disease Group-Specific and 12 New Shared Macrophage Pathways in Eight Groups of 34 Diseases Including 24 Inflammatory Organ Diseases and 10 Types of Tumors. Front Immunol (2019) 10:2612. doi: 10.3389/fimmu.2019.02612
2. Wu CJ, Yang XF, McLaughlin S, Neuberg D, Canning C, Stein B, et al. Detection of a Potent Humoral Response Associated With Immune-Induced Remission of Chronic Myelogenous Leukemia. J Clin Invest (2000) 106(5):705–14. doi: 10.1172/JCI10196
3. Yang XF, Wu CJ, McLaughlin S, Chillemi A, Wang KS, Canning C, et al. CML66, a Broadly Immunogenic Tumor Antigen, Elicits a Humoral Immune Response Associated With Remission of Chronic Myelogenous Leukemia. Proc Natl Acad Sci U.S.A. (2001) 98(13):7492–7. doi: 10.1073/pnas.131590998
4. Yang XF, Wu CJ, Chen L, Alyea EP, Canning C, Kantoff P, et al. CML28 is a Broadly Immunogenic Antigen, Which is Overexpressed in Tumor Cells. Cancer Res (2002) 62(19):5517–22.
5. Yang F, Yang XF. New Concepts in Tumor Antigens: Their Significance in Future Immunotherapies for Tumors. Cell Mol Immunol (2005) 2(5):331–41.
6. Yan Y, Phan L, Yang F, Talpaz M, Yang Y, Xiong Z, et al. A Novel Mechanism of Alternative Promoter and Splicing Regulates the Epitope Generation of Tumor Antigen Cml66-L. J Immunol (2004) 172(1):651–60. doi: 10.4049/jimmunol.172.1.651
7. Ng B, Yang F, Huston DP, Yan Y, Yang Y, Xiong Z, et al. Increased Noncanonical Splicing of Autoantigen Transcripts Provides the Structural Basis for Expression of Untolerized Epitopes. J Allergy Clin Immunol (2004) 114(6):1463–70. doi: 10.1016/j.jaci.2004.09.006
8. Xiong Z, Liu E, Yan Y, Silver RT, Yang F, Chen IH, et al. An Unconventional Antigen Translated by a Novel Internal Ribosome Entry Site Elicits Antitumor Humoral Immune Reactions. J Immunol (2006) 177(7):4907–16. doi: 10.4049/jimmunol.177.7.4907
9. Ke XY, Wang J, Yang XF. [New Principles in Tumor Antigens and Their Significance in Future Immunotherapies for Lymphomas and Other Malignancies–Editorial]. Zhongguo Shi Yan Xue Ye Xue Za Zhi. (2006) 14(3):419–26.
10. Yang F, Chen IH, Xiong Z, Yan Y, Wang H, Yang XF. Model of Stimulation-Responsive Splicing and Strategies in Identification of Immunogenic Isoforms of Tumor Antigens and Autoantigens. Clin Immunol (2006) 121(2):121–33. doi: 10.1016/j.clim.2006.06.007
11. Xiong Z, Yan Y, Liu E, Silver RT, Verstovsek S, Yang F, et al. Novel Tumor Antigens Elicit Anti-Tumor Humoral Immune Reactions in a Subset of Patients With Polycythemia Vera. Clin Immunol (2007) 122(3):279–87. doi: 10.1016/j.clim.2006.10.006
12. Xiong Z, Liu E, Yan Y, Silver RT, Yang F, Chen IH, et al. A Novel Unconventional Antigen Mpd5 Elicits Anti-Tumor Humoral Immune Responses in a Subset of Patients With Polycythemia Vera. Int J Immunopathol Pharmacol (2007) 20(2):373–80. doi: 10.1177/039463200702000218
13. Wu CJ, Biernacki M, Kutok JL, Rogers S, Chen L, Yang XF, et al. Graft-Versus-Leukemia Target Antigens in Chronic Myelogenous Leukemia are Expressed on Myeloid Progenitor Cells. Clin Cancer Res (2005) 11(12):4504–11. doi: 10.1158/1078-0432.CCR-05-0036
14. Yan Y, Chen Y, Yang F, Chen IH, Xiong Z, Wang J, et al. Hla-A2.1-Restricted T Cells React to SEREX-Defined Tumor Antigen CML66L and are Suppressed by CD4+CD25+ Regulatory T Cells. Int J Immunopathol Pharmacol (2007) 20(1):75–89. doi: 10.1177/039463200702000109
15. Ke X, Wang J, Li L, Chen IH, Wang H, Yang XF. Roles of CD4+CD25(High) Foxp3+ Tregs in Lymphomas and Tumors are Complex. Front Biosci (2008) 13:3986–4001. doi: 10.2741/2986
16. Xu K, Yang WY, Nanayakkara GK, Shao Y, Yang F, Hu W, et al. Gata3, Hdac6, and Bcl6 Regulate FOXP3+ Treg Plasticity and Determine Treg Conversion Into Either Novel Antigen-Presenting Cell-Like Treg or Th1-Treg. Front Immunol (2018) 9:45. doi: 10.3389/fimmu.2018.00045
17. Yang XF. Factors Regulating Apoptosis and Homeostasis of CD4+ Cd25(High) FOXP3+ Regulatory T Cells are New Therapeutic Targets. Front Biosci (2008) 13:1472–99. doi: 10.2741/2775
18. Yang XF, Weber GF, Cantor H. A Novel Bcl-X Isoform Connected to the T Cell Receptor Regulates Apoptosis in T Cells. Immunity (1997) 7(5):629–39. doi: 10.1016/S1074-7613(00)80384-2
19. Shen H, Wu N, Nanayakkara G, Fu H, Yang Q, Yang WY, et al. Co-Signaling Receptors Regulate T-Cell Plasticity and Immune Tolerance. Front Biosci (Landmark Ed) (2019) 24:96–132. doi: 10.2741/4710
21. Zeng G, Jin L, Ying Q, Chen H, Thembinkosi MC, Yang C, et al. Regulatory T Cells in Cancer Immunotherapy: Basic Research Outcomes and Clinical Directions. Cancer Manag Res (2020) 12:10411–21. doi: 10.2147/CMAR.S265828
22. Stephan P, Lautraite R, Voisin A, Grinberg-Bleyer Y. Transcriptional Control of Regulatory T Cells in Cancer: Toward Therapeutic Targeting? Cancers (Basel) (2020) 12(11). doi: 10.3390/cancers12113194
23. Xi H, Zhang Y, Xu Y, Yang WY, Jiang X, Sha X, et al. Caspase-1 Inflammasome Activation Mediates Homocysteine-Induced Pyrop-Apoptosis in Endothelial Cells. Circ Res (2016) 118(10):1525–39. doi: 10.1161/CIRCRESAHA.116.308501
24. Yang J, Fang P, Yu D, Zhang L, Zhang D, Jiang X, et al. Chronic Kidney Disease Induces Inflammatory CD40+ Monocyte Differentiation Via Homocysteine Elevation and DNA Hypomethylation. Circ Res (2016) 119(11):1226–41. doi: 10.1161/CIRCRESAHA.116.308750
25. Ferrer LM, Monroy AM, Lopez-Pastrana J, Nanayakkara G, Cueto R, Li YF, et al. Caspase-1 Plays a Critical Role in Accelerating Chronic Kidney Disease-Promoted Neointimal Hyperplasia in the Carotid Artery. J Cardiovasc Transl Res (2016) 9(2):135–44. doi: 10.1007/s12265-016-9683-3
26. Monroy MA, Fang J, Li S, Ferrer L, Birkenbach MP, Lee IJ, et al. Chronic Kidney Disease Alters Vascular Smooth Muscle Cell Phenotype. Front Biosci (Landmark Ed) (2015) 20:784–95. doi: 10.2741/4337
27. Sun Y, Johnson C, Zhou J, Wang L, Li YF, Lu Y, et al. Uremic Toxins are Conditional Danger- or Homeostasis-Associated Molecular Patterns. Front Biosci (Landmark Ed) (2018) 23:348–87. doi: 10.2741/4595
28. Zhang R, Saredy J, Shao Y, Yao T, Liu L, Saaoud F, et al. End-Stage Renal Disease is Different From Chronic Kidney Disease in Upregulating Ros-Modulated Proinflammatory Secretome in Pbmcs - a Novel Multiple-Hit Model for Disease Progression. Redox Biol (2020) 34:101460. doi: 10.1016/j.redox.2020.101460
29. Chan MM, Yang X, Wang H, Saaoud F, Sun Y, Fong D. The Microbial Metabolite Trimethylamine N-Oxide Links Vascular Dysfunctions and the Autoimmune Disease Rheumatoid Arthritis. Nutrients (2019) 11(8). doi: 10.3390/nu11081821
30. Yin Y, Li X, Sha X, Xi H, Li YF, Shao Y, et al. Early Hyperlipidemia Promotes Endothelial Activation Via a Caspase-1-Sirtuin 1 Pathway. Arterioscler Thromb Vasc Biol (2015) 35(4):804–16. doi: 10.1161/ATVBAHA.115.305282
31. Li X, Fang P, Li Y, Kuo YM, Andrews AJ, Nanayakkara G, et al. Mitochondrial Reactive Oxygen Species Mediate Lysophosphatidylcholine-Induced Endothelial Cell Activation. Arterioscler Thromb Vasc Biol (2016) 36(6):1090–100. doi: 10.1161/ATVBAHA.115.306964
32. Fang P, Zhang D, Cheng Z, Yan C, Jiang X, Kruger WD, et al. Hyperhomocysteinemia Potentiates Hyperglycemia-Induced Inflammatory Monocyte Differentiation and Atherosclerosis. Diabetes (2014) 63(12):4275–90. doi: 10.2337/db14-0809
33. Fang P, Li X, Shan H, Saredy JJ, Cueto R, Xia J, et al. Ly6C(+) Inflammatory Monocyte Differentiation Partially Mediates Hyperhomocysteinemia-Induced Vascular Dysfunction in Type 2 Diabetic Db/Db Mice. Arterioscler Thromb Vasc Biol (2019) 39(10):2097–119. doi: 10.1161/ATVBAHA.119.313138
34. Xiong Z, Song J, Yan Y, Huang Y, Cowan A, Wang H, et al. Higher Expression of Bax in Regulatory T Cells Increases Vascular Inflammation. Front Biosci (2008) 13:7143–55. doi: 10.2741/3217
35. Xiong Z, Yan Y, Song J, Fang P, Yin Y, Yang Y, et al. Expression of TCTP Antisense in CD25(High) Regulatory T Cells Aggravates Cuff-Injured Vascular Inflammation. Atherosclerosis (2009) 203(2):401–8. doi: 10.1016/j.atherosclerosis.2008.07.041
36. Yang WY, Shao Y, Lopez-Pastrana J, Mai J, Wang H, Yang XF. Pathological Conditions Re-Shape Physiological Tregs Into Pathological Tregs. Burns Trauma (2015) 3(1). doi: 10.1186/s41038-015-0001-0
37. Sha X, Meng S, Li X, Xi H, Maddaloni M, Pascual DW, et al. Interleukin-35 Inhibits Endothelial Cell Activation by Suppressing Mapk-AP-1 Pathway. J Biol Chem (2015) 290(31):19307–18. doi: 10.1074/jbc.M115.663286
38. Shao Y, Cheng Z, Li X, Chernaya V, Wang H, Yang XF. Immunosuppressive/Anti-Inflammatory Cytokines Directly and Indirectly Inhibit Endothelial Dysfunction–a Novel Mechanism for Maintaining Vascular Function. J Hematol Oncol (2014) 7:80. doi: 10.1186/s13045-014-0080-6
39. Li X, Wang L, Fang P, Sun Y, Jiang X, Wang H, et al. Lysophospholipids Induce Innate Immune Transdifferentiation of Endothelial Cells, Resulting in Prolonged Endothelial Activation. J Biol Chem (2018) 293(28):11033–45. doi: 10.1074/jbc.RA118.002752.
40. Li A, Sun Y, Drummer CT, Lu Y, Yu D, Zhou Y, et al. Increasing Upstream Chromatin Long-Range Interactions may Favor Induction of Circular Rnas in Lysopc-Activated Human Aortic Endothelial Cells. Front Physiol (2019) 10:433. doi: 10.3389/fphys.2019.00433
41. Lopez-Pastrana J, Ferrer LM, Li YF, Xiong X, Xi H, Cueto R, et al. Inhibition of Caspase-1 Activation in Endothelial Cells Improves Angiogenesis: A Novel THERAPEUTIC POTENTIAL for ISCHEMIA. J Biol Chem (2015) 290(28):17485–94. doi: 10.1074/jbc.M115.641191
42. Fu H, Vadalia N, Xue ER, Johnson C, Wang L, Yang WY, et al. Thrombus Leukocytes Exhibit More Endothelial Cell-Specific Angiogenic Markers Than Peripheral Blood Leukocytes do in Acute Coronary Syndrome Patients, Suggesting a Possibility of Trans-Differentiation: A Comprehensive Database Mining Study. J Hematol Oncol (2017) 10(1):74. doi: 10.1186/s13045-017-0440-0
43. Li YF, Huang X, Li X, Gong R, Yin Y, Nelson J, et al. Caspase-1 Mediates Hyperlipidemia-Weakened Progenitor Cell Vessel Repair. Front Biosci (Landmark Ed) (2016) 21:178–91. doi: 10.2741/4383
44. Li X, Shao Y, Sha X, Fang P, Kuo YM, Andrews AJ, et al. Il-35 (Interleukin-35) Suppresses Endothelial Cell Activation by Inhibiting Mitochondrial Reactive Oxygen Species-Mediated Site-Specific Acetylation of H3K14 (Histone 3 Lysine 14). Arterioscler Thromb Vasc Biol (2018) 38(3):599–609. doi: 10.1161/ATVBAHA.117.310626
45. Li X, Fang P, Sun Y, Shao Y, Yang WY, Jiang X, et al. Anti-Inflammatory Cytokines Il-35 and IL-10 Block Atherogenic Lysophosphatidylcholine-Induced, Mitochondrial Ros-Mediated Innate Immune Activation, But Spare Innate Immune Memory Signature in Endothelial Cells. Redox Biol (2020) 28:101373. doi: 10.1016/j.redox.2019.101373
46. Zhang CE, Wei W, Liu YH, Peng JH, Tian Q, Liu GP, et al. Hyperhomocysteinemia Increases Beta-Amyloid by Enhancing Expression of Gamma-Secretase and Phosphorylation of Amyloid Precursor Protein in Rat Brain. Am J Pathol (2009) 174(4):1481–91. doi: 10.2353/ajpath.2009.081036
47. Zhang D, Fang P, Jiang X, Nelson J, Moore JK, Kruger WD, et al. Severe Hyperhomocysteinemia Promotes Bone Marrow-Derived and Resident Inflammatory Monocyte Differentiation and Atherosclerosis in Ldlr/CBS-Deficient Mice. Circ Res (2012) 111(1):37–49. doi: 10.1161/CIRCRESAHA.112.269472
48. Nelson J, Wu Y, Jiang X, Berretta R, Houser S, Choi E, et al. Hyperhomocysteinemia Suppresses Bone Marrow Cd34+/Vegf Receptor 2+ Cells and Inhibits Progenitor Cell Mobilization and Homing to Injured Vasculature-a Role of Beta1-Integrin in Progenitor Cell Migration and Adhesion. FASEB J Off Publ Fed Am Societies Exp Biol (2015) 29(7):3085–99. doi: 10.1096/fj.14-267989
49. Shao Y, Chernaya V, Johnson C, Yang WY, Cueto R, Sha X, et al. Metabolic Diseases Downregulate the Majority of Histone Modification Enzymes, Making a Few Upregulated Enzymes Novel Therapeutic Targets-”Sand Out and Gold Stays”. J Cardiovasc Trans Res (2016) 9(1):49–66. doi: 10.1007/s12265-015-9664-y
50. Lu Y, Sun Y, Drummer CT, Nanayakkara GK, Shao Y, Saaoud F, et al. Increased Acetylation of H3K14 in the Genomic Regions That Encode Trained Immunity Enzymes in Lysophosphatidylcholine-Activated Human Aortic Endothelial Cells - Novel Qualification Markers for Chronic Disease Risk Factors and Conditional Damps. Redox Biol (2019) 24:101221. doi: 10.1016/j.redox.2019.101221
51. Zhong C, Yang X, Feng Y, Yu J. Trained Immunity: An Underlying Driver of Inflammatory Atherosclerosis. Front Immunol (2020) 11:284. doi: 10.3389/fimmu.2020.00284
52. Virtue A, Johnson C, Lopez-Pastrana J, Shao Y, Fu H, Li X, et al. Microrna-155 Deficiency Leads to Decreased Atherosclerosis, Increased White Adipose Tissue Obesity, and non-Alcoholic Fatty Liver Disease: A Novel MOUSE MODEL of OBESITY Paradox. J Biol Chem (2017) 292(4):1267–87. doi: 10.1074/jbc.M116.739839
53. Virtue A, Wang H, Yang XF. Micrornas and Toll-Like Receptor/Interleukin-1 Receptor Signaling. J Hematol Oncol (2012) 5:66. doi: 10.1186/1756-8722-5-66
54. Johnson C, Drummer CT, Virtue A, Gao T, Wu S, Hernandez M, et al. Increased Expression of Resistin in Microrna-155-Deficient White Adipose Tissues may be a Possible Driver of Metabolically Healthy Obesity Transition to Classical Obesity. Front Physiol (2018) 9:1297. doi: 10.3389/fphys.2018.01297
55. Wolf D, Gerhardt T, Winkels H, Michel NA, Pramod AB, Ghosheh Y, et al. Pathogenic Autoimmunity in Atherosclerosis Evolves From Initially Protective Apolipoprotein B100-Reactive Cd4(+) T-Regulatory Cells. Circulation (2020) 142(13):1279–93. doi: 10.1161/CIRCULATIONAHA.119.042863
56. Zhuang R, Feinberg MW. Regulatory T Cells in Ischemic Cardiovascular Injury and Repair. J Mol Cell Cardiol (2020) 147:1–11. doi: 10.1016/j.yjmcc.2020.08.004
57. Fung THW, Yang KY, Lui KO. An Emerging Role of Regulatory T-Cells in Cardiovascular Repair and Regeneration. Theranostics (2020) 10(20):8924–38. doi: 10.7150/thno.47118
58. Webb LMC, Linterman MA. Signals That Drive T Follicular Helper Cell Formation. Immunology (2017) 152(2):185–94. doi: 10.1111/imm.12778
59. Gowthaman U, Chen JS, Zhang B, Flynn WF, Lu Y, Song W, et al. Identification of a T Follicular Helper Cell Subset That Drives Anaphylactic Ige. Science (2019) 365(6456). doi: 10.1126/science.aaw6433
60. DuPage M, Bluestone JA. Harnessing the Plasticity of CD4(+) T Cells to Treat Immune-Mediated Disease. Nat Rev Immunol (2016) 16(3):149–63. doi: 10.1038/nri.2015.18
61. Pawankar R, Hayashi M, Yamanishi S, Igarashi T. The Paradigm of Cytokine Networks in Allergic Airway Inflammation. Curr Opin Allergy Clin Immunol (2015) 15(1):41–8. doi: 10.1097/ACI.0000000000000129
62. Takeuchi A, Saito T. Cd4 CTL, a Cytotoxic Subset of CD4+ T Cells, Their Differentiation and Function. Front Immunol (2017) 8:194. doi: 10.3389/fimmu.2017.00194
63. Farber DL. Form and Function for T Cells in Health and Disease. Nat Rev Immunol (2020) 20(2):83–4. doi: 10.1038/s41577-019-0267-8
64. Saigusa R, Winkels H, Ley K. T Cell Subsets and Functions in Atherosclerosis. Nat Rev Cardiol (2020) 17(7):387–401. doi: 10.1038/s41569-020-0352-5
65. Brakch N, Yang XF, Crine P, Cohen P, Boileau G. Predominant Basolateral Proteolytic Processing of Prosomatostatin Into Somatostatin-28 in Polarized Llc-PK1 Cells. Neuropeptides (1997) 31(5):393–8. doi: 10.1016/S0143-4179(97)90030-5
66. Yang Y, Yang F, Xiong Z, Yan Y, Wang X, Nishino M, et al. An N-Terminal Region of Translationally Controlled Tumor Protein is Required for its Antiapoptotic Activity. Oncogene (2005) 24(30):4778–88. doi: 10.1038/sj.onc.1208666
67. Yang XF, Fang P, Meng S, Jan M, Xiong X, Yin Y, et al. The FOX Transcription Factors Regulate Vascular Pathology, Diabetes and Tregs. Front Biosci (Schol Ed) (2009) 1:420–36. doi: 10.2741/s35
68. Yang XF, Fang P, Meng S, Jan M, Xiong X, Yin Y, et al. The Forkhead Transcription Factors Play Important Roles in Vascular Pathology and Immunology. Adv Exp Med Biol (2009) 665:90–105. doi: 10.1007/978-1-4419-1599-3_7
69. Yang XF, Yin Y, Wang H. Vascular Inflammation and Atherogenesis are Activated Via Receptors for Pamps and Suppressed by Regulatory T Cells. Drug Discovery Today Ther Strateg (2008) 5(2):125–42. doi: 10.1016/j.ddstr.2008.11.003
70. Yan Y, Xiong Z, Zhang S, Song J, Huang Y, Thornton AM, et al. Cd25high T Cells With a Prolonged Survival Inhibit Development of Diabetes. Int J Immunopathol Pharmacol (2008) 21(4):767–80. doi: 10.1177/039463200802100401
71. Li X, Fang P, Yang WY, Wang H, Yang X. Il-35, as a Newly Proposed Homeostasis-Associated Molecular Pattern, Plays Three Major Functions Including Anti-Inflammatory Initiator, Effector, and Blocker in Cardiovascular Diseases. Cytokine (2017) 122:154076. doi: 10.1016/j.cyto.2017.06.003
72. Li X, Mai J, Virtue A, Yin Y, Gong R, Sha X, et al. Il-35 is a Novel Responsive Anti-Inflammatory Cytokine–a New System of Categorizing Anti-Inflammatory Cytokines. PloS One (2012) 7(3):e33628. doi: 10.1371/journal.pone.0033628
73. Fu H, Sun Y, Shao Y, Saredy J, Cueto R, Liu L, et al. Interleukin 35 Delays Hindlimb Ischemia-Induced Angiogenesis Through Regulating ROS-Extracellular Matrix But Spares Later Regenerative Angiogenesis. Front Immunol (2020) 11:595813. doi: 10.3389/fimmu.2020.595813
74. Lopez-Pastrana J, Shao Y, Chernaya V, Wang H, Yang XF. Epigenetic Enzymes are the Therapeutic Targets for CD4(+)CD25(+/High)Foxp3(+) Regulatory T Cells. Transl Res (2015) 165(1):221–40. doi: 10.1016/j.trsl.2014.08.001
75. Pastrana JL, Sha X, Virtue A, Mai J, Cueto R, Lee IA, et al. Regulatory T Cells and Atherosclerosis. J Clin Exp Cardiolog (2012) 2012(Suppl 12):2. doi: 10.4172/2155-9880.S12-002
76. Kitz A, Dominguez-Villar M. Molecular Mechanisms Underlying Th1-Like Treg Generation and Function. Cell Mol Life Sci (2017) 74(22):4059–75. doi: 10.1007/s00018-017-2569-y
77. Butcher MJ, Filipowicz AR, Waseem TC, McGary CM, Crow KJ, Magilnick N, et al. Atherosclerosis-Driven Treg Plasticity Results in Formation of a Dysfunctional Subset of Plastic Ifngamma+ Th1/Tregs. Circ Res (2016) 119(11):1190–203. doi: 10.1161/CIRCRESAHA.116.309764
78. Pandiyan P, Zhu J. Origin and Functions of Pro-Inflammatory Cytokine Producing Foxp3+ Regulatory T Cells. Cytokine (2015) 76(1):13–24. doi: 10.1016/j.cyto.2015.07.005
79. Sharir R, Semo J, Shimoni S, Ben-Mordechai T, Landa-Rouben N, Maysel-Auslender S, et al. Experimental Myocardial Infarction Induces Altered Regulatory T Cell Hemostasis, and Adoptive Transfer Attenuates Subsequent Remodeling. PloS One (2014) 9(12):e113653. doi: 10.1371/journal.pone.0113653
80. Andersen MH. Anti-Regulatory T Cells. Semin Immunopathol (2017) 39(3):317–26. doi: 10.1007/s00281-016-0593-x
82. Hoeppli RE, Wu D, Cook L, Levings MK. The Environment of Regulatory T Cell Biology: Cytokines, Metabolites, and the Microbiome. Front Immunol (2015) 6:61. doi: 10.3389/fimmu.2015.00061
83. Liu M, Saredy J, Zhang R, Shao Y, Sun Y, Yang WY, et al. Approaching Inflammation Paradoxes-Proinflammatory Cytokine Blockages Induce Inflammatory Regulators. Front Immunol (2020) 11:554301. doi: 10.3389/fimmu.2020.554301
84. Levine AG, Medoza A, Hemmers S, Moltedo B, Niec RE, Schizas M, et al. Stability and Function of Regulatory T Cells Expressing the Transcription Factor T-Bet. Nature (2017) 546(7658):421–5. doi: 10.1038/nature22360
85. Lucca LE, Dominguez-Villar M. Modulation of Regulatory T Cell Function and Stability by Co-Inhibitory Receptors. Nat Rev Immunol (2020) 20(11):680–93. doi: 10.1038/s41577-020-0296-3
86. Mirlekar B. Co-Expression of Master Transcription Factors Determines Cd4(+) T Cell Plasticity and Functions in Auto-Inflammatory Diseases. Immunol Lett (2020) 222:58–66. doi: 10.1016/j.imlet.2020.03.007
87. Zhang R, Xu K, Shao Y, Sun Y, Saredy J, Cutler E, et al. Tissue Treg Secretomes and Transcription Factors Shared With Stem Cells Contribute to a Treg Niche to Maintain Treg-Ness With 80% Innate Immune Pathways, and Functions of Immunosuppression and Tissue Repair. Front Immunol (2020) 11:632239. doi: 10.3389/fimmu.2020.632239
88. Sharir R, Semo J, Shaish A, Landa-Rouben N, Entin-Meer M, Keren G, et al. Regulatory T Cells Influence Blood Flow Recovery in Experimental Hindlimb Ischaemia in an IL-10-Dependent Manner. Cardiovasc Res (2014) 103(4):585–96. doi: 10.1093/cvr/cvu159
89. Burzyn D, Benoist C, Mathis D. Regulatory T Cells in Nonlymphoid Tissues. Nat Immunol (2013) 14(10):1007–13. doi: 10.1038/ni.2683
90. DiSpirito JR, Zemmour D, Ramanan D, Cho J, Zilionis R, Klein AM, et al. Molecular Diversification of Regulatory T Cells in Nonlymphoid Tissues. Sci Immunol (2018) 3(27). doi: 10.1126/sciimmunol.aat5861
91. Raffin C, Vo LT, Bluestone JA. Treg Cell-Based Therapies: Challenges and Perspectives. Nat Rev Immunol (2020) 20(3):158–72. doi: 10.1038/s41577-019-0232-6
92. Luznik Z, Anchouche S, Dana R, Yin J. Regulatory T Cells in Angiogenesis. J Immunol (2020) 205(10):2557–65. doi: 10.4049/jimmunol.2000574
93. Sun DZ, Abelson B, Babbar P, Damaser MS. Harnessing the Mesenchymal Stem Cell Secretome for Regenerative Urology. Nat Rev Urol (2019) 16(6):363–75. doi: 10.1038/s41585-019-0169-3
94. Oikonomou EK, Antoniades C. The Role of Adipose Tissue in Cardiovascular Health and Disease. Nat Rev Cardiol (2019) 16(2):83–99. doi: 10.1038/s41569-018-0097-6
95. Farhan H, Rabouille C. Signalling to and From the Secretory Pathway. J Cell Sci (2011) 124(Pt 2):171–80. doi: 10.1242/jcs.076455
96. Rabouille C. Pathways of Unconventional Protein Secretion. Trends Cell Biol (2017) 27(3):230–40. doi: 10.1016/j.tcb.2016.11.007
97. Planavila A, Fernandez-Sola J, Villarroya F. Cardiokines as Modulators of Stress-Induced Cardiac Disorders. Adv Protein Chem Struct Biol (2017) 108:227–56. doi: 10.1016/bs.apcsb.2017.01.002
98. Lipphardt M, Song JW, Matsumoto K, Dadafarin S, Dihazi H, Muller G, et al. The Third Path of Tubulointerstitial Fibrosis: Aberrant Endothelial Secretome. Kidney Int (2017) 92(3):558–68. doi: 10.1016/j.kint.2017.02.033
99. Makridakis M, Roubelakis MG, Vlahou A. Stem Cells: Insights Into the Secretome. Biochim Biophys Acta (2013) 1834(11):2380–4. doi: 10.1016/j.bbapap.2013.01.032
100. Yang Q, Nanayakkara GK, Drummer C, Sun Y, Johnson C, Cueto R, et al. Low-Intensity Ultrasound-Induced Anti-Inflammatory Effects are Mediated by Several New Mechanisms Including Gene Induction, Immunosuppressor Cell Promotion, and Enhancement of Exosome Biogenesis and Docking. Front Physiol (2017) 8:818. doi: 10.3389/fphys.2017.00818
101. Dinescu S, Dobranici A, Tecucianu R, Selaru A, Balahura R, Ignat S, et al. Exosomes as Part of the Human Adipose-Derived Stem Cells Secretome- Opening New Perspectives for Cell-Free Regenerative Applications. Adv Exp Med Biol (2020). doi: 10.1007/5584_2020_588
102. Keller M, Ruegg A, Werner S, Beer HD. Active Caspase-1 is a Regulator of Unconventional Protein Secretion. Cell (2008) 132(5):818–31. doi: 10.1016/j.cell.2007.12.040
103. Lorey MB, Rossi K, Eklund KK, Nyman TA, Matikainen S. Global Characterization of Protein Secretion From Human Macrophages Following non-Canonical Caspase-4/5 Inflammasome Activation. Mol Cell Proteomics (2017) 16(4 suppl 1):S187–S99. doi: 10.1074/mcp.M116.064840
104. Li YF, Nanayakkara G, Sun Y, Li X, Wang L, Cueto R, et al. Analyses of Caspase-1-Regulated Transcriptomes in Various Tissues Lead to Identification of Novel IL-1beta-, IL-18- and Sirtuin-1-Independent Pathways. J Hematol Oncol (2017) 10(1):40. doi: 10.1186/s13045-017-0406-2
105. Eisenberg E, Levanon EY. Human Housekeeping Genes, Revisited. Trends Genet (2013) 29(10):569–74. doi: 10.1016/j.tig.2013.05.010
106. Wang L, Fu H, Nanayakkara G, Li Y, Shao Y, Johnson C, et al. Novel Extracellular and Nuclear Caspase-1 and Inflammasomes Propagate Inflammation and Regulate Gene Expression: A Comprehensive Database Mining Study. J Hematol Oncol (2016) 9(1):122. doi: 10.1186/s13045-016-0351-5
107. Magnuson AM, Kiner E, Ergun A, Park JS, Asinovski N, Ortiz-Lopez A, et al. Identification and Validation of a Tumor-Infiltrating Treg Transcriptional Signature Conserved Across Species and Tumor Types. Proc Natl Acad Sci U.S.A. (2018) 115(45):E10672–E81. doi: 10.1073/pnas.1810580115
108. Medrikova D, Sijmonsma TP, Sowodniok K, Richards DM, Delacher M, Sticht C, et al. Brown Adipose Tissue Harbors a Distinct Sub-Population of Regulatory T Cells. PloS One (2015) 10(2):e0118534. doi: 10.1371/journal.pone.0118534
109. Li C, Spallanzani RG, Mathis D. Visceral Adipose Tissue Tregs and the Cells That Nurture Them. Immunol Rev (2020) 295(1):114–25. doi: 10.1111/imr.12850
110. Panduro M, Benoist C, Mathis D. Tissue Tregs. Annu Rev Immunol (2016) 34:609–33. doi: 10.1146/annurev-immunol-032712-095948
111. Sharma R, Kinsey GR. Regulatory T Cells in Acute and Chronic Kidney Diseases. Am J Physiol Renal Physiol (2018) 314(5):F679–F98. doi: 10.1152/ajprenal.00236.2017
112. Li C, Munoz-Rojas AR, Wang G, Mann AO, Benoist C, Mathis D. Ppargamma Marks Splenic Precursors of Multiple Nonlymphoid-Tissue Treg Compartments. Proc Natl Acad Sci U S A (2021) 118(13). doi: 10.1073/pnas.2025197118
113. Wei S, Kryczek I, Zou W. Regulatory T-Cell Compartmentalization and Trafficking. Blood (2006) 108(2):426–31. doi: 10.1182/blood-2006-01-0177
114. Mempel TR, Marangoni F. Guidance Factors Orchestrating Regulatory T Cell Positioning in Tissues During Development, Homeostasis, and Response. Immunol Rev (2019) 289(1):129–41. doi: 10.1111/imr.12761
115. Zhang Y, Lazarus J, Steele NG, Yan W, Lee HJ, Nwosu ZC, et al. Regulatory T-Cell Depletion Alters the Tumor Microenvironment and Accelerates Pancreatic Carcinogenesis. Cancer Discovery (2020) 10(3):422–39. doi: 10.1158/2159-8290.CD-19-0958
116. Li C, Jiang P, Wei S, Xu X, Wang J. Regulatory T Cells in Tumor Microenvironment: New Mechanisms, Potential Therapeutic Strategies and Future Prospects. Mol Cancer (2020) 19(1):116. doi: 10.1186/s12943-020-01234-1
117. Collison LW, Chaturvedi V, Henderson AL, Giacomin PR, Guy C, Bankoti J, et al. Il-35-Mediated Induction of a Potent Regulatory T Cell Population. Nat Immunol (2010) 11(12):1093–101. doi: 10.1038/ni.1952
118. Collison LW, Delgoffe GM, Guy CS, Vignali KM, Chaturvedi V, Fairweather D, et al. The Composition and Signaling of the IL-35 Receptor are Unconventional. Nat Immunol (2012) 13(3):290–9. doi: 10.1038/ni.2227
119. Arnold IC, Zhang X, Urban S, Artola-Boran M, Manz MG, Ottemann KM, et al. Nlrp3 Controls the Development of Gastrointestinal Cd11b(+) Dendritic Cells in the Steady State and During Chronic Bacterial Infection. Cell Rep (2017) 21(13):3860–72. doi: 10.1016/j.celrep.2017.12.015
120. Park SH, Ham S, Lee A, Moller A, Kim TS. Nlrp3 Negatively Regulates Treg Differentiation Through Kpna2-Mediated Nuclear Translocation. J Biol Chem (2019) 294(47):17951–61. doi: 10.1074/jbc.RA119.010545
121. Yin Y, Pastrana JL, Li X, Huang X, Mallilankaraman K, Choi ET, et al. Inflammasomes: Sensors of Metabolic Stresses for Vascular Inflammation. Front Biosci (Landmark Ed) (2013) 18:638–49. doi: 10.2741/4127
122. Shen J, Yin Y, Mai J, Xiong X, Pansuria M, Liu J, et al. Caspase-1 Recognizes Extended Cleavage Sites in its Natural Substrates. Atherosclerosis (2010) 210(2):422–9. doi: 10.1016/j.atherosclerosis.2009.12.017
123. Broz P, Pelegrin P, Shao F. The Gasdermins, a Protein Family Executing Cell Death and Inflammation. Nat Rev Immunol (2020) 20(3):143–57. doi: 10.1038/s41577-019-0228-2
124. Doitsh G, Cavrois M, Lassen KG, Zepeda O, Yang Z, Santiago ML, et al. Abortive HIV Infection Mediates Cd4 T Cell Depletion and Inflammation in Human Lymphoid Tissue. Cell (2010) 143(5):789–801. doi: 10.1016/j.cell.2010.11.001
125. Monroe KM, Yang Z, Johnson JR, Geng X, Doitsh G, Krogan NJ, et al. Ifi16 DNA Sensor is Required for Death of Lymphoid Cd4 T Cells Abortively Infected With Hiv. Science (2014) 343(6169):428–32. doi: 10.1126/science.1243640
126. Doitsh G, Galloway NL, Geng X, Yang Z, Monroe KM, Zepeda O, et al. Cell Death by Pyroptosis Drives CD4 T-Cell Depletion in HIV-1 Infection. Nature (2014) 505(7484):509–14. doi: 10.1038/nature12940
127. Li KP, Shanmuganad S, Carroll K, Katz JD, Jordan MB, Hildeman DA. Dying to Protect: Cell Death and the Control of T-Cell Homeostasis. Immunol Rev (2017) 277(1):21–43. doi: 10.1111/imr.12538
128. Arterbery AS, Yao J, Ling A, Avitzur Y, Martinez M, Lobritto S, et al. Inflammasome Priming Mediated Via Toll-Like Receptors 2 and 4, Induces Th1-Like Regulatory T Cells in De Novo Autoimmune Hepatitis. Front Immunol (2018) 9:1612. doi: 10.3389/fimmu.2018.01612
129. Kwon HK, Chen HM, Mathis D, Benoist C. Foxp3 Scanning Mutagenesis Reveals Functional Variegation and Mild Mutations With Atypical Autoimmune Phenotypes. Proc Natl Acad Sci U S A (2018) 115(2):E253–E62. doi: 10.1073/pnas.1718599115
130. Wing K, Onishi Y, Prieto-Martin P, Yamaguchi T, Miyara M, Fehervari Z, et al. Ctla-4 Control Over Foxp3+ Regulatory T Cell Function. Science (2008) 322(5899):271–5. doi: 10.1126/science.1160062
131. Zhang B, Chikuma S, Hori S, Fagarasan S, Honjo T. Nonoverlapping Roles of PD-1 and Foxp3 in Maintaining Immune Tolerance in a Novel Autoimmune Pancreatitis Mouse Model. Proc Natl Acad Sci U S A (2016) 113(30):8490–5. doi: 10.1073/pnas.1608873113
132. Zhang YH, Sun HX. Immune Checkpoint Molecules in Pregnancy: Focus on Regulatory T Cells. Eur J Immunol (2020) 50(2):160–9. doi: 10.1002/eji.201948382
133. Kumar P, Bhattacharya P, Prabhakar BS. A Comprehensive Review on the Role of Co-Signaling Receptors and Treg Homeostasis in Autoimmunity and Tumor Immunity. J Autoimmun (2018) 95:77–99. doi: 10.1016/j.jaut.2018.08.007
134. Grabie N, Lichtman AH, Padera R. T Cell Checkpoint Regulators in the Heart. Cardiovasc Res (2019) 115(5):869–77. doi: 10.1093/cvr/cvz025
135. Sasidharan Nair V, Elkord E. Immune Checkpoint Inhibitors in Cancer Therapy: A Focus on T-Regulatory Cells. Immunol Cell Biol (2018) 96(1):21–33. doi: 10.1111/imcb.1003
136. Togashi Y, Shitara K, Nishikawa H. Regulatory T Cells in Cancer Immunosuppression - Implications for Anticancer Therapy. Nat Rev Clin Oncol (2019) 16(6):356–71. doi: 10.1038/s41571-019-0175-7
137. Saleh R, Elkord E. Treg-Mediated Acquired Resistance to Immune Checkpoint Inhibitors. Cancer Lett (2019) 457:168–79. doi: 10.1016/j.canlet.2019.05.003
138. Kempkes RWM, Joosten I, Koenen H, He X. Metabolic Pathways Involved in Regulatory T Cell Functionality. Front Immunol (2019) 10:2839. doi: 10.3389/fimmu.2019.02839
139. Artyomov MN, Van den Bossche J. Immunometabolism in the Single-Cell Era. Cell Metab (2020) 32(5):710–25. doi: 10.1016/j.cmet.2020.09.013
140. Netea MG, Joosten LA, Latz E, Mills KH, Natoli G, Stunnenberg HG, et al. Trained Immunity: A Program of Innate Immune Memory in Health and Disease. Science (2016) 352(6284):aaf1098. doi: 10.1126/science.aaf1098
141. Shao Y, Saredy J, Yang WY, Sun Y, Lu Y, Saaoud F, et al. Vascular Endothelial Cells and Innate Immunity. Arterioscler Thromb Vasc Biol (2020) 40(6):e138–e52. doi: 10.1161/ATVBAHA.120.314330
142. Guo Z, Wang G, Wu B, Chou WC, Cheng L, Zhou C, et al. Dcaf1 Regulates Treg Senescence Via the ROS Axis During Immunological Aging. J Clin Invest (2020) 130(11):5893–908. doi: 10.1172/JCI136466
143. Dong D, Maltzman JS. Aging Tregs Need Dcafinating. Sci Immunol (2020) 5(52). doi: 10.1126/sciimmunol.abe9581
144. Gerner MC, Ziegler LS, Schmidt RLJ, Krenn M, Zimprich F, Uyanik-Unal K, et al. The TGF-B/SOX4 Axis and ROS-Driven Autophagy Co-Mediate Cd39 Expression in Regulatory T-Cells. FASEB J (2020) 34(6):8367–84. doi: 10.1096/fj.201902664
145. Sun Y, Lu Y, Saredy J, Wang X, Drummer C IV, Shao Y, et al. Ros Systems are a New Integrated Network for Sensing Homeostasis and Alarming Stresses in Organelle Metabolic Processes. Redox Biol (2020) 17(101696). doi: 10.1016/j.redox.2020.101696
146. Trevelin SC, Shah AM, Lombardi G. Beyond Bacterial Killing: NADPH Oxidase 2 is an Immunomodulator. Immunol Lett (2020) 221:39–48. doi: 10.1016/j.imlet.2020.02.009
147. Aparicio-Soto M, Sanchez-Hidalgo M, Cardeno A, Rosillo MA, Sanchez-Fidalgo S, Utrilla J, et al. Dietary Extra Virgin Olive Oil Attenuates Kidney Injury in Pristane-Induced Sle Model Via Activation of HO-1/Nrf-2 Antioxidant Pathway and Suppression of JAK/STAT, Nf-Kappab and MAPK Activation. J Nutr Biochem (2016) 27:278–88. doi: 10.1016/j.jnutbio.2015.09.017
148. Tsai PY, Ka SM, Chang JM, Chen HC, Shui HA, Li CY, et al. Epigallocatechin-3-Gallate Prevents Lupus Nephritis Development in Mice Via Enhancing the Nrf2 Antioxidant Pathway and Inhibiting Nlrp3 Inflammasome Activation. Free Radic Biol Med (2011) 51(3):744–54. doi: 10.1016/j.freeradbiomed.2011.05.016
149. Sharabi A, Tsokos MG, Ding Y, Malek TR, Klatzmann D, Tsokos GC. Regulatory T Cells in the Treatment of Disease. Nat Rev Drug Discovery (2018) 17(11):823–44. doi: 10.1038/nrd.2018.148
150. Meng X, Yang J, Dong M, Zhang K, Tu E, Gao Q, et al. Regulatory T Cells in Cardiovascular Diseases. Nat Rev Cardiol (2016) 13(3):167–79. doi: 10.1038/nrcardio.2015.169
151. Sakaguchi S, Sakaguchi N, Asano M, Itoh M, Toda M. Immunologic Self-Tolerance Maintained by Activated T Cells Expressing Il-2 Receptor Alpha-Chains (Cd25). Breakdown of a Single Mechanism of Self-Tolerance Causes Various Autoimmune Diseases. J Immunol (1995) 155(3):1151–64.
152. Zemmour D, Zilionis R, Kiner E, Klein AM, Mathis D, Benoist C. Single-Cell Gene Expression Reveals a Landscape of Regulatory T Cell Phenotypes Shaped by the TCR. Nat Immunol (2018) 19(3):291–301. doi: 10.1038/s41590-018-0051-0
Keywords: CD4+Foxp3+ regulatory T cells (Treg), canonical secretome, innate immune caspase-1 dependent secretome, innate immune caspase-4/11 dependent secretome, immune checkpoint receptors
Citation: Ni D, Tang T, Lu Y, Xu K, Shao Y, Saaoud F, Saredy J, Liu L, Drummer C IV, Sun Y, Hu W, Lopez-Pastrana J, Luo JJ, Jiang X, Choi ET, Wang H and Yang X (2021) Canonical Secretomes, Innate Immune Caspase-1-, 4/11-Gasdermin D Non-Canonical Secretomes and Exosomes May Contribute to Maintain Treg-Ness for Treg Immunosuppression, Tissue Repair and Modulate Anti-Tumor Immunity via ROS Pathways. Front. Immunol. 12:678201. doi: 10.3389/fimmu.2021.678201
Received: 09 March 2021; Accepted: 01 April 2021;
Published: 18 May 2021.
Edited by:
Liwu Li, Virginia Tech, United StatesReviewed by:
Gadiparthi Rao, University of Tennessee Health Science Center (UTHSC), United StatesCopyright © 2021 Ni, Tang, Lu, Xu, Shao, Saaoud, Saredy, Liu, Drummer, Sun, Hu, Lopez-Pastrana, Luo, Jiang, Choi, Wang and Yang. This is an open-access article distributed under the terms of the Creative Commons Attribution License (CC BY). The use, distribution or reproduction in other forums is permitted, provided the original author(s) and the copyright owner(s) are credited and that the original publication in this journal is cited, in accordance with accepted academic practice. No use, distribution or reproduction is permitted which does not comply with these terms.
*Correspondence: Xiaofeng Yang, eGZ5YW5nQHRlbXBsZS5lZHU=
†These authors have contributed equally to this work
Disclaimer: All claims expressed in this article are solely those of the authors and do not necessarily represent those of their affiliated organizations, or those of the publisher, the editors and the reviewers. Any product that may be evaluated in this article or claim that may be made by its manufacturer is not guaranteed or endorsed by the publisher.
Research integrity at Frontiers
Learn more about the work of our research integrity team to safeguard the quality of each article we publish.