
95% of researchers rate our articles as excellent or good
Learn more about the work of our research integrity team to safeguard the quality of each article we publish.
Find out more
ORIGINAL RESEARCH article
Front. Immunol. , 09 July 2021
Sec. Microbial Immunology
Volume 12 - 2021 | https://doi.org/10.3389/fimmu.2021.675979
This article is part of the Research Topic Ticks and Host Immunity – New Strategies for Controlling Ticks and Tick-Borne Pathogens View all 14 articles
 Nicholas N. Jonsson1*
 David K. Cox1
 Emily K. Piper2Emily F. Mantilla Valdivieso3
 Constantin Constantinoiu4
 Louise A. Jackson5
 Michael J. Stear6
 Elizabeth M. Ross3Ala E. Tabor3
The protein tyrosine phosphatase receptor type-C (PTPRC) gene encodes the common leukocyte antigen (CD45) receptor. CD45 affects cell adhesion, migration, cytokine signalling, cell development, and activation state. Four families of the gene have been identified in cattle: a taurine group (Family 1), two indicine groups (Families 2 and 4) and an African “taurindicine” group (Family 3). Host resistance in cattle to infestation with ticks is moderately heritable and primarily manifests as prevention of attachment and feeding by larvae. This study was conducted to describe the effects of PTPRC genotype on immune-response phenotypes in cattle that display a variable immune responsiveness to ticks. Thirty tick-naïve Santa-Gertrudis cattle (a stabilized composite of 5/8 taurine and 3/8 indicine) were artificially infested with ticks weekly for 13 weeks and ranked according to their tick counts. Blood samples were taken from control and tick-challenged cattle immediately before, then at 21 d after infestation and each subsequent week for 9 weeks. Assays included erythrocyte profiles, white blood cell counts, the percentage of cellular subsets comprising the peripheral blood mononuclear cell (PBMC) population, and the ability of PBMC to recognize and proliferate in response to stimulation with tick antigens in vitro. The cattle were PTPRC genotyped using a RFLP assay that differentiated Family 1 and 3 together (220 bp), from Family 2 (462 bp), and from Family 4 (486 bp). The PTPRC allele frequencies were Family 1/3 = 0.34; Family 2 = 0.47; Family 4 = 0.19. There was no significant association between PTPRC genotype and tick count. Each copy of the Family 1/3 allele significantly decreased total leucocyte count (WCC) and CD8+ cells. Increasing dosage of Family 2 alleles significantly increased red blood cell count (RCC), haematocrit (PCV), and haemoglobin (Hb) concentration in blood. Increasing dosage of the Family 4 allele was associated with increased WCC, reduced RCC, reduced PCV and reduced Hb. Homozygote Family 1/3 animals had consistently lower IgG1 in response to tick Ag than homozygote Family 2 animals. The PTPRC genotype influences the bovine immune response to ticks but was not associated with the observed variation in resistance to tick infestation in this study.
PTPRC or protein tyrosine phosphatase receptor-type C, also known as CD45, or leukocyte common antigen (LCA) is a key component of the signal transduction cascade in immune cells (1). Throughout this report, we refer to PTPRC as the gene encoding CD45, although the gene as annotated for human and mouse has several aliases: B220, CD45, CD45R, Cd45, GP180, LCA, L-CA, Ly-, LY5, Ly-5, Lyt-, Lyt-4,T200. CD45 was initially investigated in cattle for its potential involvement in pathogen tolerance in African cattle (2). They found that allelic polymorphisms in CD45 constituted the basis for differential antibody staining in peripheral blood leukocytes from cattle of African, European, and Indian origin, and suggested that polymorphism might be associated with tolerance to regionally endemic pathogens.
CD45 is an abundant cell surface glycoprotein found in the plasma of all nucleated hematopoietic cells and controls the immune response by dephosphorylating molecules that initiate antigen receptor signalling in T- and B-cell cells, such as the Src family kinases (SFKs) (3, 4). There are many isoforms of differing molecular weight due to the alternative splicing of exons 4, 5 and 6 (referred to as A, B and C) in the extracellular domain. The smallest isoform is CD45RO of approximately 180 kDa, lacking all of the alternatively spliced exons, whereas the largest isoform that includes all three exons – CD45RABC is about 240 kDa and heavily glycosylated (1, 3, 5). In addition to these variably spliced domains, the protein comprises three fibronectin type III (FN3) repeats, a short transmembrane domain, and a cytoplasmic region of two tandemly duplicated PTPase homology domains (D1 and D2), in which only D1 is catalytically active (3). The expression of PTPRC is tightly regulated depending on the cell type, maturation, and activation state. Although nucleotide sequence in the extracellular domains is highly variable, the isoform structures are largely conserved across species (3, 6). In Bos taurus cattle, PTPRC is on chromosome 16, has at least 30 exons and nine characterized isoforms (Gene ID: 407152, NCBI, 2021). Human and B. taurus PTPRC sequences show approximately 70% sequence identity. In humans five CD45 isoforms are well characterized (6). Ballingall et al. (2) initially considered PTPRC as one of several genes that might influence the diverse responses of African and Asian cattle to endemic pathogens in Africa. They noted that peripheral blood leukocytes from African and European taurine cattle had similar CD45RO antibody staining patterns whereas in indicine cattle, the pattern was variable. The pattern of staining corresponded with four distinct allelic families of PTPRC: B. taurus, Bos indicus (×2), and cattle of African origin (2, 7).
Ballingal et al. (2) showed that there appeared to be strong natural selection on extracellular domains of CD45 protein and proposed that it was likely to be a determinant of the immunity of cattle to endemic pathogens. Loss-of-function mutations of PTPRC have consequences related to immunodeficiency and malignancy in humans and mice (4) and CD45 has been associated with disease in cattle. A microarray-based study showed that PTPRC expression in the mesenteric lymph nodes of cattle with high resistance to gastrointestinal nematodes was increased, which was subsequently confirmed by qRT PCR (8). In a study on the reactivity of subsets of leukocytes present in the skin of B. taurus and B. indicus cattle infested with R. australis, antibodies specific for CD45 and CD45RO epitopes bound differentially in taurine and indicine cattle (9). In a follow-up study using tick resistant and susceptible Santa Gertrudis cattle, the reactivity of cells to CD45 and CD45RO mAbs also differed between resistant and susceptible cattle of the same breed (10). It was proposed that CD45 variants of B. indicus lack the epitopes recognized by mAb raised against CD45 and CD45RO in taurine cattle, and that CD45 might therefore have potential as a biomarker for resistance to infestation with cattle ticks.
We hypothesised that sequence variation in PTPRC in cattle affects resistance to ticks and immune phenotype. Our aim here was to take observations on erythrocytes, leukocytes and immunoglobulins obtained from cattle that were experimentally infested with R. australis in a previous experiment (10, 11), genotype the animals for the major PTPRC variants, and determine whether variation in these observations was associated with the presence of PTPRC variants.
The experimental methods are described in detail in the earlier articles (10, 11) and summarized briefly here. Thirty-five tick-naïve Santa-Gertrudis cattle (a stabilized composite of 5/8 taurine – Shorthorn – and 3/8 indicine – Brahman) were used in this study, conducted near Brisbane, in Queensland, Australia. The cattle were from a single property of origin and were selected such that their parentage was as far as possible an even admixture of sires. Five cattle were held as control animals on a separate, tick-secure property within 5 km of the experimental farm, and the remaining 30 were artificially infested by application to the neck and withers of 10 000 (0.5 g) Rhipicephalus australis tick larvae weekly for 13 weeks. Tick larvae were of the Non-Resistant Field Strain (NRFS) that is maintained free of Babesia and Anaplasma pathogens at the Queensland Department of Agriculture and Fisheries’ Biosecurity Science Laboratories (12). Tick counts were conducted weekly using the standard tick count method of Utech et al. (13, 14). Each infestation consisted of larvae applied to the neck and withers. Blood samples were taken from control and tick-challenged cattle immediately before the first infestation, then at 21 d post primary infestation (PPI) and each subsequent week for 9 weeks. The study was conducted with approval from the University of Queensland Animal Ethics - Production and Companion Animals Committee (Approval numbers: SVS/864/06/CRC and SVS/872/07/CRC).
Tick count data recorded over 13 weeks were originally analysed using a mixed effects model applied to data summarized over time (median, area under the curve, final count) fit by restricted maximum likelihood (REML), to rank each animal on its ability to resist tick infestation.
Erythrocyte profiles and white blood cell counts were conducted using a VetABC animal blood cell counter (ABX Hematologie). The percentages of cellular subsets comprising the peripheral blood mononuclear cell (PBMC) population were determined using the Ab listed in Table 1 with a FACSCalibur flow cytometer (Becton Dickinson Immunocytometry Systems), as described in detail by Piper et al. (15). The ability of PBMC to recognize tick antigen (Ag) and proliferate in response to stimulation with antigens in vitro was quantified for concanavalin-A (ConA), and Ag mixtures derived from soluble fractions of salivary gland (SS), mid-gut (GS) or larvae (LS), or membrane-bound fractions of salivary gland (SM) or mid-gut (GM) in triplicate using the method described by Piper et al. (11). Results of PBMC proliferation are expressed in terms of optical density (OD) of microplate photometric readings at 450 nm. IgG1 and IgG2 responses to tick infestation were conducted in triplicate using an indirect ELISA, in wells coated with fractionated tick Ag (salivary soluble – SS; gut membrane – GM; gut soluble – GS; larval soluble – LS) as described in detail in Piper et al. (15). Microtiter plates were coated with diluted tick antigens. Sera were diluted and added to the microtiter plates in triplicate. Monoclonal antibodies (mouse anti-bovine IgG1 and mouse anti-bovine IgG2) were added to all wells. The conjugated antibody (goat anti-mouse IgG heavy and light chain specific, conjugated to horseradish peroxidase) was then added to each well. A tetramethylbenzidine-peroxidase substrate was used to develop the signal, and the reaction was stopped with orthophosphoric acid. The absorbance was read at 450 nm and the mean OD of each biological sample from triplicate wells was used for statistical analysis.
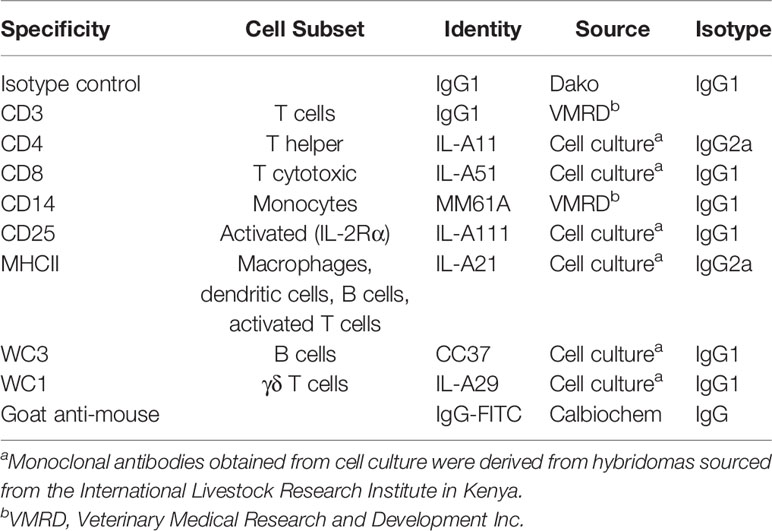
Table 1 Monoclonal antibodies used and the cell subsets labelled in flow cytometric analysis of cellular subsets.
Thirty-four cattle were genotyped for PTPRC families using a restriction-enzyme fragment length-polymorphism (RFLP) assay that differentiated Family 1 and 3 together (220 bp amplicon - taurine and African taurindicine families), from Family 2 (462 bp - indicine), from Family 4 (486 bp - indicine). Accession numbers of publicly available sequences are shown in Table 2. Genotyping and sequencing assays assessed the region of PTPRC previously identified as exon-9 by Ballingal et al. (2), but which we now consider to most likely correspond with exon-5 or exon-6 (data not shown). The distinguishing features of the 4 families are shown in Table 3. We used a modification of their genotyping assay using the primers CD45ex9_F: TCCTGGGGCTATTTTTGTTGGTGTT and CD45ex9_R: AGGCTGCTCCGAGGTCACCA, with annealing temperature of 59°C, and an expected fragment size of 486 bp. The restriction site enzyme DdeI was used to cut only the B. taurus (Family 1 & Family 3) reference sequence at location 68,989. Genotyping was conducted by capillary electrophoresis using a 3130 XL Genetic Analyzer (Thermofisher, Australia). The amplicons generated for Family 1 and Family 3 were the shortest, at 220 bp, whereas Family 2, with the 24-bp deletion, is 462 bp, and Family 4 is the complete amplicon from forward to reverse primer of 486 bp (Figure 1).
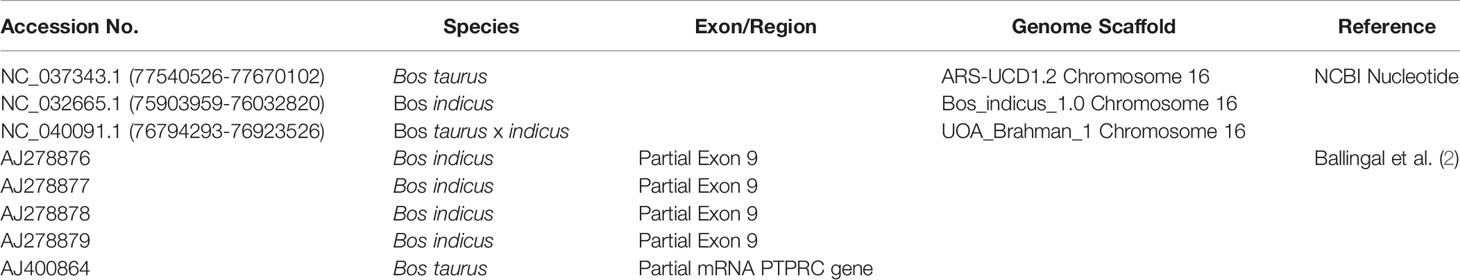
Table 2 Accession numbers and references for nucleotide sequences used in this study.
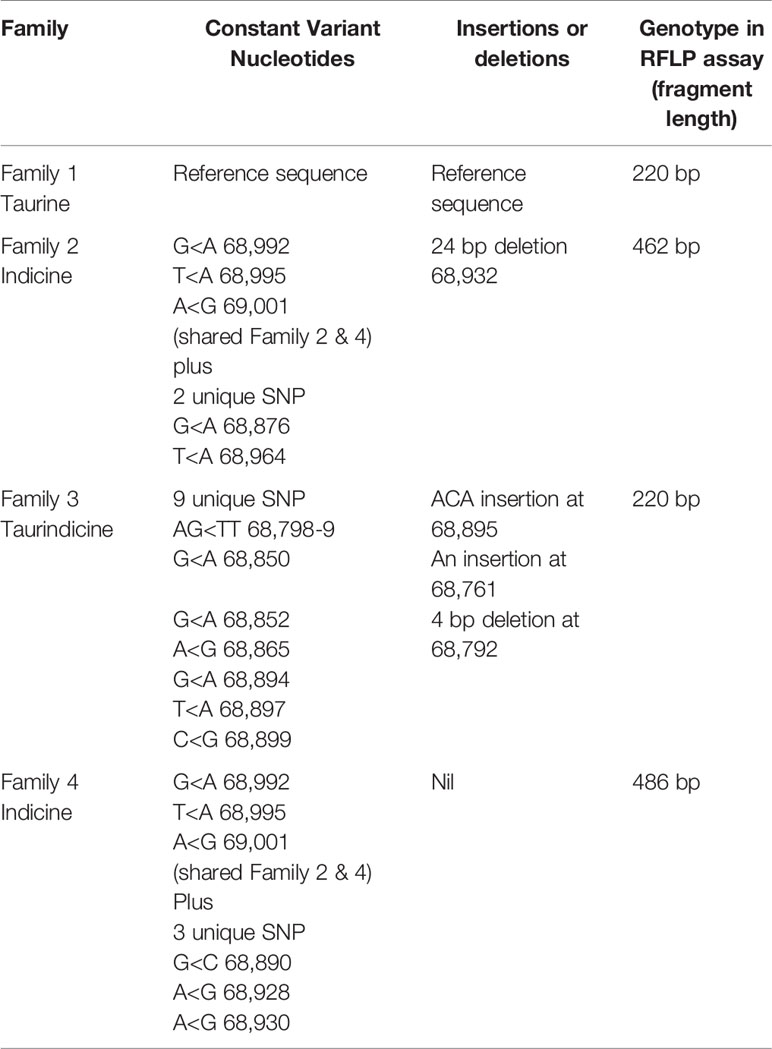
Table 3 Major discriminating features of nucleotide sequence used for defining the four distinct PTPRC families.
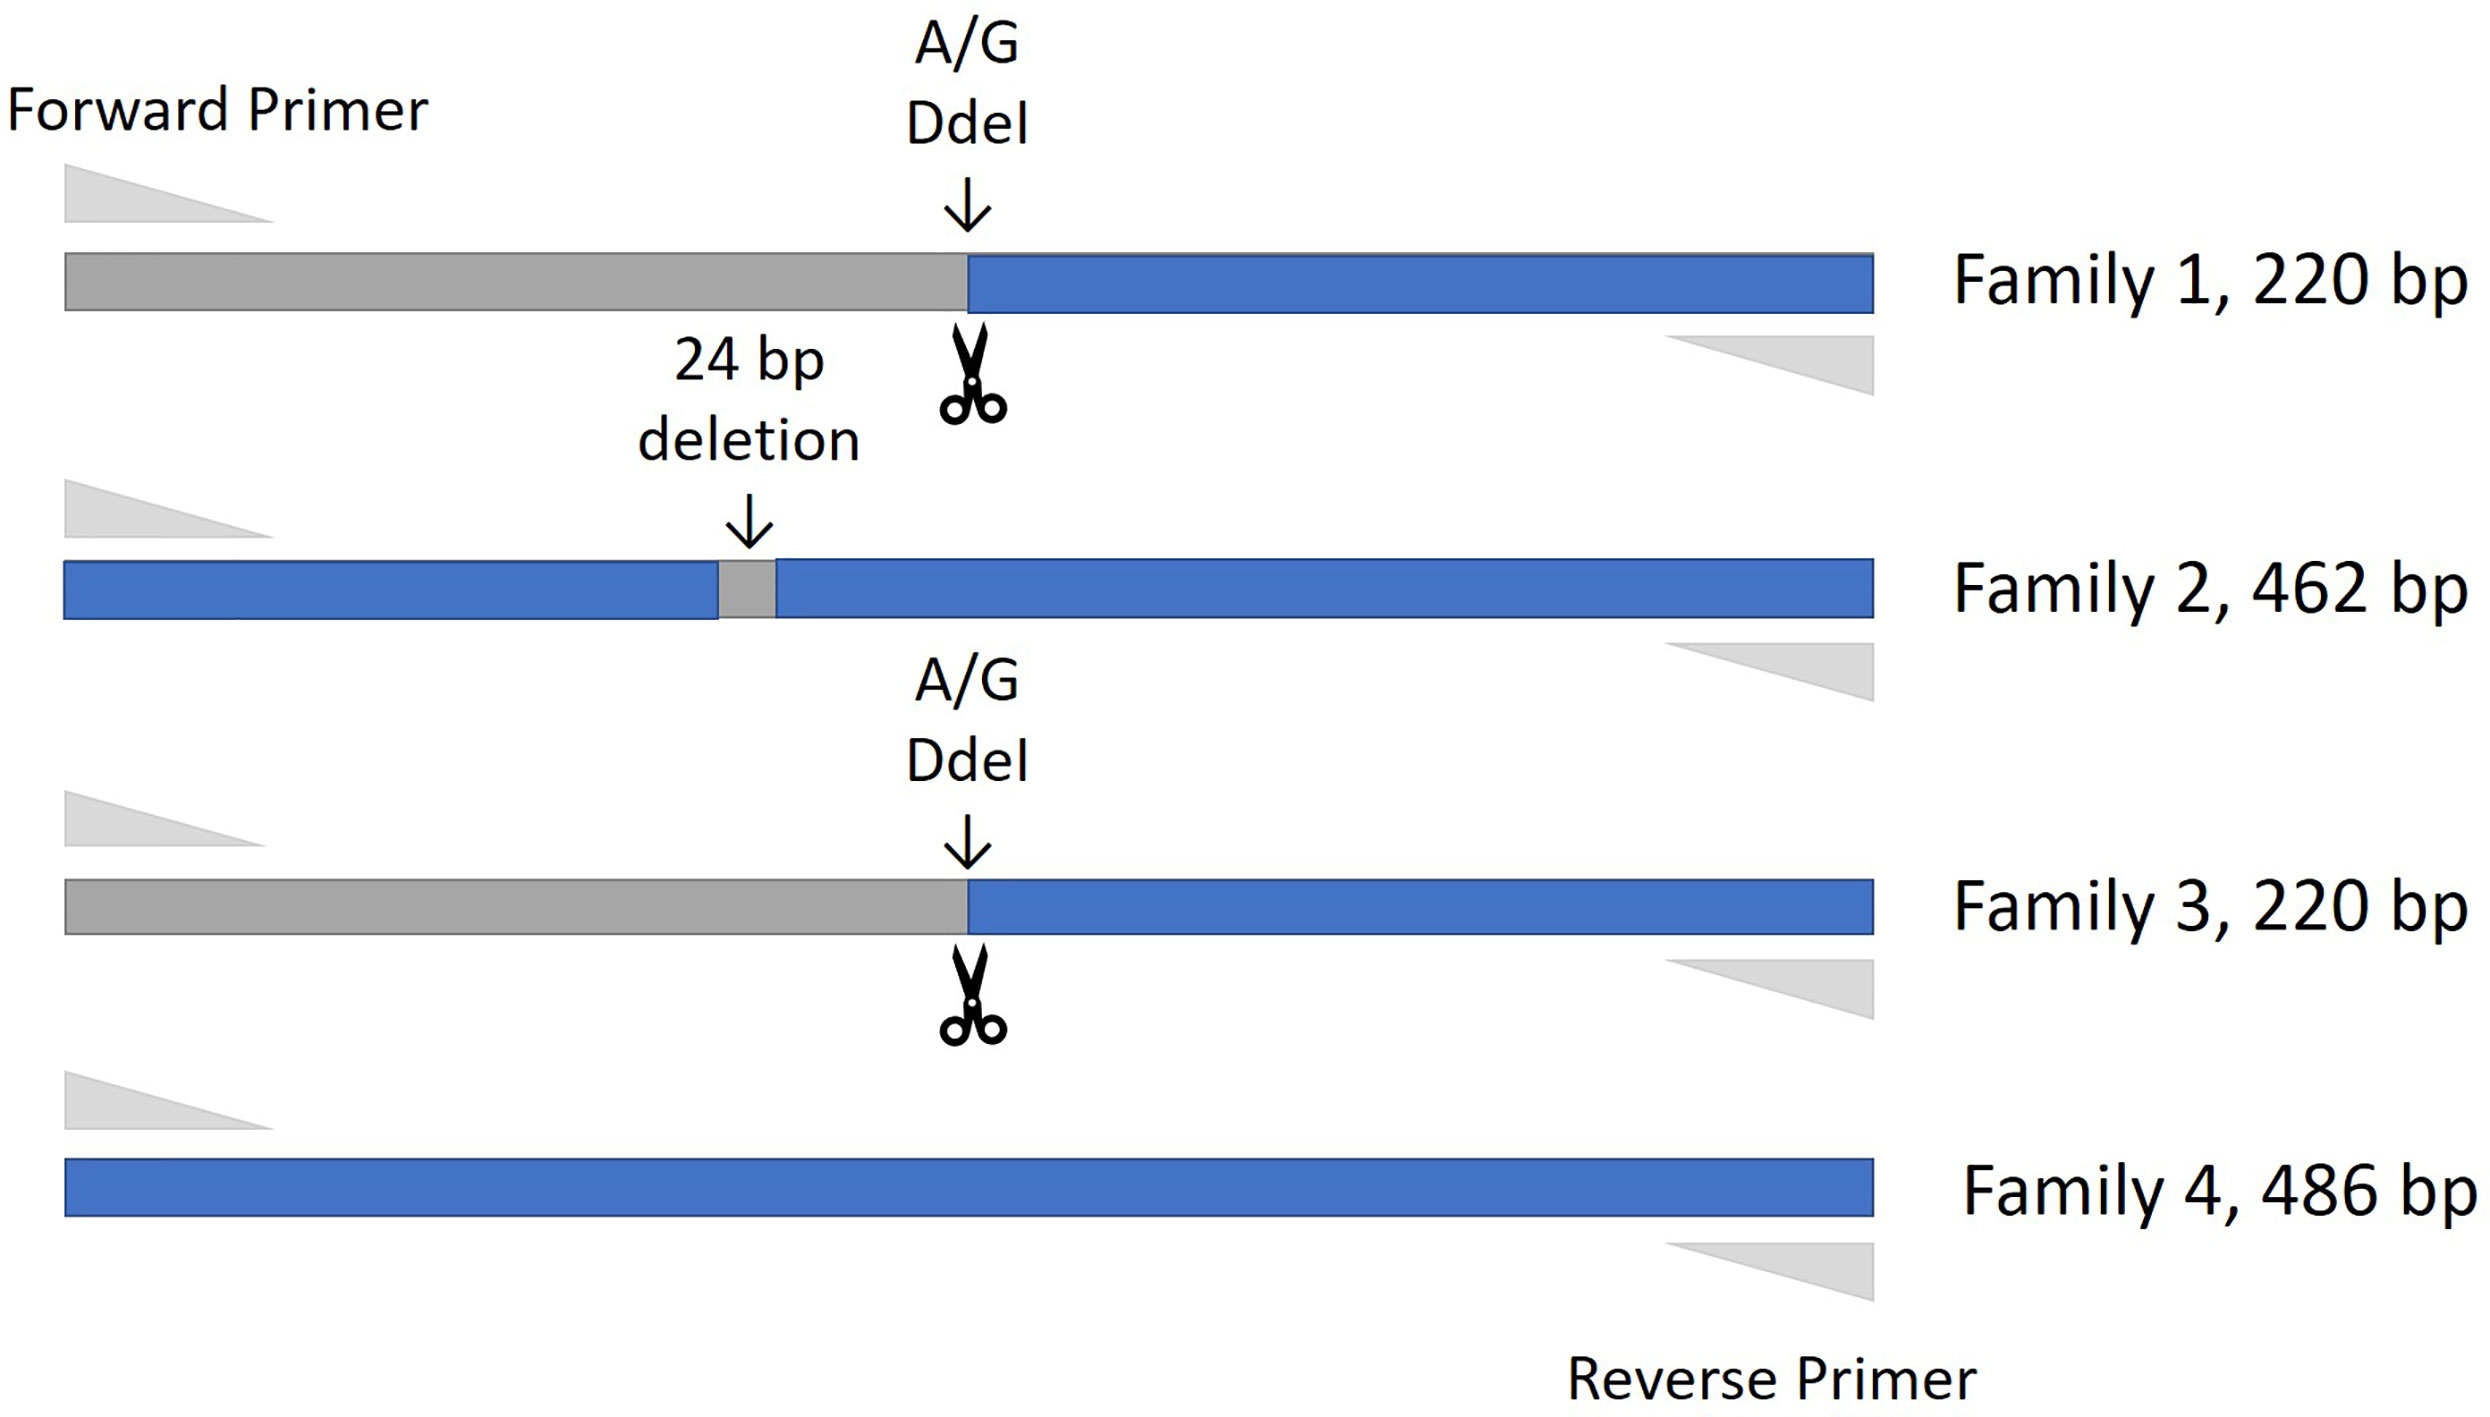
Figure 1 Amplification fragment sizes obtained by the genotyping assay for each of the PTPRC families. The restriction site enzyme DdeI was used to cut the Bos taurus (Family 1 & Family 3) reference sequence at location 68,989. Neither the Family 2 nor Family 4 alleles are cut at this location, and these alleles are differentiated by the 24 bp deletion that is the main characteristic of the Family 2 allele.
All statistical analysis was conducted using R version 4.0.3 [(16) R Core Team, 2018]. Data consisted of 14 or 15 successive time-series observations for each variable for each individual. Only a subset of samples from resistant and susceptible animals had originally been subjected to IgG quantification, so the representation of each of the genotypes was uneven, with some genotypes missing completely. Therefore, only those animals with 220/220 (n = 3) and 462/462 (n=7) genotypes were included in the analysis for IgG1 and IgG2. All dependent variables were checked for normality by plotting as histograms and application of the Shapiro-Wilk test of normality. Variables with non-normal distributions were tested for compliance after natural log and square root transformations, and if these did not yield normally distributed data, they were then transformed using the Johnson family of distributions using the “ls” procedure from the R package “jtrans” (version 0.2.1). Given the highly skewed time-responses of IgG1 and IgG2, only the distributions of the residuals of the GAMs were checked and all were found to approximate normal distributions. Time was expected to be an important explanatory variable, but there was no a priori reason to expect any particular response function for any of the dependent variables over time. Therefore, a generalized additive model was used, with time as a smoothed effect, the allele dosage as a fixed effect (for each of the three alleles, any animal can have the value 0,1,2), and individual animal as a random effect. The R function “gam” from the package “mgcv” (version 1.8-33) was used (17), and models were tested using the “gam.check” function (18). Residuals were plotted for each model and checked for deviations from normality. Estimates of p-values are presented in tables as obtained from the models, but a statistical significance level (α) was set at 0.00083, consistent with Bonferroni correction for testing of 60 variables. For the re-analysis of resistance to ticks, a similar approach was taken to make more efficient use of the non-summarized time-series data.
The most frequent allele was the 462, indicine Family 2, with a relative frequency of 0.47 (32/68 possible alleles), followed by the taurine Family 1/3 allele 220 at 0.34 (23/68 possible alleles), with the 486 allele of the indicine Family 4 being least frequent at 0.19 (13/68 possible alleles). The distribution of genotypes and alleles was uneven, the most common genotype being 462/462, the indicine Family 2 (Table 4, 10/34 animal genotypes). However, the observed frequencies of genotypes did not differ from expectations under Hardy-Weinberg equilibrium (Table 4, χ2 = 3.314, p > 0.1).
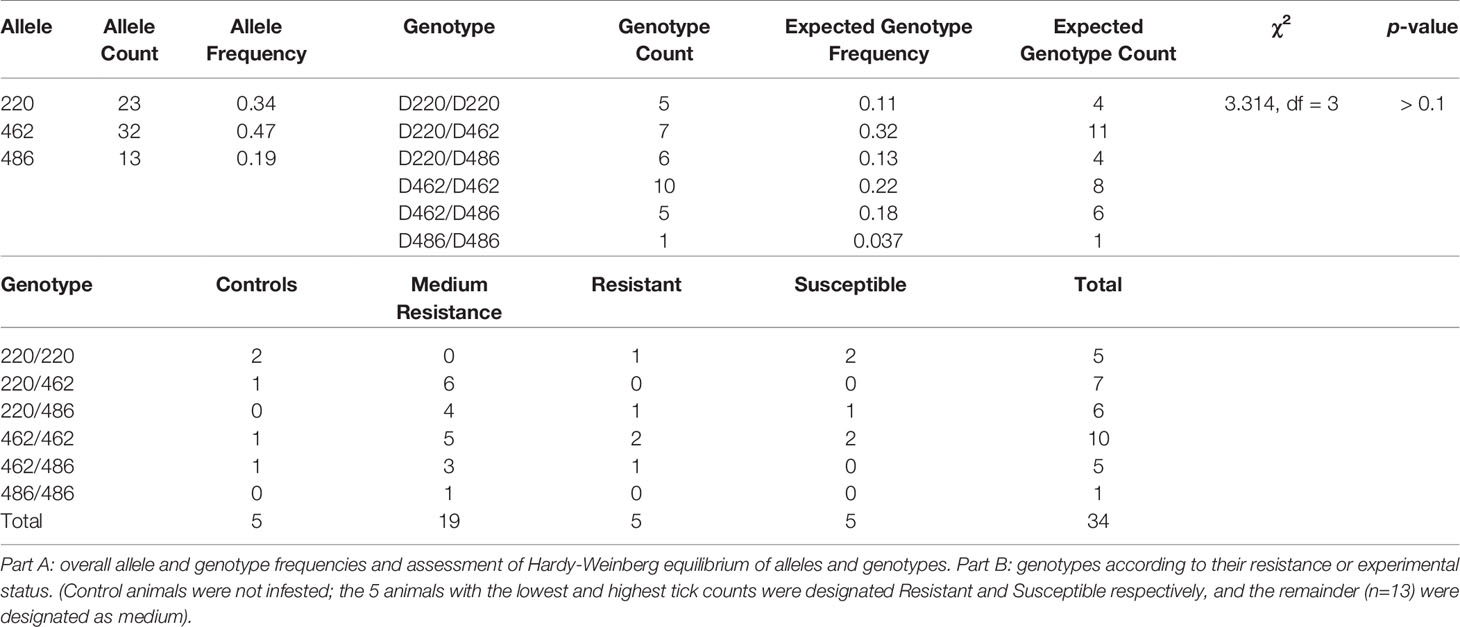
Table 4 PTPRC allele and genotype frequencies.
Neither tick burden nor resistance category was significantly influenced by the PTPRC genotype. Linear regressions of total or median tick count against genotype were not significant (p = 0.46, 0.64, 0.74 for the 222, 462 and 486 genotypes respectively). The GAMs for tick count considered each of 12 weekly timepoints for each of 30 animals, commencing at three weeks after initial infestation. Neither the effect of (smoothed) time nor of dosage of any of the alleles was significant (p > 0.00083, Figure 2 and Table 5).
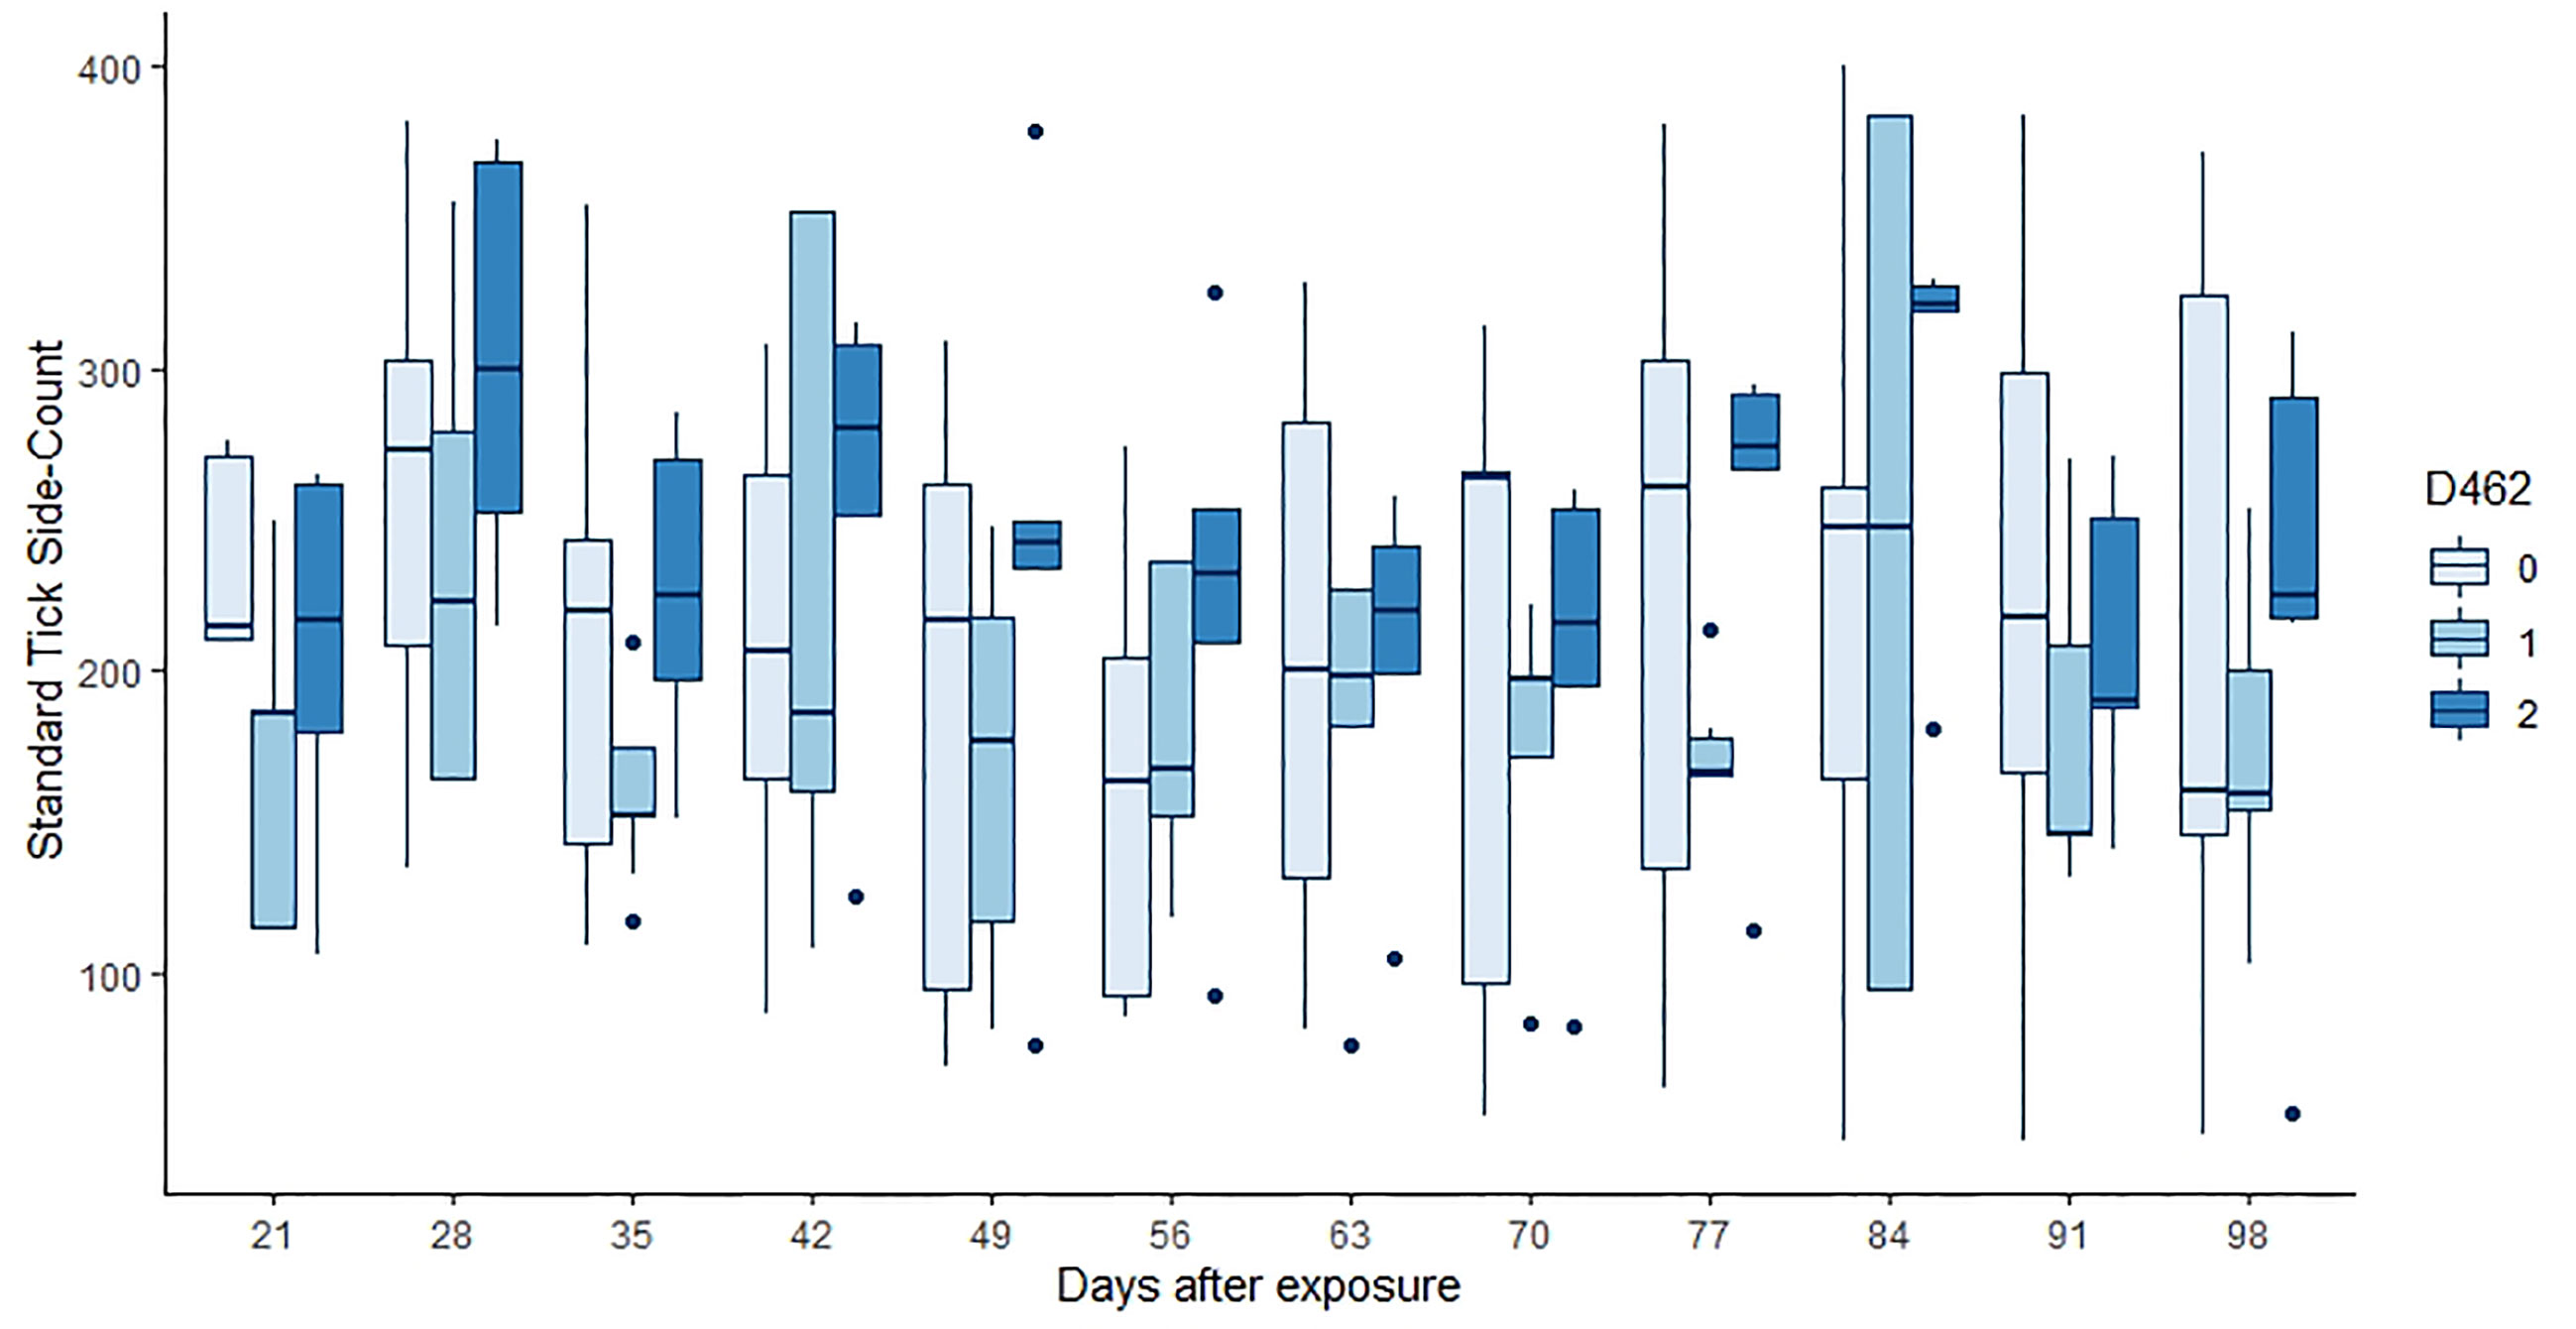
Figure 2 Tick counts by days after exposure, commencing at 21 d post infestation and continuing for 11 weeks. Data for the number of copies of the 462 allele are shown, those animals without the allele in pale blue, and animals that were 462/462 in the darkest blue. Neither the count day nor the allele dose were significant in the GAM (p > 0.00083, Table 5).
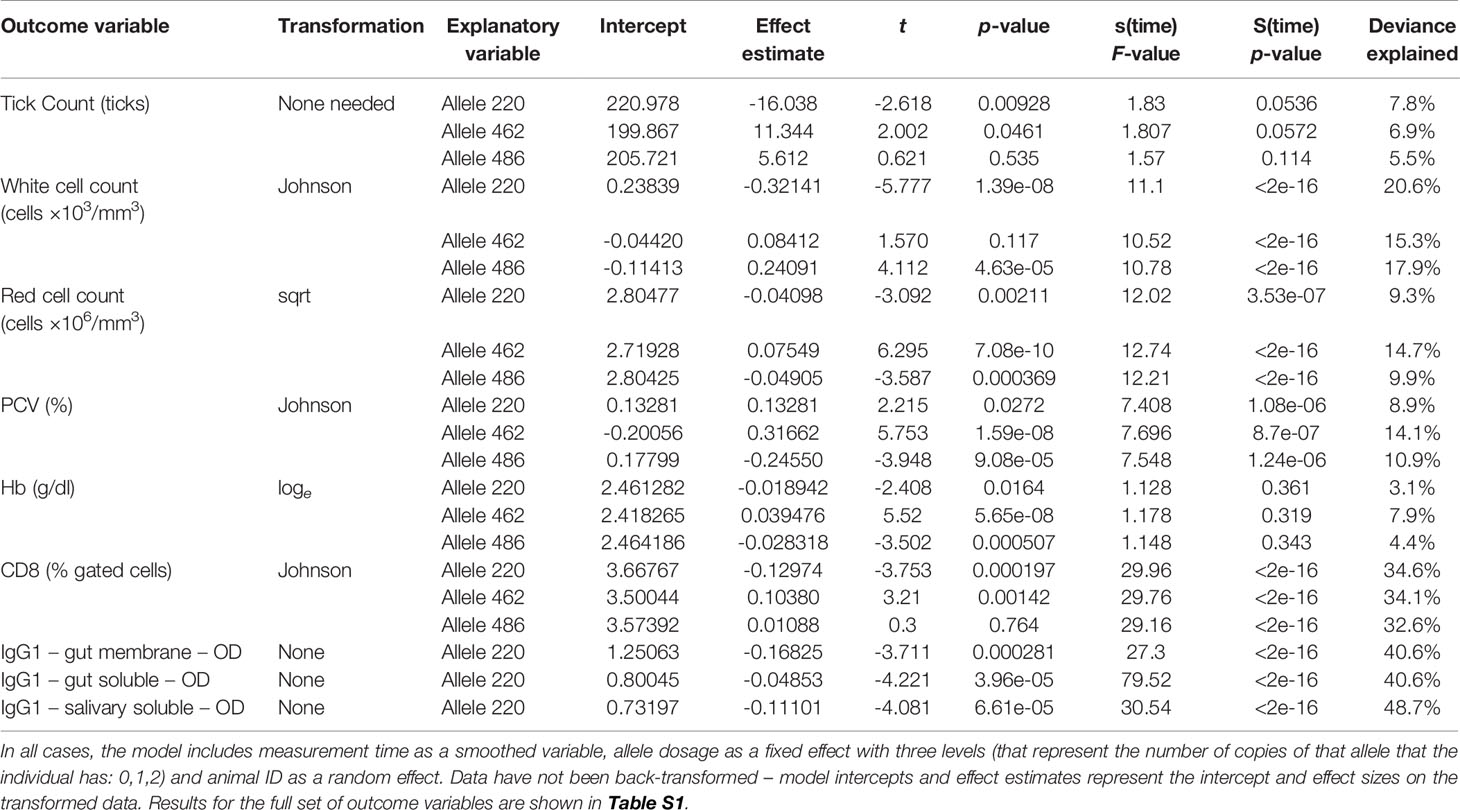
Table 5 Summary of GAM outputs for each of the models for tick count and each of the variables for which the main effect of allele frequency was considered to be statistically significant (p < 0.00083).
Almost all the immunological and haematological assay results were significantly affected by time (Table 5, Table S1 and Figures S1–S3). Only Hb, platelet count and the response to larval soluble Ag did not vary significantly (p > 0.00083) over time. White cell count (WCC) was significantly affected by the doses of alleles 220 and 486. Each dose of allele 220 decreased WCC (p = 7.08 × 10⁻¹⁰), whereas each dose of allele 486 increased WCC (p = 4.63 × 10⁻⁵, Figure 3A). Red cell count (RCC) increased significantly (p = 1.39 × 10⁻⁸, Figure 3B) with each dose of the 462 allele and decreased significantly with each dose of the 486 allele (p = 0.000369). PCV and Hb followed this same pattern of significant increase with each dose of the 462 allele and significant reduction with each dose of the 486 allele (Table 5). For the red blood cell variables, there were distinct response patterns for 462 heterozygotes and 462/462 homozygotes (Figure 4). Among the immunolabelled cells, only CD8+ cells were significantly associated with allele, being reduced in cattle with each additional copy of the 220 allele (p = 0.000197, Figure 5). Immunoglobulin responses were affected by genotype; 220/220 animals had consistently lower IgG1 in response to tick Ag than the 462/462 animals. Most of the models failed to explain a large proportion of the deviance – with the best model explaining 48% and the worst model explaining 4% of the deviance.
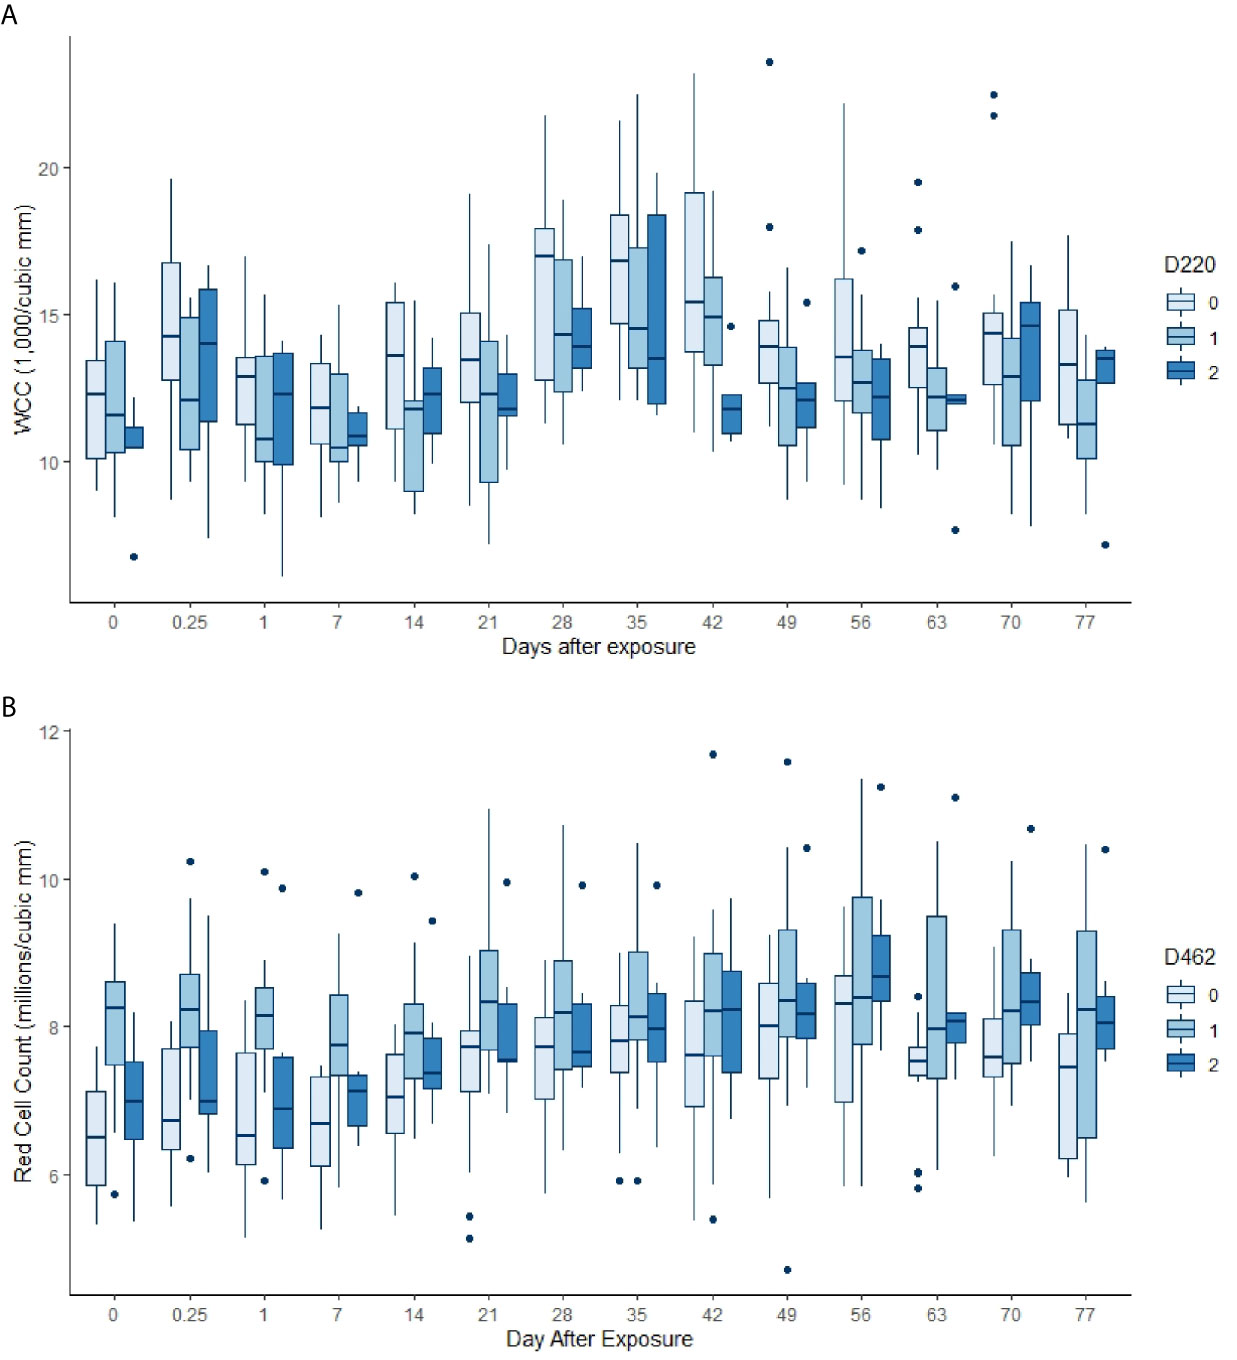
Figure 3 (A) White cell counts by day, commencing pre-infestation and continuing for 11 weeks. Data for the 220 allele are shown, those animals without the allele in palest blue, and animals that were 220/220 in the darkest blue. Both day and the allele dose were highly significant in the GAM (p < 0.00083, Table 5). (B) Red cell counts by day, commencing pre-infestation and continuing for 11 weeks. Data for the 462 allele are shown, those animals without the allele in palest blue, and animals that were 462/462 in the darkest blue. Both day and the allele dose were highly significant terms in the GAM (p < 0.00083, Table 5).
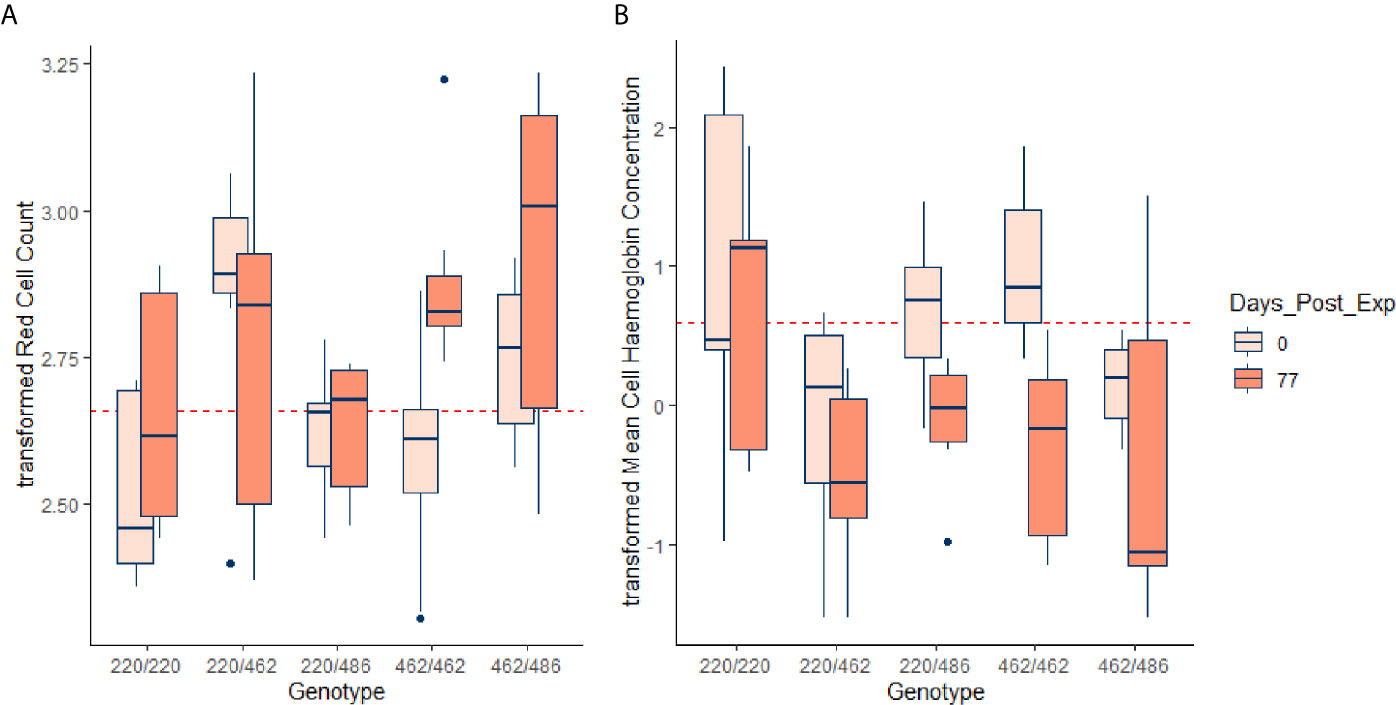
Figure 4 Transformed RCC (tRCC - A) and transformed MCH (tMCH - B) for the initial (pre-infestation) and end (77 d post-infestation) time points, for each of the genotypes. Horizontal dotted lines in red are the mean pre-infestation values for each of the transformed variables. For RCC, the effect of 462 allele dosage was highly significant in the GAM (p < 0.00083, Table 5) but for MCH the effect approached significance (p = 0.00726, Table S1).
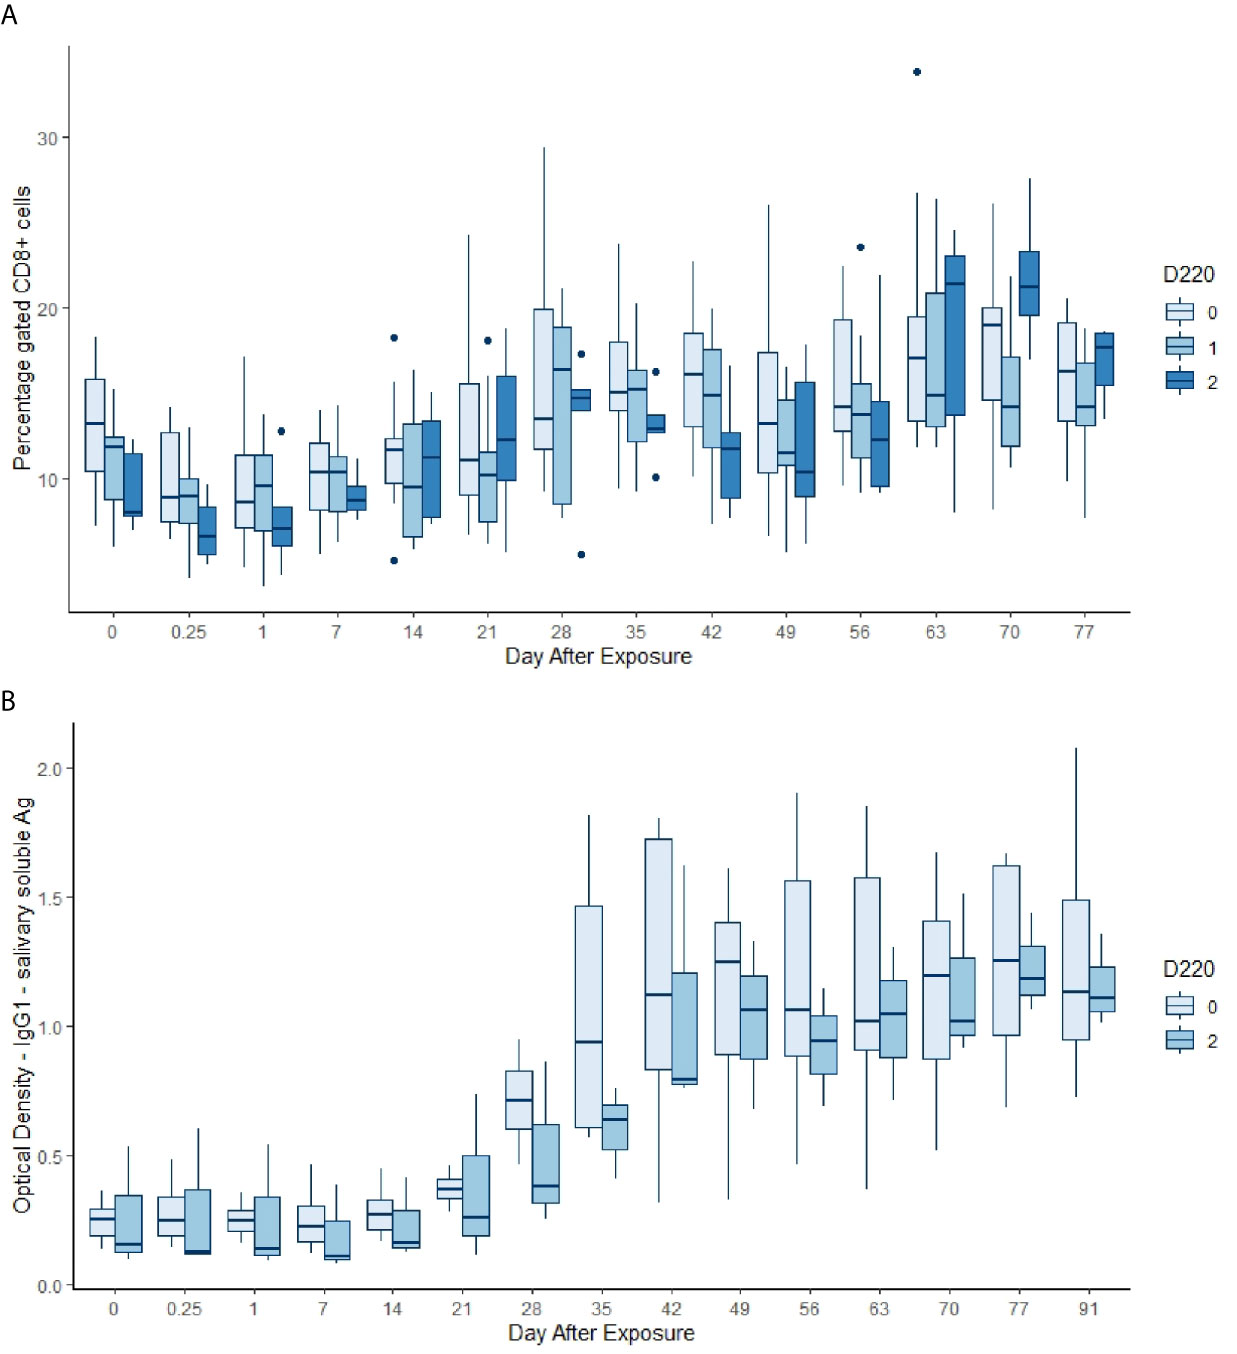
Figure 5 (A) Gated percentage of CD8+ cells by day, commencing pre-infestation and continuing for 11 weeks. Data for the 220 allele are shown, those animals without the allele in palest blue, and animals that were 220/220 in the darkest blue. Both day and the allele dose were highly significant in the GAM (p < 0.00083, Table 5). (B) IgG1 optical density (OD) in response to soluble salivary tick Ag by day, commencing pre-infestation and continuing for 15 weeks. Data for the 220 allele are shown and those animals without the allele (pale blue) are all 462/462 (dark blue). Both day and the genotype were highly significant terms in the GAM (p < 0.00083, Table 5).
The study on which this project is based (10, 11) was intended to contrast local and systemic immune responses and haematology between cattle of high resistance and those of low resistance to tick infestations. An incidental finding of the original studies was that highly resistant animals were less likely to have detectable CD45+ or CD45RO+ cells in skin (10). However, that observation was based on an extreme-group comparison of the 6 most resistant and 6 least resistant animals. In the present study, we genotyped PTPRC (CD45) for all the original animals in the trial and found that although there was no significant relationship between tick count and the dosage of any one of the three differentiable alleles, large differences in erythrocyte, leukocyte and humoral responses were observed among PTPRC genotypes: the indicine Family 2 (462) allele was associated with a more robust erythron; the “taurindicine” Family 1 allele (220) was associated with lower leukocyte count, lower % gated CD8+ cells, and lower IgG1 recognition of tick-specific Ag. Given that these alleles are believed to have tick-resistant and tick-susceptible origins respectively, there is some potential confounding of the apparent allelic effects by alleles at other loci that are in linkage disequilibrium (LD) with them. The Santa Gertrudis breed was selected for this study intentionally to reduce confounding by genetic background. The breed was established in Texas about 100 years ago as a hybrid between B. taurus and B. indicus cattle, so it is expected that over 30-40 generations of breeding LD should have been reduced among the linked genes and eliminated among the unlinked genes. It follows that caution is required in extrapolating from contrasts among the genotypes in this study to contrasts between indicine and taurine animals from previous studies. It cannot be inferred that differences between B. indicus and B. taurus cattle can be attributed to variation in PTPRC genotype, nor that PTPRC genotype is necessarily consistent in populations of B. taurus and B. indicus cattle. Our unpublished sequence and genotyping data suggest that Brahman cattle in Australia are diverse and include members of all four families, whereas Holstein-Friesian cattle seem to be almost exclusively taurine Family 1.
The most pronounced differences among genotypes were in the variables relating to red blood cells. Cattle with the indicine Family 2 allele for PTPRC (462) had higher RCC, PCV and Hb. The Family 2 heterozygotes had significantly higher RCC than the Family 2 homozygotes during the pre-infestation and early infestation periods, but by 11 weeks the homozygote was also high. Similar patterns were noted for PCV and Hb. At the end of the study period, MCH was lowest in Family 2 homozygotes, which, taken with the increase in RCC in these animals, is consistent with a stronger regenerative response to blood loss. Red cell counts have previously been reported to be higher in tick-infested indicine than taurine cattle, in the absence of Babesia and Anaplasma haemoparasites (15), and greater resistance to reduction in erythrocyte counts of B. indicus cattle that have been exposed to Babesia has also been demonstrated (19). All nucleated haematopoietic cells express CD45, the dominant isoforms being RO and RB (3). Although most investigations on CD45 function have focused on immune signalling, it has been shown that CD45 is an important regulator of splenic erythropoiesis (20). Although the bulk of erythropoiesis occurs in the bone marrow, splenic erythropoiesis, supported by red pulp macrophages (RPM) makes an important contribution to the expansion of the erythron in response to diverse stressors including hypoxia, endotoxins, bacterial and viral infections. Mice that are deficient in CD45 show abnormal erythropoiesis and accumulate progenitor forms of erythrocytes (20). It has also been shown that CD45 is a negative regulator of erythropoietin-dependent haematopoiesis through its inhibition of Janus kinase (JAK) signalling pathways (21). Therefore, there are several mechanisms by which variation in CD45 genotype could influence haematopoiesis, and the observations from our study are consistent with the pathogen-driven selection hypothesis advanced by Ballingal et al. (2).
Cattle with the taurine Family 1 (220) allele for PTPRC had lower WCC and lower gated percentages of CD8+ cells (T cytotoxic cells) in circulation. Immunoglobulins specific to three of five tick Ag mixtures differed highly significantly between homozygotes of the Family 1/3 (220) and the Family 2 (462) genotypes. Among the cell proliferation assays conducted in our study, genotype did not have a significant effect, using α corrected for multiple comparisons to 0.00083. However, several of the GAMs estimated p-values approaching this level (Family 1/3 allele 220: p = 0.00174 for ConA stimulation, and p = 0.00181 for larval soluble Ag). Diverse leukocytic responses to tick infestation have been reported in tick-infested cattle of indicine and taurine origins. Rechav (22) reported that Simmental (B. taurus) cattle had higher leukocyte counts than Brahmans (B. indicus) when infested with diverse species of African ticks. We previously found a similar result in a contrast between tick-infested Holstein-Friesian (B. taurus) and Brahman (B. indicus) cattle (15). Immunoglobulin production in response to tick Ag has been shown to differ between taurine and indicine cattle exposed to ticks although the directions of the associations have not been consistent among studies and experimental conditions (15, 23). Rocha Garcia et al. (24) confirmed that there were clear differences between taurine and indicine cattle in their ability to recognize and respond to tick Ag. The lymphoproliferative, phagocytosis and oxidative burst activity of neutrophils and monocytes differs between indicine and taurine cattle, each responding differently to co-culturing with R. microplus salivary gland extract (25). Ramachandra and Wikel (26) found substantial differences in taurine and indicine leukocyte biology – T cells from B. indicus cattle had a stronger proliferative response to ConA and peripheral blood mononuclear cells from B. indicus cattle produced more IL-1 in response to lipopolysaccharide (LPS). Given the many mechanisms by which CD45 is known to modulate leukocyte proliferation and cytokine responses to various stimuli (4, 21), the divergent leukocyte biology evident in animals of the different genotypes in our study is not surprising.
The immunological observations used in our study were selected with a view to better understanding the mechanisms underlying the differences in host resistance to tick infestation rather than for the characterization of the complete immunological phenotypes of animals of each of the PTPRC genotypes. As such, we have an incomplete set of observations on a relatively small dataset of animals that is not balanced by genotype. However, our population does have the advantage of being drawn from a breed in which we expect some of the confounding effects of linkage disequilibrium to have been reduced or eliminated. The effects of CD45 are mediated largely by variation in isoform expression and glycosylation rather than by variable ligand binding or variable enzyme expression, and most of the clinically relevant polymorphisms in humans influence isoform expression (4). At present there is not enough information on the full genomic sequence variants of PTPRC in cattle or isoform expression variants to confidently relate the cattle genotypic families to any studies on human or murine variants of PTPRC. Nonetheless, it seems safe to conclude that variation in PTPRC is likely to contribute to variation in the profiles and functions of leukocytes and erythrocytes of cattle. In human medicine, CD45 isoform expression is used as an important component of clinical immunological profiles (27). In cattle, there are relatively few reports on its application, although it has been used as one of several markers of immune response to mastitis (28) and rumen fluke (29), among others. In our study, PTPRC polymorphism was strongly associated with divergent erythrocytic, leukocytic and humoral responses to tick infestation. The extent to which this might be useful to aid in the selection of adapted cattle will depend on better knowledge of the variants in populations of cattle, the link between polymorphism of PTPRC, form and function of CD45, and possible interactions with other genes.
The raw data supporting the conclusions of this article will be made available by the authors, without undue reservation.
The animal study was reviewed and approved by University of Queensland Animal Ethics - Production and Companion Animals Committee.
NJ – conceived study, coordinated original field work, undertook original field work, undertook data analysis, and drafted paper. DC – undertook genetic analysis. EP – undertook original field work, and conducted laboratory work including immunological assays. EM – undertook genetic analyses. CC – carried out immunological assays. LJ – conceived study, undertook original field work, and undertook immunological assays. MS – contributed to genetic analyses. AT – conceived study, and coordinated original project. All authors contributed to the article and approved the submitted version.
This project was initially funded by the Cooperative Research Centre for Beef Genetic Technologies (Beef CRC). DC was funded by the BBSRC Research Experience Placement Programme (Characterisation of protein tyrosine phosphatase receptor C gene in cattle of divergent phylogeny).
The authors declare that the research was conducted in the absence of any commercial or financial relationships that could be construed as a potential conflict of interest.
Important contributions to the project were made by Laercio Porto Neto, Marie Fox, John Goopy, Tom Connolly, Ralph Stutchbury, Christian Gray, Bronwyn Venus, Sandy Jarrett.
The Supplementary Material for this article can be found online at: https://www.frontiersin.org/articles/10.3389/fimmu.2021.675979/full#supplementary-material
1. Seavitt J, Thomas ML. Cd45. In: Delves PJ, editor. Encyclopedia of Immunology (Second Edition). Oxford: Elsevier (1998).
2. Ballingal KT, Waibochi L, Holmes EC, Woelk CH, MacHugh ND, Lutje V, et al. The CD45 Locus in Cattle: Allelic Polymorphism and Evidence for Exceptional Positive Natural Selection. Immunogenetics (2001) 52:276–83. doi: 10.1007/s002510000276
3. Hermiston ML, Xu Z, Weiss A. CD45: A Critical Regulator of Signaling Thresholds in Immune Cells. Annu Rev Immunol (2003) 21:107–37. doi: 10.1146/annurev.immunol.21.120601.140946
4. Rheinländer A, Schraven B, Bommhardt U. CD45 in Human Physiology and Clinical Medicine. Immunol Lett (2018) 196:22–32. doi: 10.1016/j.imlet.2018.01.009
5. Leitenberg D, Novak TJ, Farber D, Smith BR, Bottomly K. The Extracellular Domain of CD45 Controls Association With the CD4-T Cell Receptor Complex and the Response to Antigen-Specific Stimulation. J Exp Med (1996) 183:249–59. doi: 10.1084/jem.183.1.249
6. Streuli M, Hall LR, Saga Y, Schlossman SF, Saito H. Differential Usage of Three Exons Generates at Least Five Different mRNAs Encoding Human Leukocyte Common Antigens. J Exp Med (1987) 166:1548–66. doi: 10.1084/jem.166.5.1548
7. Tchilian E, Dawes R, Ramaley P, Whitworth J, Yuldasheva N, Wells S, et al. A CD45 Polymorphism Associated With Abnormal Splicing Is Absent in African Populations. Immunogenetics (2002) 53:980–3. doi: 10.1007/s00251-001-0410-z
8. Araujo RN, Padilha T, Zarlenga D, Sonstegard T, Connor EE, Van Tassel C, et al. Use of a Candidate Gene Array to Delineate Gene Expression Patterns in Cattle Selected for Resistance or Susceptibility to Intestinal Nematodes. Vet Parasitol (2009) 162:106–15. doi: 10.1016/j.vetpar.2008.12.017
9. Constantinoiu CC, Jonsson NN, Jorgensen WK, Jackson LA, Piper EK, Lew-Tabor AE. Immuno-Fluorescence Staining Patterns of Leukocyte Subsets in the Skin of Taurine and Indicine Cattle. Res Vet Sci (2013) 95:854–60. doi: 10.1016/j.rvsc.2013.08.014
10. Constantinoiu CC, Lew-Tabor A, Jackson LA, Jorgensen WK, Piper EK, Mayer DG, et al. Local Immune Response to Larvae of Rhipicephalus Microplus in Santa Gertrudis Cattle. Parasite Immunol (2018) 40:e12515. doi: 10.1111/pim.12515
11. Piper EK, Jonsson NN, Gondro C, Vance M, Lew-Tabor A, Jackson LA. Peripheral and Cellular Humoral Responses to Infestation With the Cattle Tick Rhipicephalus Microplus in Santa Gertrudis Cattle. Parasite Immunol (2017) 39(1):e12402. doi: 10.1111/pim.12402
12. Stewart N, Callow L, Duncalfe F. Biological Comparisons Between a Laboratory-Maintained and Recently Isolated Field Strain of Boophilus Microplus. J Parasitol (1982) 68:691–4. doi: 10.2307/3280930
13. Utech KB, Seifert GW, Wharton RH. Breeding Australian Illawarra Shorthorn Cattle for Resistance to Boophilus Microplus: I. Factors Affecting Resistance. Aust J Agric Res (1978) 29:411–22. doi: 10.1071/AR9780411
14. Utech KB, Wharton RH, Kerr JD. Resistance to Boophilus Microplus in Different Breeds of Cattle. Aust J Agric Res (1978) 29:885–95. doi: 10.1071/AR9780885
15. Piper EK, Jonsson NN, Gondro C, Lew-Tabor AE, Moolhuijzen P, Vance ME, et al. Immunological Profiles of Bos Taurus and Bos Indicus Cattle Infested With the Cattle Tick, Rhipicephalus (Boophilus) Microplus. Clin Vaccine Immunol (2009) 16:1074–86. doi: 10.1128/CVI.00157-09
16. R Core Team. R: A Language and Environment for Statistical Computing. Vienna, Austria: R Foundation for Statistical Computing (2018). Available at: https://www.R-project.org/.
17. Wood SN, Pya N, Saefken B. Smoothing Parameter and Model Selection for General Smooth Models (With Discussion). J Am Stat Assoc (2016) 111:1548–75. doi: 10.1080/01621459.2016.1180986
18. Augustin NH, Sauleaub E-A, Wood SN. On Quantile Quantile Plots for Generalized Linear Models. Comp Stat Data Anal (2012) 56(8):2404–3409. doi: 10.1016/j.csda.2012.01.026
19. Bock RE, Kingston TG, de Vos AJ. Effect of Breed of Cattle on Innate Resistance to Infection With Babesia Bovis and B. Bigemina Transmitted by Boophilus Microplus. Aust Vet J (1999) 77:461–4. doi: 10.1111/j.1751-0813.1999.tb12093.x
20. Shim YA, Campbell T, Weliwitigoda A, Dosanjh M, Johnson P. Regulation of CD71(+)TER119(+) Erythroid Progenitor Cells by CD45. Exp Hematol (2020) 86:53–66. doi: 10.1016/j.exphem.2020.05.005
21. Irie-Sasaki J, Sasaki T, Matsumoto W, Opavskyk A, Cheng M, Welstead G, et al. CD45 Is a JAK Phosphatase and Negatively Regulates Cytokine Receptor Signalling. Nature (2001) 409:349–54. doi: 10.1038/35053086
22. Rechav Y. Resistance of Brahman and Hereford Cattle to African Ticks With Reference to Serum Gamma Globulin Levels and Blood Composition. Exp Appl Acarol (1987) 3:219–32. doi: 10.1007/BF01270458
23. Kashino SS, Resende J, Sacco AMS, Rocha C, Proença L, Carvalho, et al. Boophilus Microplus: The Pattern of Bovine Immunoglobulin Isotype Responses to High and Low Tick Infestations. Exp Parasitol (2005) 110:12–21. doi: 10.1016/j.exppara.2005.01.006
24. Rocha Garcia G, Maruyama SR, Nelson KT, Chaves Ribeiro JM, Gardinassi LG, Mendes Maia AA, et al. Immune Recognition of Salivary Proteins From the Cattle Tick Rhipicephalus Microplus Differs According to the Genotype of the Bovine Host. Parasitol Vectors (2017) 10:144. doi: 10.1186/s13071-017-2077-9
25. Turni C, Lee RP, Jackson LA. Effect of Salivary Gland Extracts From the Tick, Boophilus Microplus on Leucocytes From Brahman and Hereford Cattle. Parasitol Immunol (2001) 24:355–61. doi: 10.1046/j.1365-3024.2002.00471.x
26. Ramachandra RN, Wikel SK. Effects of Dermacentor Andersoni (Acari: Ixodidae) Salivary Gland Extracts on Bos Indicus and B. Taurus Lymphocytes and Macrophages: In Vitro Cytokine Elaboration and Lymphocyte Blastogenesis. J Med Entomol (1995) 32:338–45. doi: 10.1093/jmedent/32.3.338
27. Courville EL, Lawrence MG. Characteristic CD45RA/CD45RO Maturation Pattern by Flow Cytometry Associated With the CD45 C77G Polymorphism. Cytometry B Clin Cytom (2021) 1–4. doi: 10.1002/cyto.b.21993
28. Baratta M, Miretti S, Accornero P, Galeati G, Formigoni A, Gabai G, et al. CD49f(+) Mammary Epithelial Cells Decrease in Milk From Dairy Cows Stressed by Overstocking During the Dry Period. J Dairy Res (2017) 84:414–7. doi: 10.1017/S0022029917000589
Keywords: ticks & TBDs, host resistance, immunity, parasite, immunoglobulin, erythron, leukocytes
Citation: Jonsson NN, Cox DK, Piper EK, Valdivieso EFM, Constantinoiu C, Jackson LA, Stear MJ, Ross EM and Tabor AE (2021) Allelic Variation in Protein Tyrosine Phosphatase Receptor Type-C in Cattle Influences Erythrocyte, Leukocyte and Humoral Responses to Infestation With the Cattle Tick Rhipicephalus australis. Front. Immunol. 12:675979. doi: 10.3389/fimmu.2021.675979
Received: 04 March 2021; Accepted: 11 June 2021;
Published: 09 July 2021.
Edited by:
Ricardo Silvestre, University of Minho, PortugalReviewed by:
Felix Ngosa Toka, Ross University School of Veterinary Medicine, Saint Kitts and NevisCopyright © 2021 Jonsson, Cox, Piper, Valdivieso, Constantinoiu, Jackson, Stear, Ross and Tabor. This is an open-access article distributed under the terms of the Creative Commons Attribution License (CC BY). The use, distribution or reproduction in other forums is permitted, provided the original author(s) and the copyright owner(s) are credited and that the original publication in this journal is cited, in accordance with accepted academic practice. No use, distribution or reproduction is permitted which does not comply with these terms.
*Correspondence: Nicholas N. Jonsson, bmljaG9sYXMuam9uc3NvbkBnbGFzZ293LmFjLnVr
Disclaimer: All claims expressed in this article are solely those of the authors and do not necessarily represent those of their affiliated organizations, or those of the publisher, the editors and the reviewers. Any product that may be evaluated in this article or claim that may be made by its manufacturer is not guaranteed or endorsed by the publisher.
Research integrity at Frontiers
Learn more about the work of our research integrity team to safeguard the quality of each article we publish.