 Xueyan Ding
 Yajie Chang1,2,3
 Guoqiang Zhu
- 1College of Veterinary Medicine, Yangzhou University, Yangzhou, China
- 2Jiangsu Co-Innovation Center for Prevention and Control of Important Animal Infectious Diseases and Zoonoses, Yangzhou University, Yangzhou, China
- 3Joint International Research Laboratory of Agriculture and Agri-Product Safety, The Ministry of Education of China, Yangzhou University, Yangzhou, China
- 4Clinical Medical College, Yangzhou University, Yangzhou, China
The neurotransmitter γ-aminobutyric acid (GABA) is known to affect the activation and function of immune cells. This study investigated the role of GABA transporter (GAT)-2 in the differentiation of type 1 helper T (Th1) cells. Naïve CD4+ T cells isolated from splenocytes of GAT-2 knockout (KO) and wild-type (WT) mice were cultured; Th1 cell differentiation was induced and transcriptome and bioinformatics analyses were carried out. We found that GAT-2 deficiency promoted the differentiation of naïve T cells into Th1 cells. RNA sequencing revealed 2984 differentially expressed genes including 1616 that were up-regulated and 1368 that were down-regulated in GAT-2 KO cells compared to WT cells, which were associated with 950 enriched Gene Ontology terms and 33 enriched Kyoto Encyclopedia of Genes and Genomes pathways. Notably, 4 signal transduction pathways (hypoxia-inducible factor [HIF]-1, Hippo, phospholipase D, and Janus kinase [JAK]/signal transducer and activator of transcription [STAT]) and one metabolic pathway (glycolysis/gluconeogenesis) were significantly enriched by GAT-2 deficiency, suggesting that these pathways mediate the effect of GABA on T cell differentiation. Our results provide evidence for the immunomodulatory function of GABA signaling in T cell-mediated immunity and can guide future studies on the etiology and management of autoimmune diseases.
Introduction
Gamma-aminobutyric acid (GABA) is the main inhibitory neurotransmitter in the central nervous system (CNS) of mammals and insects (1–4) and is responsible for regulating homeostasis, hormone secretion, sleep, and aging (5–10). There is increasing evidence that GABA also has an immunomodulatory function (11, 12). For example, GABA participates in T cell-mediated immunity through GABA transporters (GATs) and GABA receptors (11–18). GATs including GAT-1, GAT-2, GAT-3, and betaine/GABA transporter (BGT)-1 transport GABA into cells and reduce extracellular GABA concentration, thus inhibiting GABA signaling (19, 20). The transporters are highly selective Na+/Cl−-dependent glycoproteins that are potential drug targets in various diseases related to dysregulation of GABAergic transmission (12, 13, 21–23). GAT-2 is widely expressed in liver, kidney, lung, testicles, retina, immune cells, and intestinal cells (13).
T helper (Th) cells are key effectors of the adaptive immune response that differentiate into multiple subtypes including type 1 Th (Th1), Th2, Th17, T follicular helper (Tfh), and regulatory T (Treg) cells in response to T cell receptor (TCR) activation by cytokines (24, 25). Different Th cell lineages perform specific biological functions; for example, Th1 cells induce cellular immune responses to intracellular pathogens; Th2 cells participate in the clearance of extracellular pathogens; Th17 cells are involved in autoimmune diseases; and Treg cells inhibit hyperactivated T lymphocytes to maintain immune homeostasis (26–33). Tfh cells are located in lymphoid follicles of lymphatic organs where they secrete interleukin (IL)-21 and induce B cell activation and differentiation (34). Th cell subtypes cooperate to maintain homeostasis and their dysregulation can lead to the development of inflammation and autoimmune diseases (35, 36).
Our previous studies demonstrated that GAT-2 deficiency enhanced Th17 cell differentiation and responses in a mouse model through activation of GABA/mammalian target of rapamycin (mTOR) signaling (37, 38). However, the effect of GAT-2 deficiency on Th1 cell differentiation is unknown. In the present study we addressed this point through GAT-2 loss-of-function experiments using an in vitro model of mouse Th1 cell differentiation. We carried out gene expression profiling of differentiated Th1 cells from GAT-2 knockout (KO) and wild-type (WT) mice by RNA sequencing (RNA-seq)—a widely used high-throughput technique for transcriptome analysis that provides important information on gene expression and activation of signaling pathways (39)—and analyzed the functions of differentially expressed genes (DEGs).
Materials and Methods
Animals and Ethics Statement
Eight-week-old WT C57BL/6J mice (weighing 20 ± 2 g) were obtained from Yangzhou University (Yangzhou, China). GAT-2 KO mice (on a C57BL/6J genetic background) were a gift from Professor Wenkai Ren (South China Agricultural University, Guangzhou, China). The mice were allowed to acclimatize to the laboratory environment for 1 week before experiments, during which time they had free access to food and water. The mice were maintained in an environment with a temperature of 22°C–26°C, relative humidity of 40%–60%, on a 12:12-h light/dark cycle. The experiments complied with institutional animal care guidelines and were approved by the University of Yangzhou Animal Care Committee (no. YZUDWSY2017-0029) (40).
Th1 Cell Preparation and Collection
WT and KO mice were euthanized with sodium pentobarbital (50 mg/kg body weight). The spleen was removed aseptically and passed through a 200-mesh sieve to dissociate the cells, which were centrifuged at 300×g for 7 min. The supernatant was discarded and red blood cell lysis buffer (cat. no. 555899; BD Biosciences; Franklin Lakes, NJ, USA) was added, followed by incubation for 4 min at room temperature. The cells were washed twice with sterile phosphate-buffered saline and centrifuged at 300×g for 5 min to obtain a single-cell suspension. Naïve cluster of differentiation (CD)4+CD62L+ T cells were isolated using a commercial kit (>95% purity, cat. no. 130-106-643; Miltenyi Biotec, Bergisch Gladbach, Germany) and stimulated with the following cytokines and antibodies to induce Th1 cell differentiation: anti-CD3ϵ (5 μg/ml, cat. no. 100313), anti-CD28 (2 μg/ml, cat. no. 102111), and anti–IL-4 (10 μg/ml, cat. no. 504122) antibodies (all from Biolegend, San Diego, CA, USA); and IL-2 (20 ng/ml, cat. no. 212-12-20) and IL-12 (20 ng/ml, cat. no. 210-12-10) (both from Peprotech, Rocky Hill, NJ, USA) at 37°C and 5% CO2. After 2 days, the anti-CD3ϵ and anti-CD28 antibodies were removed and the cells were cultured for another 3 days. At the end of the experiment, the cells were collected and immediately frozen in liquid nitrogen and stored at −80°C until use (38). The proportion of Th1 cells (CD4+ interferon [IFN]-γ+) was analyzed by flow cytometry using the following antibodies: fluorescein isothiocyanate-conjugated anti-mouse CD4 (cat. no. 100406), allophycocyanin (APC)-conjugated anti-mouse IFN-γ (cat. no. 505810), and APC-conjugated rat IgG1, κ isotype control (cat. no. 400412) (all from Biolegend).
Library Generation and RNA-Seq
Total RNA was extracted from cells by adding 1 ml TRIzol reagent (Invitrogen Life Technologies, Carlsbad, CA, USA) and homogenizing the cells on ice. The samples were transferred to room temperature for 5 min before adding 200 μl chloroform for 10 min, followed by centrifugation at 12,000×g for 15 min. The supernatant was combined with 500 μl isopropanol and centrifuged at 12,000×g for 15 min. The RNA was washed with 75% ethanol, centrifuged at 7500×g for 15 min, and dissolved in 30 μl diethyl pyrocarbonate-treated water. RNA concentration was measured using the Qubit RNA Assay Kit on a Qubit 2.0 fluorometer (Invitrogen Life Technologies), and RNA integrity was evaluated with an RNA 6000 Nano Assay Kit on a Bioanalyzer 2100 system (Agilent Technologies, Santa Clara, CA, USA) (41).
mRNA was purified from total RNA samples using oligo (dT)-coupled magnetic beads and sheared into short fragments about 150–200 bp in length that were used as templates for cDNA synthesis. After end repair, A-tails were added to the cDNAs and sequencing adapters were attached. AMPure XP beads were used to screen cDNAs about 200 bp in length for PCR amplification and to purify the PCR products, yielding the final cDNA library. Clustering of the index-coded samples was performed on a cBot Cluster Generation System using the TruSeq PE Cluster Kit v3-cBot-HS (Illumina, San Diego, CA, USA). The constructed libraries were tested with a 2100 BioAnalyzer (Agilent Technologies) and ABI StepOnePlus Real-time PCR System (Applied Biosystems, Foster City, CA, USA) and sequenced with the Illumina Novaseq 6000 platform (42, 43).
Quality Control and Reads Mapping
Raw image data files obtained with the Novaseq 6000 platform were transformed into sequenced reads by base calling using CASAVA software, yielding raw reads; those containing adapters or poly-N content >5% and those of low quality were removed. The high-quality data (clean reads) were saved in FASTQ format and Q20, Q30, and GC content were calculated. We downloaded the reference genome and gene model annotation files from the genome website (44). HISAT2 v2.0.5 (http://daehwankimlab.github.io/hisat2/) was used to construct the reference genome index and compare the paired-end clean reads with the reference genome.
Identification and Functional Annotation of DEGs
The featureCounts program was used to obtain the read count of genes, and reads per kilobases per million mapped reads was used to qualify gene expression to eliminate the effects of gene length and inter-sample differences (45, 46). Differential expression analysis based on a negative binomial distribution was performed using DESeq2 R v1.16.1 software (47). The Benjamini–Hochberg method was used to adjust the P value to control the error detection rate. The adjusted P value was determined with DESeq2 and genes with P<0.05 were identified as DEGs based on |log2(fold change)|>0.0 and P<0.05 (48, 49).
After identifying DEGs, we used Metascape (http://metascape.org) for Gene Ontology (GO) and Kyoto Encyclopedia of Genes and Genomes (KEGG) enrichment analyses. The GO and KEGG pathway enrichment analyses were performed using the clusterProfiler package of R software with correction for gene length bias; GO terms with a corrected P value <0.05 were considered as significantly enriched (50, 51).
Validating DEG Expression by Quantitative Real-Time (qRT)-PCR
In order to validate the transcriptome sequencing results, we selected 16 DEGs for verification by qRT-PCR as previously described (38, 41). Specific primers (Table 1) were designed according to reference sequences in the NCBI database with Primer-BLAST and were synthesized by Tsingke Biotech Co (Beijing, China). Total RNA was extracted using TRIzol reagent and reverse-transcribed into cDNA (KR118-02; Tiangen Biotech, Beijing, China) according to the manufacturer’s protocol. qRT-PCR was carried out on a 7500 Real Time System (Applied Biosystems). The 20-μl reaction contained 10 μl AceQ qPCR SYBR Green Master Mix (Low ROX Premixed) (cat. no. Q131-02; Vazyme, Nanjing, China), 2 μl cDNA template, 0.4 μl forward and reverse primers, and 7.2 μl nuclease-free deionized water. The 2-step method was used for amplification with predenaturation at 95°C for 5 min, followed by 40 cycles of 95°C for 10 s and 60°C for 30 s; and final elongation at 95°C for 15 s, 60°C for 1 min, and 95°C for 15 s. The mRNA expression levels of target genes were calculated with the 2−ΔΔCt method using β-actin as internal reference. All samples were tested in triplicate.
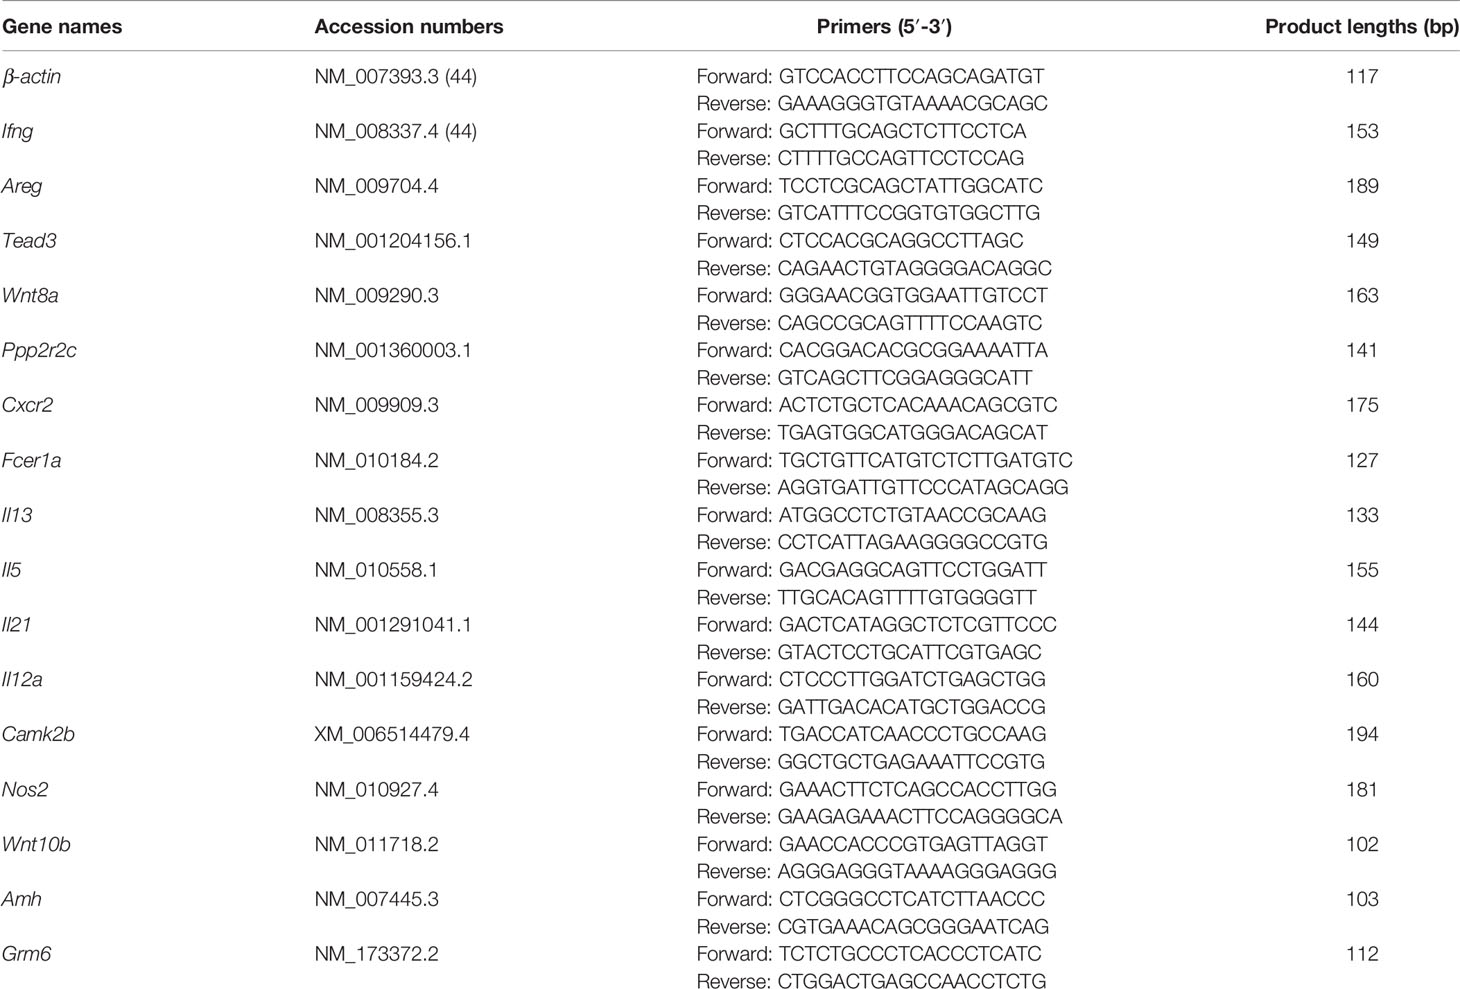
Table 1 Primers used for qRT-PCR analysis.
Statistical Analysis
Data are presented as mean ± standard deviation and were analyzed using Prism v6.0 software (GraphPad, La Jolla, CA, USA). The unpaired t test was used for data that conformed to a Gaussian distribution and had equal variance, and the unpaired t test with Welch’s correction was used for data that followed a Gaussian distribution but showed unequal variance. Data that were non-normally distributed were analyzed with the nonparametric Mann–Whitney U test. P<0.05 was considered significant for all tests.
Results
GAT-2 Deficiency Promoted Th1 Cell Differentiation
We investigated the effect of GAT-2 deficiency on Th1 cell differentiation using naïve CD4+ T cells from WT and GAT-2 KO mice cultured in the presence of specific cytokines and antibodies. A larger percentage of Th1 cells were differentiated from CD4+ T cells from KO mice as compared to WT mice (Figure 1), indicating that GAT-2 deficiency enhanced Th1 cell differentiation.
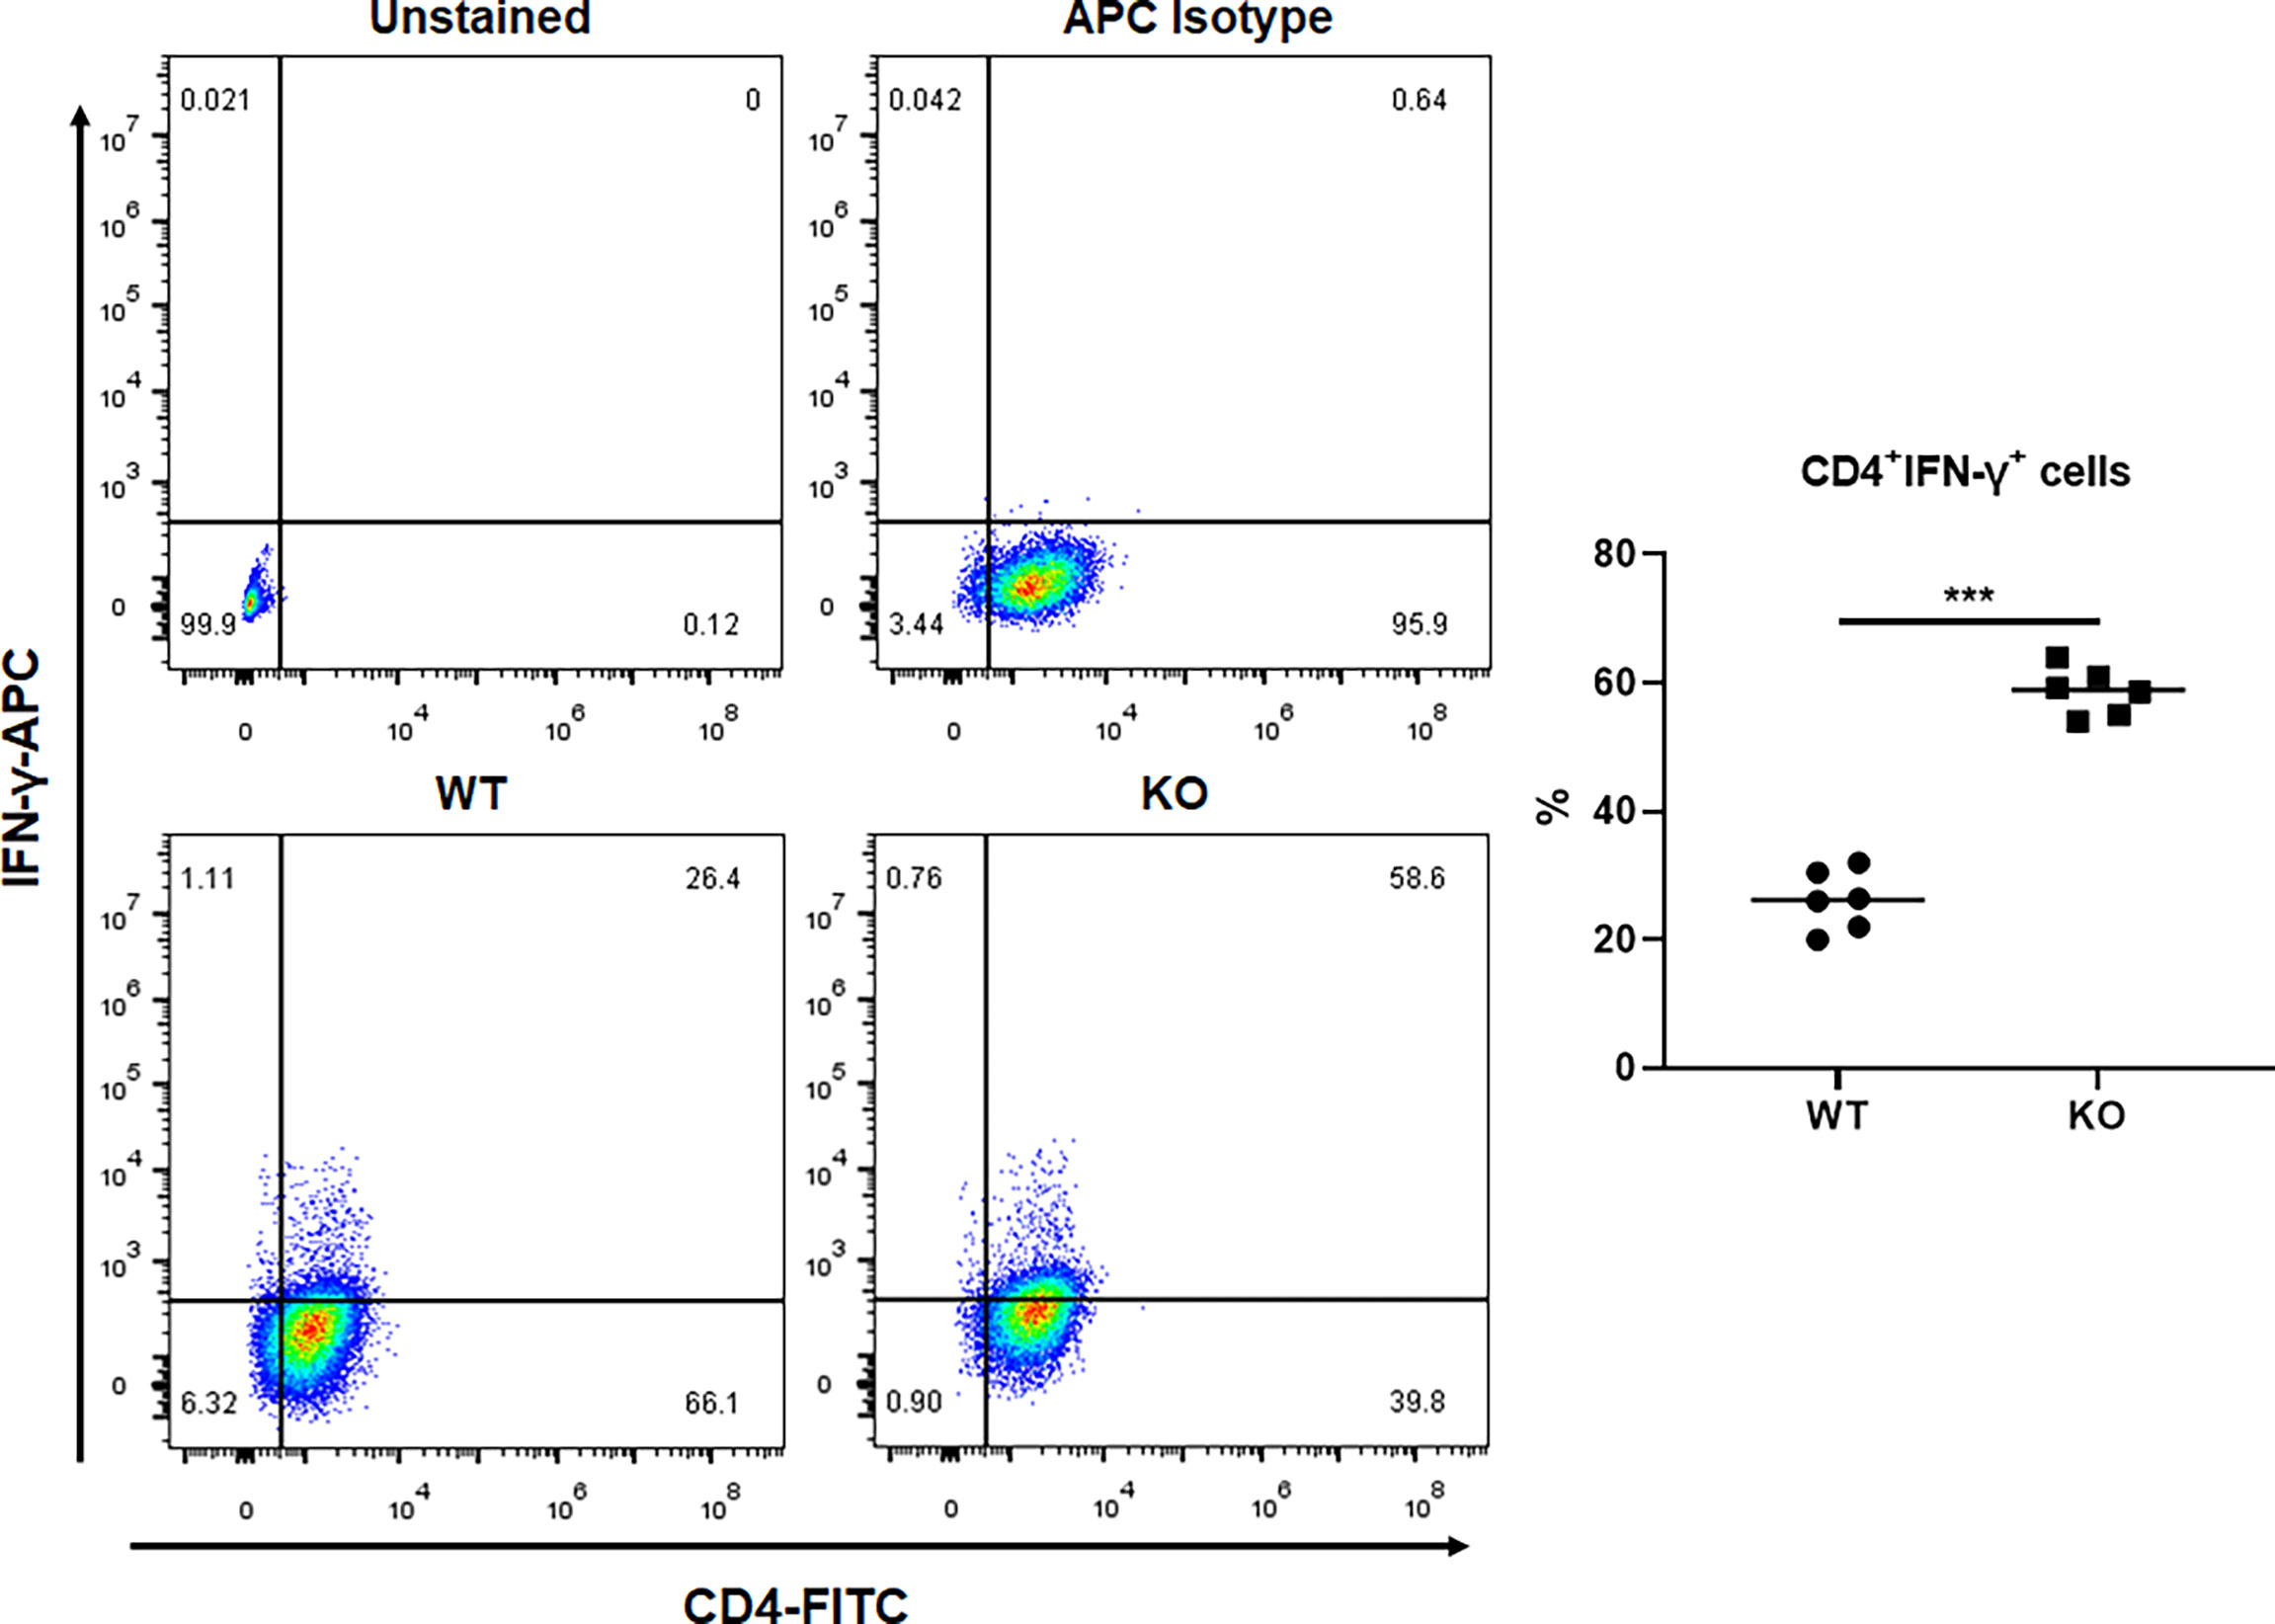
Figure 1 Flow cytometry analysis of percentages of Th1 cells differentiated from WT and KO naïve CD4+ T cells. Data were analyzed by unpaired t-test and shown as the means ± SD (n=6). ***P <0.001.
Sequencing and Transcriptome Assembly
After constructing qualified libraries, RNA-seq was performed using the Illumina platform. WT and GAT-2 KO RNA libraries obtained by RNA-seq contained 51,920,523 and 52,155,649 short reads, respectively (Table 2). After filtering out low-quality data, 50,143,129 and 50,335,423 clean reads, respectively, were retained for a total of 7.52 Gb and 7.55 Gb clean bases, respectively. An analysis of the GC content of the sequences showed that the libraries were of excellent quality.
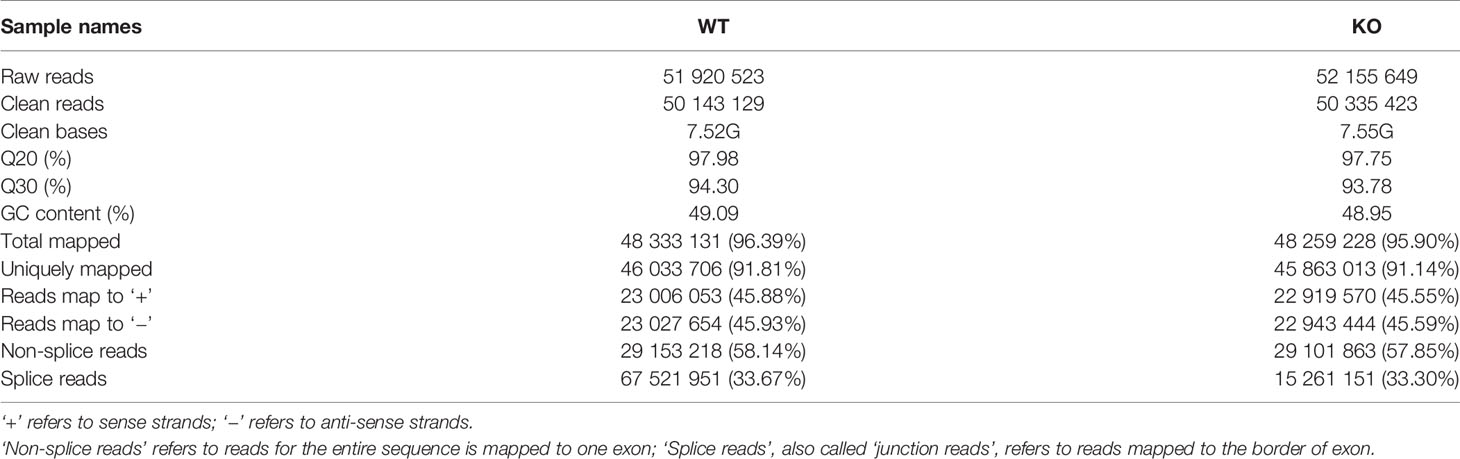
Table 2 Principal features of tags in two libraries and data of sequencing reads mapping to the reference genome.
Mapping Reads to the Transcriptome
As sequenced fragments were randomly interrupted, clean reads were mapped to the reference genome to identify the corresponding genes. Most of the clean reads (96.39% and 95.90% in WT and KO libraries, respectively) matched the reference genome, and a large portion could be uniquely mapped to the Mus musculus genome including 46,033,706 (91.81%) and 45,863,013 (91.14%) reads in the WT and KO libraries, respectively (Table 2). Moreover, in each sample nearly 58% of clean reads were unspliced. These data demonstrated that the genome assembly of our samples was relatively complete and was consistent with the reference genome, and that there was no sample contamination during the experiments.
Differential Expression Analysis
After gene expression quantification was completed, the data needed to be statistically analyzed to screen the genes with significantly different expression levels between WT and KO groups. We screened genes with significantly different expression levels between the 2 groups based on the criteria |log2(fold change)|>0.0 and P<0.05. There were 2984 DEGs between the WT and KO groups including 1616 that were up-regulated and 1368 that were down-regulated in the KO group compared to the WT group (Figure 2). The full list of DEGs was shown in Supplementary Table 1.
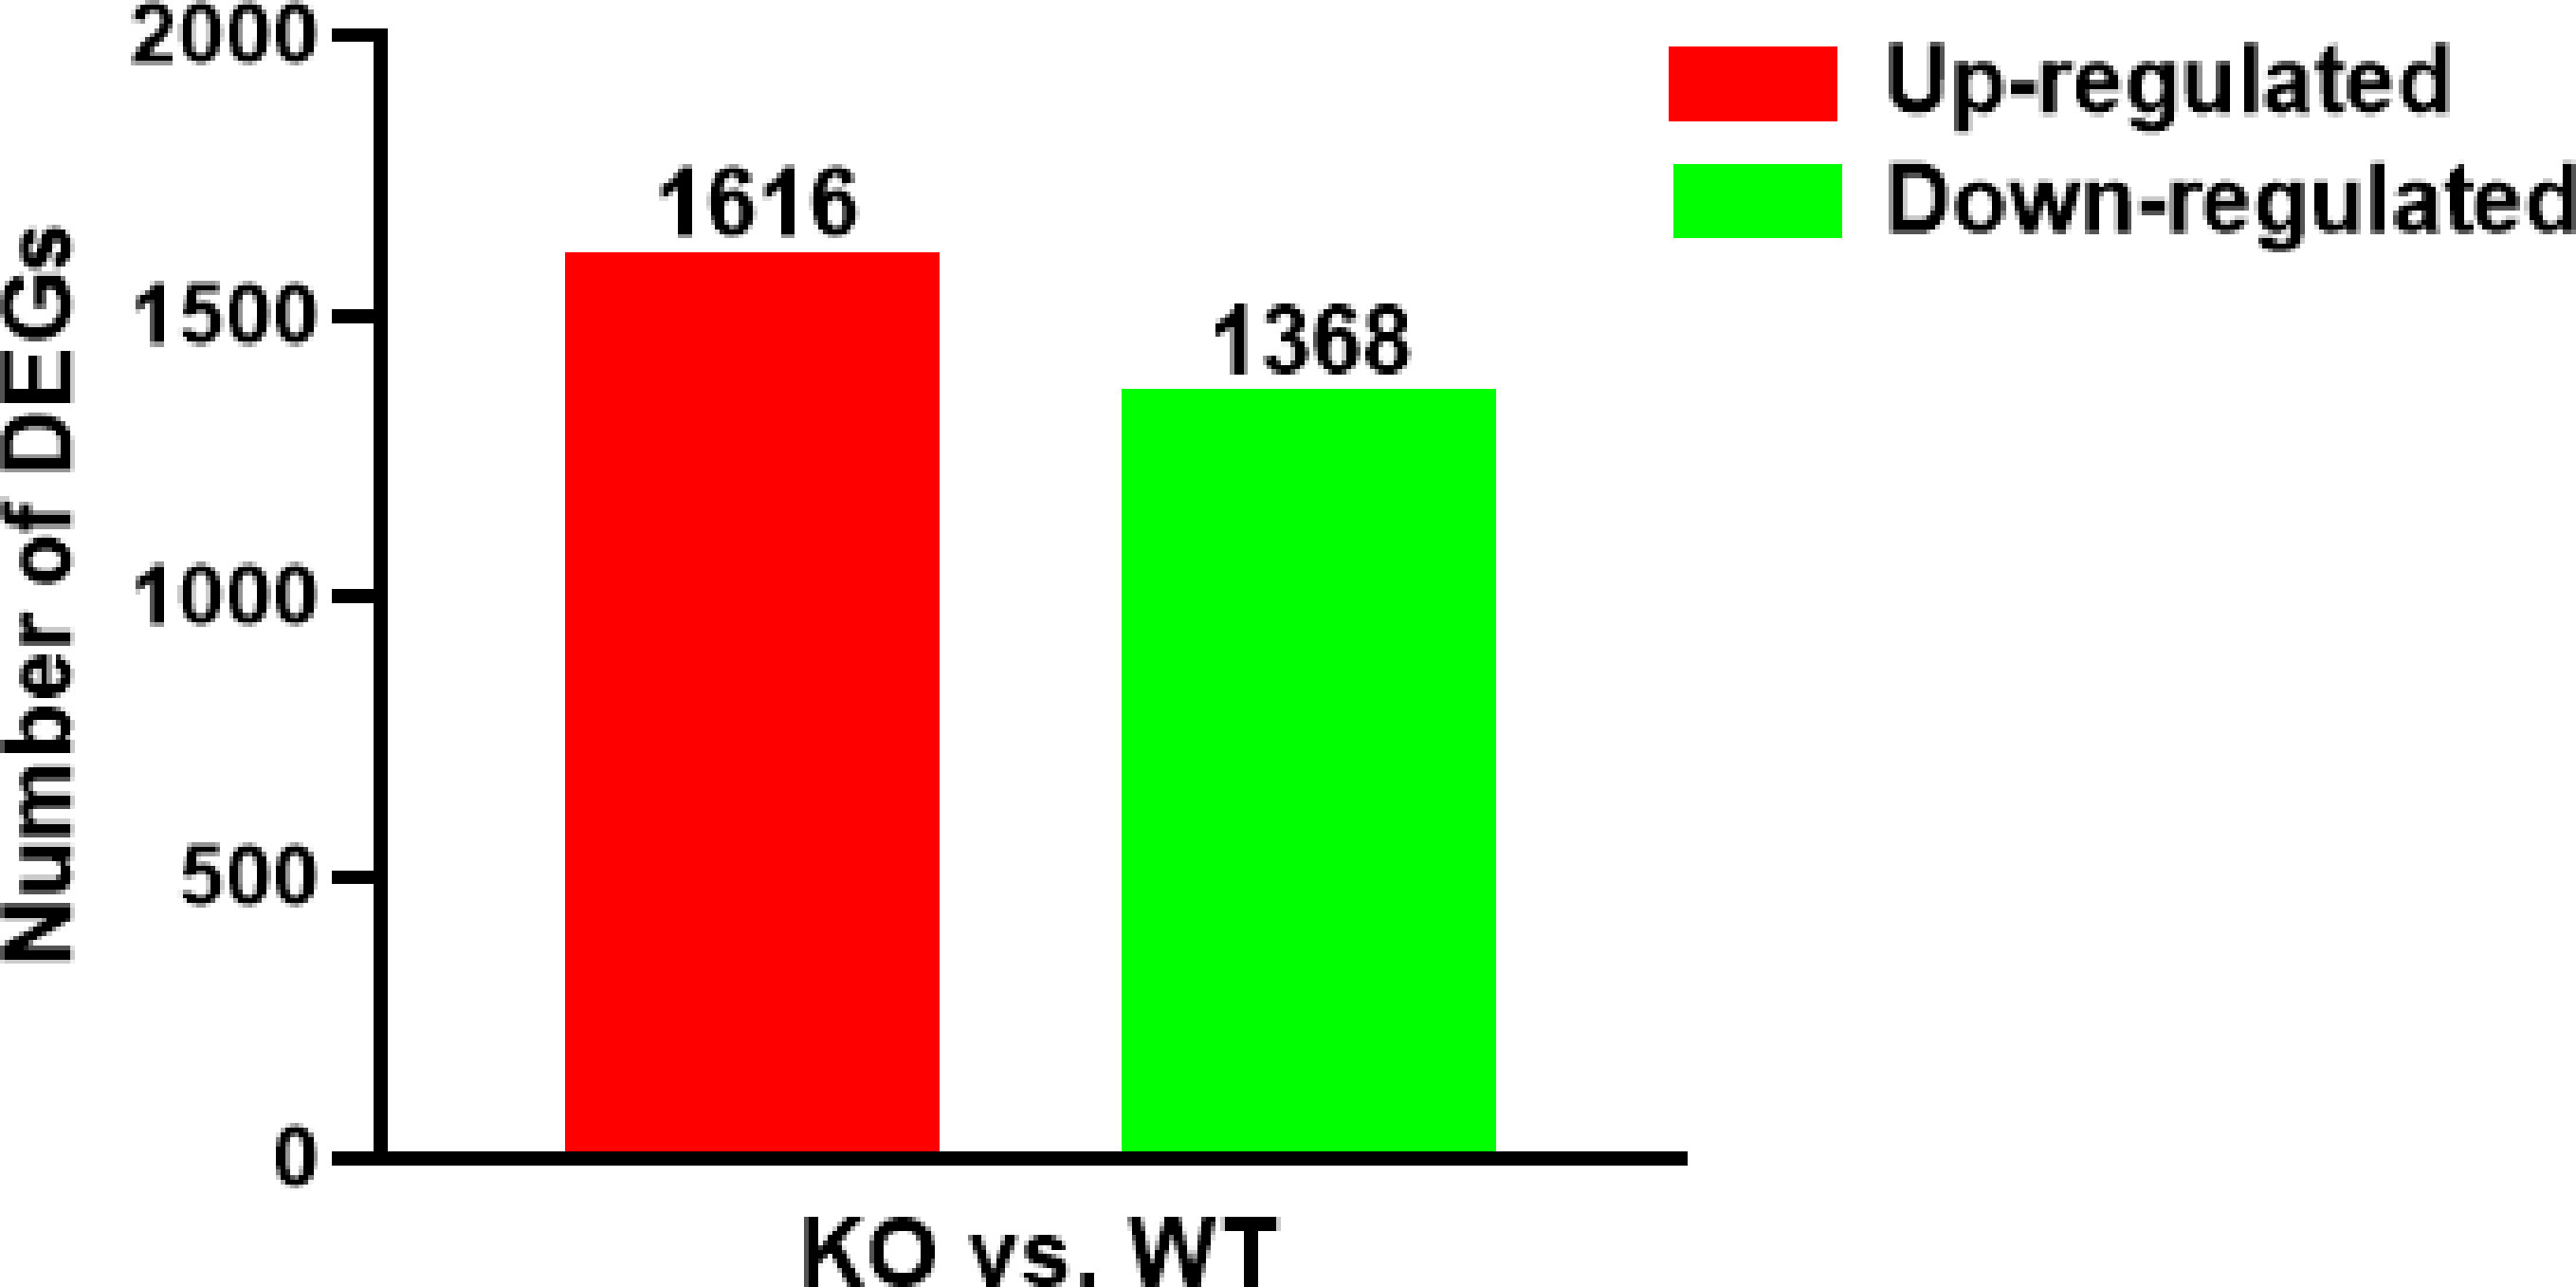
Figure 2 Numbers of up-/down-regulated DEGs in two contrasts (KO vs WT). The red bars represented genes that were up-regulated in KO compared to WT, while the green bars represented genes that were down-regulated.
Functional Enrichment Analysis of DEGs
Through the enrichment analysis of differential gene sets, the biological functions and pathways deriving from DEGs under different conditions can be identified. Therefore, we carried out GO functional enrichment analysis and KEGG pathway enrichment analysis via Metascape (http://metascape.org) to identify the associated biological functions or pathways. In the GO analysis, gene functions were divided into 3 categories—namely, biological process (BP), cellular component (CC), and molecular function (MF). The threshold value for significant enrichment of a GO term was P<0.05. The top 30 most highly enriched GO terms in KO vs WT groups included adaptive immune response, T cell activation, cytokine receptor activity and other terms (Figure 3); the full list was shown in Supplementary Table 2. We also identified 33 significantly enriched KEGG pathways in the KO group vs the WT group. The top 20 are shown in Figure 4; these included Th1 and Th2 cell differentiation, Janus kinase (JAK)/STAT signaling, cytokine–cytokine receptor interaction, etc. Detailed information on the significantly enriched KEGG pathways was shown in Supplementary Table 3.
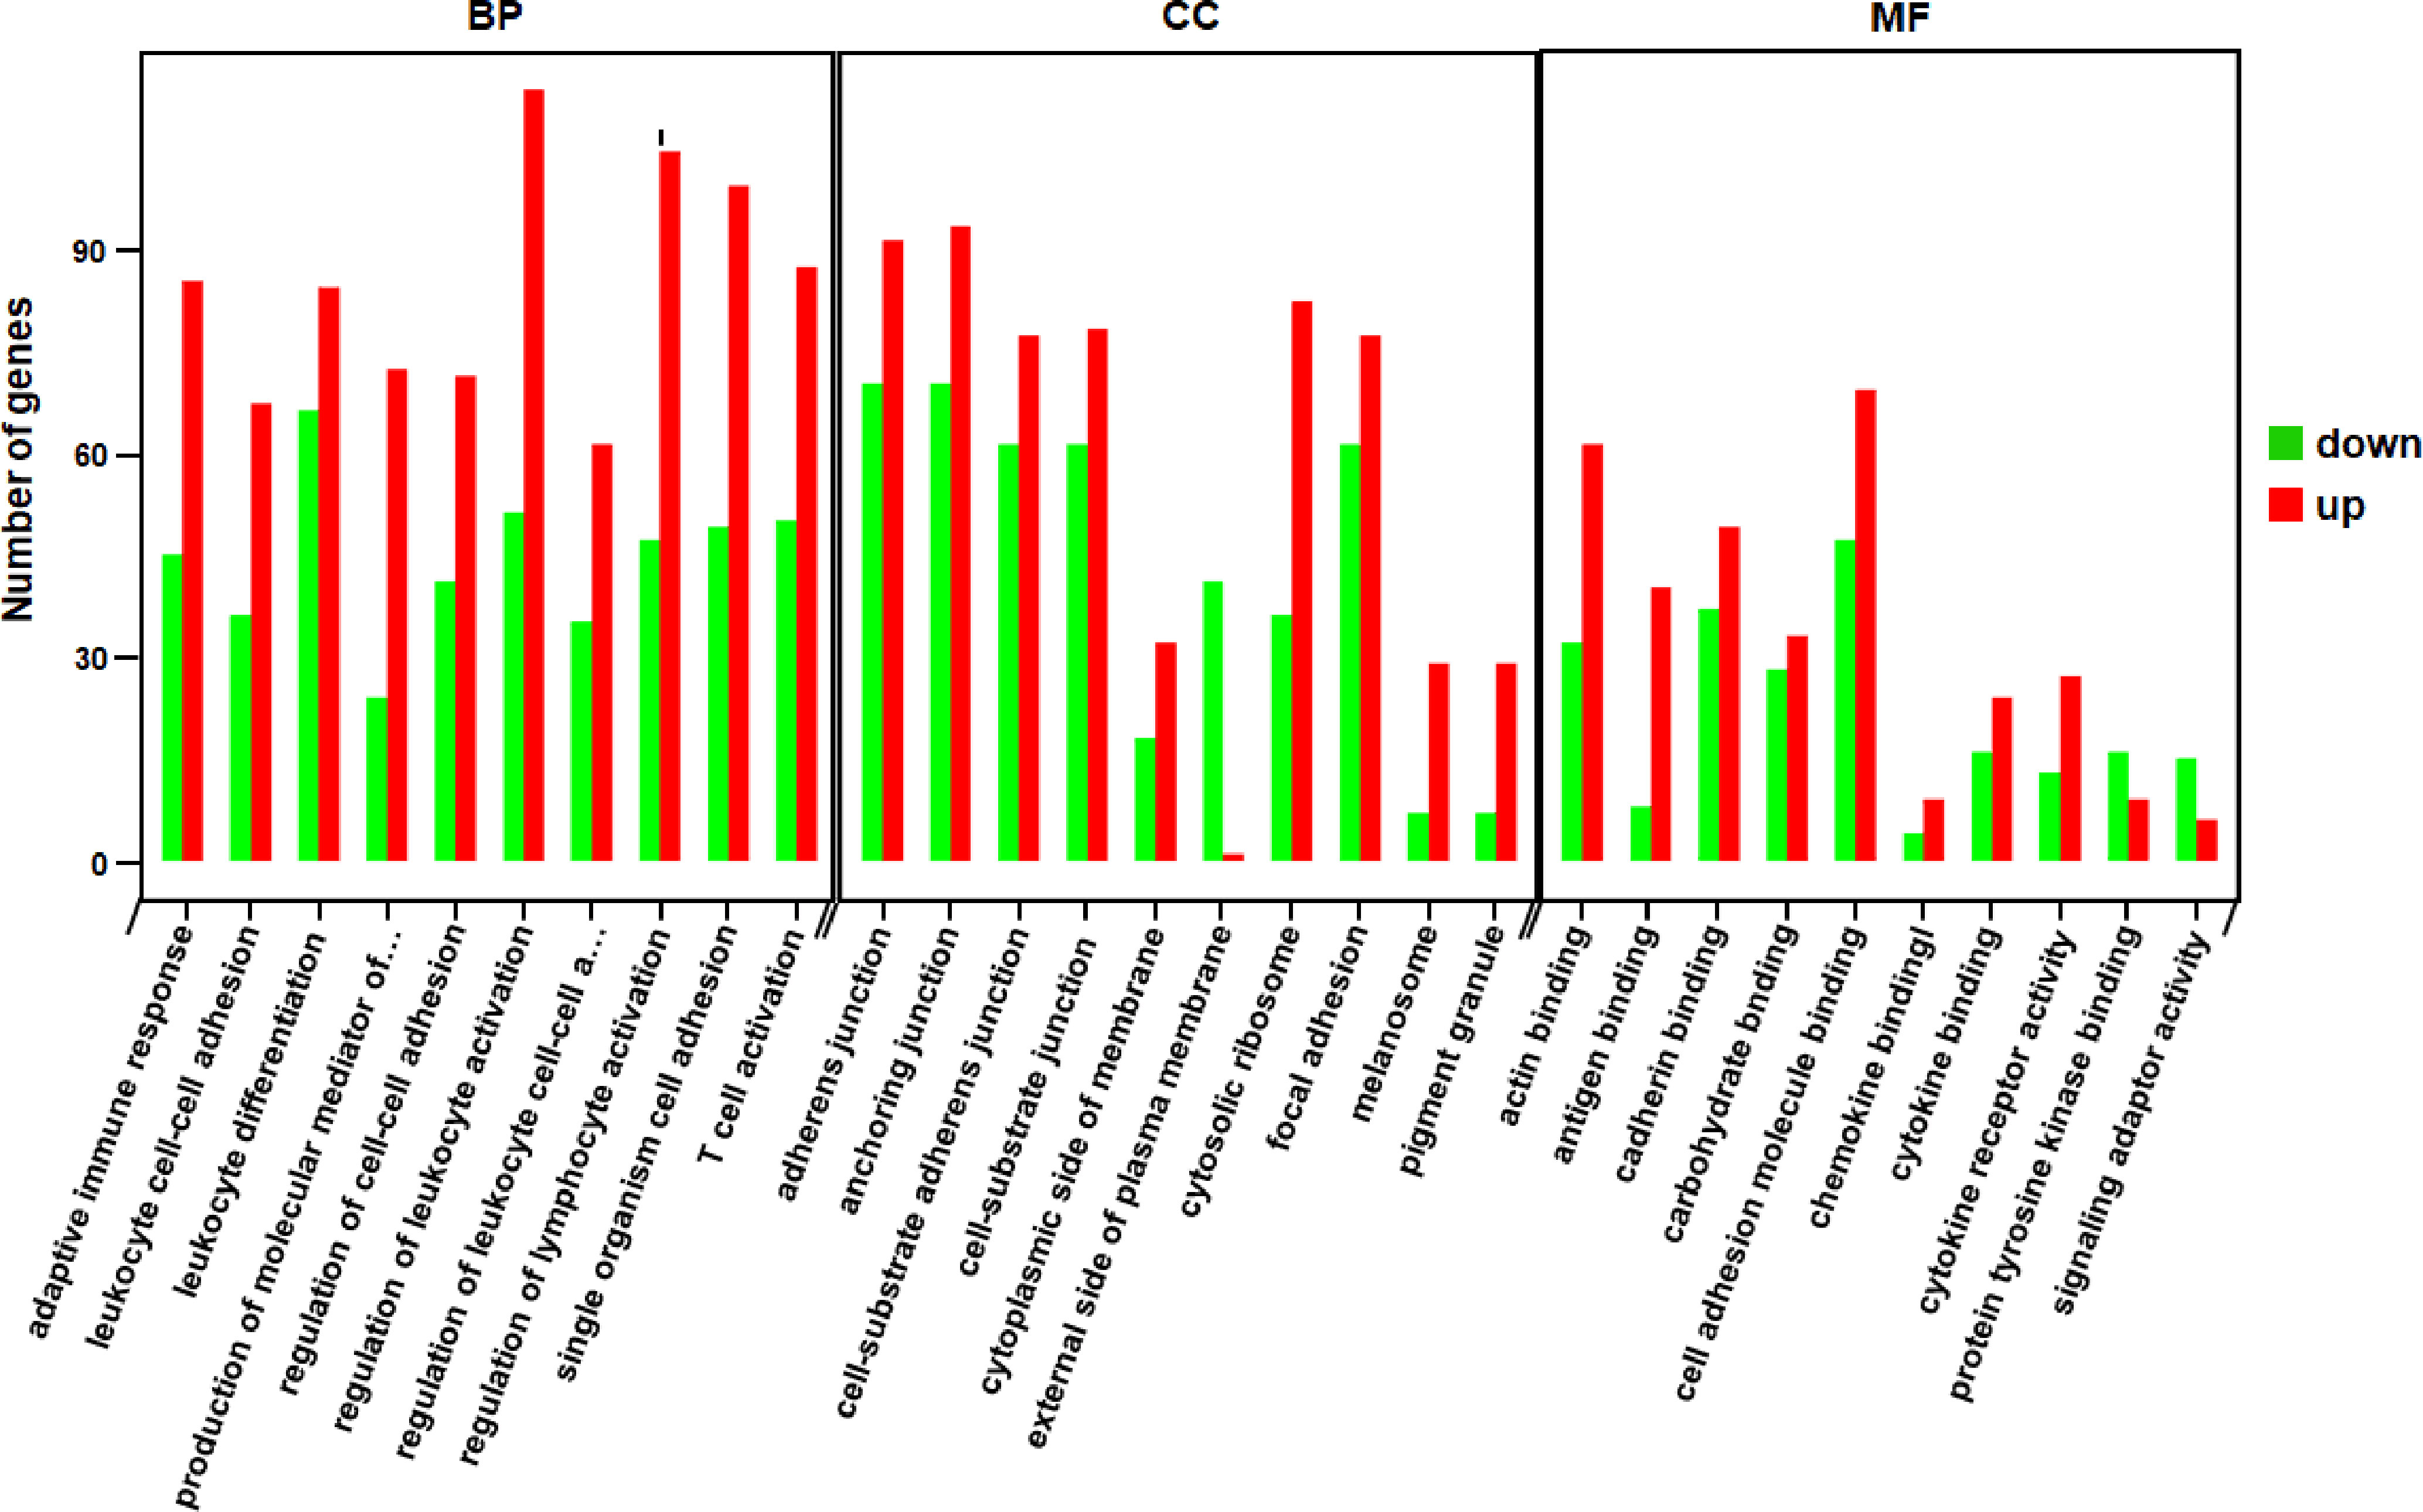
Figure 3 Functional GO categories of DEGs (KO vs WT). The red bars represented the number of genes that were up-regulated in KO compared to WT, while the green bars represented the number of genes that were down-regulated. BP, biological process; CC, cellular component; MF, molecular function.
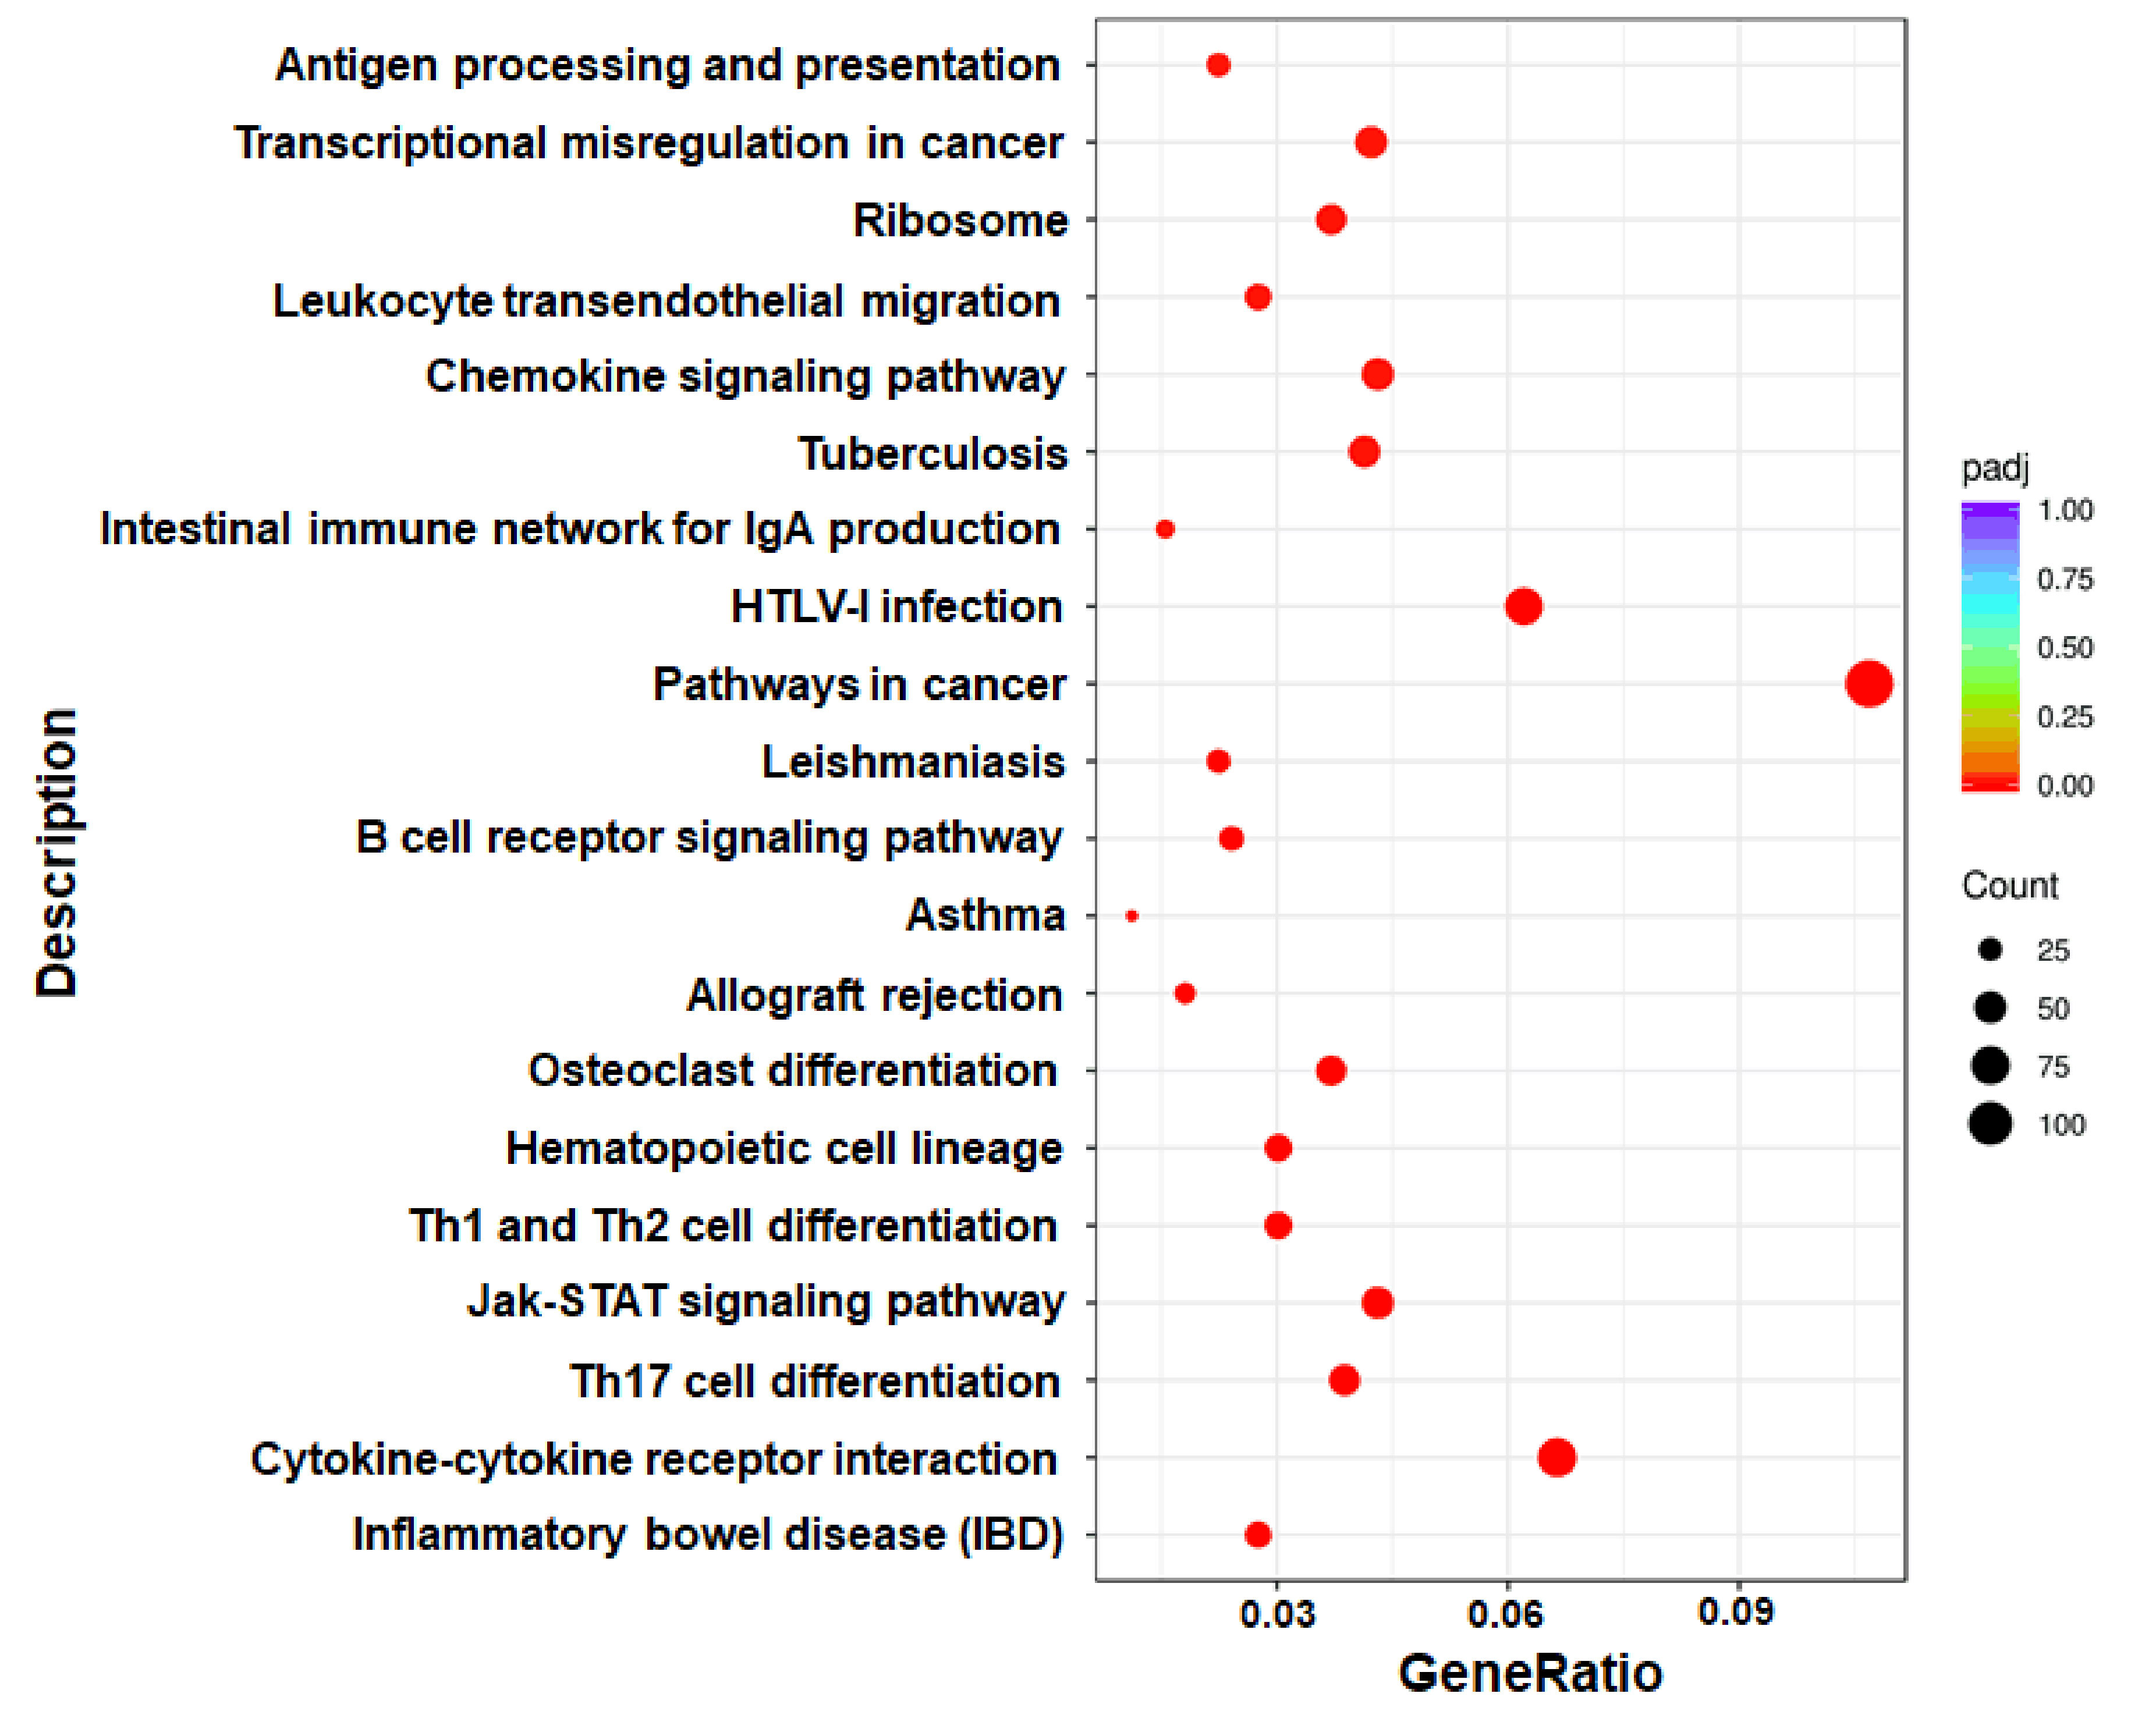
Figure 4 Scatter plot of DEGs enriched in KEGG pathways (KO vs WT). The GeneRatio represents the ratio of the number of DEGs to the number of all the unigenes in the pathway; the padj value represents the corrected P-value.
Signal Transduction Pathways Related to Th1 Cell Differentiation
Signal transduction usually refers to the process that cells receive external signals through cell surface receptors, and then transfer the extracellular signals into intracellular signals through cascading transmission mechanism, and finally trigger a series of biochemical reactions inside the cells. It is now known that there are a variety of signal transduction pathways in cells to form a complex network, which can change the cellular metabolic process, thus affecting the growth and death rate of cells. Therefore, elucidating the mechanism of cell signal transduction is helpful to understand various aspects of cell proliferation, differentiation, metabolism and death. In this study, in order to find out the signal transduction pathways that regulate the differentiation process of Th1 cells, we investigated the signal transduction pathways that mediate the effect of GAT-2 deficiency on Th1 cell differentiations identified by KEGG pathway analysis (Figure 5). We found that four signal transduction pathways, including “HIF-1 signaling pathway”, “Hippo signaling pathway”, “Phospholipase D signaling pathway”, and “Jak-STAT signaling pathway”, were significantly enriched (P<0.05), which suggested that the signal transduction system of Th1 cells was significantly altered after GAT-2 deficiency.
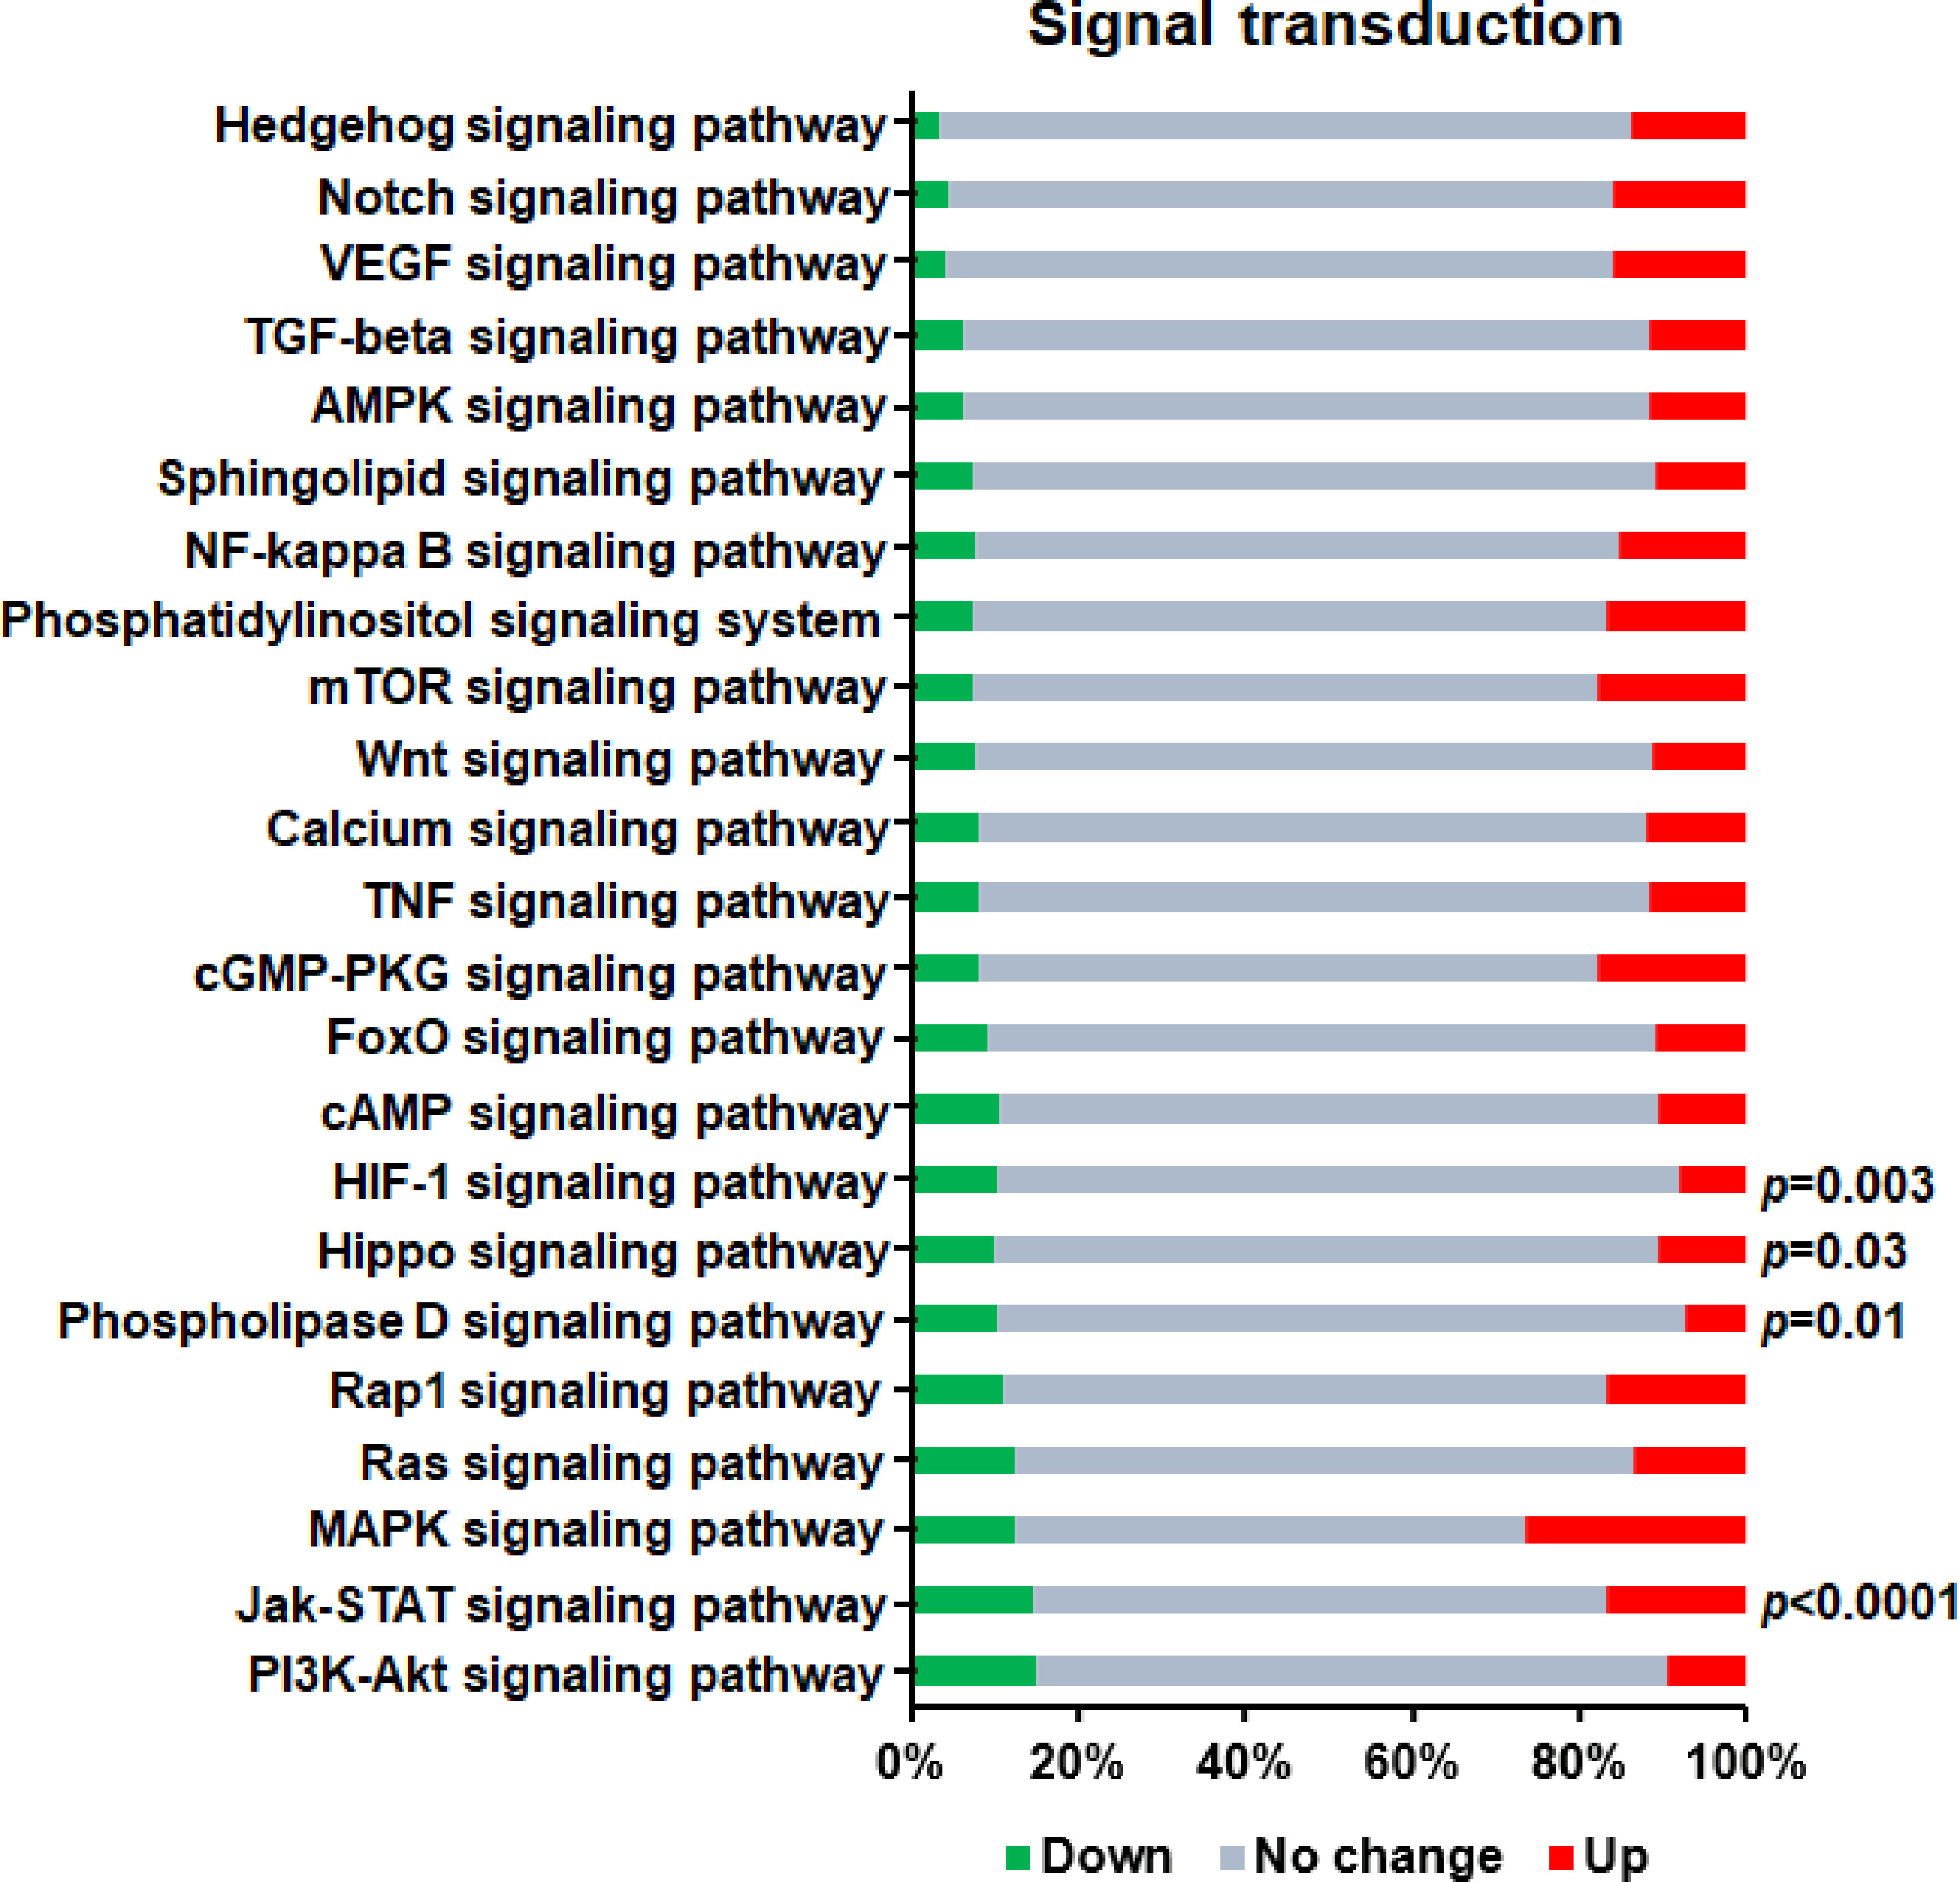
Figure 5 KEGG enrichment analysis of DEGs in signal transduction pathways related to Th1 cell differentiation. Red bars represent up-regulated genes, green bars represent down-regulated genes, and gray bars represent unchanged genes.
Metabolic Processes Related to Th1 Cell Differentiation
Cell metabolism is the general term for the ordered series of chemical reactions that take place in cells to maintain growth, proliferation and ability responding to the environment. Considering that after a gene is knocked out, changes in all aspects of the cell tend to occur simultaneously. Therefore, we also analyzed the intracellular metabolic processes related to Th1 cell differentiation and found only one significantly enriched KEGG pathway (P<0.05) (Figure 6)—namely, glycolysis/gluconeogenesis, which is an important aspect of carbohydrate metabolism and is involved in cellular growth, proliferation, and differentiation.
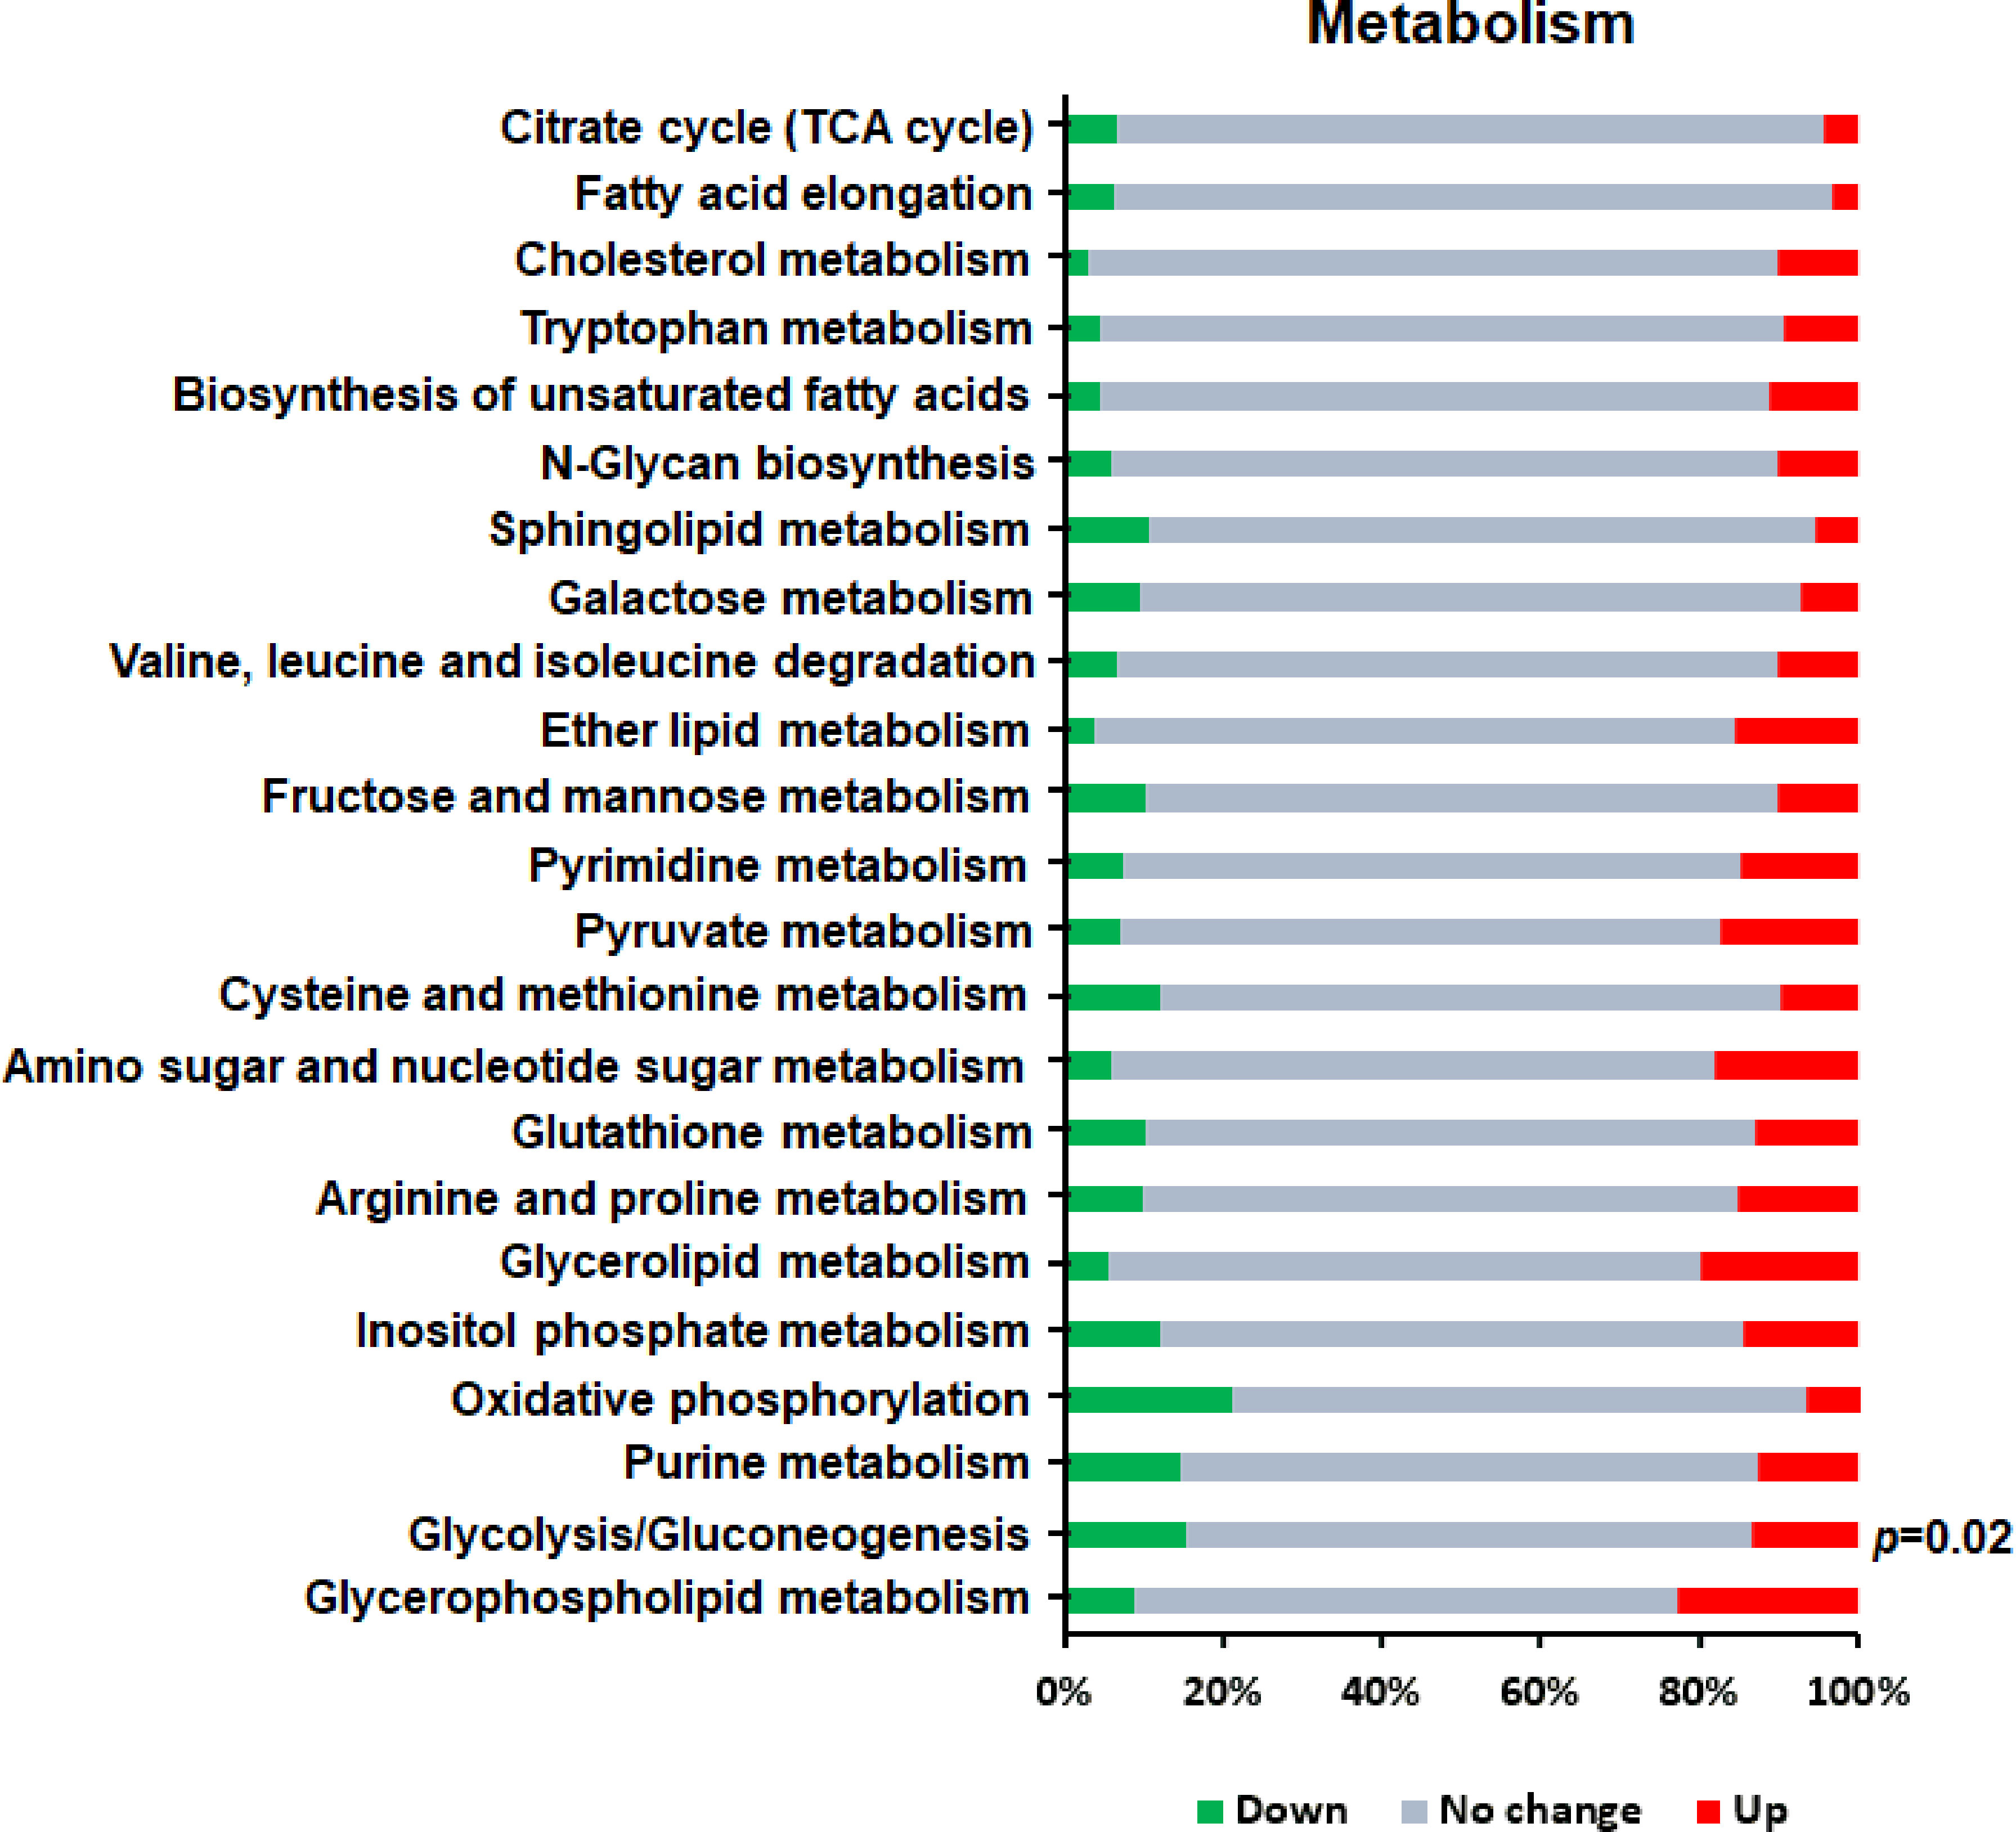
Figure 6 KEGG enrichment analysis of DEGs in metabolism related to Th1 cell differentiation. Red bars represent up-regulated genes, green bars represent down-regulated genes, and gray bars represent unchanged genes.
Validation of DEGs Related to Signal Transduction and Metabolism by QRT-PCR
To validate the reliability of RNA-seq analysis, we randomly selected 16 DEGs for validation by qRT-PCR (Table 1) and found that all of the genes showed consistent expression between the qRT-PCR and RNA-seq analyses, except for the gene encoding IL-21 (Figure 7). And there were strong correlations between qRT-PCR and RNA-seq results and the Pearson correlation coefficients (R2) was 0.984, which confirmed the reliability and accuracy of the transcriptome data.
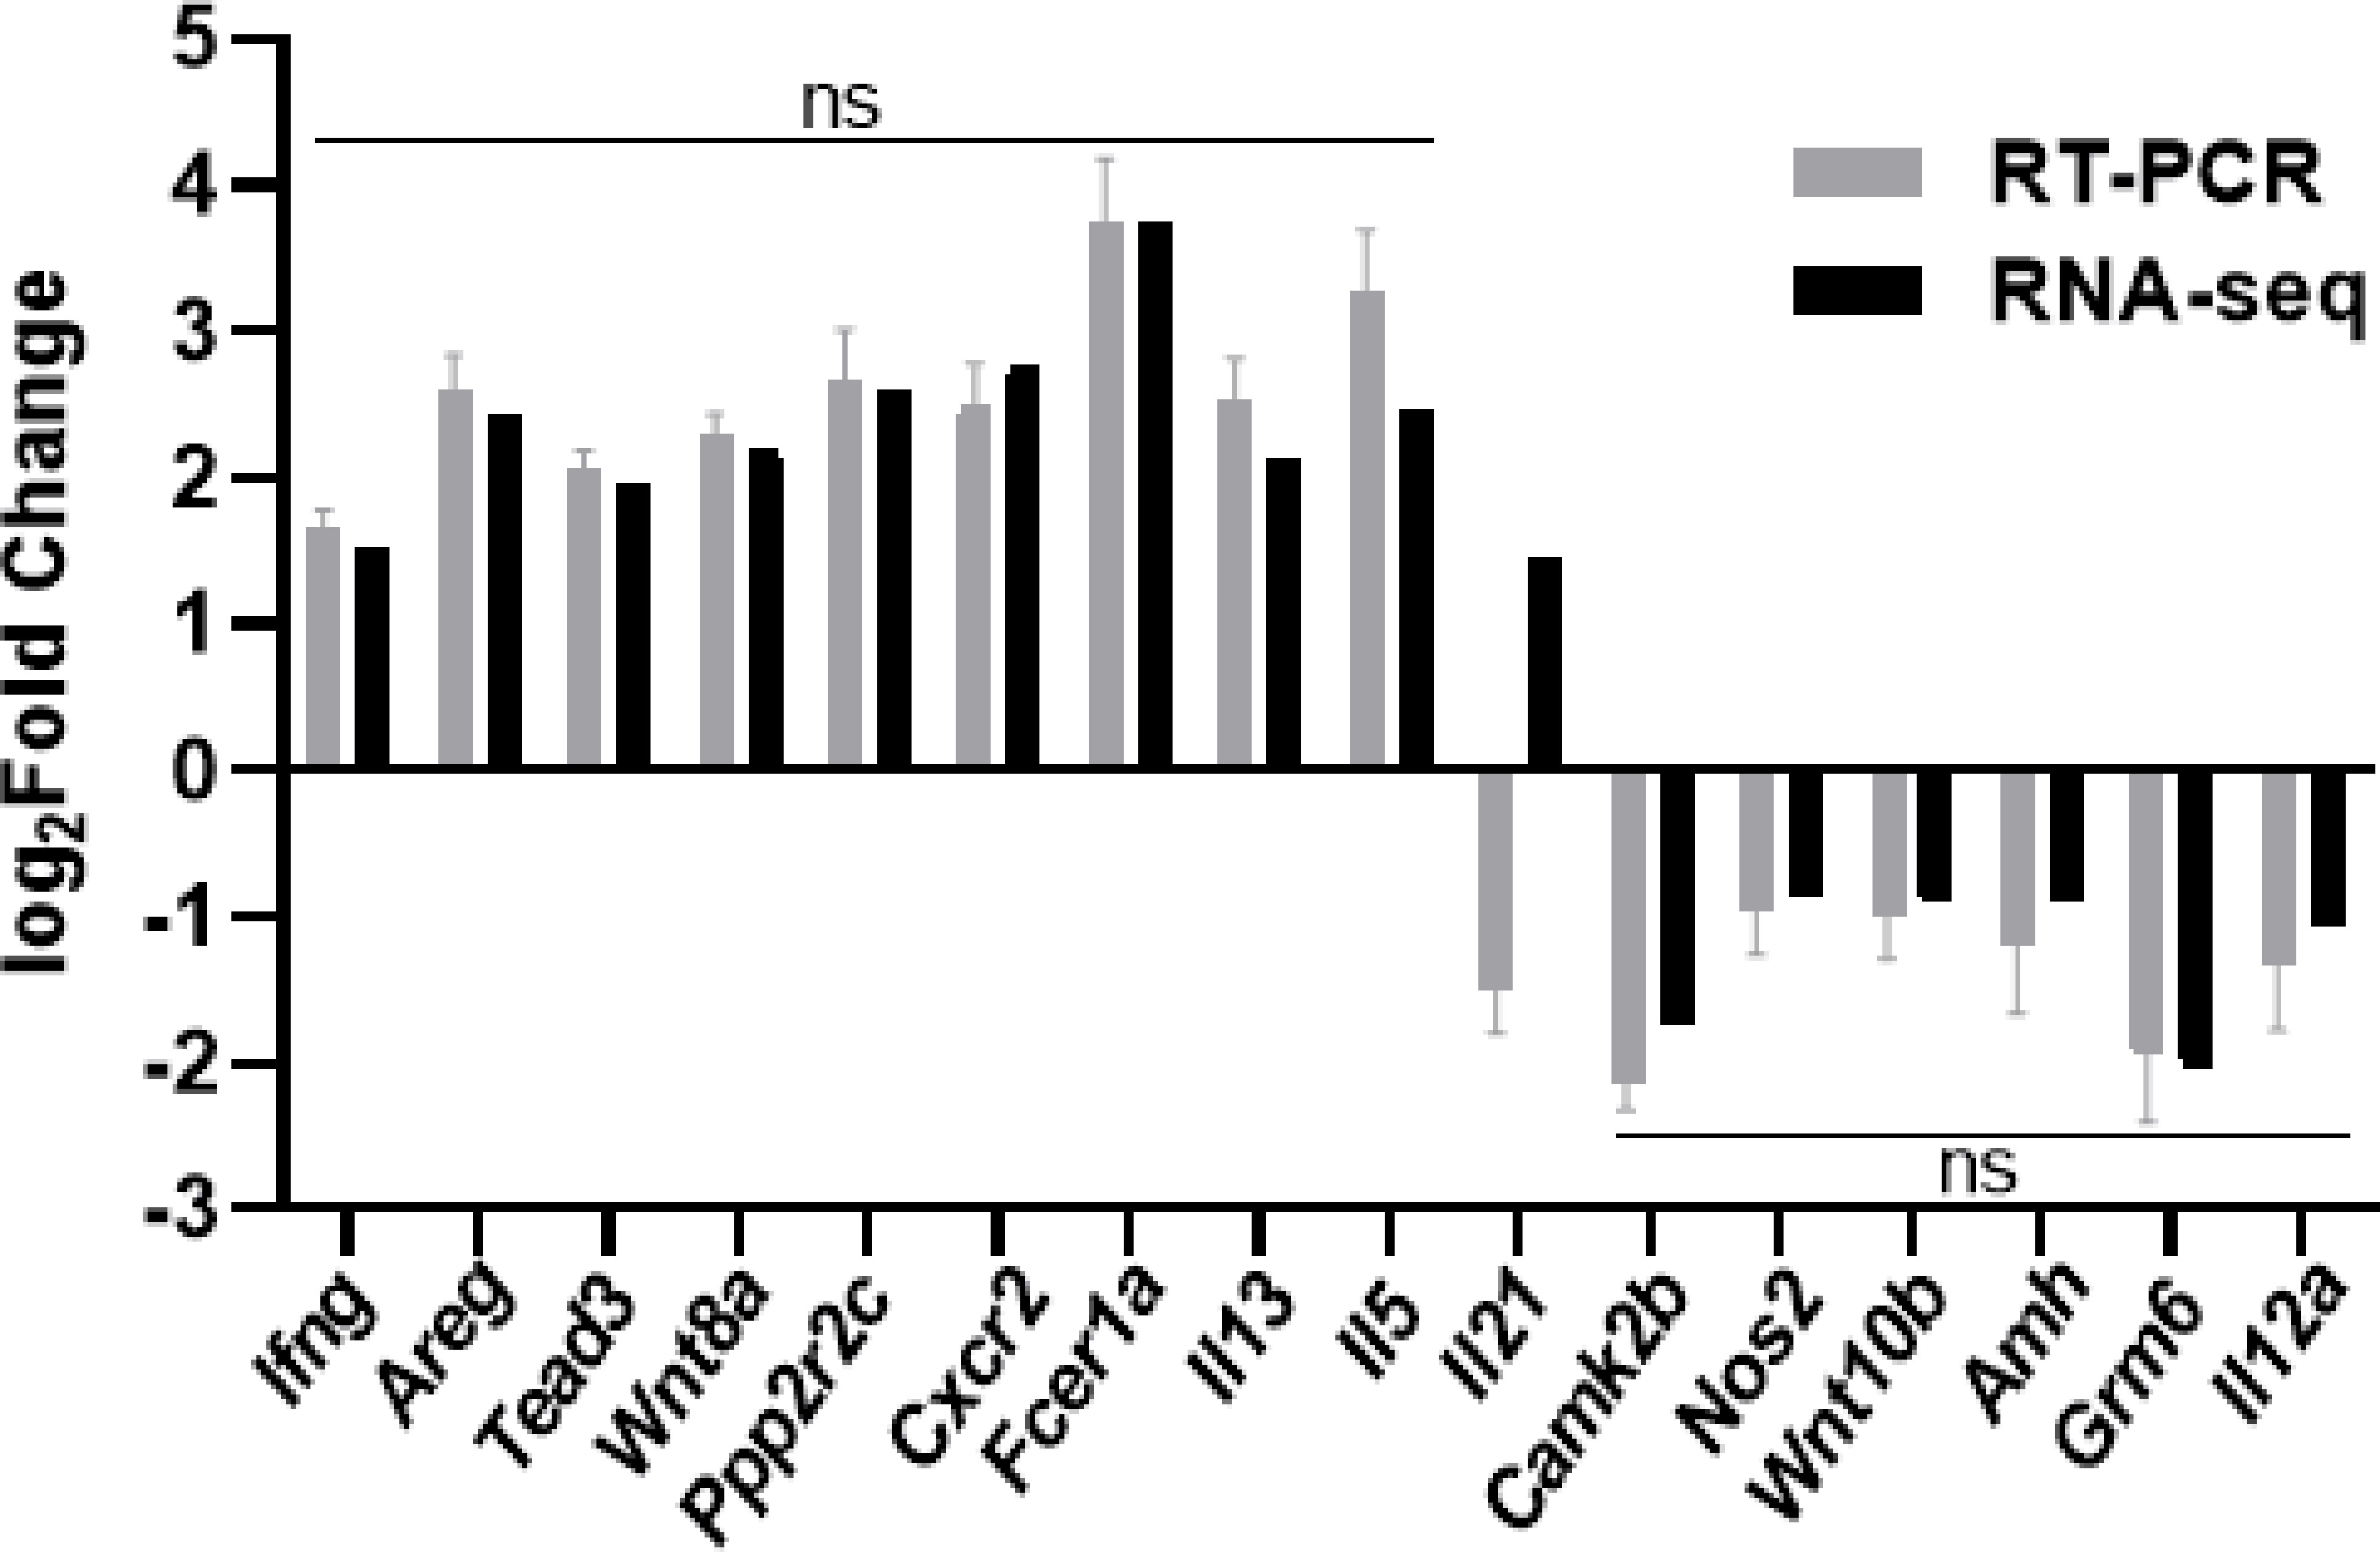
Figure 7 qRT-PCR validation of select differentially expressed genes by RNA-seq. Sixteen individual genes involved in signal transduction and metabolism were analyzed by qRT-PCR. The log2Fold Change determined from the relative Ct values of sixteen genes were compared to those detected by RNA-seq method. The black bar represents the expression levels analyzed by RNA-seq, and the grey bar represents the expression levels validated by qRT-PCR. Replicates (n=3) of each sample were run and all the Ct values were normalized to β-actin. Data were analyzed by Mann-Whitney test and shown as the means ± SD. ns, no significance.
Discussion
The GABAergic system, which includes GABA, GABA receptors, glutamate decarboxylase (GAD), vesicular inhibitory amino acid transporter (VIAAT), GABA transporters (GATs) and GABA transaminase (GABA-T), shows significant inhibitory functions in the CNS. Besides the CNS, GABA signaling plays an important role in the immune system (8, 11, 12, 52). For example, GAD and GABA receptors have been detected in macrophages and T cells (11), and GABA was shown to promote intestinal Th17 cell differentiation in the inflammation models of piglets and mice (37). Thus, this aroused great interest in exploring the role of the GABAergic system in activation and function of immune cells.
GATs terminate GABA signaling by mediating the translocation of GABA from the extracellular to the intracellular space (13). It has been proven that T cells express GAT-2 and GAT-2 deficiency promoted the Th17 cell response through the activation of GABA-mTOR signaling in the mouse infection model (37, 38). Here, in order to clarify the role of GAT-2 in T cell-mediated immunity, naïve CD4+ T cells were isolated from GAT-2 KO and WT mice and induced for Th1 cell differentiation, and then transcriptomic analysis was performed by RNA-seq. We found that GAT-2 deficiency enhanced the differentiation of naïve T cells into Th1 cells. Thus, to further explore the molecular mechanisms by which GAT-2 deficiency promoted Th1 cell differentiation, we next used the RNA-seq method to analyze the transcripts of differentiated Th1 cells and analyzed the data of transcriptomic sequencing.
In the present study, a mean of 50,239,276 clean reads were obtained per library (Table 2). This was sufficient to provide sequence coverage for transcriptional analysis, and the transcriptome sequencing data revealed that four signal transduction pathways (HIF-1 signaling pathway, Hippo signaling pathway, Phospholipase D signaling pathway, and Jak-STAT signaling pathway) were significantly enriched in GAT-2 KO cells compared to WT cells, suggesting that they are important for GABA signaling in T cells. Th cells undergo differentiation under hypoxic conditions in secondary lymphoid tissues; thus, their effector function is influenced by O2 concentrations (53). HIF-1 is a key transcription factor in the cellular response to hypoxia (54) and represses the transcription of STAT4 (a pro-Th1 factor), thereby inhibiting Th1 function in vitro (24). The Hippo signaling pathway was first discovered in Drosophila, which is evolutionally conserved and plays an important role in the regulation of cell proliferation and differentiation (55, 56). In multiple cell types of invertebrates and vertebrates, terminal differentiation is directed by the Hippo pathway. In mammalian tissues, macrophage stimulating (MST)1 and MST2—key kinases of the Hippo signaling pathway—control cell proliferation, differentiation, and apoptosis by inhibiting the transcriptional coactivator yes-associated protein (YAP). Phospholipase D activity is increased in activated T lymphocytes, which may result from disruption of the TCR/CD3 complex. Receptor-mediated phospholipase D activity was shown to be involved in human T lymphocyte activation (57). The JAK/STAT pathway, one of the most important signaling axes that regulate Th1 cell differentiation, is composed of transmembrane cytokine receptors, non-transmembrane proteins JAKs, and nucleoprotein STATs. The JAK/STAT signaling pathway is regulated by different cytokines and mediates a series of physiological and pathological processes such as cell proliferation, differentiation, migration and apoptosis (58). The differentiation of Th1 cells is regulated by a specific transcription factor T-bet, and the differentiation process is accomplished through JAK/STAT signaling pathway (59, 60). When naïve T cells differentiate into Th1 cells, IL-12 binds to its receptor on the surface of naïve T cells and activates STAT4 signaling via JAK to promote the differentiation of Th1 cells. At the same time, the expression of T-bet was also shown to be indirectly up-regulated to maintain the activation of STAT4 signaling, thus forming a positive feedback loop to ensure the continuous differentiation and proliferation of Th1 cells (61).
Metabolic reprogramming plays an important role in the activation, differentiation and function of T cells. In this study, we found that glycolysis/gluconeogenesis metabolic pathway was significantly enriched in GAT-2 KO cells compared to WT cells. Glycolysis is activated in rapidly proliferating tumor cells and immune cells including T cells and is associated with CD28 activation (62, 63). Upon T cell activation, cells shift from oxidative phosphorylation to glycolysis to meet biosynthetic and bioenergetic demands (64–66). The polarization of naïve CD4+ T cells depends on the enhancement of glycolysis, which also regulates T cell growth, differentiation, and function and stimulates the production of the pro-inflammatory cytokine IFN-γ and Th1 differentiation (67–69). In this study, multiple genes encoding components of the glycolysis/gluconeogenesis pathway (eg, phosphofructokinase, platelet [pfkp], aldolase C, fructose-bisphosphate [aldoc], enolase [eno]1, and eno2) were up-regulated in GAT-2 KO mice, which was consistent with our finding that GAT-2 deficiency enhanced Th1 differentiation. Increased glycolysis is a feature of activated T cells and promotes T cell differentiation via a epigenetic mechanism involving histone acetylation (70). Apparently, there is a need for more detailed data analyses and investigations on other changes that influence Th1 cell differentiation.
Interestingly, the current results inspired us to focus on signal transduction pathways and metabolic pathways for verification in our future work, so as to clarify the influence of GAT-2 deficiency on the signal transduction and metabolic activities of T cells. In addition, the combination of metabonomics, proteomics and other high-throughput sequencing technologies could be considered to comprehensively elucidate the more detailed regulatory network within T cells after GAT-2 deficiency.
Conclusions
In summary, we found that GAT-2 deficiency promoted Th1 cell differentiation, which was associated with changes in multiple signal transduction pathways and metabolic processes. These findings provide insight into the role of GABA signaling in T cell-mediated immunity, which can guide future investigations on the etiology and management of autoimmune diseases.
Data Availability Statement
The datasets presented in this study can be found in online repositories. The names of the repository/repositories and accession number(s) can be found below: NCBI SRA; PRJNA702918.
Ethics Statement
The animal study was reviewed and approved by The Institutional Animal Care and Use Committee of Yangzhou University.
Author Contributions
GZ and XD designed the experiments. XD performed the experiments and wrote the paper. YC, SW, and DY contributed to the experiments and data analysis. GZ and JY revised the manuscript. All authors contributed to the article and approved the submitted version.
Funding
This project was supported by the Postgraduate Research & Practice Innovation Program of Jiangsu Province (grant no. KYCX19_2116); a project founded by the Priority Academic Program of Development Jiangsu High Education Institution; Programs from the Ministry of Science and Technology of the People’s Republic of China (grant no. 2016YFD0500905 and 2017YFD0500203); and International Collaboration Program from Science and Technology Agency of Jiangsu Province (2019).
Conflict of Interest
The authors declare that the research was conducted in the absence of any commercial or financial relationships that could be construed as a potential conflict of interest.
Acknowledgments
We thank Novogene Biotechnology Co. (Beijing, China) for providing sequencing services.
Supplementary Material
The Supplementary Material for this article can be found online at: https://www.frontiersin.org/articles/10.3389/fimmu.2021.667136/full#supplementary-material
References
1. Xie WY, Hou XY, Yan FB, Sun GR, Han RL, Kang XT. Effect of γ-Aminobutyric Acid on Growth Performance and Immune Function in Chicks Under Beak Trimming Stress. Anim Sci J (2013) 84:121–9. doi: 10.1111/j.1740-0929.2012.01051.x
2. Vichitphan S, Vichitphan K, Wonghan W. Isolation and Identification of Gamma-Aminobutyric Acid (GABA)-Producing Lactic Acid Bacteria for Using as Starter Cultures in Thai Fermented Sausage “Sai Krok Esan”. Curr Opin Biotech (2013) 24:S82. doi: 10.1016/j.copbio.2013.05.238
3. Suyama S, Yada T. New Insight Into GABAergic Neurons in the Hypothalamic Feeding Regulation. J Physiol Sci (2018) 68:717–22. doi: 10.1007/s12576-018-0622-8
4. Sałat K, Kulig K, Gajda J, Więckowski K, Filipek B, Malawska B. Evaluation of Anxiolytic-Like, Anticonvulsant, Antidepressant-Like and Antinociceptive Properties of New 2-Substituted 4-Hydroxybutanamides With Affinity for GABA Transporters in Mice. Pharmacol Biochem Behav (2013) 110:145–53. doi: 10.1016/j.pbb.2013.06.013
5. Hu J, Quick MW. Substrate-Mediated Regulation of Gamma-Aminobutyric Acid Transporter 1 in Rat Brain. Neuropharmacology (2008) 54:309–18. doi: 10.1016/j.neuropharm.2007.09.013
6. Chiu CS, Brickley S, Jensen K, Southwell A, McKinney S, Cull-Candy S, et al. GABA Transporter Deficiency Causes Tremor, Ataxia, Nervousness, and Increased GABA-Induced Tonic Conductance in Cerebellum. J Neurosci (2005) 25:3234–45. doi: 10.1523/jneurosci.3364-04.2005
7. Bowery NG, Smart TG. GABA and Glycine as Neurotransmitters: A Brief History. Br J Pharmacol (2006) 147(Suppl 1):S109–19. doi: 10.1038/sj.bjp.0706443
8. Prud’homme GJ, Glinka Y, Wang Q. Immunological GABAergic Interactions and Therapeutic Applications in Autoimmune Diseases. Autoimmun Rev (2015) 14:1048–56. doi: 10.1016/j.autrev.2015.07.011
9. Yen D, Cheung J, Scheerens H, Poulet F, McClanahan T, McKenzie B, et al. Il-23 Is Essential for T Cell-Mediated Colitis and Promotes Inflammation Via IL-17 and IL-6. J Clin Invest (2006) 116:1310–6. doi: 10.1172/jci21404
10. Crowley T, Cryan JF, Downer EJ, O’Leary OF. Inhibiting Neuroinflammation: The Role and Therapeutic Potential of GABA in Neuro-Immune Interactions. Brain Behav Immun (2016) 54:260–77. doi: 10.1016/j.bbi.2016.02.001
11. Wu C, Qin X, Du H, Li N, Ren W, Peng Y. The Immunological Function of GABAergic System. Front Biosci (Landmark Ed) (2017) 22:1162–72. doi: 10.2741/4539
12. Bhat R, Axtell R, Mitra A, Miranda M, Lock C, Tsien RW, et al. Inhibitory Role for GABA in Autoimmune Inflammation. Proc Natl Acad Sci USA (2010) 107:2580–5. doi: 10.1073/pnas.0915139107
13. Dionisio L, José De Rosa M, Bouzat C, Esandi Mdel C. An Intrinsic GABAergic System in Human Lymphocytes. Neuropharmacology (2011) 60:513–9. doi: 10.1016/j.neuropharm.2010.11.007
14. Barragan A, Weidner JM, Jin Z, Korpi ER, Birnir B. Gabaergic Signalling in the Immune System. Acta Physiol (Oxf) (2015) 213:819–27. doi: 10.1111/apha.12467
15. Tian J, Lu Y, Zhang H, Chau CH, Dang HN, Kaufman DL. Gamma-Aminobutyric Acid Inhibits T Cell Autoimmunity and the Development of Inflammatory Responses in a Mouse Type 1 Diabetes Model. J Immunol (2004) 173:5298–304. doi: 10.4049/jimmunol.173.8.5298
16. Bjurstom H, Wang J, Ericsson I, Bengtsson M, Liu Y, Kumar-Mendu S, et al. GABA, a Natural Immunomodulator of T Lymphocytes. J Neuroimmunol (2008) 205:44–50. doi: 10.1016/j.jneuroim.2008.08.017
17. Mendu SK, Akesson L, Jin Z, Edlund A, Cilio C, Lernmark A, et al. Increased GABA(A) Channel Subunits Expression in CD8(+) But Not in CD4(+) T Cells in BB Rats Developing Diabetes Compared to Their Congenic Littermates. Mol Immunol (2011) 48:399–407. doi: 10.1016/j.molimm.2010.08.005
18. Mendu SK, Bhandage A, Jin Z, Birnir B. Different Subtypes of GABA-A Receptors Are Expressed in Human, Mouse and Rat T Lymphocytes. PloS One (2012) 7:e42959. doi: 10.1371/journal.pone.0042959
19. Guastella J, Nelson N, Nelson H, Czyzyk L, Keynan S, Miedel MC, et al. Cloning and Expression of a Rat Brain GABA Transporter. Science (1990) 249:1303–6. doi: 10.1126/science.1975955
20. Grossman TR, Nelson N. Effect of Sodium Lithium and Proton Concentrations on the Electrophysiological Properties of the Four Mouse GABA Transporters Expressed in Xenopus Oocytes. Neurochem Int (2003) 43:431–43. doi: 10.1016/s0197-0186(03)00032-9
21. Wang Y, Feng D, Liu G, Luo Q, Xu Y, Lin S, et al. Gamma-Aminobutyric Acid Transporter 1 Negatively Regulates T Cell-Mediated Immune Responses and Ameliorates Autoimmune Inflammation in the CNS. J Immunol (2008) 181:8226–36. doi: 10.4049/jimmunol.181.12.8226
22. Wang Y, Luo Q, Xu Y, Feng D, Fei J, Cheng Q, et al. Gamma-Aminobutyric Acid Transporter 1 Negatively Regulates T Cell Activation and Survival Through Protein Kinase C-Dependent Signaling Pathways. J Immunol (2009) 183:3488–95. doi: 10.4049/jimmunol.0900767
23. Radian R, Kanner BI. Stoichiometry of Sodium- and Chloride-Coupled Gamma-Aminobutyric Acid Transport by Synaptic Plasma Membrane Vesicles Isolated From Rat Brain. Biochemistry (1983) 22:1236–41. doi: 10.1021/bi00274a038
24. Shehade H, Acolty V, Moser M, Oldenhove G. Cutting Edge: Hypoxia-Inducible Factor 1 Negatively Regulates Th1 Function. J Immunol (2015) 195:1372–6. doi: 10.4049/jimmunol.1402552
25. Zhu J, Yamane H, Paul WE. Differentiation of Effector CD4 T Cell Populations (*). Annu Rev Immunol (2010) 28:445–89. doi: 10.1146/annurev-immunol-030409-101212
26. Liu G, Bi Y, Xue L, Zhang Y, Yang H, Chen X, et al. Dendritic Cell SIRT1-HIF1α Axis Programs the Differentiation of CD4+ T Cells Through IL-12 and TGF-β1. Proc Natl Acad Sci USA (2015) 112:E957–65. doi: 10.1073/pnas.1420419112
27. Mosmann TR, Coffman RL. TH1 and TH2 Cells: Different Patterns of Lymphokine Secretion Lead to Different Functional Properties. Annu Rev Immunol (1989) 7:145–73. doi: 10.1146/annurev.iy.07.040189.001045
28. Fort MM, Cheung J, Yen D, Li J, Zurawski SM, Lo S, et al. Il-25 Induces IL-4, Il-5, and IL-13 and Th2-Associated Pathologies in vivo. Immunity (2001) 15:985–95. doi: 10.1016/s1074-7613(01)00243-6
29. Kebir H, Kreymborg K, Ifergan I, Dodelet-Devillers A, Cayrol R, Bernard M, et al. Human TH17 Lymphocytes Promote Blood-Brain Barrier Disruption and Central Nervous System Inflammation. Nat Med (2007) 13:1173–5. doi: 10.1038/nm1651
30. Lee E, Trepicchio WL, Oestreicher JL, Pittman D, Wang F, Chamian F, et al. Increased Expression of Interleukin 23 p19 and p40 in Lesional Skin of Patients With Psoriasis Vulgaris. J Exp Med (2004) 199:125–30. doi: 10.1084/jem.20030451
31. Krueger GG, Langley RG, Leonardi C, Yeilding N, Guzzo C, Wang Y, et al. A Human Interleukin-12/23 Monoclonal Antibody for the Treatment of Psoriasis. N Engl J Med (2007) 356:580–92. doi: 10.1056/NEJMoa062382
32. Hsu HC, Yang P, Wang J, Wu Q, Myers R, Chen J, et al. Interleukin 17-Producing T Helper Cells and Interleukin 17 Orchestrate Autoreactive Germinal Center Development in Autoimmune BXD2 Mice. Nat Immunol (2008) 9:166–75. doi: 10.1038/ni1552
33. Feuerer M, Shen Y, Littman DR, Benoist C, Mathis D. How Punctual Ablation of Regulatory T Cells Unleashes an Autoimmune Lesion Within the Pancreatic Islets. Immunity (2009) 31:654–64. doi: 10.1016/j.immuni.2009.08.023
34. Xu T, Yan T, Li P. Interleukin-29 Regulates T Follicular Helper Cells by Repressing BCL6 in Rheumatoid Arthritis Patients. Clin Rheumatol (2020) 39:3797–804. doi: 10.1007/s10067-020-05151-y
35. Gutcher I, Becher B. APC-Derived Cytokines and T Cell Polarization in Autoimmune Inflammation. J Clin Invest (2007) 117:1119–27. doi: 10.1172/jci31720
36. Veldhoen M. The Role of T Helper Subsets in Autoimmunity and Allergy. Curr Opin Immunol (2009) 21:606–11. doi: 10.1016/j.coi.2009.07.009
37. Ren W, Yin J, Xiao H, Chen S, Liu G, Tan B, et al. Intestinal Microbiota-Derived Gaba Mediates Interleukin-17 Expression During Enterotoxigenic Escherichia Coli Infection. Front Immunol (2016) 7:685. doi: 10.3389/fimmu.2016.00685
38. Ren W, Liao Y, Ding X, Jiang Y, Yan J, Xia Y, et al. Slc6a13 Deficiency Promotes Th17 Responses During Intestinal Bacterial Infection. Mucosal Immunol (2019) 12:531–44. doi: 10.1038/s41385-018-0111-7
39. Wang Z, Gerstein M, Snyder M. Rna-Seq: A Revolutionary Tool for Transcriptomics. Nat Rev Genet (2009) 10:57–63. doi: 10.1038/nrg2484
40. Liu K, Ding T, Fang L, Cui L, Li J, Meng X, et al. Organic Selenium Ameliorates Staphylococcus Aureus-Induced Mastitis in Rats by Inhibiting the Activation of NF-κb and MAPK Signaling Pathways. Front Vet Sci (2020) 7:443. doi: 10.3389/fvets.2020.00443
41. Ding X, Zhang Q, Wang H, Quan G, Zhang D, Ren W, et al. The Different Roles of Hcp(1) and Hcp(2) of the Type VI Secretion System in Escherichia Coli Strain CE129. J Basic Microbiol (2018) 58:938–46. doi: 10.1002/jobm.201800156
42. Anders S, Pyl PT, Huber W. Htseq–a Python Framework to Work With High-Throughput Sequencing Data. Bioinformatics (2015) 31:166–9. doi: 10.1093/bioinformatics/btu638
43. Xia Y, Li J, Ren W, Feng Z, Huang R, Yin Y. Transcriptomic Analysis on Responses of the Liver and Kidney of Finishing Pigs Fed Cadmium Contaminated Rice. J Sci Food Agric (2018) 98:2964–72. doi: 10.1002/jsfa.8793
44. Wu C, Qin X, Li P, Pan T, Ren W, Li N, et al. Transcriptomic Analysis on Responses of Murine Lungs to Pasteurella Multocida Infection. Front Cell Infect Microbiol (2017) 7:251. doi: 10.3389/fcimb.2017.00251
45. Trapnell C, Williams BA, Pertea G, Mortazavi A, Kwan G, van Baren MJ, et al. Transcript Assembly and Quantification by RNA-Seq Reveals Unannotated Transcripts and Isoform Switching During Cell Differentiation. Nat Biotechnol (2010) 28:511–5. doi: 10.1038/nbt.1621
46. Liao Y, Smyth GK, Shi W. featureCounts: An Efficient General Purpose Program for Assigning Sequence Reads to Genomic Features. Bioinformatics (2014) 30:923–30. doi: 10.1093/bioinformatics/btt656
47. Love MI, Huber W, Anders S. Moderated Estimation of Fold Change and Dispersion for RNA-seq Data With Deseq2. Genome Biol (2014) 15:550. doi: 10.1186/s13059-014-0550-8
48. Anders S, Huber W. Differential Expression Analysis for Sequence Count Data. Genome Biol (2010) 11:R106. doi: 10.1186/gb-2010-11-10-r106
49. Wang L, Feng Z, Wang X, Wang X, Zhang X. Degseq: An R Package for Identifying Differentially Expressed Genes From RNA-seq Data. Bioinformatics (2010) 26:136–8. doi: 10.1093/bioinformatics/btp612
50. Mao X, Cai T, Olyarchuk JG, Wei L. Automated Genome Annotation and Pathway Identification Using the KEGG Orthology (KO) as a Controlled Vocabulary. Bioinformatics (2005) 21:3787–93. doi: 10.1093/bioinformatics/bti430
51. Yu G, Wang LG, Han Y, He QY. clusterProfiler: An R Package for Comparing Biological Themes Among Gene Clusters. Omics (2012) 16:284–7. doi: 10.1089/omi.2011.0118
52. Yocum GT, Turner DL, Danielsson J, Barajas MB, Zhang Y, Xu D, et al. GABA(a) Receptor α(4)-Subunit Knockout Enhances Lung Inflammation and Airway Reactivity in a Murine Asthma Model. Am J Physiol Lung Cell Mol Physiol (2017) 313:L406–l15. doi: 10.1152/ajplung.00107.2017
53. Soni S, Padwad YS. HIF-1 in Cancer Therapy: Two Decade Long Story of a Transcription Factor. Acta Oncol (2017) 56:503–15. doi: 10.1080/0284186x.2017.1301680
54. Wang GL, Semenza GL. Characterization of Hypoxia-Inducible Factor 1 and Regulation of DNA Binding Activity by Hypoxia. J Biol Chem (1993) 268:21513–8. doi: 10.0000/PMID8408001
55. Harvey KF, Pfleger CM, Hariharan IK. The Drosophila Mst Ortholog, Hippo, Restricts Growth and Cell Proliferation and Promotes Apoptosis. Cell (2003) 114:457–67. doi: 10.1016/s0092-8674(03)00557-9
56. Udan RS, Kango-Singh M, Nolo R, Tao C, Halder G. Hippo Promotes Proliferation Arrest and Apoptosis in the Salvador/Warts Pathway. Nat Cell Biol (2003) 5:914–20. doi: 10.1038/ncb1050
57. Stewart SJ, Cunningham GR, Strupp JA, House FS, Kelley LL, Henderson GS, et al. Activation of Phospholipase D: A Signaling System Set in Motion by Perturbation of the T Lymphocyte Antigen Receptor/CD3 Complex. Cell Regul (1991) 2:841–50. doi: 10.1091/mbc.2.10.841
58. Croxford AL, Mair F, Becher B. Il-23: One Cytokine in Control of Autoimmunity. Eur J Immunol (2012) 42:2263–73. doi: 10.1002/eji.201242598
59. Murphy KM, Reiner SL. The Lineage Decisions of Helper T Cells. Nat Rev Immunol (2002) 2:933–44. doi: 10.1038/nri954
60. Schindler C, Levy DE, Decker T. Jak-STAT Signaling: From Interferons to Cytokines. J Biol Chem (2007) 282:20059–63. doi: 10.1074/jbc.R700016200
61. Ghoreschi K, Laurence A, O’Shea JJ. Janus Kinases in Immune Cell Signaling. Immunol Rev (2009) 228:273–87. doi: 10.1111/j.1600-065X.2008.00754.x
62. Michaudel C, Sokol H. The Gut Microbiota at the Service of Immunometabolism. Cell Metab (2020) 32:514–23. doi: 10.1016/j.cmet.2020.09.004
63. Su S, Liu Q, Chen J, Chen J, Chen F, He C, et al. A Positive Feedback Loop Between Mesenchymal-Like Cancer Cells and Macrophages Is Essential to Breast Cancer Metastasis. Cancer Cell (2014) 25:605–20. doi: 10.1016/j.ccr.2014.03.021
64. Guppy M, Greiner E, Brand K. The Role of the Crabtree Effect and an Endogenous Fuel in the Energy Metabolism of Resting and Proliferating Thymocytes. Eur J Biochem (1993) 212:95–9. doi: 10.1111/j.1432-1033.1993.tb17637.x
65. Jacobs SR, Herman CE, Maciver NJ, Wofford JA, Wieman HL, Hammen JJ, et al. Glucose Uptake Is Limiting in T Cell Activation and Requires CD28-Mediated Akt-Dependent and Independent Pathways. J Immunol (2008) 180:4476–86. doi: 10.4049/jimmunol.180.7.4476
66. Frauwirth KA, Riley JL, Harris MH, Parry RV, Rathmell JC, Plas DR, et al. The CD28 Signaling Pathway Regulates Glucose Metabolism. Immunity (2002) 16:769–77. doi: 10.1016/s1074-7613(02)00323-0
67. Chang CH, Curtis JD, Maggi LB Jr., Faubert B, Villarino AV, O’Sullivan D, et al. Posttranscriptional Control of T Cell Effector Function by Aerobic Glycolysis. Cell (2013) 153:1239–51. doi: 10.1016/j.cell.2013.05.016
68. De Bock K, Georgiadou M, Schoors S, Kuchnio A, Wong BW, Cantelmo AR, et al. Role of PFKFB3-Driven Glycolysis in Vessel Sprouting. Cell (2013) 154:651–63. doi: 10.1016/j.cell.2013.06.037
69. Rathmell JC, Vander Heiden MG, Harris MH, Frauwirth KA, Thompson CB. In the Absence of Extrinsic Signals, Nutrient Utilization by Lymphocytes Is Insufficient to Maintain Either Cell Size or Viability. Mol Cell (2000) 6:683–92. doi: 10.1016/s1097-2765(00)00066-6
Keywords: GAT-2 deficiency, Th1 cell differentiation, transcriptomic analysis, signal transduction, metabolic processes, qRT-PCR
Citation: Ding X, Chang Y, Wang S, Yan D, Yao J and Zhu G (2021) Transcriptomic Analysis of the Effect of GAT-2 Deficiency on Differentiation of Mice Naïve T Cells Into Th1 Cells In Vitro. Front. Immunol. 12:667136. doi: 10.3389/fimmu.2021.667136
Received: 23 February 2021; Accepted: 17 May 2021;
Published: 02 June 2021.
Edited by:
Leyi Wang, University of Illinois at Urbana-Champaign, United StatesCopyright © 2021 Ding, Chang, Wang, Yan, Yao and Zhu. This is an open-access article distributed under the terms of the Creative Commons Attribution License (CC BY). The use, distribution or reproduction in other forums is permitted, provided the original author(s) and the copyright owner(s) are credited and that the original publication in this journal is cited, in accordance with accepted academic practice. No use, distribution or reproduction is permitted which does not comply with these terms.
*Correspondence: Jiakui Yao, anN5enlqa0BzaW5hLmNvbQ==; Guoqiang Zhu, eXpncXpodUB5enUuZWR1LmNu