
94% of researchers rate our articles as excellent or good
Learn more about the work of our research integrity team to safeguard the quality of each article we publish.
Find out more
ORIGINAL RESEARCH article
Front. Immunol. , 31 May 2021
Sec. Viral Immunology
Volume 12 - 2021 | https://doi.org/10.3389/fimmu.2021.666163
 Stéphanie Bibert1†
 Nicolas Guex2†
 Joao Lourenco3‡Thomas Brahier1‡
 Matthaios Papadimitriou-Olivgeris1‡Lauro Damonti1,4
 Oriol Manuel5
 Robin Liechti2,3Lou Götz2,3Jonathan Tschopp1
 Mathieu Quinodoz6,7,8Peter Vollenweider9
 Jean-Luc Pagani10
 Mauro Oddo10
 Olivier Hügli11
 Frédéric Lamoth1,12Véronique Erard13Cathy Voide14Mauro Delorenzi3,15
 Nathalie Rufer15
 Fabio Candotti16Carlo Rivolta6,7,8
 Noémie Boillat-Blanco1§
 Pierre-Yves Bochud1*§ and the RegCOVID Study Group∥
The reason why most individuals with COVID-19 have relatively limited symptoms while other develop respiratory distress with life-threatening complications remains unknown. Increasing evidence suggests that COVID-19 associated adverse outcomes mainly rely on dysregulated immunity. Here, we compared transcriptomic profiles of blood cells from 103 patients with different severity levels of COVID-19 with that of 27 healthy and 22 influenza-infected individuals. Data provided a complete overview of SARS-CoV-2-induced immune signature, including a dramatic defect in IFN responses, a reduction of toxicity-related molecules in NK cells, an increased degranulation of neutrophils, a dysregulation of T cells, a dramatic increase in B cell function and immunoglobulin production, as well as an important over-expression of genes involved in metabolism and cell cycle in patients infected with SARS-CoV-2 compared to those infected with influenza viruses. These features also differed according to COVID-19 severity. Overall and specific gene expression patterns across groups can be visualized on an interactive website (https://bix.unil.ch/covid/). Collectively, these transcriptomic host responses to SARS-CoV-2 infection are discussed in the context of current studies, thereby improving our understanding of COVID-19 pathogenesis and shaping the severity level of COVID-19.
Coronaviruses (CoV) are enveloped single-stranded positive-sense RNA viruses surrounded by spike glycoproteins shaping the typical “corona-like” appearance (1). To date, seven strains of human CoV have been identified. Four of them (HCoV-229E, HCoV-OC43, HCoV-NL63, HKU1) circulate in the population and cause only mild upper-respiratory tract infections in immunocompetent individuals (2). In the last two decades, three highly pathogenic viruses acquired by zoonotic transmission caused outbreaks of severe pneumonia. Severe acute respiratory virus (SARS)-related CoV 1 infected ~8000 individuals in 2002-3, with a fatality rate of 10%; the Middle-East respiratory syndrome CoV (MERS-CoV) infected ~8000 individuals since 2012, with a ~36% fatality rate; the new coronavirus SARS-CoV-2 emerged in the province of Wuhan (China) in the end of 2019, infecting more than 100,200,000 individuals worldwide and killing over 2’150’000 as of January 2021.
While the immune response to SARS-CoV-2 has not yet been fully characterized, it is likely to engage immune mechanisms similar to those previously described for SARS-CoV and MERS-CoV, and, more generally, other RNA viruses (3, 4). Viral single stranded and double-stranded RNA are recognized by at least 3 families of pattern recognition receptors (PRR), including extracellular and endosomal Toll-like receptors (TLR3/4/7/8), cytoplasmic retinoic acid-inducible gene I-like receptors (RIG-I/MDA5), and the cytosolic RNA-activated protein kinase (PKR). Signal transduction by PRR subsequently leads to the induction of transcription factors such as interferon regulatory factors (IRFs) and nuclear factor κ B (NF-κ B), thereby inducing the synthesis and secretion of pro-inflammatory cytokines such as Type I and III interferons (IFNs), as well as the production of chemokines inducing adaptive immunity. In turn, both type I and III IFNs induce the expression of interferon stimulated genes (ISGs), which restrict and limit viral spread and stimulate the adaptive immune responses (5, 6), resulting in the generation of viral peptide-specific T cells (7, 8) and the production of viral-specific antibodies (9–11).
Increasing evidences suggest that SARS-CoV-2 induces specific response mechanisms, probably distinct from those triggered by other viruses, that can lead to major immune dysregulation (12). However, only few clinical studies have investigated the comparison of immune activation responses during COVID-19 to other viral infections. To better understand the specific features of the immune response to COVID-19, we compared the transcriptional profiles of patients infected by SARS-CoV-2 across different disease severity to that of patients infected by Influenza A or B viruses. Altogether, our results suggest that severe COVID-19 presentation results from a defect in or escape from innate immunity associated with an unbalanced adaptive immune response.
This prospective observational study of SARS-CoV2 and Influenza viruses-infected patients was conducted in the emergency department, internal medical ward and in the intensive care unit of Lausanne University Hospital (CHUV), a tertiary care center in Switzerland. Adult patients were included in this study if COVID-19 or Influenza were confirmed by real time polymerase chain reaction from a nasopharyngeal swab. COVID-19 patients were included between February 6th 2020 and April 3rd 2020. Patients with Influenza were included between January 21st 2015 and March 17th 2020. Healthy volunteers had a negative COVID-19 serology and were included in June 2020. Patients and healthy volunteers included in this study signed an informed consent form for genetic and functional testing, according to protocols approved by the Cantonal Ethics Committee of the state of Vaud (CER-VD 479/13, CER-VD 2019-02283, CER-VD 2020-01108). Samples were stored within a dedicated biobank fulfilling quality standards according to the Swiss Biobanking Platform criteria (“Vita label”, certificate CHUV_2004_3).
Patients demographics, comorbidities, symptoms, vital signs and laboratory results performed during routine care were recorded using a standardized electronic case report form in REDCap (Research Electronic Data Capture) or Secutrial. Bedside clinical scores to identify patients at risk of poor outcome were calculated at first assessment in the emergency department: (i) Quick Sequential Organ Failure Assessment (qSOFA): one point each for systolic hypotension (≤100 mmHg), tachypnea (≥22/min) or altered mentation [Glasgow coma score ≤14 (13)], CRB-65: one point each for Confusion (Glasgow coma score ≤14), elevated Respiratory rate (≥30/min), low blood pressure (systolic <90 mmHg or diastolic ≤60 mmHg), age ≥65 years (14). Clinical outcomes were assessed by checking the electronic health record and by calling patients. COVID-19 patients were classified into three groups according to disease severity: (i) outpatients and/or inpatients (e.g. admitted for a motif other than COVID-19) without oxygen requirement (OXY0); (ii) inpatient with oxygen requirement without intubation (OXY1) and (iii) intubation and/or respiratory-related death (TUBE).
Total RNA from whole blood was isolated using Blood RNA tubes (BD) for blood collection. RNA integrity was assessed with a Bioanalyzer (Agilent Technologies). The TruSeq mRNA stranded kit from Illumina was used for the library preparation with 400 ng of total RNA as input. Library molarity and quality were assessed with the Qubit and Tapestation using a DNA High sensitivity chip (Agilent Technologies). Libraries were pooled at 2 nM and loaded for clustering on several lanes of a Single-read Illumina Flow cell to reach an average of 30 Million of reads per library. Reads of 100 bases were generated using the TruSeq SBS chemistry on an Illumina HiSeq 4000 sequencer.
Transcript abundance quantification was performed with Salmon v1.3.0 (15) in quasi-mapping-based mode using the human reference transcriptome obtained from GENCODE (16) (release 34 corresponding to human genome assembly GRCh38). Default parameters were used plus the –validateMappings –numBootstraps 0 –numGibbsSamples 0 –fldMean 306 –fldSD 30 –seqBias –gcBias parameters. Gene abundances were collected directly with Salmon using –g parameter. Hemoglobin genes ENSG00000206172, ENSG00000188536, ENSG00000244734, ENSG00000229988, ENSG00000223609, ENSG00000213931, ENSG00000213934, ENSG00000196565, ENSG00000206177, ENSG00000086506, ENSG00000130656 and ENSG00000206178 were removed and the remaining genes used to compute the usable library sizes and filter out genes without at least 1 cpm in at least 15 samples (e.g. the size of the smallest group, TUBE early).
Differential gene expression analyses were performed in R [using DESeq2_1.26.0 built-in functions (17)]. Overall similarity between samples was assessed by first applying a variance stabilizing transformation (VST) to the gene-level count matrices using the vst function taking into account the experimental design (blind=FALSE), and then performing a principal components analysis (PCA) on the regularized matrix using the prcomp function on the 10% most varying genes. To identify differentially expressed genes (DEGs), separate paired analyses between groups were computed using the function DESeq with default parameters. Log2 fold changes were moderated with the lfcShrink function using the apeglm (18) shrinkage estimator and differentially expressed genes were selected based on their multiple testing corrected adjusted P value (<0.01).
DOSE version 3.4.0 (19) and clusterProfiler version 3.6.0 (20) were used to identify pathways with a significant enrichment of DEGs. Analyses were performed separately for each comparison using the gseKEGG function with genes ranked by sign (log2FoldChange) * -log10 (pval). Pathways with an adjusted P-value <= 0.05 were considered significantly enriched.
Gene set enrichment analyses (GSEA) were performed in R using fgsea version 1.12.0 built in functions (21). Normalized enrichment scores and adjusted P-values were computed separately for each comparison using the fgsea function with genes ranked by sign(log2FoldChange) * -log10(pval), the manually curated gene sets reported in Supplementary Tables 2-3 and the number of permutations equal to the number of genes in the ranked list (16,670). Gene sets with an adjusted P-value <= 0.05 were considered significantly enriched.
Blood gene-expression was measured in 103 patients infected with SARS-CoV-2 (collectively named “COVID-19”) and compared to that of 22 patients infected with Influenza A or B (INFL) as well as 27 non-infected, healthy individuals (HLTY) COVID-19 patients were stratified according to the level of respiratory failure; 23 did not require oxygen support (“OXY0”), 40 received oxygen but no mechanical ventilation (“OXY1”) and 40 required mechanical ventilation (“TUBE”). In the latter group, 15 patients were sampled within the first 7 days in hospital (“TUBE early”) while 25 were sampled later (“TUBE late”).
Patients and controls characteristics are shown in Supplementary Table 1. The duration of symptoms before admission was similar in all disease groups. Baseline characteristics and comorbidities were also similar among all COVID-19 patients, except for an over-representation of males among the TUBE late group. As expected, baseline symptoms (fever, cough and dyspnea), signs (temperature, systolic blood pressure and respiratory rate) and severity scores (qSOFA and CURB65) significantly worsened from OXY0 to OXY1 and TUBE patients. INFL patients were significantly older than COVID-19 patients (mean age 73 versus mean ages ranging from 54 in OXY0 to 64 in TUBE early), but had a similar pattern of comorbidities, except for hypertension, dyslipidemia and gastrointestinal diseases, which were significantly less frequent in INFL than OXY1. Their qSOFA score was comparable to that of OXY0 and OXY1 while the CURB65 score and hospitalization rate was comparable to those of TUBE patients. INFL were significantly more likely to have fever, cough, fatigue, leukocytosis and thrombocytopenia at baseline than OXY0. In contrast, they were less likely to have hypotension, dyspnea, tachypnea, leukocytosis and radiological infiltrates at baseline; and death at 30 days than OXY1 and TUBE early.
Total RNA libraries produced on average 34.1 million reads (standard deviation, SD=4.7), among which an average of 30.6 million (SD=4.6) were mapped against the 228,048 transcripts of Gencode v34 and aggregated at the gene level using Salmon v1.3.0. After removal of hemoglobin genes, all samples had produced at least 10 millions of usable reads, except samples from subjects TUBE early.01 and TUBE late.05, which had 9.9 and 9.8 million reads, respectively (Supplementary Figure 1). The mean number of usable reads for HLTY, patients infected with SARS-CoV-2 (OXY0, OXY1, TUBE-early and TUBE-late) and INFL was 17.3, 24.0, 24.4, 21.6, 16.4 and 22.1 millions, respectively (Supplementary Figure 1). Sex was confirmed by counting the number of reads mapping on the male and female specific genes RPS4Y1 (ENSG00000129824.16) and XIST (ENSG00000229807.12, Supplementary Figure 1). The 16,670 genes with at least 1 cpm in at least 15 samples (e.g. the size of the smallest group) were kept for further analysis.
A total of 2,839, 3,821, 5,252 genes had higher expression (adjusted P<= 0.01), and a total of 2,164, 3,305 and 3,956 genes had lower expression, among OXY0, OXY1 and TUBE early, respectively, compared to HLTY (Figure 1A). A total of 2,527, 1,832, and 1,135 genes had higher expression, and a total of 2,404, 1,848 and 737 genes had lower expression, among OXY0, OXY1 and TUBE, respectively, compared to INFL (Figure 1B). The number of upregulated genes compared to both reference groups (HLTY and INFL) are 1,438, 1,001 and 636 in OXY0, OXY1 and TUBE early, respectively (Figure 1C), whereas the number of down-regulated genes compared to both reference groups are 1,037, 835 and 318 (Figure 1C). The two first principal components of the 10% most varying gene expression across all samples explained 47.6%, 46.1% and 51.1% of variance, respectively, when comparing OXY0, OXY1 and TUBE early groups with HTLY and INFL (Figure 1D).
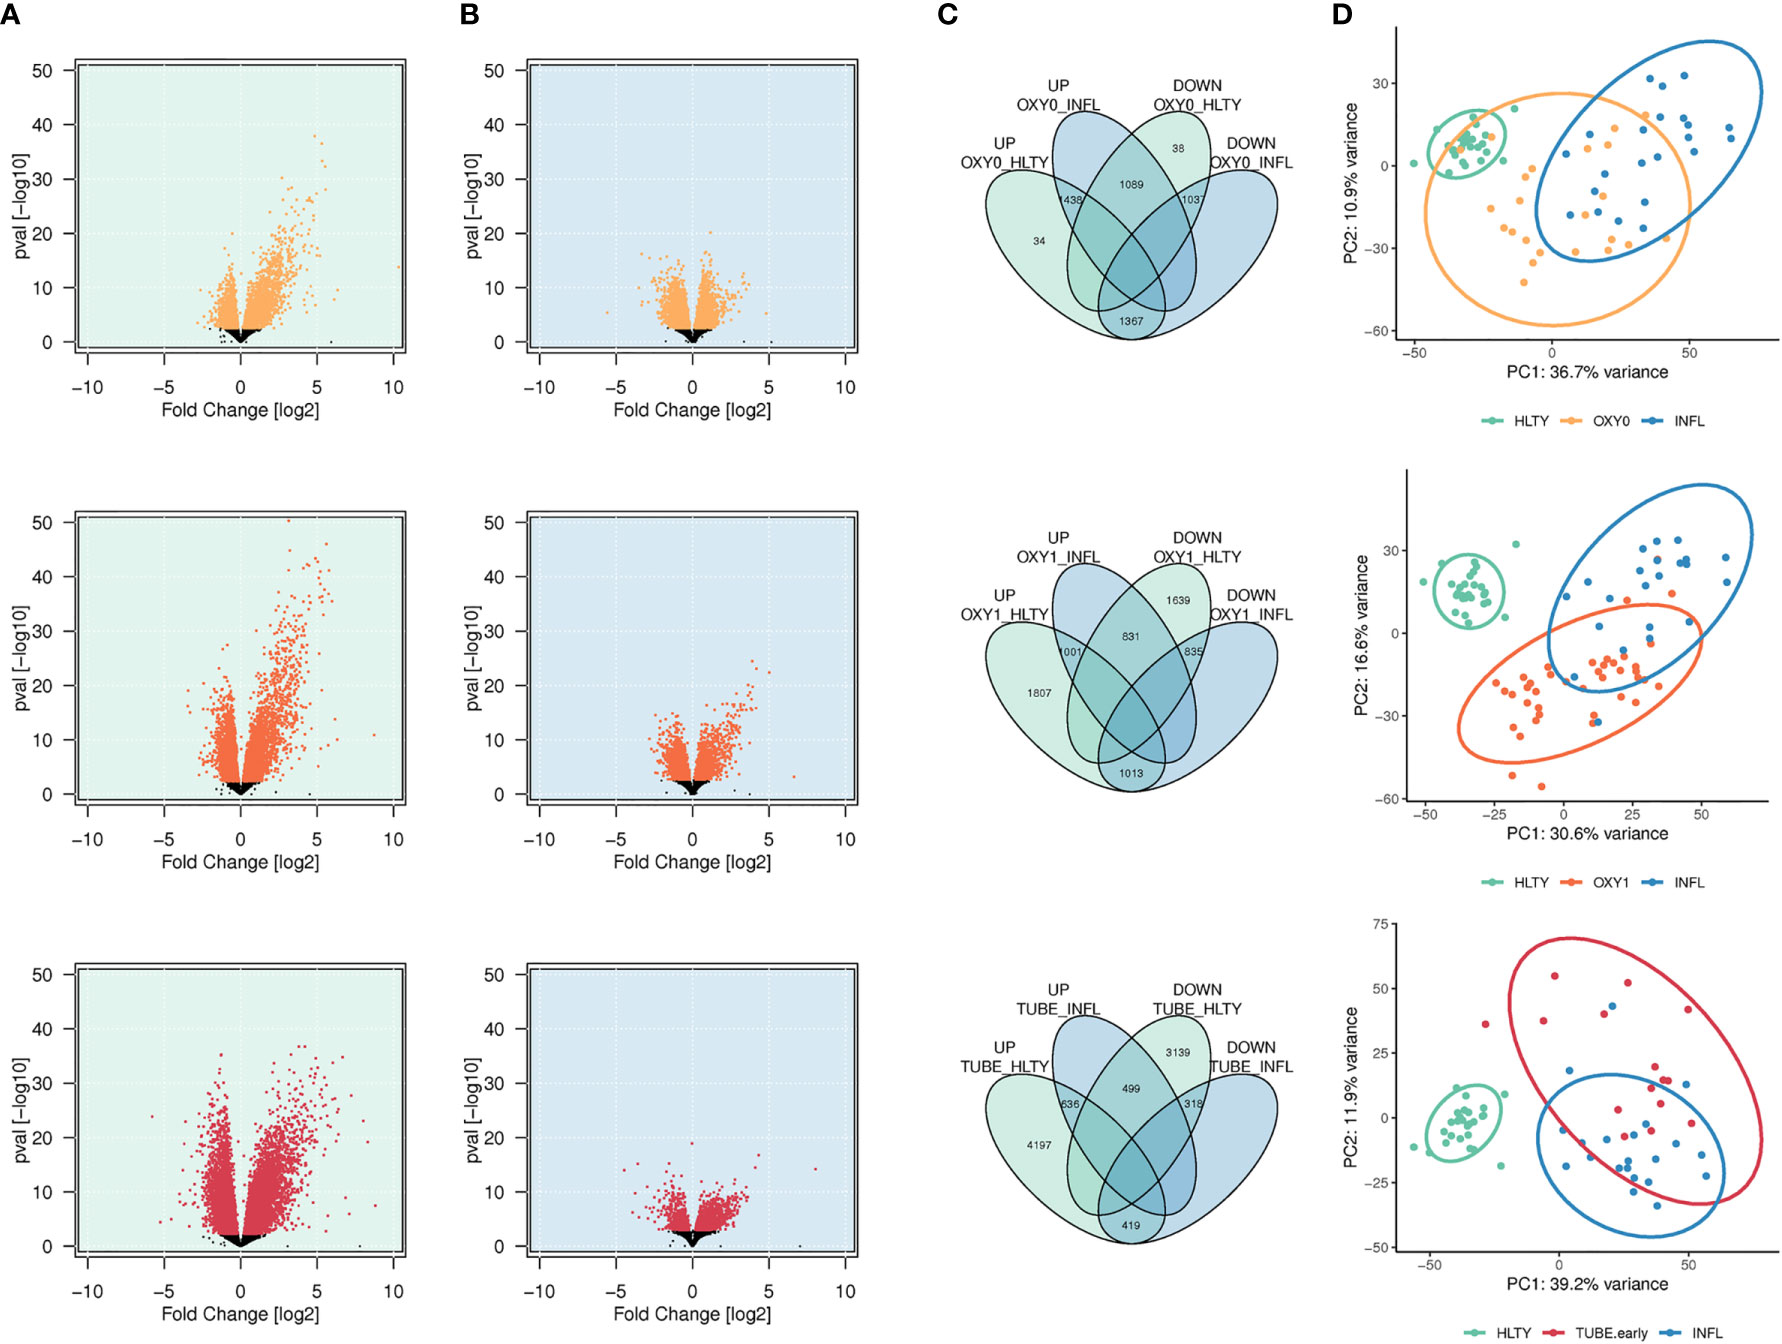
Figure 1 Differential genes expression analysis. (A, B) Volcano plots showing the distribution of log2 fold changes and P-values of differentially expressed genes (DEGs) among SARS-Cov-2 infected patients represented in yellow (no oxygen support, OXY0), orange (oxygen support, OXY1) and red (intubated with sampling within 7 days in hospital, TUBE EARLY), respectively, using non-infected controls (HEALTHY, green shadow, A) and Influenza-infected patients (INFLUENZA, blue shadow, B), as a reference group. Genes with a -log10 (P-value) not significant once adjusted for multiple testing (adjusted P > 0.01) are represented in black (C). Venn diagram showing the number of up or down regulated DEGs in each comparison, and number of common DEGs between comparisons. (D) Principal component analysis of gene expression in Influenza, severe and non-severe SARS-CoV-2 infected patients. The figure presents the two major principal components using the 10% of most significant DEGs. Ellipses were drawn using the stat-ellipse function of the R ggplot2 package, using default parameters.
An unsupervised analysis was performed by using gene pathways sets from the Kyoto Encyclopedia of Genes and Genomes (22, 23) (KEGG, Supplementary Figure 2). Compared to HTLY, TUBE early and INFL had over-expression of genes involved in “human diseases”, including mainly infections (e.g. Influenza A [hsa05164], Epstein-Barr virus infection [hsa05169] or Legionellosis [hsa05134]), but also cancer (e.g. Transcriptional misregulation in cancer [hsa05202]) and inflammatory diseases (e.g. Systemic lupus erythematosus [hsa05322]). However, gene expression was not uniform across both viral infections, with significant under-expression in COVID-19 compared to INFL patients. Core-enriched genes from infectious diseases genes sets largely overlapped with those from immune pathways, encompassing both innate (e.g. Toll-like receptor [hsa04620], TLRs, NOD-like receptor signaling [hsa04621], NLRs, RIG-I like receptor signaling [hsa04622]) and adaptive immunity (e.g. Natural Killer cell mediated cytotoxicity [hsa04650], T [hsa04660] and B [hsa04662] cells signaling), which were also under-expressed among COVID-19 compared to INFL. Under-expression tended to decrease with increased COVID-19 severity. Conversely, a group of pathways covering “cellular processes” (e.g. cell cycle [hsa04110]) and “metabolism” (e.g. oxidative phosphorylation [hsa00190]), sharing a number of core-enriched genes, were up-regulated in COVID-19 compared to INFL, with a gradient from less to more severe COVID-19.
To translate the impact of differentially expressed genes (DEGs) in terms of biological responses, we systematically analyzed sets of genes matching specific immune processes (Figure 2). Representative sets available from KEGG (22), Gene Ontology [GO (24, 25)], Reactome (26) or Human Genome Organization (HUGO) Gene Nomenclature Committee [HGNC (27)] were selected (Supplementary Table 2) and shown by heatmaps and/or volcano plots, with specific genes data detailed on box-plots. For the sake of simplicity, expression patterns across the different groups were regarded as “ascending” or “descending”, when expression levels progressively increased, or decreased, respectively, from HLTY to OXY0, OXY1, TUBE early, and IFNL (Supplementary Figure 3 first and second rows). Patterns were qualified to have a “hill” or “valley” shape, when highest and lowest expression levels were seen in COVID-19 (OXY1 or TUBE early), and the lowest and highest in the other (HLTY and INFL), respectively (Supplementary Figure 3 third and fourth rows). Because the TUBE late group often represented a convalescent status, their gene expression levels were ignored in this pattern description.
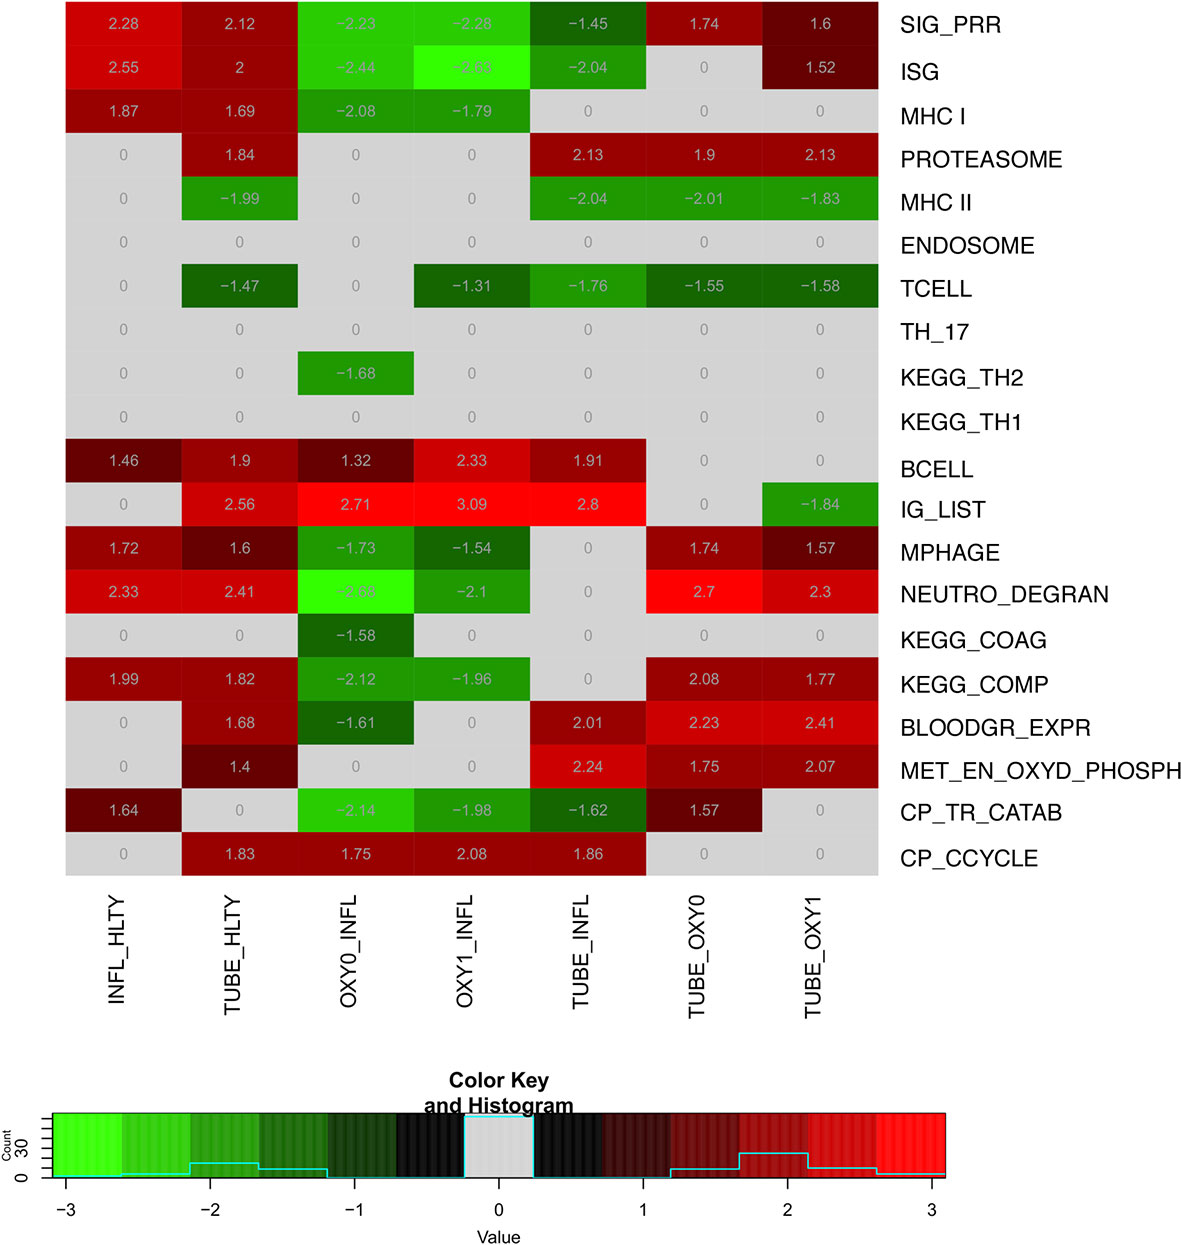
Figure 2 Heatmap of differentially expressed genes (DEGs) sets for indicated pairwise comparisons. Groups used for comparisons (columns) include SARS-Cov-2 infected patients with no oxygen support [OXY0], oxygen support [OXY1], intubation with sampling within 7 days (TUBE early) or >7 days (TUBE late) after hospital admission, Influenza virus (INFL) infected patients and non-infected controls (HLTY). Significantly (adj. P-Value <=0.05) enriched genes sets (rows) are selected from different GO, REACTOME and/or KEGG pathways (see Supplementary Table 2), and their normalized enrichment score (NES) is indicated in each cell and used for coloring.
When considering innate immune pathways, we first analyzed sets of genes encoding PRR and their signaling effectors, ISGs as well as cytokines/chemokines. Most genes involved in antiviral signaling were over-expressed both in TUBE early and INFL patients compared to HLTY (Supplementary Figure 4; pathways involved in the detection of Influenza A and other RNA viruses), but gene expression was significantly lower among COVID-19 than among INFL (Figure 3). Most striking was the under-expression of genes involved in viral recognition (e.g. TLR7, UNC93B, RIG-I/DDX58, Figure 3), as well as genes encoding downstream signaling molecules and transcription factors (e.g. TRIF/TICAM1, MYD88, IRF7, Figure 3), with the notable exception of IRF4, in COVID-19 compared to INFL (Figure 4). Moreover, compared to INFL there was also a significant under-expression of genes involved in interferons signaling and ISGs (e.g. STAT2, IRF9, SOCS1, MX1, OAS2, TRIM6, Figure 4). Most of these genes had expression levels increasing from less to more severe COVID-19 (“ascending” pattern). Gene expression levels for cytokines and chemokines could not always be assessed (Supplementary Figure 5); when measurable, their expression levels and that of their receptors tended to be lower among COVID-19 compared to INFL, although the pattern was not uniform and depended on structural groups. In particular, genes coding for cytokines from the IL-4-like and IL-1-like subfamilies had lower expression levels among OXY0 and/or OXY1, whereas those belonging to the TGF-B family tended to have higher expression levels among OXY0, compared to INFL.
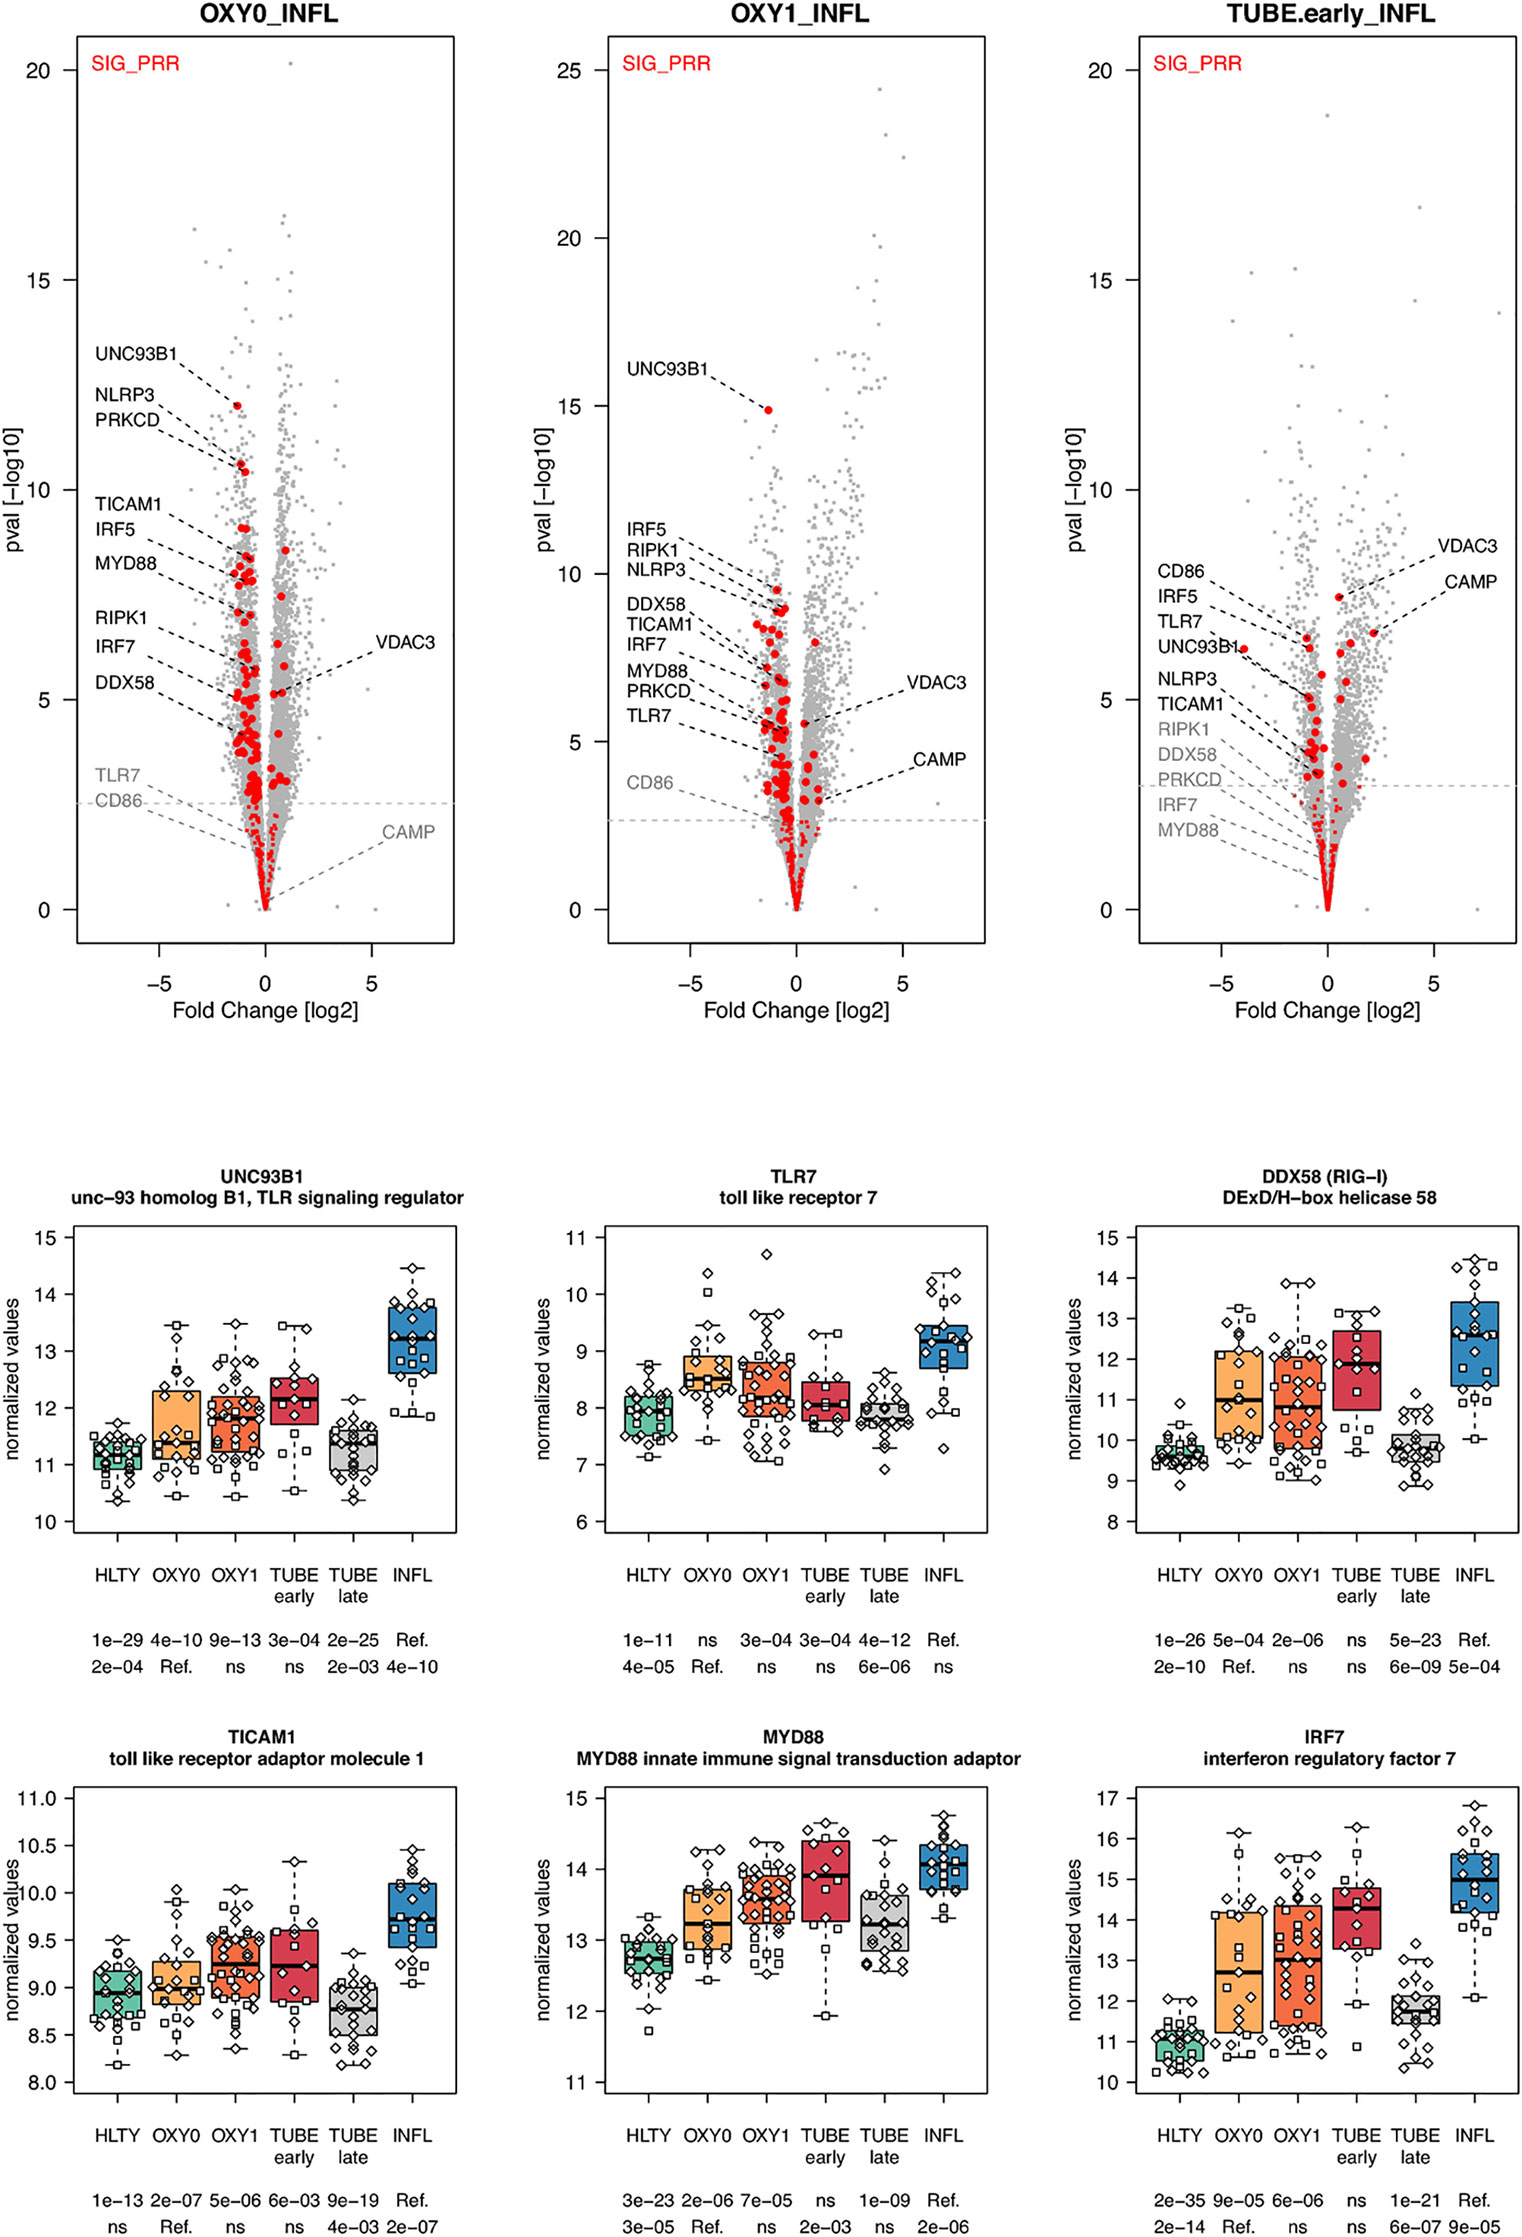
Figure 3 Differentially expressed genes (DEGs) involved in innate immune detection of viruses. Upper panel: for each comparison indicated in the volcano plot header, the distribution of log2 fold changes and P-values of all detected genes is shown as gray dots. Red dots indicate genes included in the SIG_PRR gene set (innate immune detection of viruses and downstream signal transduction). Genes’ sets are selected from different GO, REACTOME and/or KEGG pathways (see Supplementary Table 2). The dotted horizontal gray line indicates the limit under which –log10(P-value) becomes non significant once adjusted for multiple testing (adjusted P > 0.01). Lower panel shows detailed expression levels for selected genes. Groups used for comparisons include SARS-Cov-2 infected patients (no oxygen support [OXY0], oxygen support [OXY1], intubation with sampling within 7 days [TUBE early] or >7 days [TUBE late] after hospital admission), Influenza virus [INFL] infected patients and non-infected controls [HLTY]. Adjusted P-values of pairwise comparisons between a reference group (Ref.) and another group are indicated below the x axis. Ref. is taken as [INFL] and [OXY0] on the first and second line, respectively.
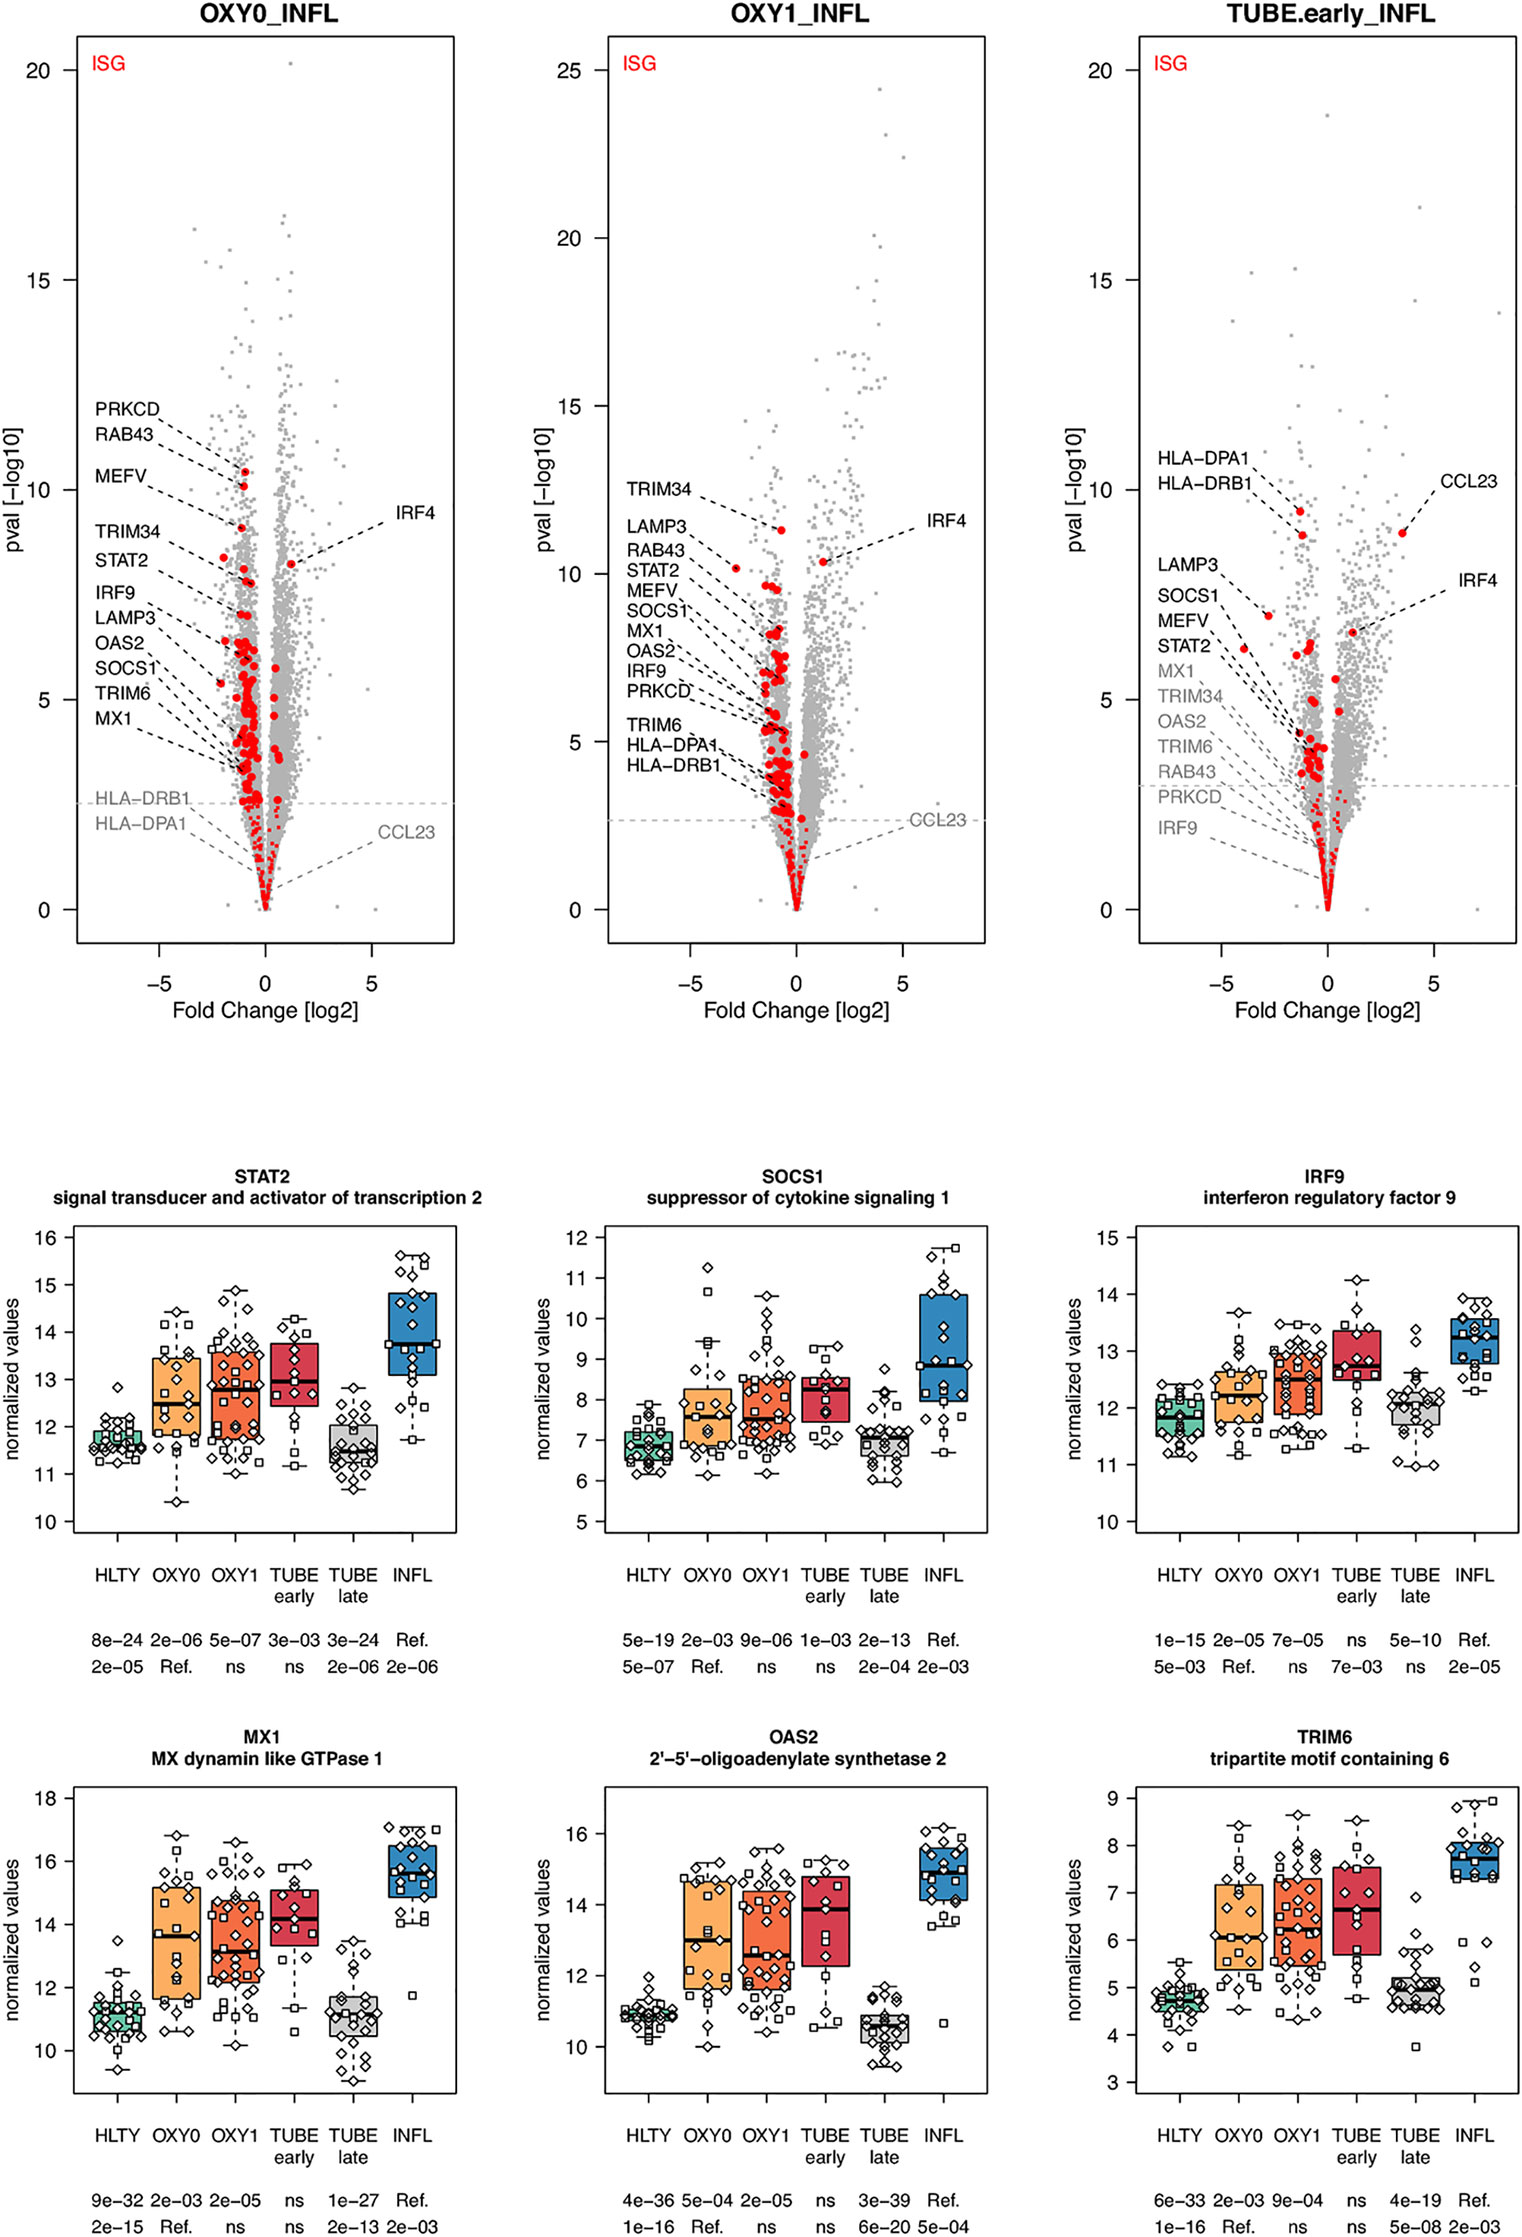
Figure 4 Differentially expressed interferon-stimulated genes. Upper panel: for each comparison indicated in the volcano plot header, the distribution of log2 fold changes and P-values of all detected genes is shown as gray dots. Red dots indicate genes included in the ISGs (interferon-stimulated genes) gene set. Genes’ sets are selected from different GO, REACTOME and/or KEGG pathways (see Supplementary Table 2). The dotted horizontal gray line indicates the limit under which –log10(P-value) becomes non significant once adjusted for multiple testing (adjusted P > 0.01). Lower panel shows detailed expression levels of selected genes involved in IFN signal transduction and IFN stimulated genes in the different groups of patients. Groups used for comparisons include SARS-Cov-2 infected patients (no oxygen support [OXY0], oxygen support [OXY1], intubation with sampling within 7 days [TUBE early] or >7 days [TUBE late] after hospital admission), Influenza virus [INFL] infected patients and non-infected controls [HLTY]. Adjusted P-values of pairwise comparisons between a reference group (Ref.) and another group are indicated below the x axis. Ref. is taken as [INFL] and [OXY0] on the first and second line, respectively.
When considering innate immune cells, we first observed that genes involved in NK cell functions had an overall lower expression levels in TUBE early compared to HLTY (Supplementary Figure 6 right panel) and in each COVID-19 group compared to INFL (Figure 5 and Supplementary Figure 6 left panel). Some genes important for NK cell maturation were significantly under-expressed, with a “valley” pattern (e.g. Killer-cell inhibitory-receptors such as KIR2DL1 or KIR3DL2, as well as TBX21) or an “ascending” pattern (FCGR3B, Figure 5). Genes important for NK cell cytotoxicity also harbored a “valley” (perforin/PRF1, granulysin/GNLY, KSP37/FGFBP2) or “ascending” pattern (CD107a/LAMP1). In contrast, NKG2A/KLRC1 and LAG3 were not overexpressed and CD94/KLRD1 was even under-expressed among TUBE early compared to both HTLY (Supplementary Figure 6 left panel) and INFL (Figure 5). Genes involved in macrophage and neutrophils were over-expressed in patients infected with viruses (COVID-19 and INFL) compared to HLTY (“ascending” pattern, e.g. CLEC4D and CD55, Figure 6). Genes involved in neutrophil degranulation (e.g. GGH) and/or other neutrophil functions (S100A8/9 and S100A12) had a peak of expression in the TUBE early group (“hill” pattern, Figure 6).
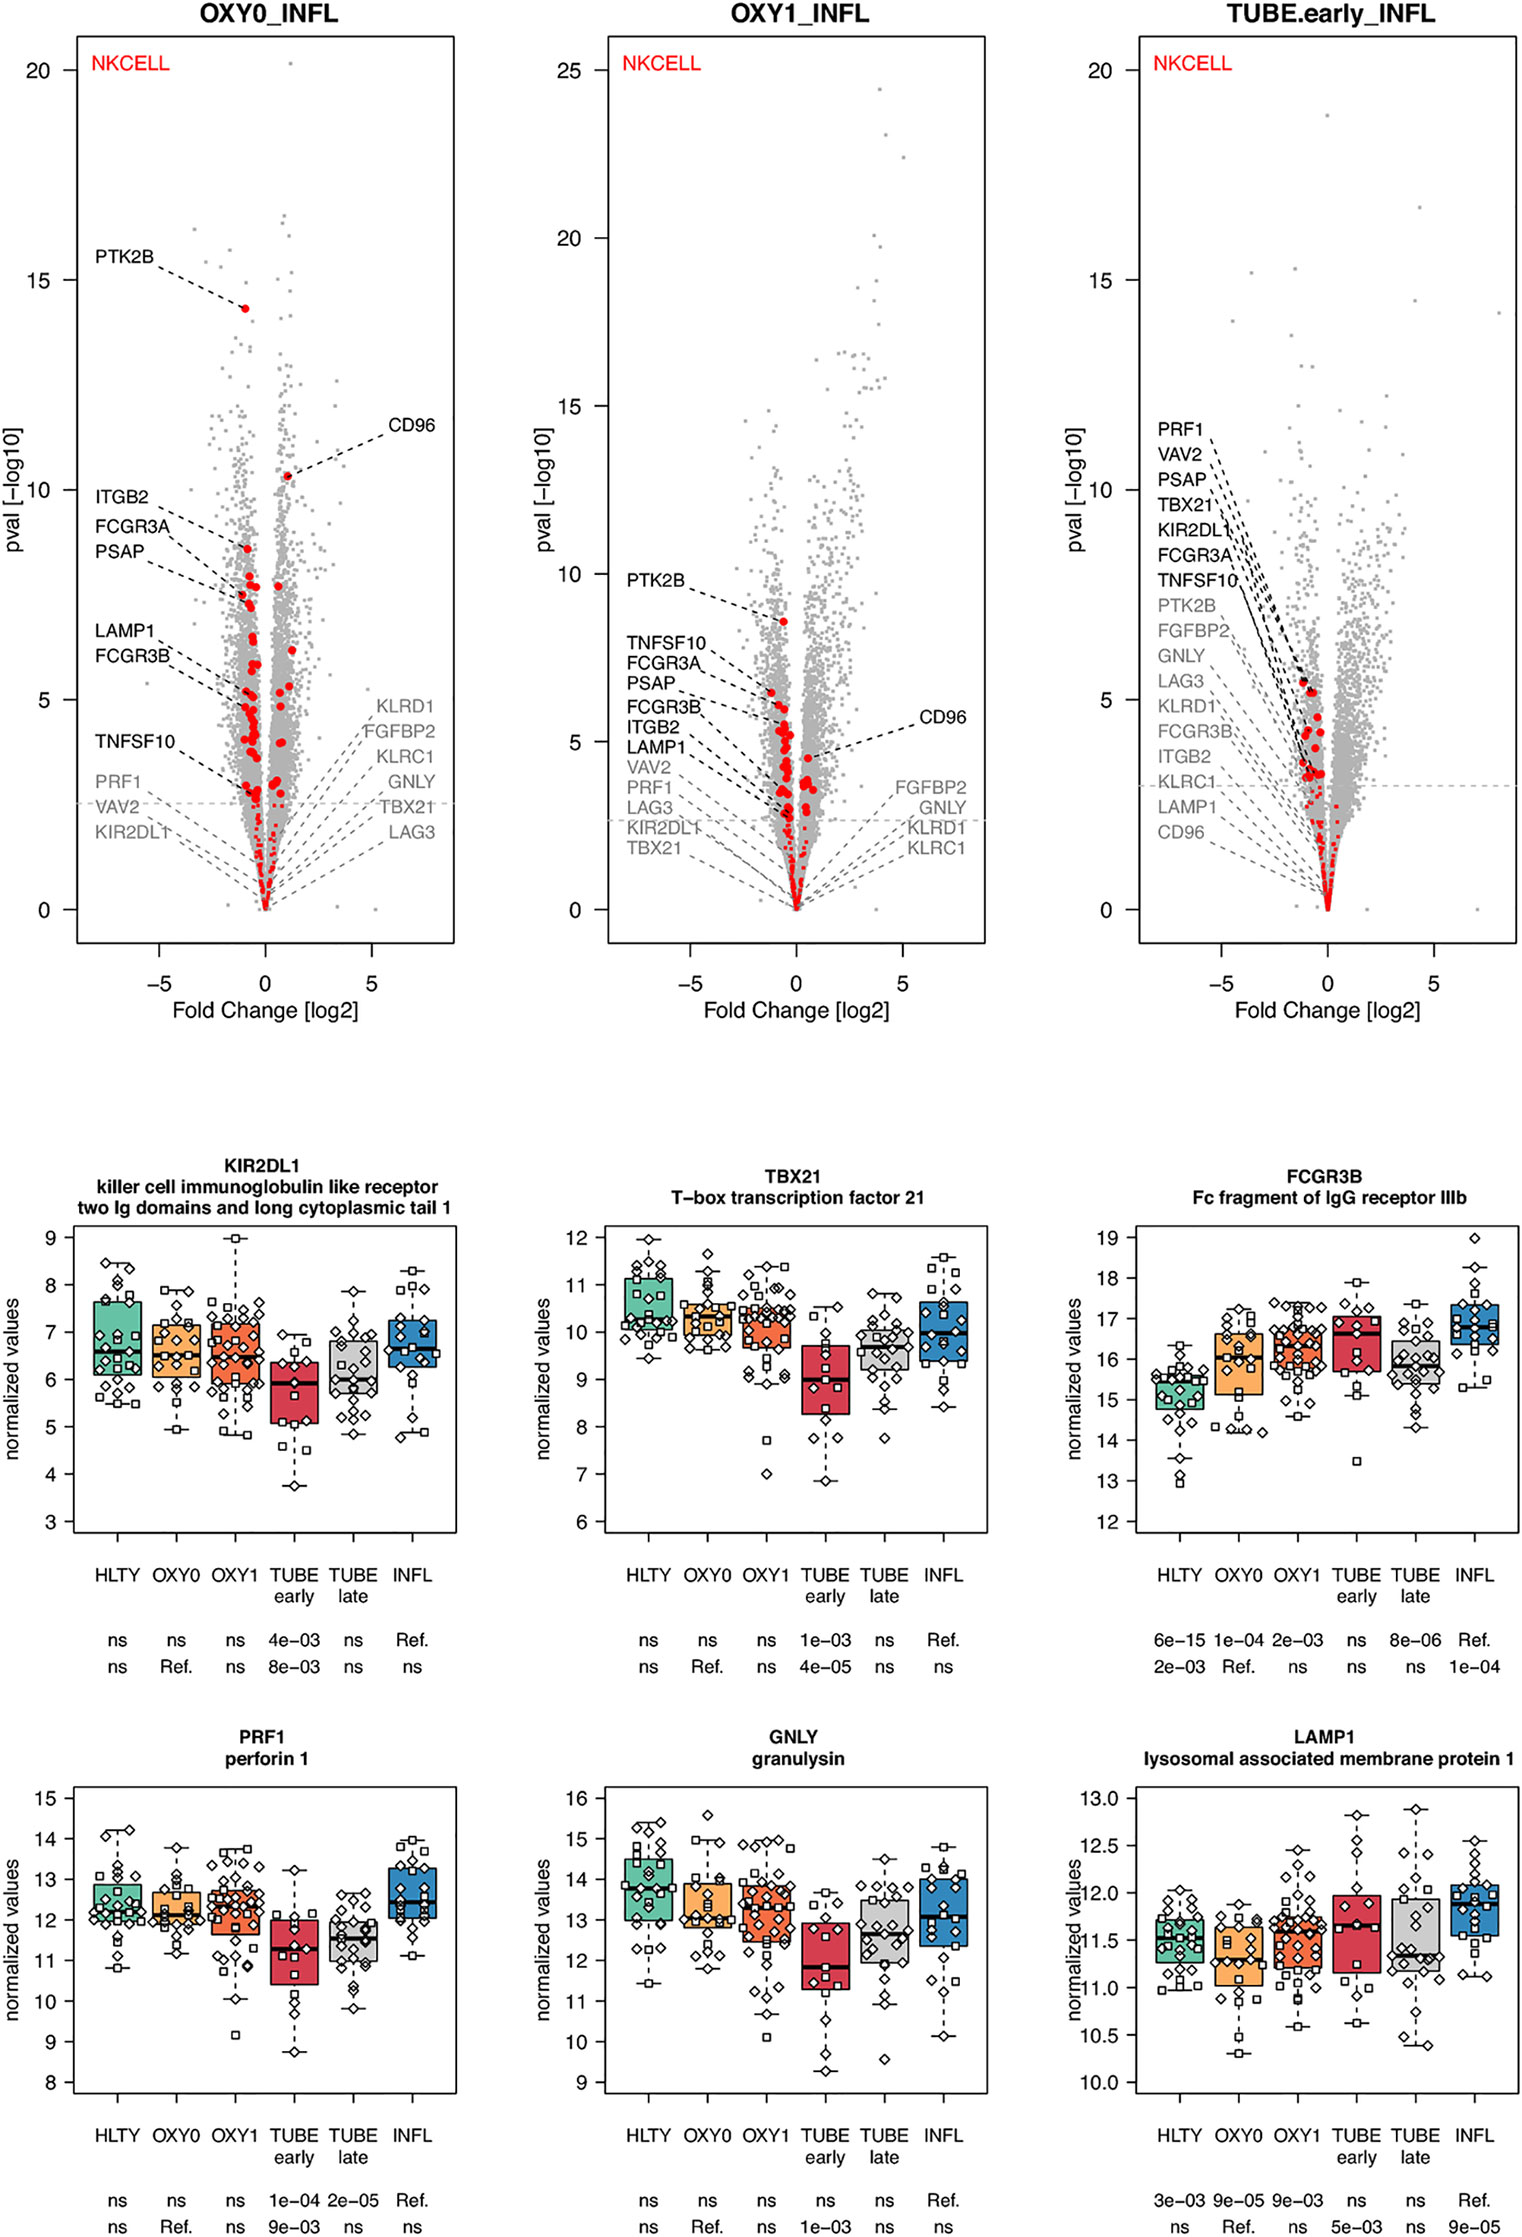
Figure 5 Differentially expressed genes (DEGs) involved in NK cells function and regulation. Upper panel: for each comparison indicated in the volcano plot header, the distribution of log2 fold changes and P-values of all detected genes is shown as gray dots. Red dots indicate genes involved in NK cells function and regulation. Genes’ sets are selected from different GO, REACTOME and/or KEGG pathways (see Supplementary Table 2). The dotted horizontal gray line indicates the limit under which –log10(P-value) becomes non significant once adjusted for multiple testing (adjusted P > 0.01). Lower panel shows detailed expression levels of selected genes involved in NK cells function and regulation in the different groups of patients. Groups used for comparisons include SARS-Cov-2 infected patients (no oxygen support [OXY0], oxygen support [OXY1], intubation with sampling within 7 days [TUBE early] or >7 days [TUBE late] after hospital admission), Influenza virus [INFL] infected patients and non-infected controls [HLTY]. Adjusted P-values of pairwise comparisons between a reference group (Ref.) and another group are indicated below the x axis. Ref. is taken as [INFL] and [OXY0] on the first and second line, respectively.
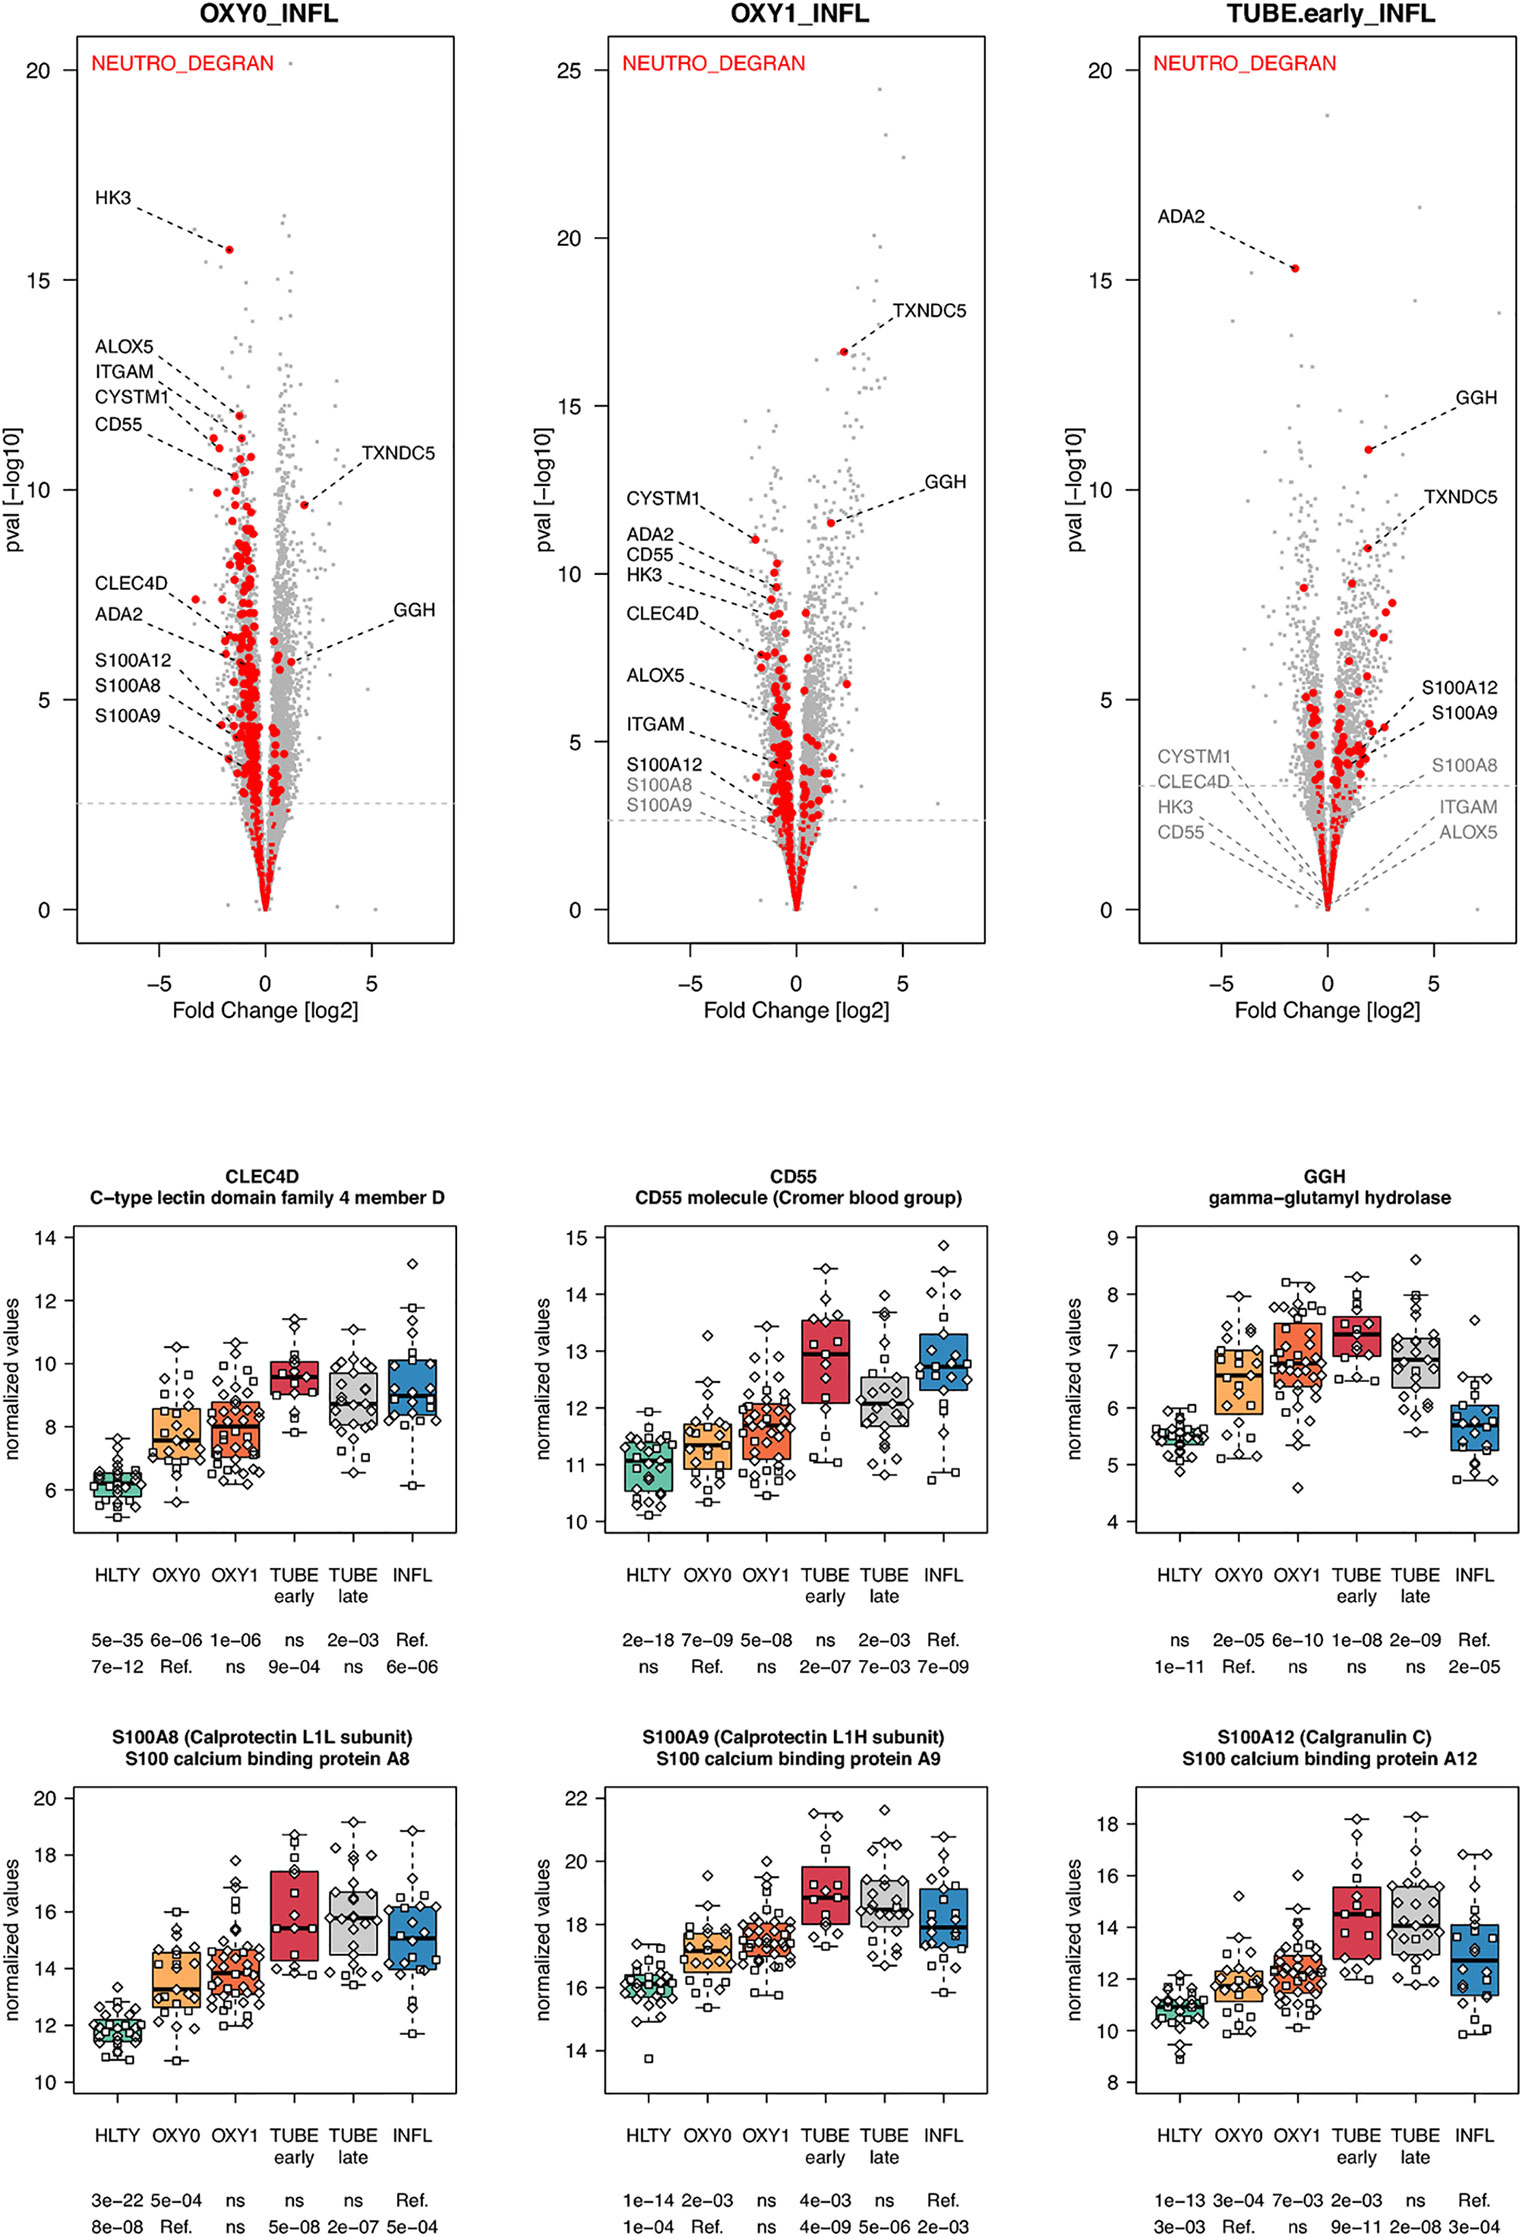
Figure 6 Differentially expressed genes (DEGs) involved in macrophages and neutrophils functions. Upper panel: for each comparison indicated in the volcano plot header, the distribution of log2 fold changes and P-values of all detected genes is shown as gray dots. Red dots indicate genes involved in neutrophils degranulation. Genes’ sets are selected from different GO, REACTOME and/or KEGG pathways (see Supplementary Table 2). The dotted horizontal gray line indicates the limit under which –log10(P-value) becomes non significant once adjusted for multiple testing (adjusted P > 0.01). Lower panel shows detailed expression levels of selected genes involved in macrophages function and neutrophils degranulation in the different groups of patients. Groups used for comparisons include SARS-Cov-2 infected patients (no oxygen support [OXY0], oxygen support [OXY1], intubation with sampling within 7 days [TUBE early] or >7 days [TUBE late] after hospital admission), Influenza virus [INFL] infected patients and non-infected controls [HLTY]. Adjusted P-values of pairwise comparisons between a reference group (Ref.) and another group are indicated below the x axis. Ref. is taken as [INFL] and [OXY0] on the first and second line, respectively.
Adaptive immune pathways were notable for genes involved in antigen presentation through MHCI with proteasome, MHCII with endosome, T helper differentiation, proliferation/maturation/function of T and B cells. Genes involved in antigen presentation through the MHC I had higher expression levels among virus-infected patients (TUBE early and INFL) compared to HLTY, with an “ascending” pattern (e.g. HLA-A, HLA-B, TAP-1, TAP-2, Figure 7 and Supplementary Figure 7). In contrast, genes involved in antigen presentation through MHC II presented a “valley” pattern, with under-expression among TUBE early compared to HLTY and COVID-19 compared to INFL, which strikingly predominated in TUBE early (e.g. HLA-DRA, HLA-DRB1, HLA-DQA1, CD74/Ii/CLIP/SLIP, Figure 7).
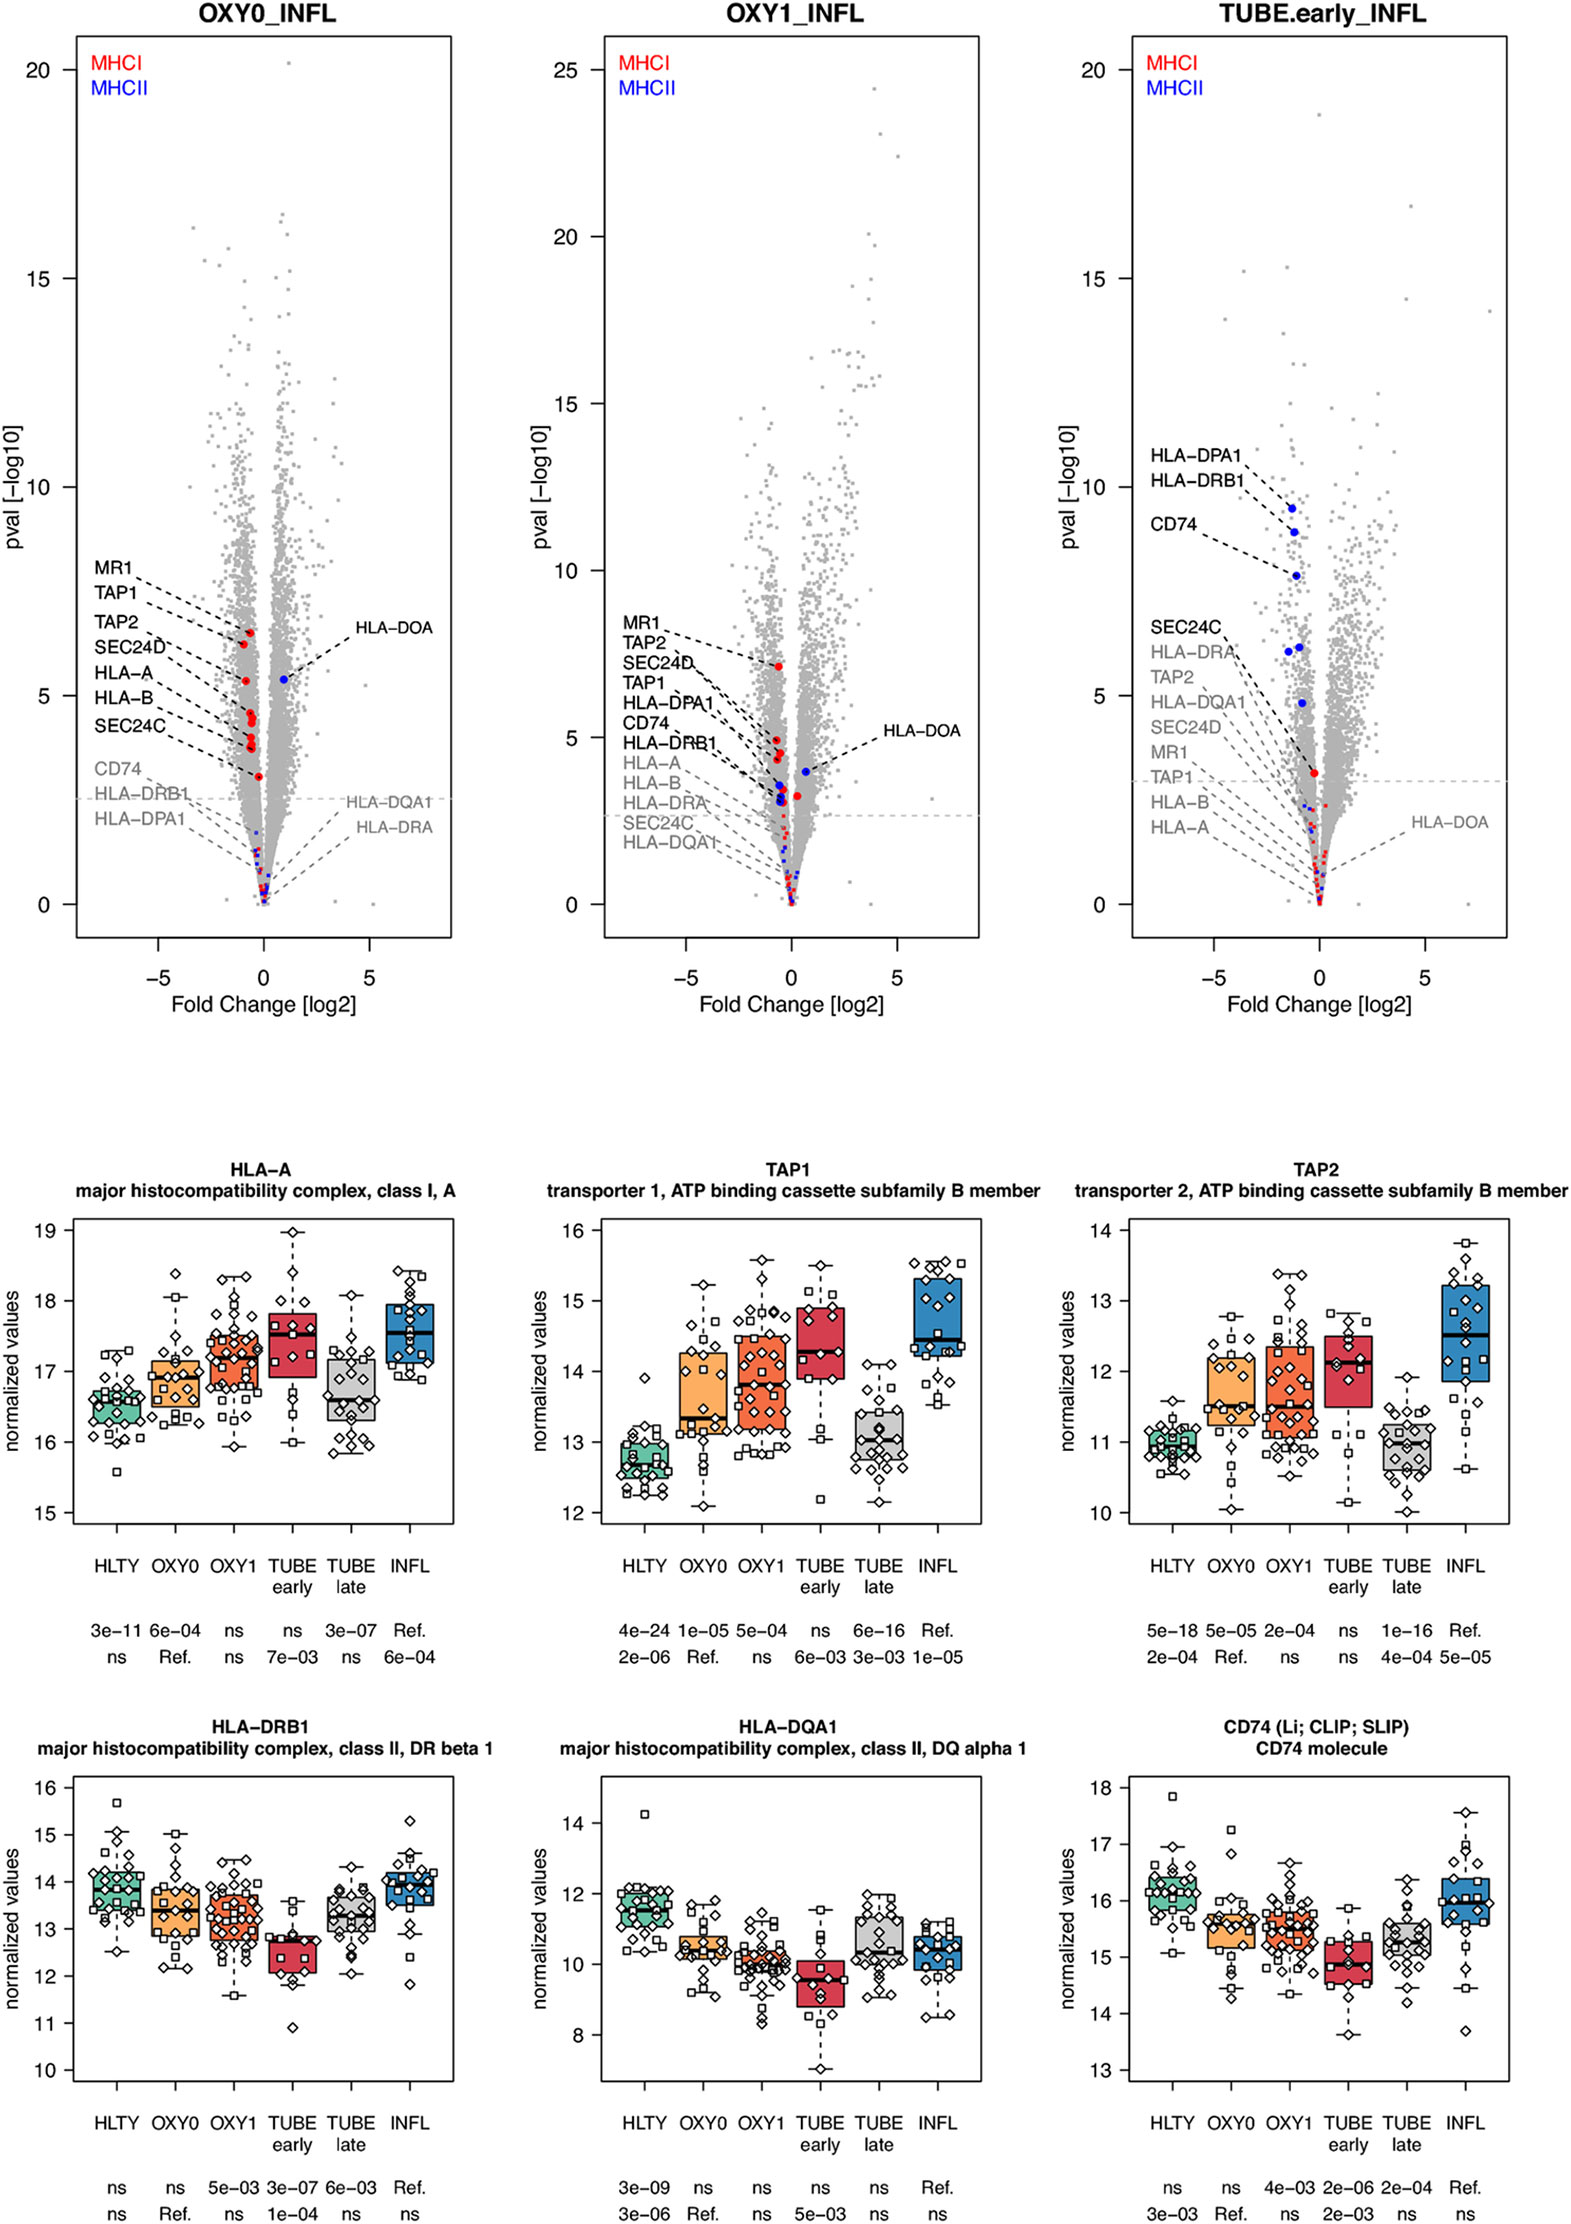
Figure 7 Differentially expressed genes (DEGs) involved in antigen presentation. Upper panel: for each comparison indicated in the volcano plot header, the distribution of log2 fold changes and P-values of all detected genes is shown as gray dots. Red and blue dots indicate genes involved in antigen presentation through the MHC I and MHCII respectively. Genes’ sets are selected from different GO, REACTOME and/or KEGG pathways (see Supplementary Table 2). The dotted horizontal gray line indicates the limit under which –log10(P-value) becomes non significant once adjusted for multiple testing (adjusted P > 0.01). Lower panel shows detailed expression levels of selected genes involved in antigen presentation through the MHCI and MHC II in the different groups of patients. Groups used for comparisons include SARS-Cov-2 infected patients (no oxygen support [OXY0], oxygen support [OXY1], intubation with sampling within 7 days [TUBE early] or >7 days [TUBE late] after hospital admission), Influenza virus [INFL] infected patients and non-infected controls [HLTY]. Adjusted P-values of pairwise comparisons between a reference group (Ref.) and another group are indicated below the x axis. Ref. is taken as [INFL] and [OXY0] on the first and second line, respectively.
Genes involved in T cell functions had contrasting expression levels (Supplementary Figures 8, 9). A majority of them had a “valley” (e.g. CD4, ZAP70, Figure 8; ADA, GATA3, Supplementary Figure 8) or “descending” pattern, with expression levels decreasing from HLTY to COVID-19 and INFL (e.g. CD8, Figure 8; IL7R/IL7Rα, CD3D, IL2RA Supplementary Figure 8). However, some genes still presented an “ascending” pattern, such as the regulatory gene LILRB2 (Figure 8) or a “hill” pattern (e.g. JAK3, IL2RG/γC Figure 8). When focusing on T cell subclasses, some markers of memory were over-expressed (e.g. SELL/CD62L Figure 8, CD103/ITGAE Supplementary Figure 8), while others were under-expressed or unchanged (e.g. CCR7, CD27, CD28 Supplementary Figure 8) in COVID-19 compared to HLTY and INFL, without matching a specific type of memory T cell. Similarly, some markers of T cell activation were over-expressed (e.g. CD38, KI-67/MKI67 Supplementary Figure 8) while other were under-expressed (e.g. IL2RB/CD122, Figure 8, CD69, Supplementary Figure 8) among COVID-19 compared to INFL or HTLY. There were no distinct expression patterns in genes involved in T helper differentiation, except for a decreased expression in TH2-related genes among OXY0 compared to INFL (Supplementary Figures 10-11). Finally, exhaustion genes such as PDCD1/PD-1 or regulatory genes such as FOXP3 were under-expressed among COVID-19 compared to INFL or HTLY, mainly among TUBE early patients (Supplementary Figure 8).
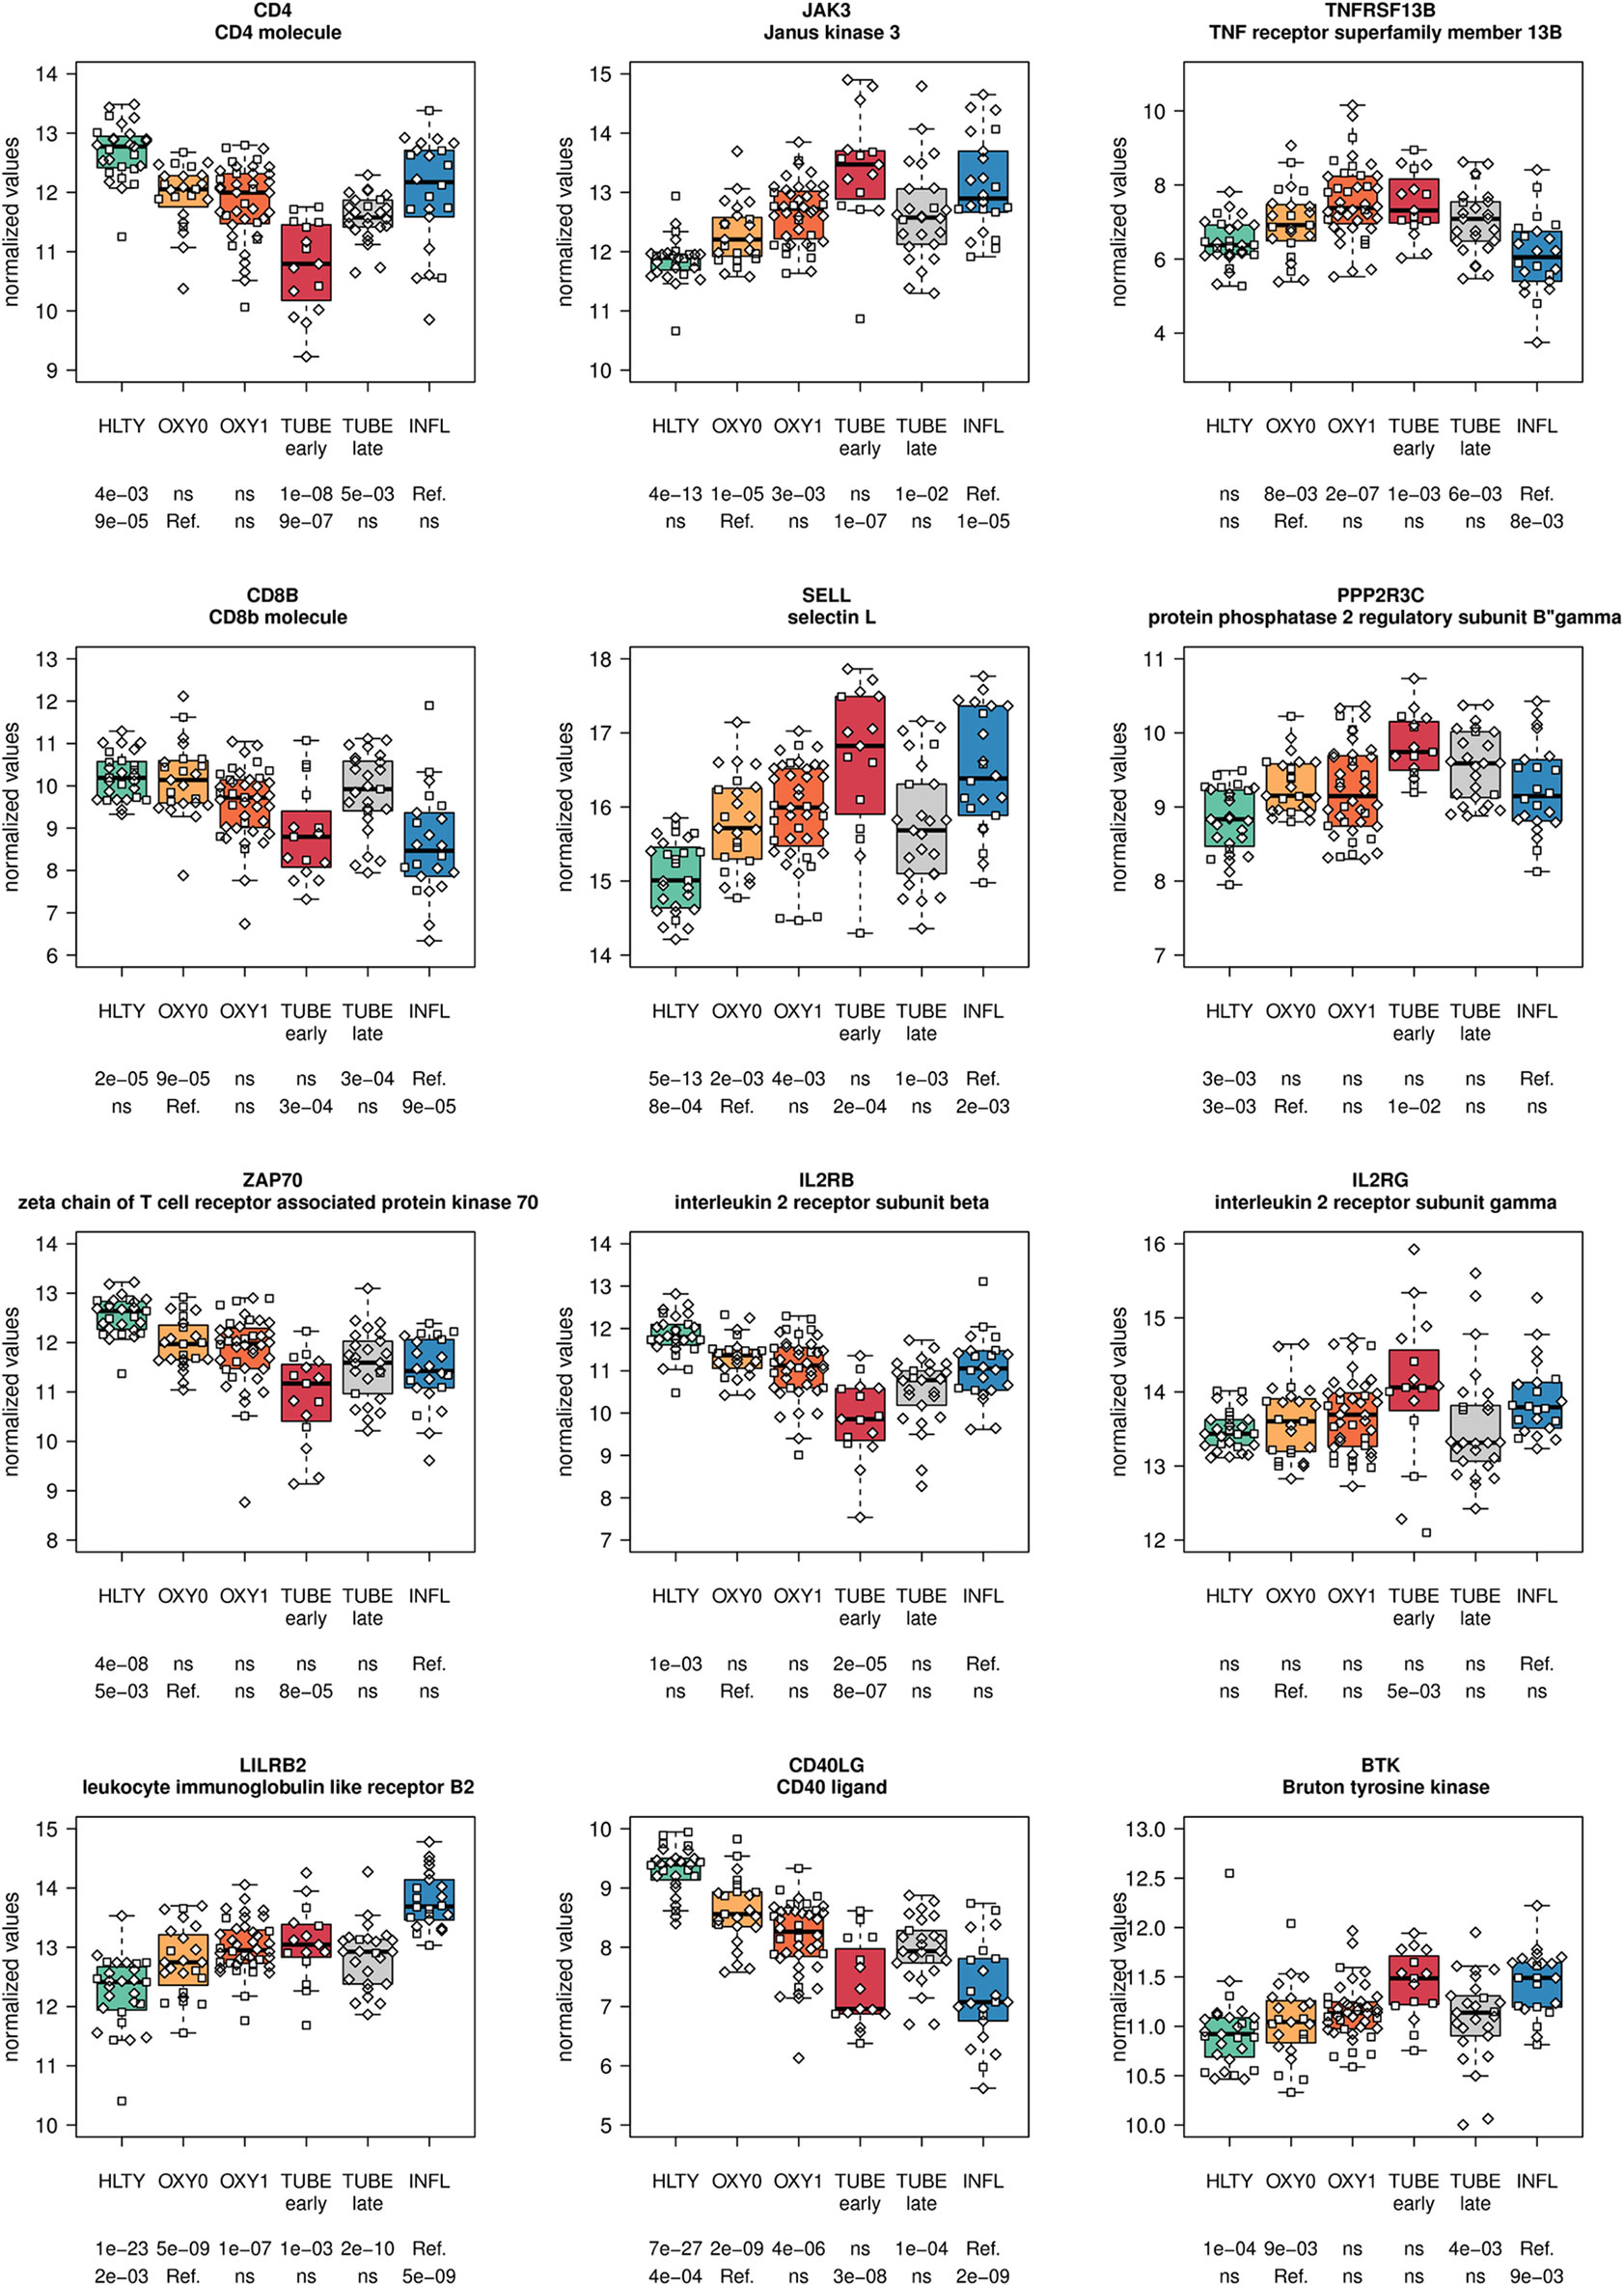
Figure 8 Differentially expressed genes (DEGs) involved in T cells and B cells functions. Expression levels of selected genes involved in T and B cells function and regulation. Groups used for comparisons include SARS-Cov-2 infected patients (no oxygen support [OXY0], oxygen support [OXY1], intubation with sampling within 7 days [TUBE early] or >7 days [TUBE late] after hospital admission), Influenza virus [INFL] infected patients and non-infected controls [HLTY]. Adjusted P-values of pairwise comparisons between a reference group (Ref.) and another group are indicated below the x axis. Ref. is taken as [INFL] and [OXY0] on the first and second line, respectively.
In general, genes involved in B cell functions had higher expression levels among TUBE early than HLTY (Supplementary Figure 12 lower panel). However, the patterns were inconsistent; some genes showed a “hill” pattern (ILR2G, TNFRSF13B/TACI, PPP2R3C, Figure 8), while other showed a “descending” pattern (CD40LG, Figure 8, CD19, UNG, Supplementary Figure 13), as opposed to the “ascending” pattern observed for the Bruton’s tyrosine kinase (BTK, Figure 8). Immunoglobulin-encoding genes were markedly over-expressed in COVID-19 compared to HLTY and INFL, and peaked in OXY1/TUBE EARLY (“hill” pattern, e.g. IGHM, IGHA1, IGHG1, JCHAIN, Figure 9).
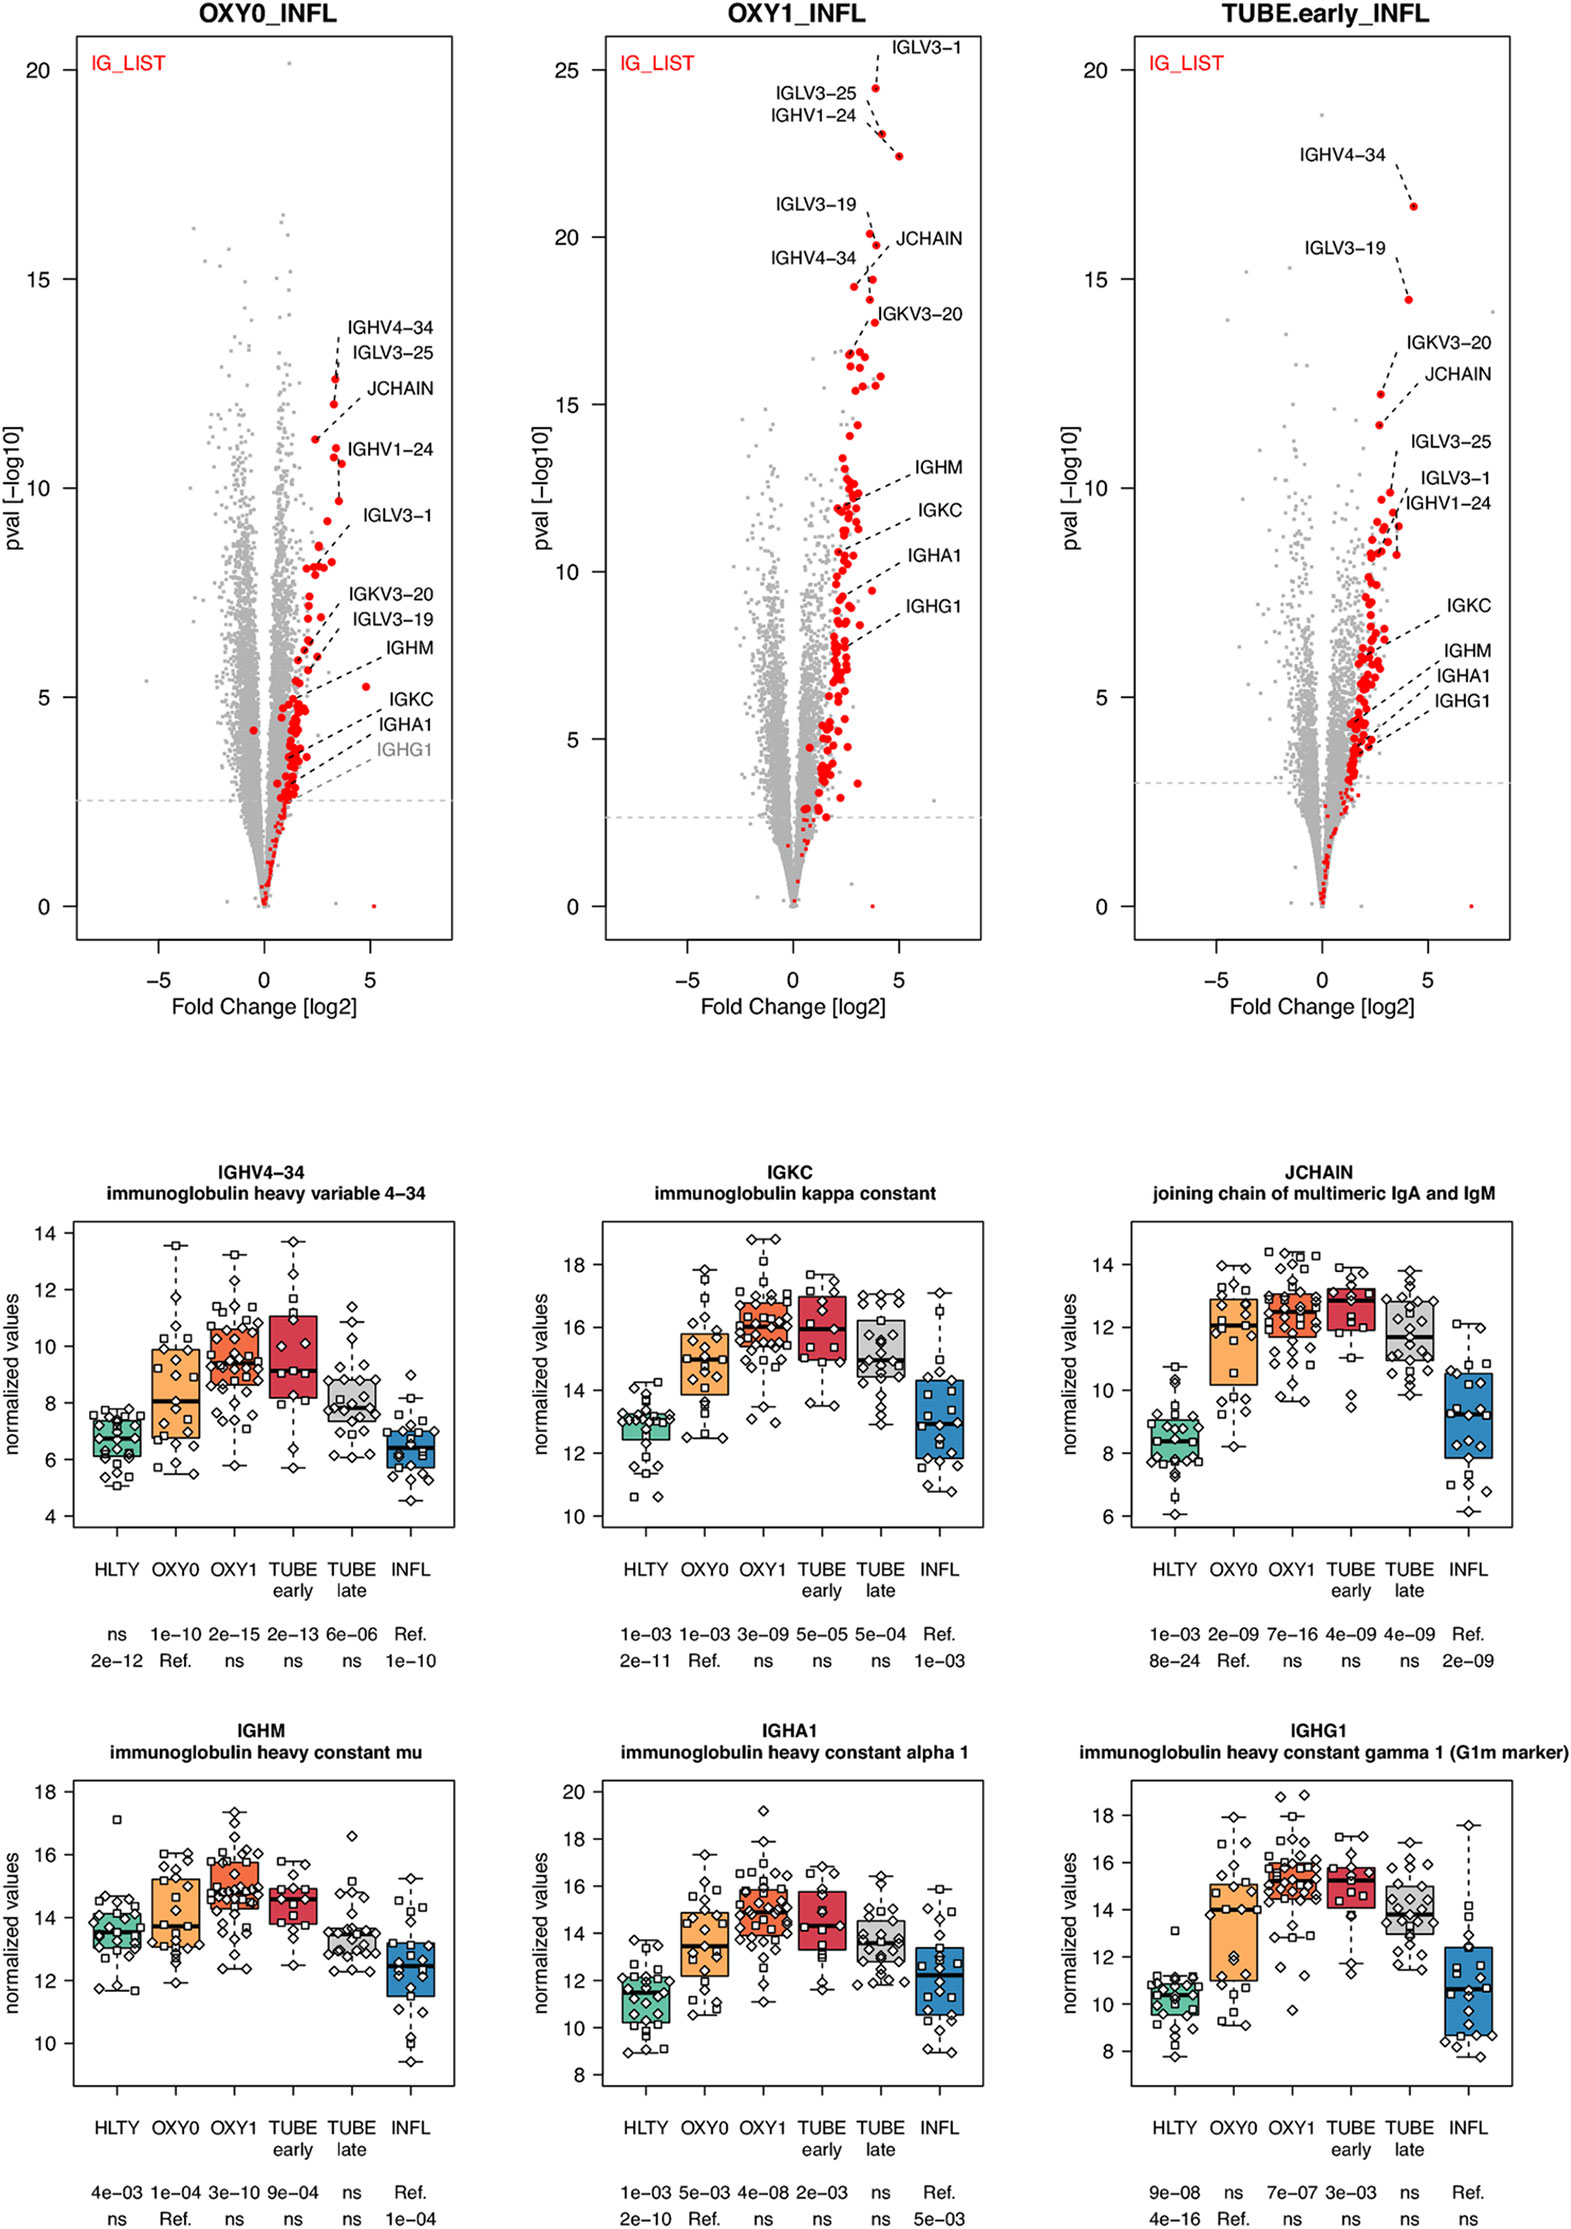
Figure 9 Differentially expressed immunoglobulin encoding genes. Upper panel: for each comparison indicated in the volcano plot header, the distribution of log2 fold changes and P-values of all detected genes is shown as gray dots. Red dots indicate immunoglobulin encoding genes. Genes’ sets are selected from different GO, REACTOME and/or KEGG pathways (see Supplementary Table 2). The dotted horizontal gray line indicates the limit under which –log10(P-value) becomes non significant once adjusted for multiple testing (adjusted P > 0.01). Lower panel shows detailed expression levels of selected immunoglobulin encoding genes in the different groups of patients. Groups used for comparisons include SARS-Cov-2 infected patients (no oxygen support [OXY0], oxygen support [OXY1], intubation with sampling within 7 days [TUBE early] or >7 days [TUBE late] after hospital admission), Influenza virus [INFL] infected patients and non-infected controls [HLTY]. Adjusted P-values of pairwise comparisons between a reference group (Ref.) and another group are indicated below the x axis. Ref. is taken as [INFL] and [OXY0] on the first and second line, respectively.
Most genes involved in the complement cascade were over-expressed in TUBE early and INFL compared to HTLY (Supplementary Figure 14 right panel) but their expression was usually lower among COVID-19 compared to INFL (“ascending” pattern, e.g. C1QC, C2, C5), with the exception of C3, that, was over-expressed in TUBE early compared to INFL patients (Figure 10 and Supplementary Figure 14 left panel). Genes encoding blood groups, some of which are part of the complement cascade (e.g. C4A, C4B) or are involved in complement activation (e.g. CR1, CD55, ABO) or regulation (e.g.CD59, GYPA, GYPB) were overexpressed solely among TUBE patients (e.g. ABO, GYPA, XK, Figure 10 and Supplementary Figure 15). Overall, there was no differential expression for genes involved in the coagulation cascade, except for a decreased expression among OXY0 compared to INFL.
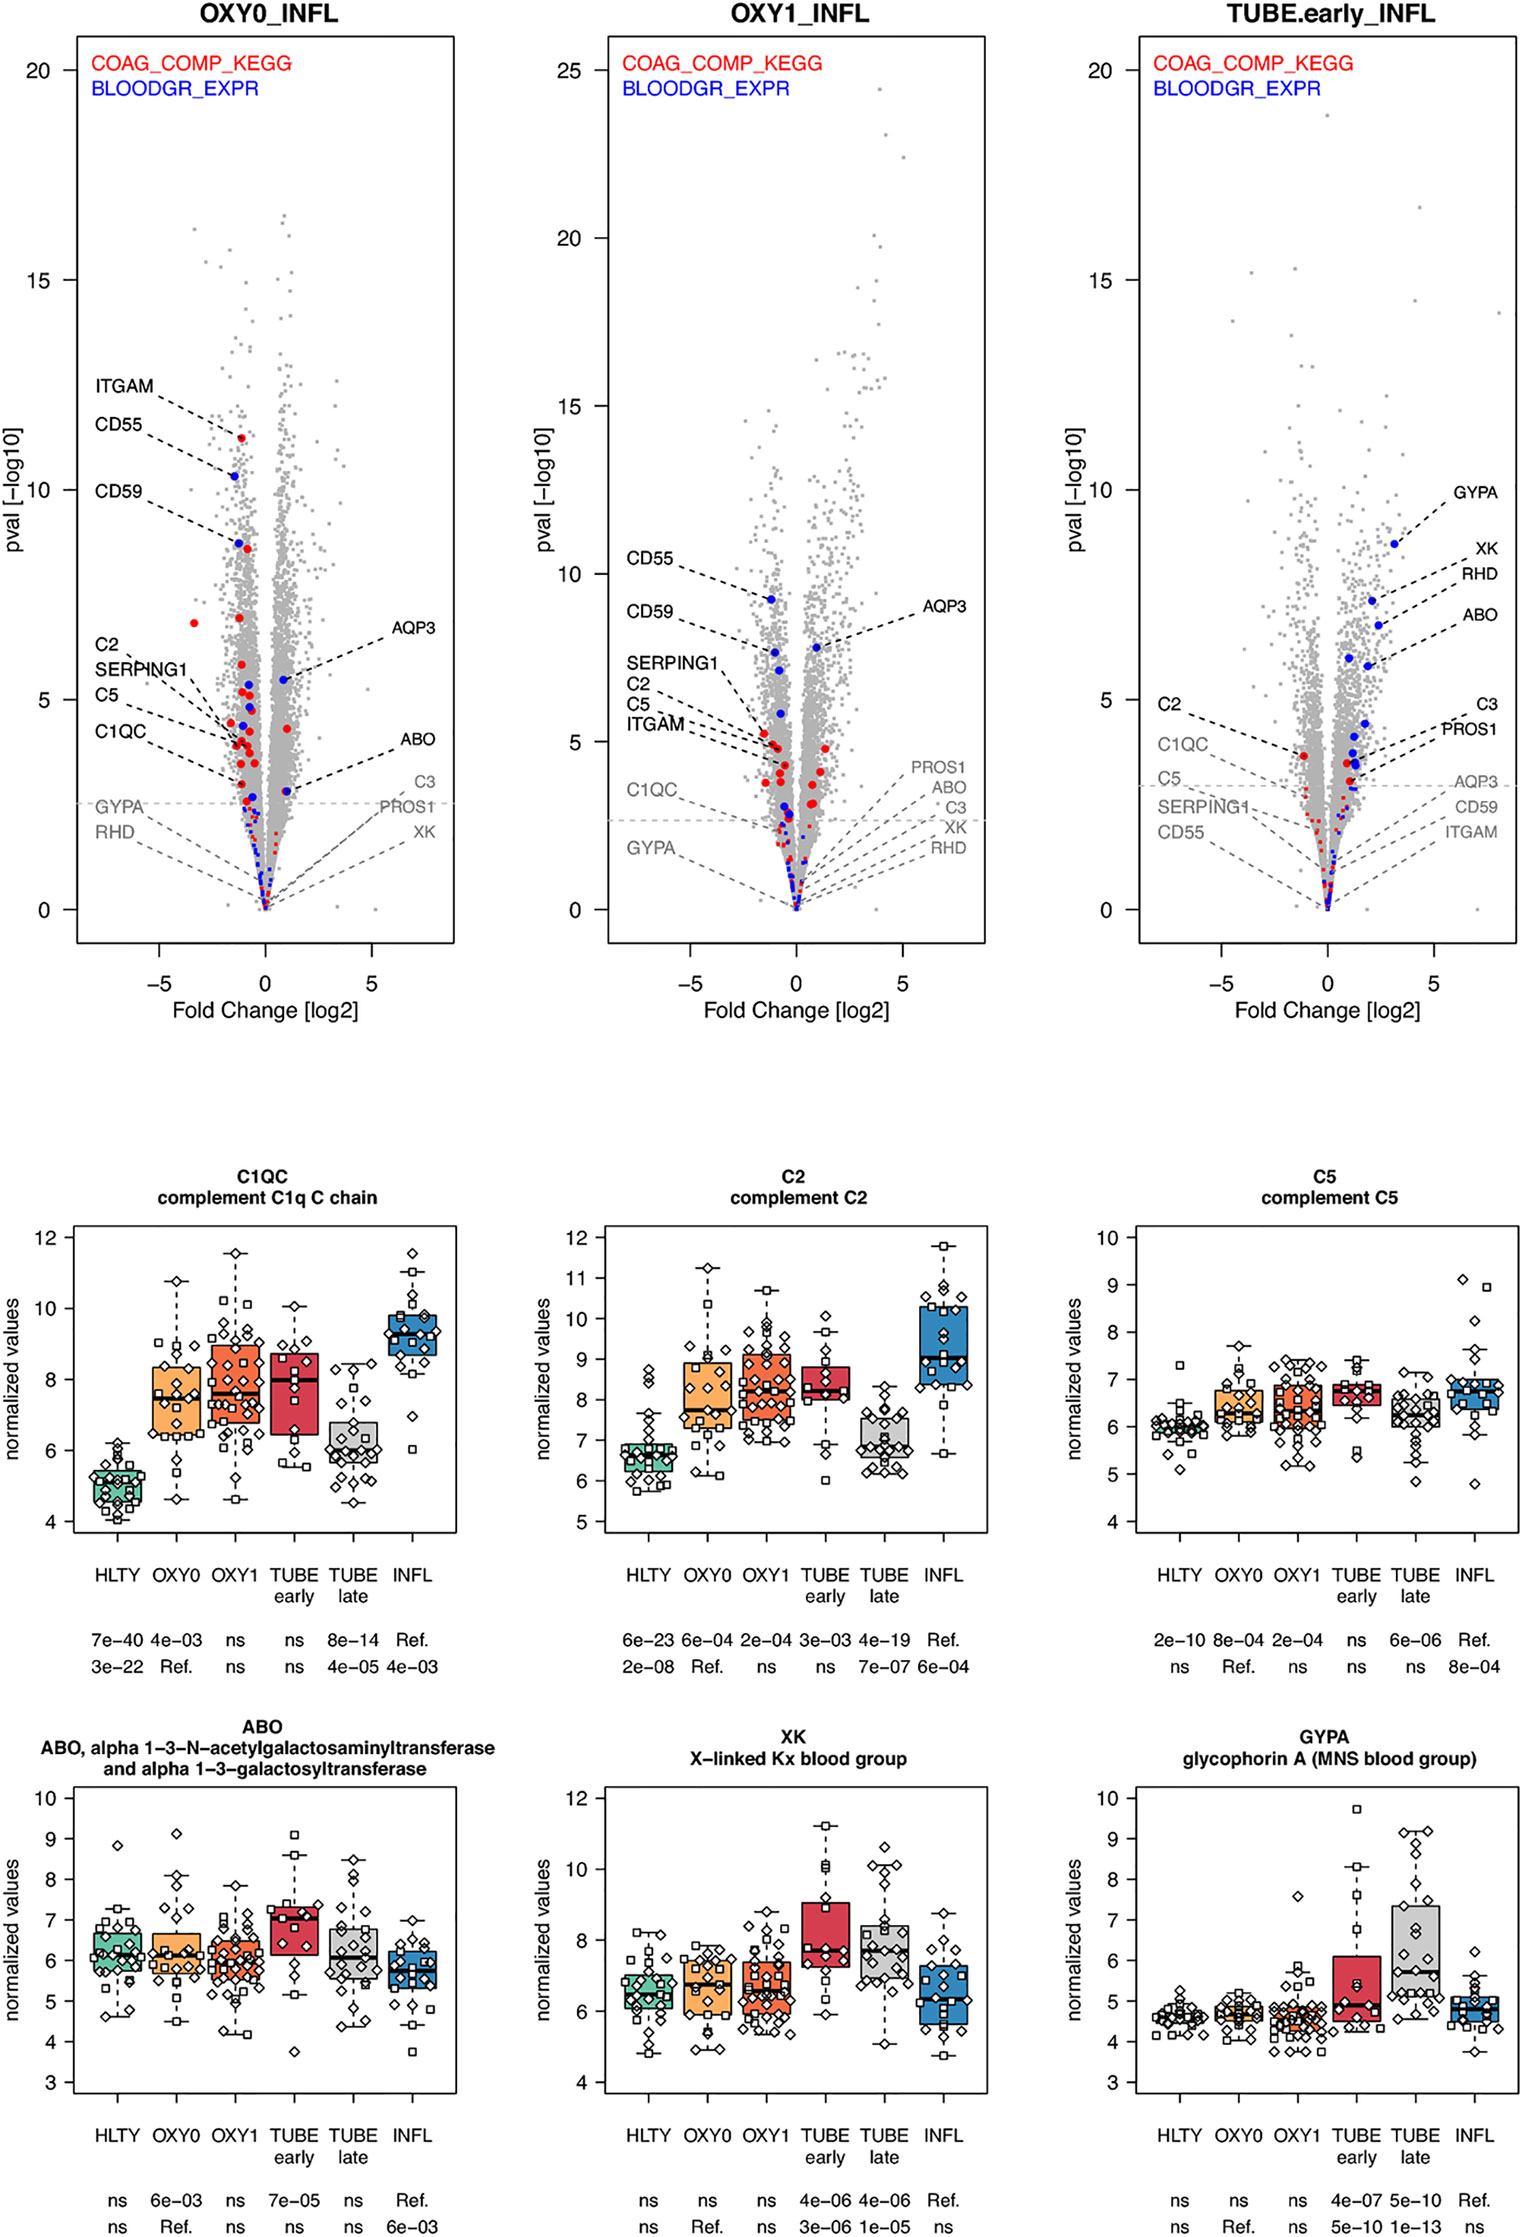
Figure 10 Differentially expressed genes (DEGs) involved in complement system and blood group. Upper panel: for each comparison indicated in the volcano plot header, the distribution of log2 fold changes and P-values of all detected genes is shown as gray dots. Red and blue dots indicate genes involved in complement system and blood group respectively. Genes’ sets are selected from different GO, REACTOME and/or KEGG pathways (see Supplementary Table 2). The dotted horizontal gray line indicates the limit under which –log10(P-value) becomes non significant once adjusted for multiple testing (adjusted P > 0.01). Lower panel shows detailed expression levels of selected genes involved in complement system and blood groups in the different groups of patients. Groups used for comparisons include SARS-Cov-2 infected patients (no oxygen support [OXY0], oxygen support [OXY1], intubation with sampling within 7 days [TUBE early] or >7 days [TUBE late] after hospital admission), Influenza virus [INFL] infected patients and non-infected controls [HLTY]. Adjusted P-values of pairwise comparisons between a reference group (Ref.) and another group are indicated below the x axis. Ref. is taken as [INFL] and [OXY0] on the first and second line, respectively.
Genes involved in metabolism, such as oxidative phosphorylation, were over-expressed mainly in TUBE patients compared to all others (“hill” pattern, e.g. NDUFV2, UQCRQ, ATP5PF, ACAT1, HIBCH and B4GALT2, Figure 11). Genes involved in cell cycle, were over-expressed among COVID-19 compared to both HLTY controls and INFL, with a “hill” pattern (e.g. PTTG1, CDC6, MAD2L1, E2F1, Figure 12). Accordingly, regulator genes (e.g. CDKN1C and TP53, Figure 12) presented a “valley” pattern, with under expression in SARS-CoV-2 infected patients (mainly in TUBE early) compared to both HLTY and INFL patients. Interestingly, genes involved in cell cycle were largely over-expressed among COVID-19 patients compared to both healthy controls and patients infected with Influenza (Data not shown).
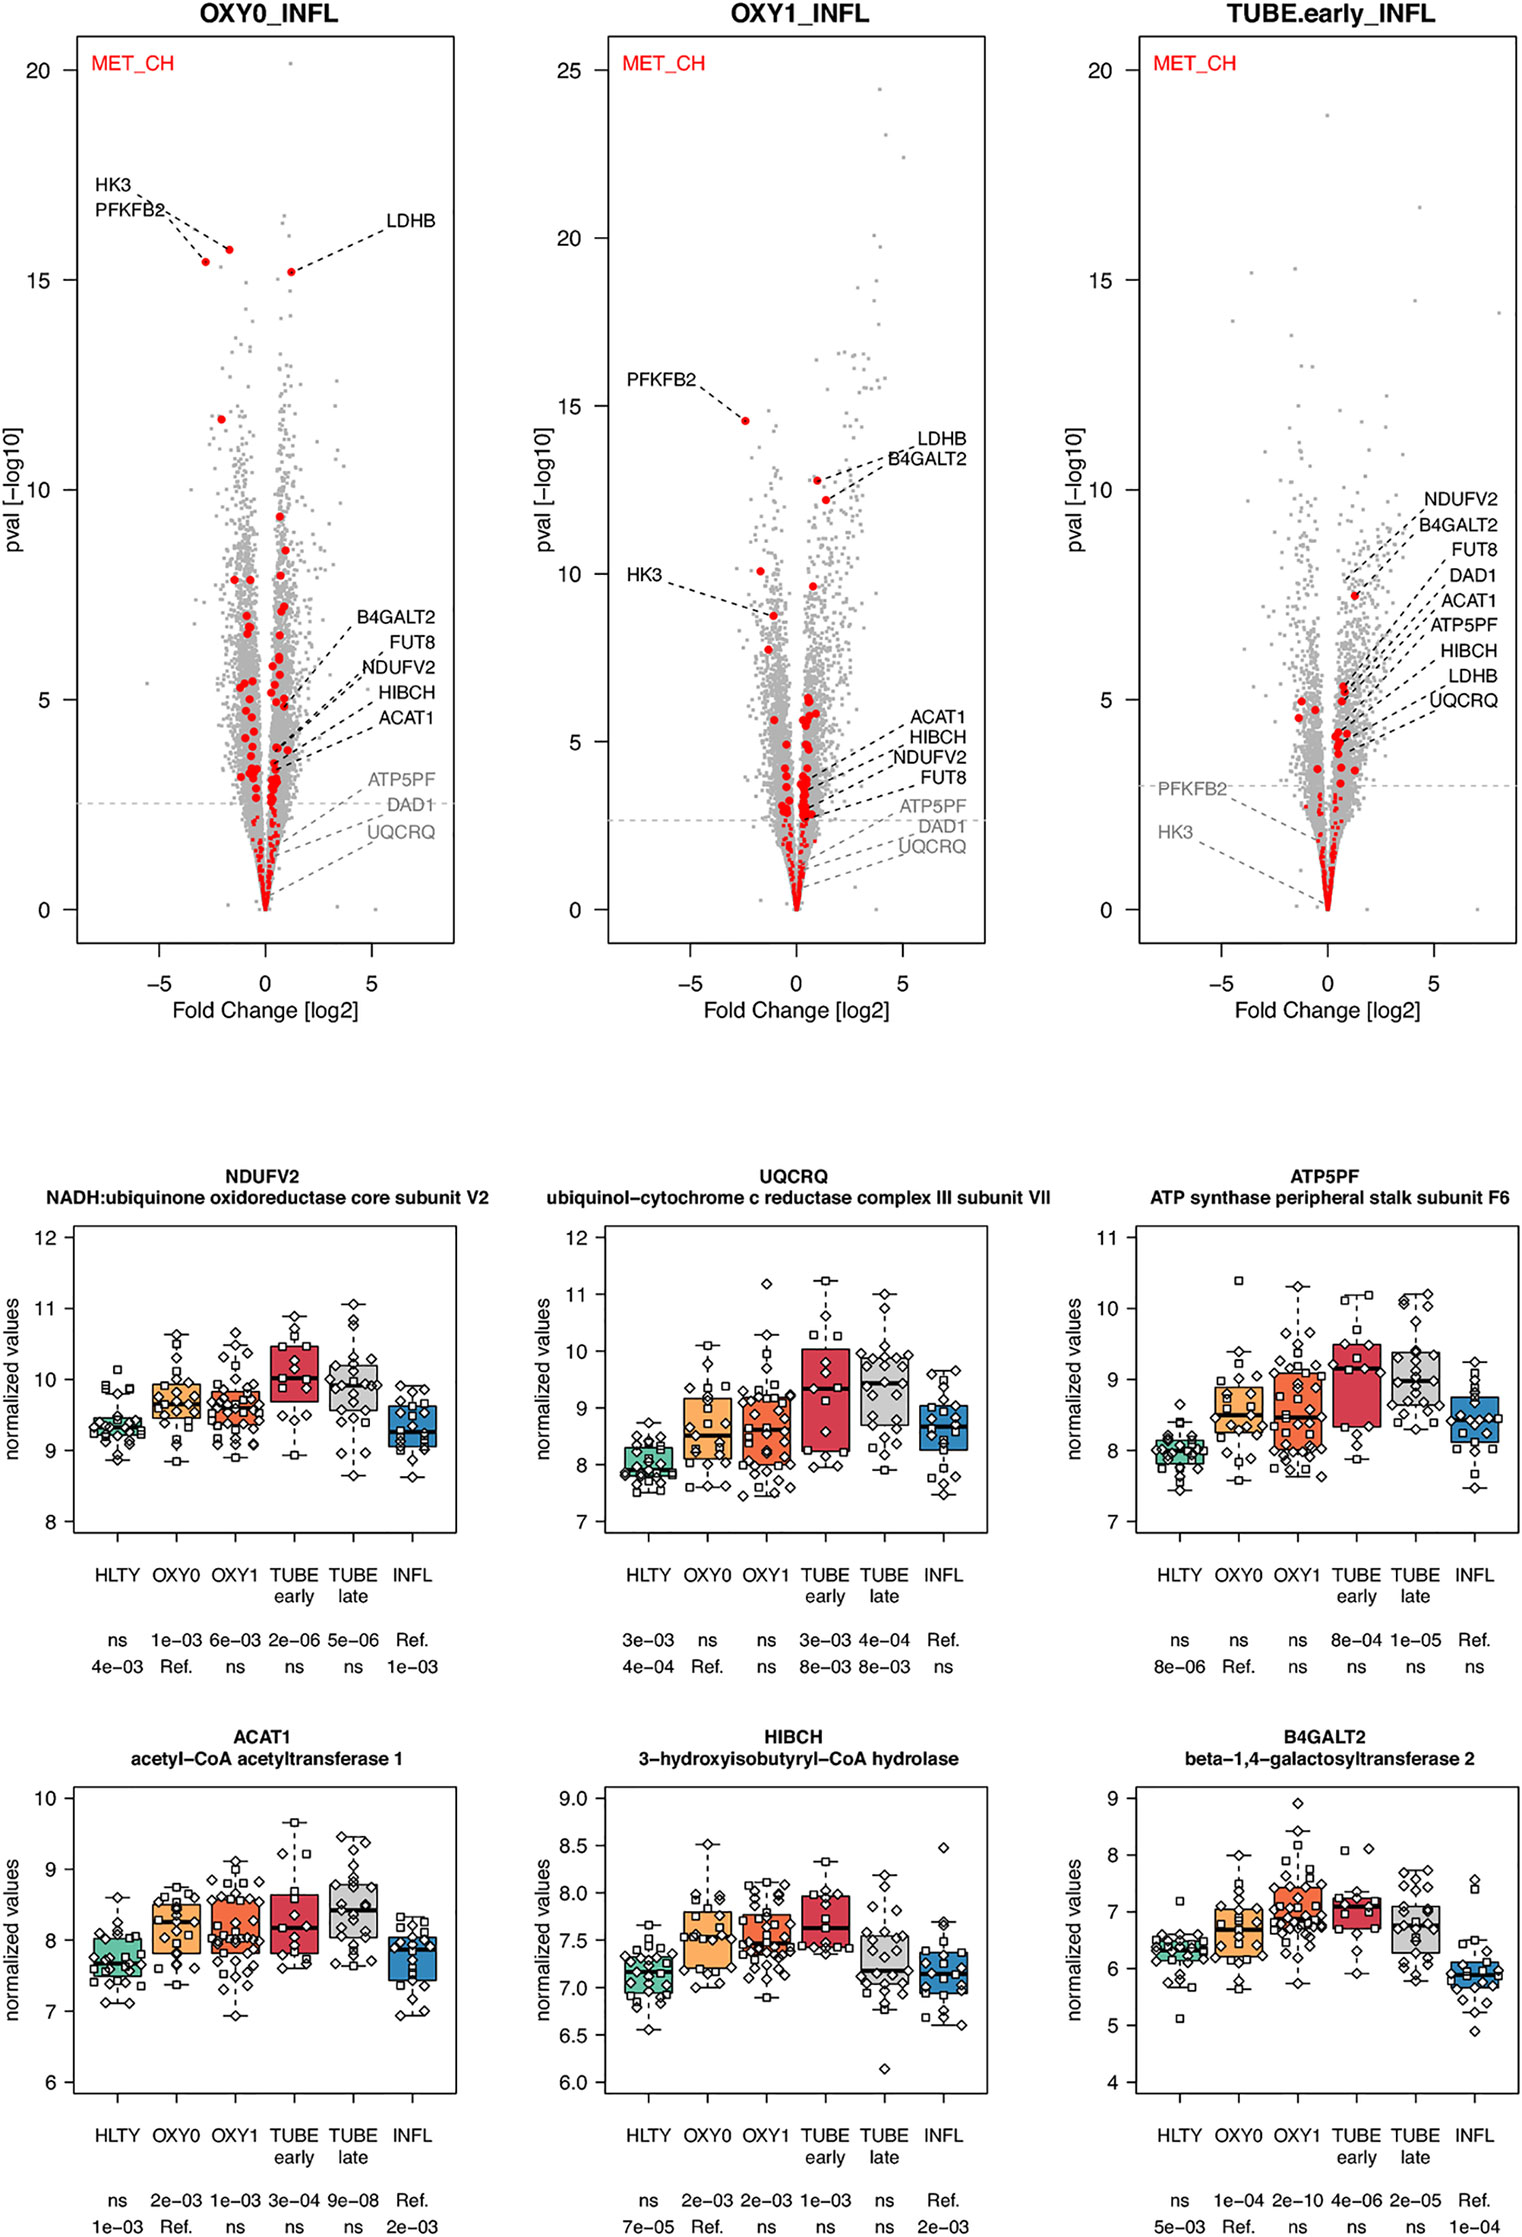
Figure 11 Differentially expressed genes (DEGs) involved in cell metabolism. Upper panel: for each comparison indicated in the volcano plot header, the distribution of log2 fold changes and P-values of all detected genes is shown as gray dots. Red dots indicate genes involved in cell metabolism. Genes’ sets are selected from different GO, REACTOME and/or KEGG pathways (see Supplementary Table 2). The dotted horizontal gray line indicates the limit under which –log10(P-value) becomes non significant once adjusted for multiple testing (adjusted P > 0.01). Lower panel shows detailed expression levels of selected genes involved in cell metabolism in the different groups of patients. Groups used for comparisons include SARS-Cov-2 infected patients (no oxygen support [OXY0], oxygen support [OXY1], intubation with sampling within 7 days [TUBE early] or >7 days [TUBE late] after hospital admission), Influenza virus [INFL] infected patients and non-infected controls [HLTY]. Adjusted P-values of pairwise comparisons between a reference group (Ref.) and another group are indicated below the x axis. Ref. is taken as [INFL] and [OXY0] on the first and second line, respectively.
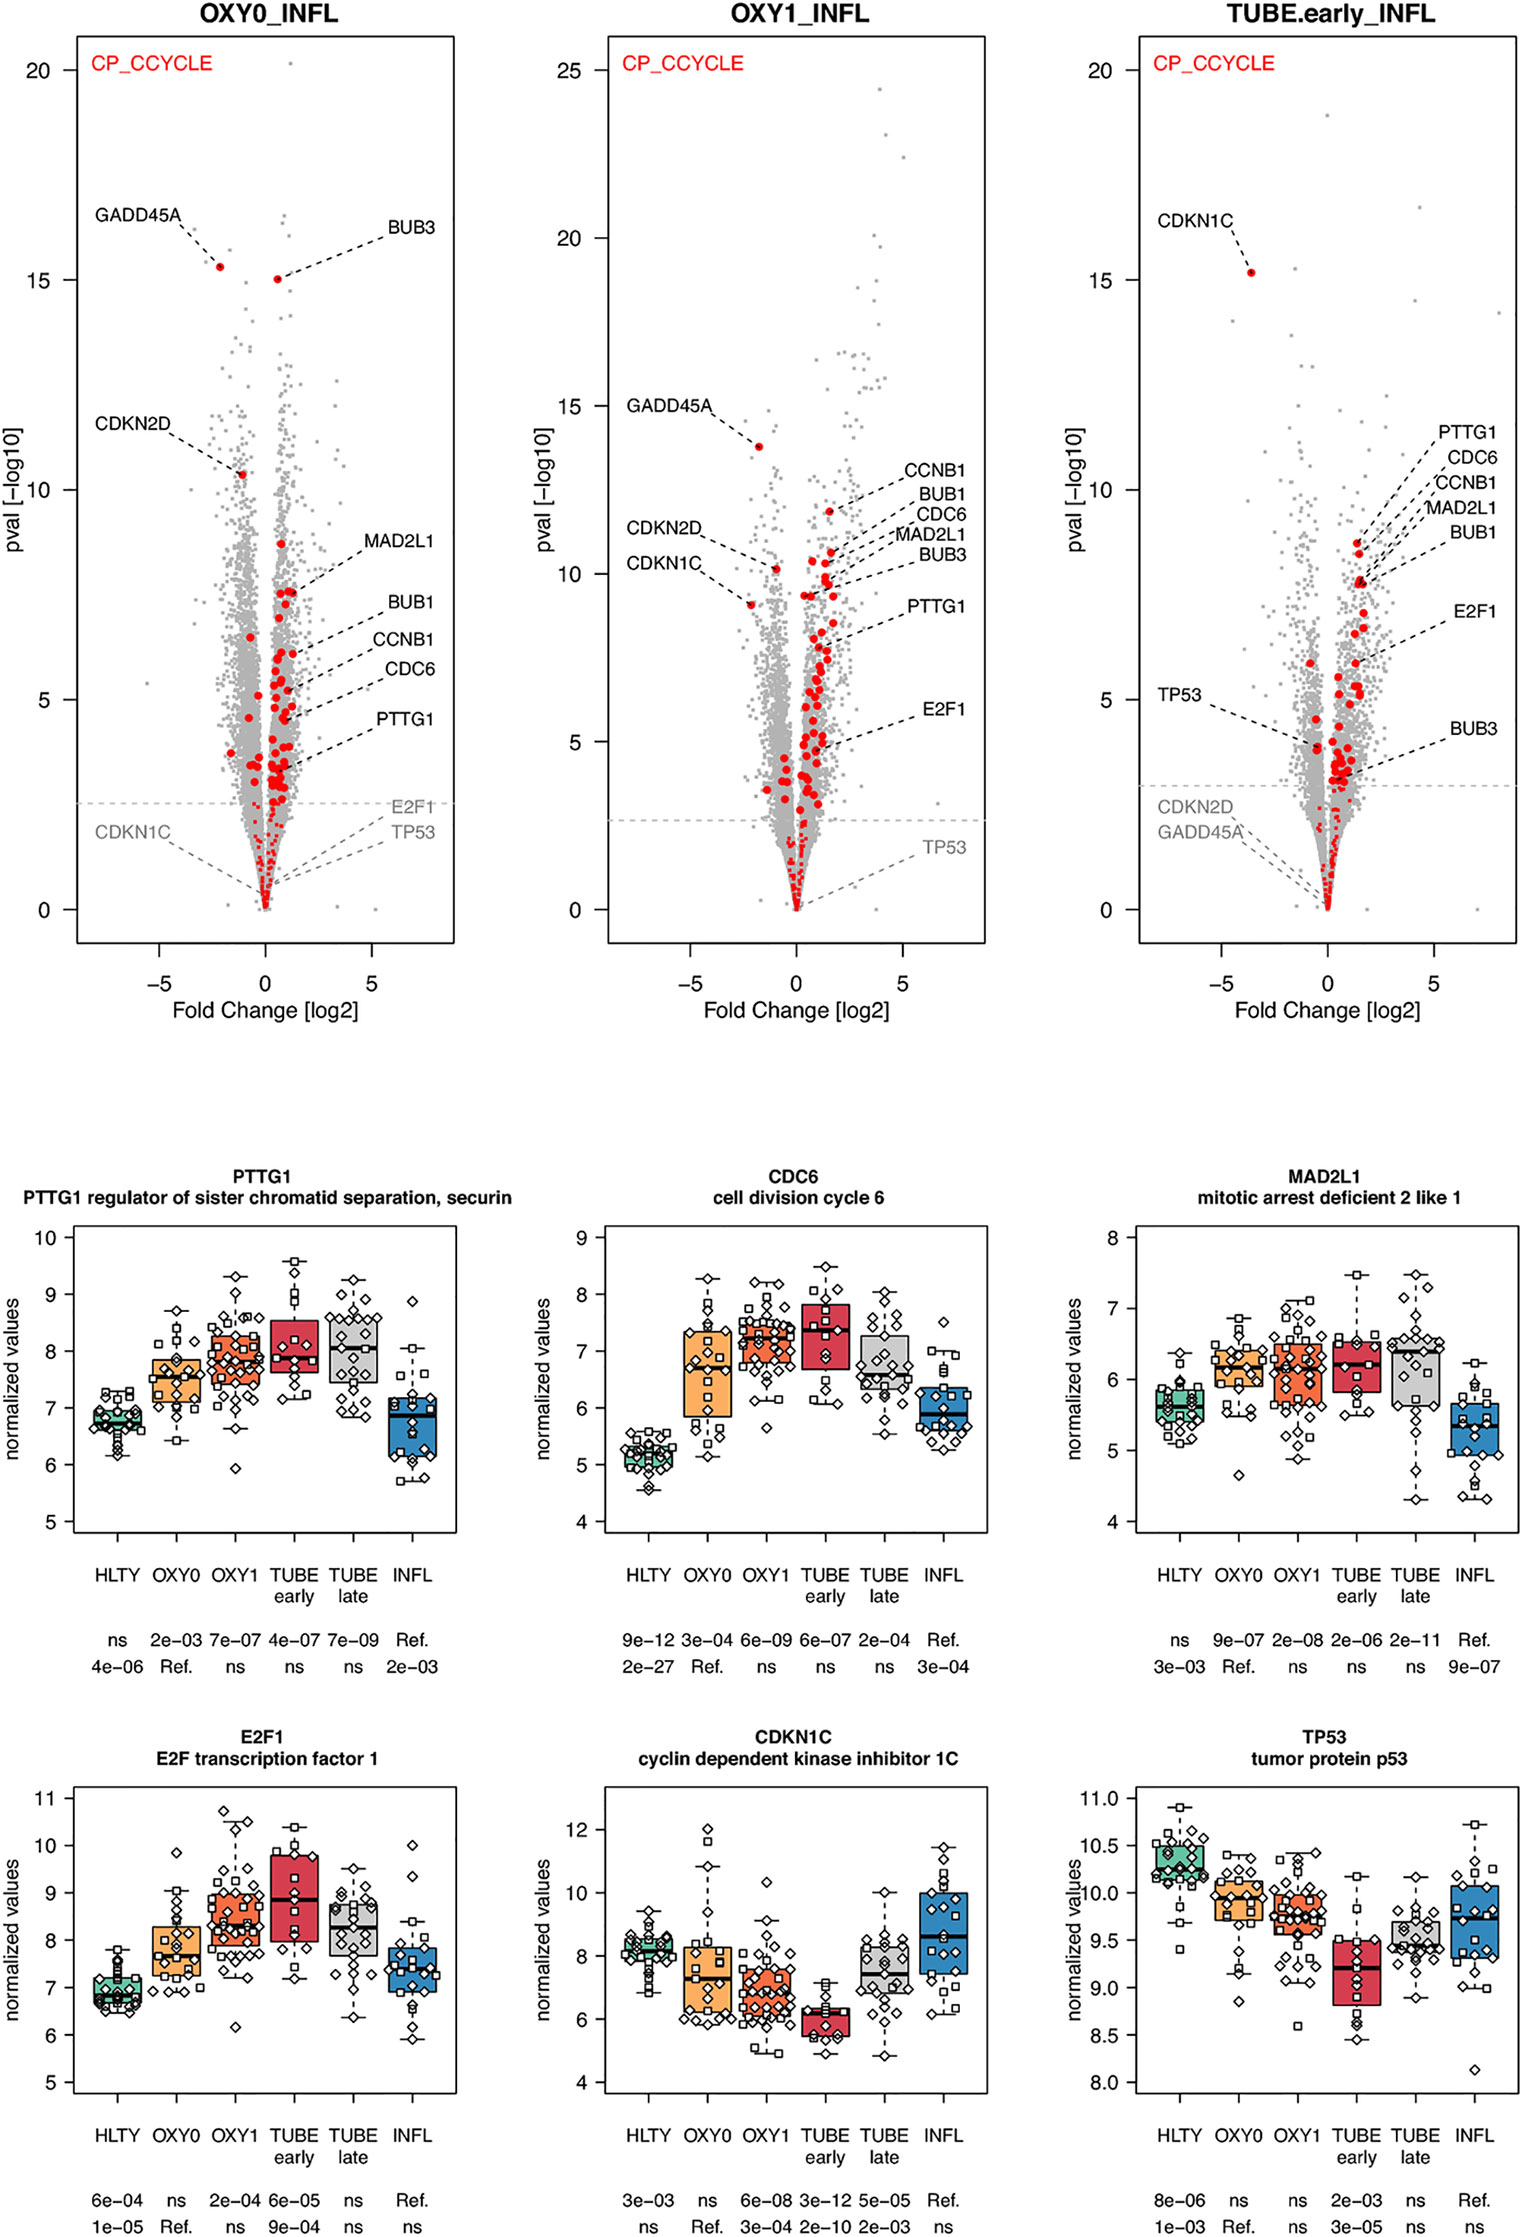
Figure 12 Differentially expressed genes (DEGs) involved in cell cycle. Upper panel: for each comparison indicated in the volcano plot header, the distribution of log2 fold changes and P-values of all detected genes is shown as gray dots. Red dots indicate genes involved in cell cycle. Genes’ sets are selected from different GO, REACTOME and/or KEGG pathways (see Supplementary Table 2). The dotted horizontal gray line indicates the limit under which –log10(P-value) becomes non significant once adjusted for multiple testing (adjusted P > 0.01). Lower panel shows detailed expression levels of selected genes involved in cell cycle in the different groups of patients. Groups used for comparisons include SARS-Cov-2 infected patients (no oxygen support [OXY0], oxygen support [OXY1], intubation with sampling within 7 days [TUBE early] or >7 days [TUBE late] after hospital admission), Influenza virus [INFL] infected patients and non-infected controls [HLTY]. Adjusted P-values of pairwise comparisons between a reference group (Ref.) and another group are indicated below the x axis. Ref. is taken as [INFL] and [OXY0] on the first and second line, respectively.
Finally, we investigated whether differential expressed gene signatures may be used to characterize SARS-CoV-2 infected patients (compared to the other) or severe versus non-severe presentation of COVID-19 (Table 1). We first identified genes significantly differentially expressed in all acute COVID-19 groups (OXY0, OXY1 and TUBE early) compared to INFL, and, to be even more stringent, to HLTY as well (Supplementary Table 4). A total of 209 and 6 genes were significantly over- and under-expressed, respectively, in all comparisons (adjusted P <=0.01). Among the most significantly over-expressed genes, a large number encoded immunoglobulins (N=67, e.g. JCHAIN, adj P=3.5E-09 for TUBE versus INFL) or were related to cell cycle (N=44, e.g. CDC6, adj P=6.3E-07 for the same comparison). The most significantly down-regulated gene was HDAC6 (adj P=9.7E-06 for TUBE versus INFL), an important regulator of transcription. We then identified markers of severe presentation of COVID-19 by selecting genes differentially expressed in TUBE-early compared to OXY0, OXY1, INFL and HLTY; to have an even more stringent selection, genes were selected if they were not differentially expressed in OXY0 compared to HLTY (Supplementary Table 5). A total of 163 and 112 genes were over- and under-expressed, respectively (adjusted P <=0.01). Among significantly over-expressed genes in all indicated comparisons, some encode blood-groups (e.g. GYPA, adj P=1.7E-10 in TUBE early vs OXY0, see above); among significantly under-expressed genes in all indicated comparisons, several were immune genes (e.g. IL2RB, adj P=8.2E-07 and IL10RA, adj P=1.6E-05, for TUBE early versus OXY0).
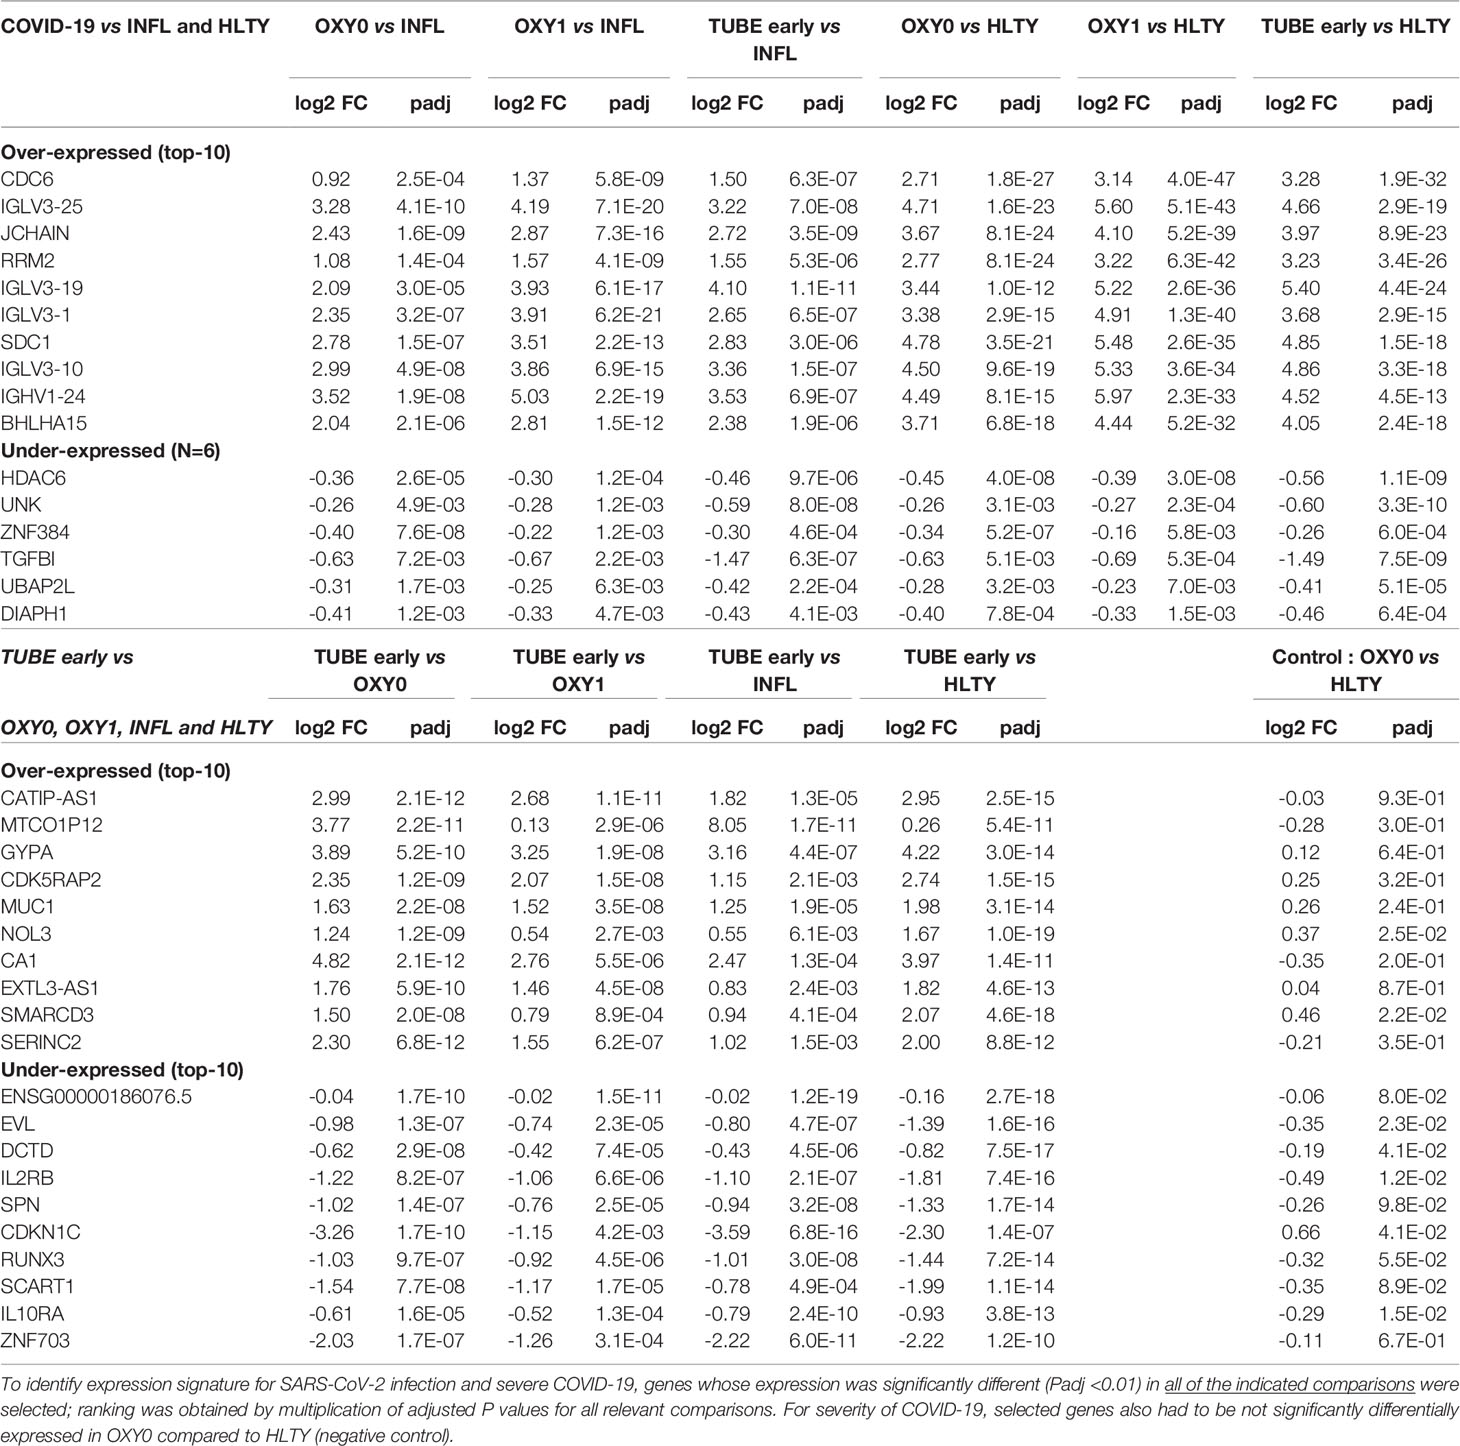
Table 1 Most significant genes signatures for SARS-CoV-2 infection (upper panel) and severe COVID-19 presentation (lower panel).
In this study, we describe major differences in the blood transcriptomic profiles of COVID-19 patients compared to subjects affected with influenza and between COVID-19 of different level of severity. One of the most striking features was the low expression of ISGs in COVID-19 compared to INFL patients. ISGs represent a group of genes transcriptionally activated by IFN signaling, which is essential for both innate and adaptive antiviral immunity against a wide range of pathogens (28, 29). ISGs restrict viral replication and spread by inhibiting key steps of viral life cycle (30, 31). The down-regulation of ISGs is consistent with numerous immune escape mechanisms developed by CoVs to enhance their replication and/or survival in the host (32, 33). Specifically, CoVs have developed mechanisms to evade the detection by PPRs including MDA5 [NSP15 encoded by several CoVs (34, 35)], RIG-I/RLRs[(SARS-CoV-1 N-protein (36)], and PKR [MERS-CoV NS4a (37, 38)], their signaling molecules, such as MAVS/TOM70 [SARS-CoV-2 ORF9b (39, 40)] and TBK1 [MERS-CoV ORF4b (41)], as well as the transcription factors IRF3 [SARS-CoV-1 ORF8b (42)] and NF-kB [MERS-CoV ORF4b (43)]. Similarly, CoVs inhibit signaling molecules downstream of IFN production, including IFNAR1 [SARS-CoV-1 3a protein (44)] and STAT1 [SARS-CoV-1 ORF6 (45)]. The under-expression of genes involved in viral detection (such as TLRS or RLRs) observed in this study may be due to additional mechanisms, including genetic variation in the host (46) or virus-dependent transcriptional regulation. Furthermore, conditions associated with a severe presentation of SARS-CoV-2, such as advanced age, diabetes and cancer (47) are characterized by an impairment in type I and III interferon responses (48).
While ISGs expression levels were lower in COVID-19 compared to INFL patients, expression levels of IFNs themselves, were not detectable in the peripheral blood, similarly to other transcriptomic studies (49). In a cellular model of SARS-CoV-2 infection, the production of type I and III IFNs was relatively low at low multiplicity of infection (MOI), but not at higher MOI, suggesting that IFN induction is initially limited, but can increase once a high level of viral replication is achieved (50). Conversely, in an animal model of SARS-CoV, robust viral replication was associated with delayed IFN type I responses, which subsequently leads to increased inflammation and lung damage (51). In cellular models, MERS-CoV induced a delayed and attenuated IFN type I response compared to those induced by human coronavirus 229E (HCoV-229E) (52). Similarly, SARS-CoV-2 patients requiring invasive mechanical ventilation presented the highest amount of IFNα at days 8 to 10 of symptom onset (53). Recent studies have also suggested that antibodies directed to IFN may be responsible for delayed antiviral immunity (54). Single-cell RNA sequencing revealed a suppression of IFN signaling among COVID-19 patients compared to Influenza patients (55). In addition, the same technique highlighted the key role of type I IFN in exacerbating inflammation in severe COVID-19 patient compared to what observed in healthy donors and in severe influenza patients (56). Altogether, these observations indicate that unfavorable outcomes in COVID-19 may result from the delayed or impaired production of type I and III IFNs, or their subsequent inhibition by antibodies, with compromised virus control and prolonged activation of inflammatory cytokines. This is in agreement with previously reported data from Galani et al. (57).
Natural killer (NK) cells and effector T cells both target infected cells exposing viral peptides through the MHC I. As reported for the SARS (58), the amount of both NK cells and T cells was highly decreased in SARS-CoV-2 patients (59–61). In addition, the frequencies of NK cells expressing CD16 and/or KIRs were reduced in the blood of patients infected with SARS-CoV-2 (61). Consistent with this observation, we found reduced expression of CD16, KIRs and TBX21 in SARS-CoV-2 infected patients compared to INFL patients. These data suggest that the former patients harbor immature NK cells, which may not be able to migrate towards infected tissues. Furthermore, we observed that SARS-CoV-2 infected patients had lower expression of genes involved in NK cell cytotoxicity such as perforin (PRF1), granulysin B (GNLY) and CD107a (LAMP1), an observation which is consistent with studies analyzing intracellular expression patterns of NK cells from COVID-19 patients (59, 62). Immune checkpoints such as NKG2A/KLRC1, a co-receptor of CD94/KLRD1 which interacts with HLA-E, as well as inhibitory receptors such as LAG3 were upregulated in SARS-CoV-2 infected patients compared to healthy individuals (59). In our study, NKG2A/KLRC1 and LAG3 were not overexpressed and CD94/KLRD1 was even under-expressed among TUBE EARLY patients compared to both HTLY and INFL, suggesting that the level of inhibition may depend on the severity level of the disease. Genes involved in neutrophil degranulation and/or other neutrophil functions had increased expression levels in patients with severe manifestations of COVID-19, such as S100A8/9 and S100A12, encoding calprotectin and calgranulin, respectively, as recently reported (63). However, such responses may be a general feature of severe lung infection rather than a COVID-19-specific feature (64, 65).
Another relevant feature of transcriptional profiles observed in this study is the low expression of MHC I and MHC II encoding genes among patients infected with SARS-CoV-2 compared to INFL patients. Down-regulation of genes involved in antigen presentation through both the MHC I and MHC II have been reported in lung epithelial cells infected with MERS-CoV, but not with SARS-CoV-1, highlighting important differences in viral escape mechanisms among different CoVs (66). Inhibition of both MHC I [reviewed in (67)] and MHC II [reviewed in (68, 69)] represents well-known mechanisms developed by viruses to escape immune response. Specifically, Herpesviridae can prevent MHC I mediated antigen presentation by interfering with the generation of antigenic peptides by the proteasome (EBV), preventing their transport across the endoplasmic reticulum towards the peptide-loading complex (HSV, CMV) and/or by avoiding adequate presentation of this complex on cell surfaces [CMV, KHSV, reviewed in (67)]. Interestingly, our study shows that both transporters associated with antigen processing (TAP) 1 and 2 had lower expression levels in SARS-CoV-2 patients compared to patients with influenza, revealing a potential immune escape mechanism for SARS-CoV-2. In addition, it was recently proposed that the protein encoded by SARS-CoV-2 open reading frame (ORF) 8 can directly interact with MHC I molecules and significantly down-regulate their surface expression on various cell types (70). Since ORF8 is among the viral sequences having the less homology among CoVs, differences in ORF8 may explain differential capability among CoVs to inhibit antigen presentation through MHC I (69). Altogether, our results suggest that SARS-CoV-2 restrains antigen presentation and T cell mediated immune responses.
Activation of CD4+ T cells by interactions with peptides bound to MHC II is a crucial step in clearance of most pathogens. Many viruses have developed ways of blocking antigen presentation, although fewer mechanisms or viral interference have been described for MHC II compared to MHC I (69). Specifically, viruses can target MHC class II transactivator (CIITA), a key molecule in the control of MHC II proteins transcription (EBV, KHSV, HIV), the invariant chain protein (Ii/CD74), which co-assembles with MHC II αβ heterodimers in the endosome (CMV, EBV), its associated peptide (CLIP; HCV), as well as MHC II proteins themselves, taken either alone (CMV, EBV) or during their interaction with the T cell receptor [EBV; reviewed in (69)]. Accordingly, we observed that genes encoding proteins involved in MHC II activation (including CTSB, Ii/CD74 and CLIP) had low expression levels in patients infected with SARS-CoV-2 compared to INFL patients, revealing another potential immune escape mechanism for SARS-CoV-2.
T cells play a crucial role in antiviral immunity and were reported to be decreased in SARS-CoV infection (59–61) [reviewed in (71)] but their phenotypical and functional alterations due to COVID-19 are poorly characterized. While CD4 T helper cells contribute to B cell activation and subsequent antibody production, CD8 T cells kill infected cells and reduce viral burden. We observed reduced expression of CD4 in all severity types of COVID-19 patients compared to HLTY and INFL patients; in contrast, CD8 was under-expressed solely among TUBE early patients compared to HTLY, with levels similar to those of INFL patients. Altogether, these data suggest a more specific burden of SARS-CoV-2 on CD4 T cells than over CD8 T cells. Persistence of high expression levels of CD8 among OXY0 and OXY1 patients may result from the increased expression of IRF4 which is known to enhances CD8 expression (72), and that showed an expression pattern contrasting that of the other ISGs. Conversely, reduced expression of CD8 T cells in TUBE early patients may result from CD8 T cell infiltration of the lungs, as reported by others (73).
When analyzing the differential expression of memory markers in our dataset, we were not able to characterize specific T cell subsets, a finding that may be a consequence of the experimental design of the study (as a whole blood vs. single cells were considered) or of the lack of a well-characterized T cell memory pattern in the patients themselves. When considering the differential expression of T cell markers of activation, we noted a significantly enhanced expression of CD38, Ki-67/MK67 and CD44 [which is consistent with the observation by Braun et al. (7)], but not of HLA-DR (7, 74), CD69 (75) and CD25 (76). Furthermore, we noted an over-expression of CSF1/GM-CSF correlated with COVID-19 severity, a finding that may lead to increased inflammation in severe patients, as suggested by Zhou et al. (77). Interestingly, GM-CSF+ CD4 T cells have been associated with inflammation in autoimmune diseases (78). We also observed a decreased expression of IL2RB/AKA CD122, which correlated with severity and may result in T cell deregulation (79). In contrast to previous studies (80), the exhaustion marker PD-1 was not over-expressed, but rather under-expressed, among TUBE early patients, which may reflect a defect in TCR signaling and/or in effector T cells activation. Altogether, the expression of T cell markers of memory and activation was contrasted, suggesting an overall dysregulation of T cell activity (81).
Humoral immune responses also play an important role in the clearance of SARS-CoV-2 and the establishment of an immunological memory (82). SARS-CoV-2 elicits a strong B cell response with previously described kinetics (83, 84). Our data reveal a dramatic increase in the expression of immunoglobulin encoding genes of most classes (IGHM, IGHA, IGHG) in COVID-19 compared to HLTY and INFL subjects, with a peak among OXY1 and/or TUBE-early patients. There was also an increased expression of J-CHAIN, which contribute to polymer formation of secreted IgM and IgA, thereby enhancing antigen avidity and viral binding (85). These findings are consistent with the over-expression of genes involved in B cell differentiation and antibody class switching (CD40L, UNG, ICOS, BAFFR, CD19 and TACI) in OXY0 and OXY1 compared to INFL patients, with the exception of the Bruton’s tyrosine kinase (BTK). Paradoxically, antibodies can play a deleterious role in SARS-CoV-2 pathogenesis. Opsonization of anti-spike antibodies allow SARS-CoV entering non-ACE2-expressing cells, which harbor Fc-g-RIIA, a receptor that happened to be over-expressed in TUBE early patients (86, 87). Excessive antibody production together with presentation of host proteins resulting from prolonged tissue destruction may enhance auto-reactive responses contributing to disease severity (88, 89). In addition, antibodies targeting SARS-CoV epitopes were shown to cross-react with cytokines, such as IL-11 (90, 91); recent studies also revealed presence of antibodies targeting type-I IFN in COVID-19 patients (54). Single cells transcriptome of peripheral blood mononuclear cells in both COVID-19 and Influenza-infected patients revealed an enrichment of plasma cells in COVID-19 patients which has been correlated with the production of multiple protective neutralizing antibodies (92). Altogether, these data suggest an important activation of B cells with increased antibody production in COVID-19 compared to INFL patients. Further studies are needed to determine whether this strong response results from specific features of the virus, from the absence of previous exposure to its antigens, and to which extent they contribute to an adverse outcome.
The complement and coagulation systems are increasingly reported to play a relevant role in the pathogenesis of COVID-19 (93). Several studies have revealed that SARS-CoV-2 induced the activation of several complement pathways (94, 95). Complement system is based on the activation and cleavage of proteins that cannot be addressed with transcriptomic data. Interestingly, we observed an increased expression of complement component-encoding genes in both COVID-19 and INFL compared to HLTY, with patterns not strikingly different in patients infected with both viruses. Some genes were slightly under-expressed among OXY0 compared to INFL (C1qrs, C2, C5); in contrast, the complement component C3 was over-expressed in TUBE early patients compared to INFL patients. Activated C3 can exacerbate SARS-CoV-associated acute respiratory distress syndrome (ARDS) (95). This suggests that, while the activation of the complement exists in both COVID-19 and in INFL, its persistence over a longer period of time in COVID-19 may contribute to inflammation, tissue damage, coagulation and neutrophil activation, leading to organ injury. This is consistent with the significant increase in the expression of neutrophil degranulation-associated genes observed among TUBE early compared to INFL patients. There was no definite profile in the expression of genes involved in the coagulation cascade among COVID-19 patients compared to INFL. In contrast, we observed a strong over-expression of blood group encoding genes in TUBE early/late patients compared to the other groups. Blood groups have been shown to change the immune response to infections (96). Some of these genes encode proteins involved in the pathogenesis of viral infections, such as GYPA, which codes for glycophorin A, a protein considered as the major receptor for different viruses on the red blood cell surface (97–99). Others, such as those of the Knops blood group system, play a role in the activation and/or modulation of the complement cascade (100, 101). However, it remains unclear whether the overexpression of blood-group genes is related to the pathogenesis of COVID-19 or reflects a general activation of inflammation and/or hematopoiesis.
Increasing evidence reveals important interactions between metabolic and immune functions (102). For instance, aerobic glycolysis is induced during the activation of numerous immune cells, such as M1 macrophages (103), dendritic cells (104), T cells (105), B cell (106, 107) and NK cells (108). In addition, oxidative phosphorylation plays an important role in the activation of M2 macrophages (109, 110) and in the expression of transcription factors that are essential for T and B cells. This is consistent with the over-expression of genes involved in carbohydrate metabolic pathways in OXY1 compared to INFL patients. Differential expression of genes involved in the metabolism may also contribute to disease conditions (111).
Viruses influence host cells to create a favorable environment for their replication (112, 113). SARS-CoV non-structural proteins 3b and 7a were shown to induce a G0/G1 phase arrest in infected cells (114, 115). This phenomenon is probably limited to the site of infection, i.e. respiratory epithelial cells, which are infected in COVID-19. In contrast, the analysis of whole blood transcriptome reveals significant overexpression of genes involved in cell cycle, which probably reflects the activation of immune cells distant from the site of infection. This over-expression was present in all types of COVID-19 patients (OXY0, OXY1 and TUBE) compared to both HTLY and INFL. Further studies are needed to understand whether cell-cycle activation is a specific feature of SARS-CoV-2 infection or a component of the resulting inflammatory response.
To date, biomarkers of COVID-19 and/or COVID-19 severity mostly included clinical and inflammatory characteristics (116). To our knowledge, no study allowed for a large scale comparison of gene expression between COVID-19 and another viral infection. By using blood from patients with different severity levels of COVID-19 as well as INFL and HLTY, we identified and/or confirmed a number of very significant associations. In particular, genes encoding immunoglobulins and those related to cell cycle appear as a hallmark of COVID-19, as they were significantly independently upregulated in each COVID-19 severity group (OXY0, OXY1 and TUBE early) compared to both INFL and HLTY. Furthermore, a number of genes were significantly over (e.g. genes encoding PRR, ISG, or related to macrophages functions, degranulation of neutrophils, blood groups, complement, metabolism and/or oxidative phosphorylation) or under-expressed (e.g. genes related to MHC II, T-cell function or encoding immunoglobulins) among TUBE early patients compared to the other severity group (OXY0 and OXY1), thereby providing a potential basis to predict COVID-19 outcome. However, new studies including samples taken at different time-points of COVID-19 as well as patients with infections due to other pathogens will be needed to confirm these findings and/or establish reliable diagnostic tools to predict COVID-19 outcome.
Like other transcriptomic studies, this work has several limitations. The number of patients included in the different groups was limited, a factor that may have restricted the number of DEG reported. Samples were taken from whole blood and do not necessarily reflect gene expression patterns in clinically affected organs and/or individual cells. The sequencing depth may have restricted differential detection of less abundantly expressed genes. Finally, the samples were issued from a single cohort of patients, and thus validation from other cohorts would be useful. This study provides a comprehensive overview of the immune response among patients with different severity levels of COVID-19. These include a dramatic decrease in IFN responses, a reduced cytotoxicity activation in NK cells, an increased degranulation of neutrophils, a dysregulation of T cells, a dramatic increase in B cell function and immunoglobulin production, as well as an important over-expression of genes involved in metabolism and cell cycle. This study opens the way to further investigations aimed at elucidating the molecular mechanisms that underlay these observations. This study also suggests that it may be possible to identify a signature which could be useful to identify early patients at risk of adverse outcome.
Dataset containing, raw and normalized gene counts and samples description is available on http://dx.doi.org/10.17632/8wxhhykfnh.2. Unprocessed raw data (fastq files) cannot be shared due to ethical and legal limitations. An interactive website interface is made available to the readers, in which global and detailed gene profiles can be visualized (https://bix.unil.ch/covid/).
The studies involving human participants were reviewed and approved by Cantonal Ethics Committee of the state of Vaud (Swissethics 2020-01108). The patients/participants provided their written informed consent to participate in this study.
Conceptualization: SB, NB, PYB. Methodology: SB, NG, JL, MD, NB, PYB. Bioinformatic analysis: NG, JL, RL, LG, MD. Acquisition, Analysis or interpretation of data: SB, TB, FL, MP-O, LD, OM, JT, PV, JLP, MO, OH, VE, CV, FC, NB, PYB. Investigation: SB, NB, MQ, CR, PYB. Writing original draft: PYB, NB, SB, NG, JL. Writing-Review & Editing: ALL. Obtained Funding: PYB, CR, Administrative, technical, or material support: SB, TB, MP-O, LD. Supervision: PYB. All authors contributed to the article and approved the submitted version.
P-YB is supported by the Swiss National Science Foundation (31CA30_196036, 33IC30_179636 and 314730_192616), the Leenaards Foundation, the Santos-Suarez Foundation as well as grants allocated by Carigest. NB is supported by the Leenaards Foundation. CR is supported by the Swiss National Science Foundation (31CA30_196036 and 31003A_176097).
The authors declare that the research was conducted in the absence of any commercial or financial relationships that could be construed as a potential conflict of interest.
We thank all the patients who accepted to participate and make this study possible. We thank all healthcare workers of the Centre Hospitalier Universaire Vaudois who contributed to the management of study patients and allowed for their inclusion in the study at the emergency, internal medicine, infectious disease and adult intensive care Services. We thank Aurélie Guillet and Corine Guyat-Jacques for their outstanding contribution in study logistics and organisation, as well as Nawfel Ben Hamouda. We thank Stéphanie Mourali, Dominique Niksch, Valérie Sormani, Alexandra Mitouassiwou-Samba, Isabel Cobos-Manuel, Jean-Luc Danckaert, Marie-Josée Vez, Hélène Gerhard Donnet, Laura Molinari, Nadia Cattaneo, Elisa Corne, Alan Dussex, Eugénie Prouvost and Kyllian Ruscio for their precious commitment in participants’ inclusion and/or blood sample collection. We thank the reviewers whose careful reading helped us substantially improve the manuscript. We thank the iGE3 platform of the University of Geneva for RNA sequencing. We thank Christian Iseli for the preparation and maintenance of our bioinformatics databases. We thank collaborators from the Clinical Research Center at CHUV-Unil (CRC Lausanne), in particular Laura Pezzi and Yoanne Boulez for study logistics, Laure Vallotton, Loane Warpelin, Isabelle Guilleret, Vassili Soumas and Marc Froissart for administrative, regulatory and data management support. We thank Pierre-Nicolas Carron for making the study feasible within the emergency room.
Members of the RegCOVID study group: in alphabetical order. Bochud Pierre-Yves, Desgranges Florian, Filippidis Paraskevas, Guéry Benoit, Haefliger David, Kampouri Eleftheria-Evdokia, Manuel Oriol, Munting Aline, Pagani Jean-Luc, Papadimitriou-Olivgeris Matthaios, Regina Jean, Rochat-Stettler Laurence, Suttels Veronique, Tadini Eliana, Tschopp Jonathan, Van Singer Mathias, Viala Benjamin, Vollenweider Peter.
The Supplementary Material for this article can be found online at: https://www.frontiersin.org/articles/10.3389/fimmu.2021.666163/full#supplementary-material
Supplementary Table 1 | Characteristics of patients infected with SARS-CoV-2 or Influenza virus and heathy controls.
Supplementary Table 2 | Composition of genes sets for main figures.
Supplementary Table 3 | Composition of genes sets for supplementary figures.
Supplementary Table 4 | Differentially expressed genes as markers of COVID-19.
Supplementary Table 5 | Differentially expressed genes as markers of COVID-19 severity.
Supplementary Figure 1 | Quality control.
Supplementary Figure 2 | Unsupervised analysis: differentially expressed genes in KEGG pathways. MET stands for metabolism, GIP stands for Genetic Information Processing, EIP stands for Environmental Information Processing, CP stands for Cellular Processes, OS stands for Organismal Systems and HD stands for Human Diseases.
Supplementary Figure 3 | Interpretation of boxplots (“ascending”, “descending”, “hill” and “valley” pattern). Expression patterns across the different groups were regarded as “ascending” or “descending” when median expression levels progressively increased, or decreased, respectively, from HLTY to OXY0, OXY1, TUBE-early, and INFL. Conversely, patterns were qualified to have a “hill” or “valley” pattern, when peak and lowest median expression levels were seen in COVID-19 (OXY1 or TUBE-early), and the lowest and higher in both HLTY and INFL, respectively. Because TUBE-late often represented a convalescent status, their gene expression levels were ignored in this pattern qualification.
Supplementary Figure 4 | KEGG map colored with pathview (117) “Influenza A” pathway (hsa05164). Pathways involved in the detection of Influenza A overlap with those involved in the detection of other RNA viruses including SARS-CoV-2. Significantly DEGs (adj. P-Value < 0.01) are colored based on their log2 fold change. Left panel: boxes are separated into 3 slots, for OXY0 versus INFL, OXY1 versus INFL and TUBE-early versus INFL. Right panel: boxes are separated into 2 slots, for INFL versus HTLY and TUBE_early versus HLTY.
Supplementary Figure 5 | KEGG map colored with pathview (117) “Cytokines-cytokine receptor interaction” (hsa04060). Significantly DEGs (adj. P-Value < 0.01) are colored based on their log2 fold change. Left panel: boxes are separated into 3 slots, for OXY0 versus INFL, OXY1 versus INFL and TUBE-early versus INFL. Right panel: boxes are separated into 2 slots, for INFL versus HTLY and TUBE_early versus HLTY.
Supplementary Figure 6 | KEGG map colored with pathview (117) “Natural killer cell mediated toxicity” (hsa04650). Significantly DEGs (adj. P-Value < 0.01) are colored based on their log2 fold change. Left panel: boxes are separated into 3 slots, for OXY0 versus INFL, OXY1 versus INFL and TUBE-early versus INFL. Right panel: boxes are separated into 2 slots, for INFL versus HTLY and TUBE_early versus HLTY.
Supplementary Figure 7 | KEGG map colored with pathview (117) “Antigen processing and presentation” (hsa04612). Significantly DEGs (adj. P-Value < 0.01) are colored based on their log2 fold change. Left panel: boxes are separated into 3 slots, for OXY0 versus INFL, OXY1 versus INFL and TUBE-early versus INFL. Right panel: boxes are separated into 2 slots, for INFL versus HTLY and TUBE_early versus HLTY.
Supplementary Figure 8 | Box plots for selected genes involved in different T cells functions.
Supplementary Figure 9 | KEGG map colored with pathview (117) “T cell receptor signaling pathway” (hsa04660). Significantly DEGs (adj. P-Value < 0.01) are colored based on their log2 fold change. Left panel: boxes are separated into 3 slots, for OXY0 versus INFL, OXY1 versus INFL and TUBE-early versus INFL. Right panel: boxes are separated into 2 slots, for INFL versus HTLY and TUBE_early versus HLTY.
Supplementary Figure 10 | KEGG map colored with pathview (117) “Th1 and Th2 differentiation” (hsa04658). Significantly DEGs (adj. P-Value < 0.01) are colored based on their log2 fold change. Upper panel: boxes are separated into 3 slots, for OXY0 versus INFL, OXY1 versus INFL and TUBE-early versus INFL. Lower panel: boxes are separated into 2 slots, for INFL versus HTLY and TUBE_early versus HLTY.
Supplementary Figure 11 | KEGG map colored with pathview (117) “Th17 differentiation” (hsa04659). Significantly DEGs (adj. P-Value < 0.01) are colored based on their log2 fold change. Upper panel: boxes are separated into 3 slots, for OXY0 versus INFL, OXY1 versus INFL and TUBE-early versus INFL. Lower panel: boxes are separated into 2 slots, for INFL versus HTLY and TUBE_early versus HLTY.
Supplementary Figure 12 | KEGG map colored with pathview (117) "B cell receptor signaling pathway" (hsa04662). Significantly DEGs (adj. P-Value < 0.01) are colored based on their log2 fold change. Upper panel: boxes are separated into 3 slots, for OXY0 versus INFL, OXY1 versus INFL and TUBE-early versus INFL. Lower panel: boxes are separated into 2 slots, for INFL versus HTLY and TUBE_early versus HLTY.
Supplementary Figure 13 | Box plots for selected genes involved in B cells functions/maturation/regulation.
Supplementary Figure 14 | KEGG map colored with pathview (117) "Complement and coagulation cascades" (hsa04659). Significantly DEGs (adj. P-Value < 0.01) are colored based on their log2 fold change. Left panel: boxes are separated into 3 slots, for OXY0 versus INFL, OXY1 versus INFL and TUBE-early versus INFL. Right panel: boxes are separated into 2 slots, for INFL versus HTLY and TUBE_early versus HLTY.
Supplementary Figure 15 | Boxplots plots for complement, coagulation and blood groups.
1. Cui J, Li F, Shi ZL. Origin and Evolution of Pathogenic Coronaviruses. Nat Rev Microbiol (2019) 17(3):181–92. doi: 10.1038/s41579-018-0118-9
2. Weiss SR, Navas-Martin S. Coronavirus Pathogenesis and the Emerging Pathogen Severe Acute Respiratory Syndrome Coronavirus. Microbiol Mol Biol Rev (2005) 69(4):635–64. doi: 10.1128/MMBR.69.4.635-664.2005
3. Sariol A, Perlman S. Lessons for COVID-19 Immunity From Other Coronavirus Infections. Immunity (2020) 53(2):248–63. doi: 10.1016/j.immuni.2020.07.005
4. Nelemans T, Kikkert M. Viral Innate Immune Evasion and the Pathogenesis of Emerging RNA Virus Infections. Viruses (2019) 11(10):961. doi: 10.3390/v11100961
5. Doyle SE, Schreckhise H, Khuu-Duong K, Henderson K, Rosler R, Storey H, et al. Interleukin-29 Uses a Type 1 Interferon-Like Program to Promote Antiviral Responses in Human Hepatocytes. Hepatology (Baltimore Md (2006) 44(4):896–906. doi: 10.1002/hep.21312
6. Marcello T, Grakoui A, Barba-Spaeth G, Machlin ES, Kotenko SV, MacDonald MR, et al. Interferons Alpha and Lambda Inhibit Hepatitis C Virus Replication With Distinct Signal Transduction and Gene Regulation Kinetics. Gastroenterology (2006) 131(6):1887–98. doi: 10.1053/j.gastro.2006.09.052
7. Braun J, Loyal L, Frentsch M, Wendisch D, Georg P, Kurth F, et al. SARS-CoV-2-Reactive T Cells in Healthy Donors and Patients With COVID-19. Nature (2020) 587(7833):270–4. doi: 10.1038/s41586-020-2598-9
8. Grifoni A, Weiskopf D, Ramirez SI, Mateus J, Dan JM, Moderbacher CR, et al. Targets of T Cell Responses to SARS-CoV-2 Coronavirus in Humans With COVID-19 Disease and Unexposed Individuals. Cell (2020) 181(7):1489–501 e15. doi: 10.1016/j.cell.2020.05.015
9. Long QX, Liu BZ, Deng HJ, Wu GC, Deng K, Chen YK, et al. Antibody Responses to SARS-CoV-2 in Patients With COVID-19. Nat Med (2020) 26(6):845–8. doi: 10.1038/s41591-020-0897-1
10. Ni L, Ye F, Cheng ML, Feng Y, Deng YQ, Zhao H, et al. Detection of SARS-CoV-2-Specific Humoral and Cellular Immunity in COVID-19 Convalescent Individuals. Immunity (2020) 52(6):971–7.e3. doi: 10.1016/j.immuni.2020.04.023
11. Robbiani DF, Gaebler C, Muecksch F, Lorenzi JCC, Wang Z, Cho A, et al. Convergent Antibody Responses to SARS-CoV-2 in Convalescent Individuals. Nature (2020) 584(7821):437–42. doi: 10.1038/s41586-020-2456-9
12. Giamarellos-Bourboulis EJ, Netea MG, Rovina N, Akinosoglou K, Antoniadou A, Antonakos N, et al. Complex Immune Dysregulation in COVID-19 Patients With Severe Respiratory Failure. Cell Host Microbe (2020) 27(6):992–1000.e3. doi: 10.1016/j.chom.2020.04.009
13. Seymour CW, Liu VX, Iwashyna TJ, Brunkhorst FM, Rea TD, Scherag A, et al. Assessment of Clinical Criteria for Sepsis: for the Third International Consensus Definitions for Sepsis and Septic Shock (Sepsis-3). JAMA J Am Med Assoc (2016) 315(8):762–74. doi: 10.1001/jama.2016.0288
14. Bauer TT, Ewig S, Marre R, Suttorp N, Welte T, Group CS. CRB-65 Predicts Death From Community-Acquired Pneumonia. J Intern Med (2006) 260(1):93–101. doi: 10.1111/j.1365-2796.2006.01657.x
15. Patro R, Duggal G, Love MI, Irizarry RA, Kingsford C. Salmon Provides Fast and Bias-Aware Quantification of Transcript Expression. Nat Methods (2017) 14(4):417–9. doi: 10.1038/nmeth.4197
16. Frankish A, Diekhans M, Ferreira AM, Johnson R, Jungreis I, Loveland J, et al. GENCODE Reference Annotation for the Human and Mouse Genomes. Nucleic Acids Res (2019) 47(D1):D766–D73. doi: 10.1093/nar/gky955
17. Love MI, Huber W, Anders S. Moderated Estimation of Fold Change and Dispersion for RNA-seq Data With DESeq2. Genome Biol (2014) 15(12):550. doi: 10.1186/s13059-014-0550-8
18. Zhu A, Ibrahim JG, Love MI. Heavy-Tailed Prior Distributions for Sequence Count Data: Removing the Noise and Preserving Large Differences. Bioinformatics (2019) 35(12):2084–92. doi: 10.1093/bioinformatics/bty895
19. Yu G, Wang LG, Yan GR, He QY. DOSE: An R/Bioconductor Package for Disease Ontology Semantic and Enrichment Analysis. Bioinformatics (2015) 31(4):608–9. doi: 10.1093/bioinformatics/btu684
20. Yu G, Wang LG, Han Y, He QY. clusterProfiler: An R Package for Comparing Biological Themes Among Gene Clusters. OMICS (2012) 16(5):284–7. doi: 10.1089/omi.2011.0118
21. Sergushichev AA. An Algorithm for Fast Preranked Gene Set Enrichment Analysis Using Cumulative Statistic Calculation. bioRxiv (2016) 060012. doi: 10.1101/060012
22. Kanehisa M, Goto S. KEGG: Kyoto Encyclopedia of Genes and Genomes. Nucleic Acids Res (2000) 28(1):27–30. doi: 10.1093/nar/28.1.27
23. Kanehisa M, Sato Y, Furumichi M, Morishima K, Tanabe M. New Approach for Understanding Genome Variations in KEGG. Nucleic Acids Res (2019) 47(D1):D590–D5. doi: 10.1093/nar/gky962
24. Ashburner M, Ball CA, Blake JA, Botstein D, Butler H, Cherry JM, et al. Gene Ontology: Tool for the Unification of Biology. The Gene Ontology Consortium. Nat Genet (2000) 25(1):25–9. doi: 10.1038/75556
25. The Gene Ontology C. The Gene Ontology Resource: 20 Years and Still GOing Strong. Nucleic Acids Res (2019) 47(D1):D330–D8. doi: 10.1093/nar/gky1055
26. Jassal B, Matthews L, Viteri G, Gong C, Lorente P, Fabregat A, et al. The Reactome Pathway Knowledgebase. Nucleic Acids Res (2020) 48(D1):D498–503. doi: 10.1093/nar/gkz1031
27. Braschi B, Denny P, Gray K, Jones T, Seal R, Tweedie S, et al. Genenames.Org: The HGNC and VGNC Resources in 2019. Nucleic Acids Res (2019) 47(D1):D786–D92. doi: 10.1093/nar/gky930
28. Decker T, Stockinger S, Karaghiosoff M, Muller M, Kovarik P. IFNs and STATs in Innate Immunity to Microorganisms. J Clin Invest (2002) 109(10):1271–7. doi: 10.1172/JCI0215770
29. Der SD, Zhou A, Williams BR, Silverman RH. Identification of Genes Differentially Regulated by Interferon Alpha, Beta, or Gamma Using Oligonucleotide Arrays. Proc Natl Acad Sci USA (1998) 95(26):15623–8. doi: 10.1073/pnas.95.26.15623
30. Wang W, Xu L, Su J, Peppelenbosch MP, Pan Q. Transcriptional Regulation of Antiviral Interferon-Stimulated Genes. Trends Microbiol (2017) 25(7):573–84. doi: 10.1016/j.tim.2017.01.001
31. de Veer MJ, Holko M, Frevel M, Walker E, Der S, Paranjape JM, et al. Functional Classification of Interferon-Stimulated Genes Identified Using Microarrays. J Leukoc Biol (2001) 69(6):912–20. doi: 10.1189/jlb.69.6.912
32. Kindler E, Thiel V, Weber F. Interaction of SARS and MERS Coronaviruses With the Antiviral Interferon Response. Adv Virus Res (2016) 96:219–43. doi: 10.1016/bs.aivir.2016.08.006
33. Kikkert M. Innate Immune Evasion by Human Respiratory RNA Viruses. J Innate Immun (2020) 12(1):4–20. doi: 10.1159/000503030
34. Deng X, Hackbart M, Mettelman RC, O’Brien A, Mielech AM, Yi G, et al. Coronavirus Nonstructural Protein 15 Mediates Evasion of dsRNA Sensors and Limits Apoptosis in Macrophages. Proc Natl Acad Sci USA (2017) 114(21):E4251–E60. doi: 10.1073/pnas.1618310114
35. Hackbart M, Deng X, Baker SC. Coronavirus Endoribonuclease Targets Viral Polyuridine Sequences to Evade Activating Host Sensors. Proc Natl Acad Sci USA (2020) 117(14):8094–103. doi: 10.1073/pnas.1921485117
36. Hu Y, Li W, Gao T, Cui Y, Jin Y, Li P, et al. The Severe Acute Respiratory Syndrome Coronavirus Nucleocapsid Inhibits Type I Interferon Production by Interfering With TRIM25-Mediated RIG-I Ubiquitination. J Virol (2017) 91(8):e01378-20. doi: 10.1128/JVI.02143-16
37. Comar CE, Goldstein SA, Li Y, Yount B, Baric RS, Weiss SR. Antagonism of Dsrna-Induced Innate Immune Pathways by NS4a and NS4b Accessory Proteins During MERS Coronavirus Infection. mBio (2019) 10(2):e00319-19. doi: 10.1128/mBio.00319-19
38. Rabouw HH, Langereis MA, Knaap RC, Dalebout TJ, Canton J, Sola I, et al. Middle East Respiratory Coronavirus Accessory Protein 4a Inhibits PKR-Mediated Antiviral Stress Responses. PloS Pathog (2016) 12(10):e1005982. doi: 10.1371/journal.ppat.1005982
39. Jiang HW, Zhang HN, Meng QF, Xie J, Li Y, Chen H, et al. SARS-CoV-2 Orf9b Suppresses Type I Interferon Responses by Targeting TOM70. Cell Mol Immunol (2020) 17(9):998–1000. doi: 10.1038/s41423-020-0514-8
40. Shi CS, Qi HY, Boularan C, Huang NN, Abu-Asab M, Shelhamer JH, et al. SARS-Coronavirus Open Reading frame-9b Suppresses Innate Immunity by Targeting Mitochondria and the MAVS/TRAF3/TRAF6 Signalosome. J Immunol (2014) 193(6):3080–9. doi: 10.4049/jimmunol.1303196
41. Yang Y, Ye F, Zhu N, Wang W, Deng Y, Zhao Z, et al. Middle East Respiratory Syndrome Coronavirus ORF4b Protein Inhibits Type I Interferon Production Through Both Cytoplasmic and Nuclear Targets. Sci Rep (2015) 5:17554. doi: 10.1038/srep17554
42. Wong HH, Fung TS, Fang S, Huang M, Le MT, Liu DX. Accessory Proteins 8b and 8ab of Severe Acute Respiratory Syndrome Coronavirus Suppress the Interferon Signaling Pathway by Mediating Ubiquitin-Dependent Rapid Degradation of Interferon Regulatory Factor 3. Virology (2018) 515:165–75. doi: 10.1016/j.virol.2017.12.028
43. Canton J, Fehr AR, Fernandez-Delgado R, Gutierrez-Alvarez FJ, Sanchez-Aparicio MT, Garcia-Sastre A, et al. MERS-CoV 4b Protein Interferes With the NF-kappaB-dependent Innate Immune Response During Infection. PloS Pathog (2018) 14(1):e1006838. doi: 10.1371/journal.ppat.1006838
44. Minakshi R, Padhan K, Rani M, Khan N, Ahmad F, Jameel S. The SARS Coronavirus 3a Protein Causes Endoplasmic Reticulum Stress and Induces Ligand-Independent Downregulation of the Type 1 Interferon Receptor. PloS One (2009) 4(12):e8342. doi: 10.1371/journal.pone.0008342
45. Frieman M, Yount B, Heise M, Kopecky-Bromberg SA, Palese P, Baric RS. Severe Acute Respiratory Syndrome Coronavirus ORF6 Antagonizes STAT1 Function by Sequestering Nuclear Import Factors on the Rough Endoplasmic Reticulum/Golgi Membrane. J Virol (2007) 81(18):9812–24. doi: 10.1128/JVI.01012-07
46. Zhang Q, Bastard P, Liu Z, Le Pen J, Moncada-Velez M, Chen J, et al. Inborn Errors of Type I IFN Immunity in Patients With Life-Threatening COVID-19. Science (2020) 370(6515):eabd4570. doi: 10.1126/science.abd4570
47. Zhu W, Xie K, Lu H, Xu L, Zhou S, Fang S. Initial Clinical Features of Suspected Coronavirus Disease 2019 in Two Emergency Departments Outside of Hubei, China. J Med Virol (2020) 92(9):1525–32. doi: 10.1002/jmv.25763
48. Shaw AC, Goldstein DR, Montgomery RR. Age-Dependent Dysregulation of Innate Immunity. Nat Rev Immunol (2013) 13(12):875–87. doi: 10.1038/nri3547
49. Hadjadj J, Yatim N, Barnabei L, Corneau A, Boussier J, Smith N, et al. Impaired Type I Interferon Activity and Inflammatory Responses in Severe COVID-19 Patients. Science (2020) 369(6504):718–24. doi: 10.1126/science.abc6027
50. Blanco-Melo D, Nilsson-Payant BE, Liu WC, Uhl S, Hoagland D, Moller R, et al. Imbalanced Host Response to SARS-CoV-2 Drives Development of COVID-19. Cell (2020) 181(5):1036–45.e9. doi: 10.1016/j.cell.2020.04.026
51. Channappanavar R, Fehr AR, Vijay R, Mack M, Zhao J, Meyerholz DK, et al. Dysregulated Type I Interferon and Inflammatory Monocyte-Macrophage Responses Cause Lethal Pneumonia in SARS-CoV-Infected Mice. Cell Host Microbe (2016) 19(2):181–93. doi: 10.1016/j.chom.2016.01.007
52. Lau SKP, Lau CCY, Chan KH, Li CPY, Chen H, Jin DY, et al. Delayed Induction of Proinflammatory Cytokines and Suppression of Innate Antiviral Response by the Novel Middle East Respiratory Syndrome Coronavirus: Implications for Pathogenesis and Treatment. J Gen Virol (2013) 94(Pt 12):2679–90. doi: 10.1099/vir.0.055533-0
53. Trouillet-Assant S, Viel S, Gaymard A, Pons S, Richard JC, Perret M, et al. Type I IFN Immunoprofiling in COVID-19 Patients. J Allergy Clin Immunol (2020) 146(1):206–8.e2. doi: 10.1016/j.jaci.2020.04.029
54. Bastard P, Rosen LB, Zhang Q, Michailidis E, Hoffmann HH, Zhang Y, et al. Auto-Antibodies Against Type I IFNs in Patients With Life-Threatening COVID-19. Science (2020) 370(6515):eabd4585. doi: 10.1126/science.abd4585
55. Mudd PA, Crawford JC, Turner JS, Souquette A, Reynolds D, Bender D, et al. Distinct Inflammatory Profiles Distinguish COVID-19 From Influenza With Limited Contributions From Cytokine Storm. Sci Adv (2020) 6(50):eabe3024. doi: 10.1126/sciadv.abe3024
56. Lee JS, Park S, Jeong HW, Ahn JY, Choi SJ, Lee H, et al. Immunophenotyping of COVID-19 and Influenza Highlights the Role of Type I Interferons in Development of Severe COVID-19. Sci Immunol (2020) 5(49):eabd1554. doi: 10.1126/sciimmunol.abd1554
57. Galani IE, Rovina N, Lampropoulou V, Triantafyllia V, Manioudaki M, Pavlos E, et al. Untuned Antiviral Immunity in COVID-19 Revealed by Temporal Type I/III Interferon Patterns and Flu Comparison. Nat Immunol (2021) 22(1):32–40. doi: 10.1038/s41590-020-00840-x
58. National Research Project for SARS BG. The Involvement of Natural Killer Cells in the Pathogenesis of Severe Acute Respiratory Syndrome. Am J Clin Pathol (2004) 121(4):507–11. doi: 10.1309/WPK7Y2XKNF4CBF3R
59. Zheng M, Gao Y, Wang G, Song G, Liu S, Sun D, et al. Functional Exhaustion of Antiviral Lymphocytes in COVID-19 Patients. Cell Mol Immunol (2020) 17(5):533–5. doi: 10.1038/s41423-020-0402-2
60. Chen G, Wu D, Guo W, Cao Y, Huang D, Wang H, et al. Clinical and Immunological Features of Severe and Moderate Coronavirus Disease 2019. J Clin Invest (2020) 130(5):2620–9. doi: 10.1172/JCI137244
61. Wang F, Nie J, Wang H, Zhao Q, Xiong Y, Deng L, et al. Characteristics of Peripheral Lymphocyte Subset Alteration in COVID-19 Pneumonia. J Infect Dis (2020) 221(11):1762–9. doi: 10.1093/infdis/jiaa150
62. Wilk AJ, Rustagi A, Zhao NQ, Roque J, Martinez-Colon GJ, McKechnie JL, et al. A Single-Cell Atlas of the Peripheral Immune Response in Patients With Severe COVID-19. Nat Med (2020) 26(7):1070–6. doi: 10.1038/s41591-020-0944-y
63. Silvin A, Chapuis N, Dunsmore G, Goubet AG, Dubuisson A, Derosa L, et al. Elevated Calprotectin and Abnormal Myeloid Cell Subsets Discriminate Severe From Mild COVID-19. Cell (2020) 182(6):1401–18.e18. doi: 10.1016/j.cell.2020.08.002
64. Dunning J, Blankley S, Hoang LT, Cox M, Graham CM, James PL, et al. Progression of Whole-Blood Transcriptional Signatures From Interferon-Induced to Neutrophil-Associated Patterns in Severe Influenza. Nat Immunol (2018) 19(6):625–35. doi: 10.1038/s41590-018-0111-5
65. Tang BM, Shojaei M, Teoh S, Meyers A, Ho J, Ball TB, et al. Neutrophils-Related Host Factors Associated With Severe Disease and Fatality in Patients With Influenza Infection. Nat Commun (2019) 10(1):3422. doi: 10.1038/s41467-019-11249-y
66. Josset L, Menachery VD, Gralinski LE, Agnihothram S, Sova P, Carter VS, et al. Cell Host Response to Infection With Novel Human Coronavirus EMC Predicts Potential Antivirals and Important Differences With SARS Coronavirus. mBio (2013) 4(3):e00165–13. doi: 10.1128/mBio.00165-13
67. Hansen TH, Bouvier M. MHC Class I Antigen Presentation: Learning From Viral Evasion Strategies. Nat Rev Immunol (2009) 9(7):503–13. doi: 10.1038/nri2575
68. Hegde NR, Chevalier MS, Johnson DC. Viral Inhibition of MHC Class II Antigen Presentation. Trends Immunol (2003) 24(5):278–85. doi: 10.1016/S1471-4906(03)00099-1
69. Forsyth KS, Eisenlohr LC. Giving CD4+ T Cells the Slip: Viral Interference With MHC Class II-restricted Antigen Processing and Presentation. Curr Opin Immunol (2016) 40:123–9. doi: 10.1016/j.coi.2016.03.003
70. Park MD. Immune Evasion Via SARS-CoV-2 ORF8 Protein? Nat Rev Immunol (2020) 20(7):408. doi: 10.1038/s41577-020-0360-z
71. Vabret N, Britton GJ, Gruber C, Hegde S, Kim J, Kuksin M, et al. Immunology of COVID-19: Current State of the Science. Immunity (2020) 52(6):910–41. doi: 10.1016/j.immuni.2020.05.002
72. Yao S, Buzo BF, Pham D, Jiang L, Taparowsky EJ, Kaplan MH, et al. Interferon Regulatory Factor 4 Sustains CD8(+) T Cell Expansion and Effector Differentiation. Immunity (2013) 39(5):833–45. doi: 10.1016/j.immuni.2013.10.007
73. Liao M, Liu Y, Yuan J, Wen Y, Xu G, Zhao J, et al. Single-Cell Landscape of Bronchoalveolar Immune Cells in Patients With COVID-19. Nat Med (2020) 26(6):842–4. doi: 10.1038/s41591-020-0901-9
74. Wang F, Hou H, Luo Y, Tang G, Wu S, Huang M, et al. The Laboratory Tests and Host Immunity of COVID-19 Patients With Different Severity of Illness. JCI Insight (2020) 5(10):e137799. doi: 10.1172/jci.insight.137799
75. Jouan Y, Guillon A, Gonzalez L, Perez Y, Boisseau C, Ehrmann S, et al. Phenotypical and Functional Alteration of Unconventional T Cells in Severe COVID-19 Patients. J Exp Med (2020) 217(12):e20200872. doi: 10.1084/jem.20200872
76. Yang X, Dai T, Zhou X, Qian H, Guo R, Lei L, et al. Naturally Activated Adaptive Immunity in COVID-19 Patients. J Cell Mol Med (2020) 24(21):12457–63. doi: 10.1111/jcmm.15771
77. Zhou Y, Fu B, Zheng X, Wang D, Zhao C, Qi Y, et al. Pathogenic T Cells and Inflammatory Monocytes Incite Inflammatory Storm in Severe COVID-19 Patients. Natl Sci Rev (2020) 7(6): 998–1002. doi: 10.1093/nsr/nwaa041
78. Huang H, Wang S, Jiang T, Fan R, Zhang Z, Mu J, et al. High Levels of Circulating GM-CSF(+)CD4(+) T Cells are Predictive of Poor Outcomes in Sepsis Patients: A Prospective Cohort Study. Cell Mol Immunol (2019) 16(6):602–10. doi: 10.1038/s41423-018-0164-2
79. Suzuki H, Kundig TM, Furlonger C, Wakeham A, Timms E, Matsuyama T, et al. Deregulated T Cell Activation and Autoimmunity in Mice Lacking Interleukin-2 Receptor Beta. Science (1995) 268(5216):1472–6. doi: 10.1126/science.7770771
80. Ahn E, Araki K, Hashimoto M, Li W, Riley JL, Cheung J, et al. Role of PD-1 During Effector CD8 T Cell Differentiation. Proc Natl Acad Sci USA (2018) 115(18):4749–54. doi: 10.1073/pnas.1718217115
81. Song JW, Zhang C, Fan X, Meng FP, Xu Z, Xia P, et al. Immunological and Inflammatory Profiles in Mild and Severe Cases of COVID-19. Nat Commun (2020) 11(1):3410. doi: 10.1038/s41467-020-17240-2
82. Seydoux E, Homad LJ, MacCamy AJ, Parks KR, Hurlburt NK, Jennewein MF, et al. Analysis of a SARS-CoV-2-Infected Individual Reveals Development of Potent Neutralizing Antibodies With Limited Somatic Mutation. Immunity (2020) 53(1):98–105.e5. doi: 10.1016/j.immuni.2020.06.001
83. Guo L, Ren L, Yang S, Xiao M, Chang, Yang F, et al. Profiling Early Humoral Response to Diagnose Novel Coronavirus Disease (COVID-19). Clin Infect Dis (2020) 71(15):778–85. doi: 10.1093/cid/ciaa310
84. Huang AT, Garcia-Carreras B, Hitchings MDT, Yang B, Katzelnick LC, Rattigan SM, et al. A Systematic Review of Antibody Mediated Immunity to Coronaviruses: Kinetics, Correlates of Protection, and Association With Severity. Nat Commun (2020) 11(1):4704. doi: 10.1038/s41467-020-18450-4
85. Li Y, Wang G, Li N, Wang Y, Zhu Q, Chu H, et al. Structural Insights Into Immunoglobulin M. Science (2020) 367(6481):1014–7. doi: 10.1126/science.aaz5425
86. Jaume M, Yip MS, Cheung CY, Leung HL, Li PH, Kien F, et al. Anti-Severe Acute Respiratory Syndrome Coronavirus Spike Antibodies Trigger Infection of Human Immune Cells Via a pH- and Cysteine Protease-Independent FcgammaR Pathway. J Virol (2011) 85(20):10582–97. doi: 10.1128/JVI.00671-11
87. Yip MS, Leung NH, Cheung CY, Li PH, Lee HH, Daeron M, et al. Antibody-Dependent Infection of Human Macrophages by Severe Acute Respiratory Syndrome Coronavirus. Virol J (2014) 11:82. doi: 10.1186/1743-422X-11-82
88. Perlman S, Dandekar AA. Immunopathogenesis of Coronavirus Infections: Implications for SARS. Nat Rev Immunol (2005) 5(12):917–27. doi: 10.1038/nri1732
89. Lin YS, Lin CF, Fang YT, Kuo YM, Liao PC, Yeh TM, et al. Antibody to Severe Acute Respiratory Syndrome (SARS)-Associated Coronavirus Spike Protein Domain 2 Cross-Reacts With Lung Epithelial Cells and Causes Cytotoxicity. Clin Exp Immunol (2005) 141(3):500–8. doi: 10.1111/j.1365-2249.2005.02864.x
90. Cheng M, Chan CW, Cheung RC, Bikkavilli RK, Zhao Q, Au SW, et al. Cross-Reactivity of Antibody Against SARS-Coronavirus Nucleocapsid Protein With IL-11. Biochem Biophys Res Commun (2005) 338(3):1654–60. doi: 10.1016/j.bbrc.2005.10.088
91. Yasmon A, Ibrahim F, Bela B, Sjahrurachman A. Potential Cross-Reactivity of Severe Acute Respiratory Syndrome-Associated Coronavirus (SARS-CoV) Nucleocapsid (N)-Based IgG ELISA Assay for Plasma Samples From HIV-1 Positive Intravenous Drug Users (IDUs). Acta Med Indones (2012) 44(3):193–8.
92. Zhu L, Yang P, Zhao Y, Zhuang Z, Wang Z, Song R, et al. Single-Cell Sequencing of Peripheral Mononuclear Cells Reveals Distinct Immune Response Landscapes of COVID-19 and Influenza Patients. Immunity (2020) 53(3):685–96.e3. doi: 10.1016/j.immuni.2020.07.009
93. Java A, Apicelli AJ, Liszewski MK, Coler-Reilly A, Atkinson JP, Kim AH, et al. The Complement System in COVID-19: Friend and Foe? JCI Insight (2020) 5(15):e140711. doi: 10.1172/jci.insight.140711
94. Shen B, Yi X, Sun Y, Bi X, Du J, Zhang C, et al. Proteomic and Metabolomic Characterization of COVID-19 Patient Sera. Cell (2020) 182(1):59–72.e15. doi: 10.1016/j.cell.2020.05.032
95. Gralinski LE, Sheahan TP, Morrison TE, Menachery VD, Jensen K, Leist SR, et al. Complement Activation Contributes to Severe Acute Respiratory Syndrome Coronavirus Pathogenesis. mBio (2018) 9(5):e01753-18. doi: 10.1128/mBio.01753-18
96. Cooling L. Blood Groups in Infection and Host Susceptibility. Clin Microbiol Rev (2015) 28(3):801–70. doi: 10.1128/CMR.00109-14
97. Nishimura H, Sugawara K, Kitame F, Nakamura K. Attachment of Influenza C Virus to Human Erythrocytes. J Gen Virol (1988) 69( Pt 10):2545–53. doi: 10.1099/0022-1317-69-10-2545
98. Paul RW, Lee PW. Glycophorin is the Reovirus Receptor on Human Erythrocytes. Virology (1987) 159(1):94–101. doi: 10.1016/0042-6822(87)90351-5
99. Allaway GP, Burness AT. Site of Attachment of Encephalomyocarditis Virus on Human Erythrocytes. J Virol (1986) 59(3):768–70. doi: 10.1128/JVI.59.3.768-770.1986
100. Telen MJ. Blood Group Antigens on Complement Receptor/Regulatory Proteins. Transfus Med Rev (1995) 9(1):20–8. doi: 10.1016/S0887-7963(05)80028-8
101. Mudad R, Telen MJ. Biologic Functions of Blood Group Antigens. Curr Opin Hematol (1996) 3(6):473–9. doi: 10.1097/00062752-199603060-00013
102. Jung J, Zeng H, Horng T. Metabolism as a Guiding Force for Immunity. Nat Cell Biol (2019) 21(1):85–93. doi: 10.1038/s41556-018-0217-x
103. Tannahill GM, Curtis AM, Adamik J, Palsson-McDermott EM, McGettrick AF, Goel G, et al. Succinate is an Inflammatory Signal That Induces IL-1beta Through HIF-1alpha. Nature (2013) 496(7444):238–42. doi: 10.1038/nature11986
104. Krawczyk CM, Holowka T, Sun J, Blagih J, Amiel E, DeBerardinis RJ, et al. Toll-Like Receptor-Induced Changes in Glycolytic Metabolism Regulate Dendritic Cell Activation. Blood (2010) 115(23):4742–9. doi: 10.1182/blood-2009-10-249540
105. Frauwirth KA, Riley JL, Harris MH, Parry RV, Rathmell JC, Plas DR, et al. The CD28 Signaling Pathway Regulates Glucose Metabolism. Immunity (2002) 16(6):769–77. doi: 10.1016/S1074-7613(02)00323-0
106. Doughty CA, Bleiman BF, Wagner DJ, Dufort FJ, Mataraza JM, Roberts MF, et al. Antigen Receptor-Mediated Changes in Glucose Metabolism in B Lymphocytes: Role of Phosphatidylinositol 3-Kinase Signaling in the Glycolytic Control of Growth. Blood (2006) 107(11):4458–65. doi: 10.1182/blood-2005-12-4788
107. Dufort FJ, Bleiman BF, Gumina MR, Blair D, Wagner DJ, Roberts MF, et al. Cutting Edge: IL-4-Mediated Protection of Primary B Lymphocytes From Apoptosis Via Stat6-Dependent Regulation of Glycolytic Metabolism. J Immunol (2007) 179(8):4953–7. doi: 10.4049/jimmunol.179.8.4953
108. Donnelly RP, Loftus RM, Keating SE, Liou KT, Biron CA, Gardiner CM, et al. mTORC1-Dependent Metabolic Reprogramming is a Prerequisite for NK Cell Effector Function. J Immunol (2014) 193(9):4477–84. doi: 10.4049/jimmunol.1401558
109. Vats D, Mukundan L, Odegaard JI, Zhang L, Smith KL, Morel CR, et al. Oxidative Metabolism and PGC-1beta Attenuate Macrophage-Mediated Inflammation. Cell Metab (2006) 4(1):13–24. doi: 10.1016/j.cmet.2006.05.011
110. Jha AK, Huang SC, Sergushichev A, Lampropoulou V, Ivanova Y, Loginicheva E, et al. Network Integration of Parallel Metabolic and Transcriptional Data Reveals Metabolic Modules That Regulate Macrophage Polarization. Immunity (2015) 42(3):419–30. doi: 10.1016/j.immuni.2015.02.005
111. Weiss SL, Cvijanovich NZ, Allen GL, Thomas NJ, Freishtat RJ, Anas N, et al. Differential Expression of the Nuclear-Encoded Mitochondrial Transcriptome in Pediatric Septic Shock. Crit Care (2014) 18(6):623. doi: 10.1186/s13054-014-0623-9
112. Fan Y, Sanyal S, Bruzzone R. Breaking Bad: How Viruses Subvert the Cell Cycle. Front Cell Infect Microbiol (2018) 8:396. doi: 10.3389/fcimb.2018.00396
113. Bagga S, Bouchard MJ. Cell Cycle Regulation During Viral Infection. Methods Mol Biol (2014) 1170:165–227. doi: 10.1007/978-1-4939-0888-2_10
114. Yuan X, Shan Y, Zhao Z, Chen J, Cong Y. G0/G1 Arrest and Apoptosis Induced by SARS-CoV 3b Protein in Transfected Cells. Virol J (2005) 2:66. doi: 10.1186/1743-422X-2-66
115. Yuan X, Wu J, Shan Y, Yao Z, Dong B, Chen B, et al. SARS Coronavirus 7a Protein Blocks Cell Cycle Progression At G0/G1 Phase Via the Cyclin D3/pRb Pathway. Virology (2006) 346(1):74–85. doi: 10.1016/j.virol.2005.10.015
116. Zhang L, Guo H. Biomarkers of COVID-19 and Technologies to Combat SARS-CoV-2. Adv Biomark Sci Technol (2020) 2:1–23. doi: 10.1016/j.abst.2020.08.001
Keywords: COVID-19, SARS-CoV-2, influenza, whole blood transcriptome, RNA-sequencing, immune profiling
Citation: Bibert S, Guex N, Lourenco J, Brahier T, Papadimitriou-Olivgeris M, Damonti L, Manuel O, Liechti R, Götz L, Tschopp J, Quinodoz M, Vollenweider P, Pagani J-L, Oddo M, Hügli O, Lamoth F, Erard V, Voide C, Delorenzi M, Rufer N, Candotti F, Rivolta C, Boillat-Blanco N, Bochud P-Y and the RegCOVID Study Group (2021) Transcriptomic Signature Differences Between SARS-CoV-2 and Influenza Virus Infected Patients. Front. Immunol. 12:666163. doi: 10.3389/fimmu.2021.666163
Received: 09 February 2021; Accepted: 10 May 2021;
Published: 31 May 2021.
Edited by:
Carl G. Feng, The University of Sydney, AustraliaReviewed by:
Klaus Schughart, Helmholtz Association of German Research Centers (HZ), GermanyCopyright © 2021 Bibert, Guex, Lourenco, Brahier, Papadimitriou-Olivgeris, Damonti, Manuel, Liechti, Götz, Tschopp, Quinodoz, Vollenweider, Pagani, Oddo, Hügli, Lamoth, Erard, Voide, Delorenzi, Rufer, Candotti, Rivolta, Boillat-Blanco, Bochud and the RegCOVID Study Group. This is an open-access article distributed under the terms of the Creative Commons Attribution License (CC BY). The use, distribution or reproduction in other forums is permitted, provided the original author(s) and the copyright owner(s) are credited and that the original publication in this journal is cited, in accordance with accepted academic practice. No use, distribution or reproduction is permitted which does not comply with these terms.
*Correspondence: Pierre-Yves Bochud, UGllcnJlLVl2ZXMuQm9jaHVkQGNodXYuY2g=
∥Full list of contributors can be found in the Acknowledgments
†These authors have contributed equally to this work and share first authorship
‡These authors have contributed equally to this work and share second authorship
§These authors have contributed equally to this work and share last authorship
Disclaimer: All claims expressed in this article are solely those of the authors and do not necessarily represent those of their affiliated organizations, or those of the publisher, the editors and the reviewers. Any product that may be evaluated in this article or claim that may be made by its manufacturer is not guaranteed or endorsed by the publisher.
Research integrity at Frontiers
Learn more about the work of our research integrity team to safeguard the quality of each article we publish.