
95% of researchers rate our articles as excellent or good
Learn more about the work of our research integrity team to safeguard the quality of each article we publish.
Find out more
ORIGINAL RESEARCH article
Front. Immunol. , 28 April 2021
Sec. Cytokines and Soluble Mediators in Immunity
Volume 12 - 2021 | https://doi.org/10.3389/fimmu.2021.659790
This article is part of the Research Topic The Versatile Role of Nicotinamide Adenine Dinucleotide in Immunity View all 10 articles
Ca2+ signaling plays an essential role in T cell activation, which is a key step to start an adaptive immune response. During the transition from a quiescent to a fully activated state, Ca2+ microdomains characterized by reduced spatial and temporal extents are observed in the junctions between the plasma membrane (PM) and the endoplasmic reticulum (ER). Such Ca2+ responses can also occur in response to T cell adhesion to other cells or extracellular matrix proteins in otherwise unstimulated T cells. These non-TCR/CD3-dependent Ca2+ microdomains rely on D-myo-inositol 1,4,5-trisphosphate (IP3) signaling and subsequent store operated Ca2+ entry (SOCE) via the ORAI/STIM system. The detailed molecular mechanism of adhesion-dependent Ca2+ microdomain formation remains to be fully elucidated. We used mathematical modeling to investigate the spatiotemporal characteristics of T cell Ca2+ microdomains and their molecular regulators. We developed a reaction-diffusion model using COMSOL Multiphysics to describe the evolution of cytosolic and ER Ca2+ concentrations in a three-dimensional ER-PM junction. Equations are based on a previously proposed realistic description of the junction, which is extended to take into account IP3 receptors (IP3R) that are located next to the junction. The first model only considered the ORAI channels and the SERCA pumps. Taking into account the existence of preformed clusters of ORAI1 and STIM2, ORAI1 slightly opens in conditions of a full ER. These simulated Ca2+ microdomains are too small as compared to those observed in unstimulated T cells. When considering the opening of the IP3Rs located near the junction, the local depletion of ER Ca2+ allows for larger Ca2+ fluxes through the ORAI1 channels and hence larger local Ca2+ concentrations. Computational results moreover show that Ca2+ diffusion in the ER has a major impact on the Ca2+ changes in the junction, by affecting the local Ca2+ gradients in the sub-PM ER. Besides pointing out the likely involvement of the spontaneous openings of IP3Rs in the activation of SOCE in conditions of T cell adhesion prior to full activation, the model provides a tool to investigate how Ca2+ microdomains extent and interact in response to T cell receptor activation.
T cell stimulation initiates a cascade of intracellular events among which increases of the free cytosolic Ca2+ concentration (CC), having well-defined spatio-temporal characteristics, play a crucial role. In particular, Ca2+ controls many processes that are essential for an adaptive immune response such as transcriptional activation, proliferation, differentiation or secretion of cytokines (1). As in most non-excitable cells, the classical model for Ca2+ signaling in T cells considers as first step the formation of D-myo-inositol 1,4,5-trisphopshate (IP3) and subsequent activation of IP3R (2). Another Ca2+ mobilizing second messenger, nicotinic acid adenine dinucleotide phosphate (NAADP) has been shown to be also involved through its action on type 1 ryanodine receptor (RYR1) (3, 4). Both IP3R and RyR1 release Ca2+ from the endoplasmic reticulum (ER), which results in a significant decrease of the luminal Ca2+ concentration and thereby stimulates capacitative or store operated Ca2+ entry (SOCE) (see (5) for review) via the ORAI/STIM system. The Ca2+ filling state of the ER is indeed detected by Ca2+ sensors stromal interaction molecules 1 (STIM1) and 2 (STIM2) located in the ER membrane (6, 7). Upon a decrease in ER Ca2+, Ca2+ dissociates from STIMs and STIM molecules aggregate and move to so-called “junctional spaces”. These junctions, also called “puncta”, are regions of the cell where the ER is located in close proximity of the plasma membrane (PM), thereby creating a 10-20 nm gap of cytosol between the two membranes (8). There, STIM molecules can recruit ORAI1 to form active Ca2+ channels that allow Ca2+ to enter from the extracellular medium into the cytosol (1, 9). The relation between SOCE and the ER Ca2+ concentration (CS) is non-linear and generally described by a decreasing Hill function of CS, with a KD for half activation of the order of ~200 µM when it depends on the dissociation of Ca2+ from STIM1 and of ~400 µM when it depends on the dissociation of Ca2+ from STIM2 (6, 10, 11). Since resting CS is in the range 400-600 µM depending on the cell type (12), STIM1 is activated only upon conditions of massive ER depletion, while STIM2 has a greater sensitivity to small decreases in CS.
Global Ca2+ signaling is often preceded by local Ca2+ signals known as “Ca2+ microdomains” that occur as a signaling transition state between quiescence and full activation of cells (13). Interestingly, a role for ORAI/STIM proteins in Ca2+ microdomains occurring in the process of immune synapse formation was described (14). High-resolution Ca2+ imaging revealed that T cell Ca2+ microdomains occur as a signaling transition during the first ~15 s following cell activation by TCR/CD3 and show well-defined spatio-temporal dynamics. Such Ca2+ increases appear randomly in time and last for 64 ± 3 ms [computed from the data of (4)]. Ca2+ microdomains extent on 0.216 μm2 ± 0.004 and display an average amplitude of 325 ± 11 nM (3, 4). They are initiated by NAADP signaling acting on RYR1 and strongly depend on ORAI1 and both STIM1 and STIM2.
Similar Ca2+ microdomains can moreover occur in the absence of T cell activation via TCR/CD3 (non-TCR/CD3-dependent Ca2+ microdomains). These small signals are more than four times less frequent than those occurring in the first seconds following stimulation and are shorter [44 ± 4 ms, computed from the data of (4)] but display similar amplitudes (290 ± 12 nM). This amplitude is not affected by the absence RYR1, which indicates that NAADP-evoked Ca2+ release is not significantly involved in the creation of non-TCR/CD3-dependent Ca2+ microdomains. In contrast to TCR/CD3-dependent Ca2+ microdomains, the non-TCR/CD3-dependent microdomains rely on T cell adhesion to other cells or proteins of the extracellular matrix (ECM), integrin evoked IP3 signaling and subsequent SOCE via the ORAI/STIM system (15). In these conditions, pre-formed complexes of ORAI1 and both STIM1 and STIM2 have been obtained by FRET experiments and super-resolution microscopy (4, 15).
Non-TCR/CD3-dependent Ca2+ microdomains are the signature of a basal, low-level Ca2+ entry in resting T cells. How partial and local depletion in CS allows Ca2+ to enter into the cytosol through preformed assembly of ORAI1 and STIM molecules, cannot be resolved experimentally on the single channel level given that current Ca2+ imaging systems are characterized by spatial and temporal resolutions in the range of several hundreds of nanometers and tens of milliseconds, e.g. 368 nm and 20 to 25 ms, respectively (3). Here, we used mathematical modelling to further investigate the molecular origin of non-TCR/CD3-dependent Ca2+ microdomains. In particular, we quantitatively explored the relation between the Ca2+ concentration in a PM junction and in its adjacent ER upon opening of pre-formed ORAI1/STIM2 channels, under different conditions triggering channel opening and for various spatial geometries of the junction.
Mathematical modeling has been much used in the field of Ca2+ signaling to help deciphering its sophisticated spatio-temporal organization and its versatility (16). In particular, small-scale Ca2+ events corresponding to the spontaneous, stochastic opening of a few IP3R have been much investigated theoretically (17–22). Similarly, simulations of Ca2+ fluxes in realistic geometries have been very useful to explore the relation between microscopic structures and cellular responses in cardiac cells (23, 24).
How SOCE interferes with Ca2+ signaling has mainly been investigated in models that do not take the detailed arrangement of the Ca2+ stores and fluxes into account. Using an ad hoc dependence of the SOC current on ER Ca2+ concentration, Ong et al. (25) showed that the re-localization of STIM1 near ORAI1 channels, and thus the status of SOCE, depends on the Ca2+ concentration just beneath the ER membrane. A molecular description of a Ca2+-dependent ORAI1-STIM1 binding was introduced by Liu et al. (26), who fitted their model to reproduce data of SOCE activation in human Jurkat leukemic T cells (10). A theoretical study closely based on experimental observations in airway smooth muscle cells enlightened the primary role played by SOCE in the maintenance of agonist induced Ca2+ entry (27). A similar, phenomenological description of SOCE was introduced in an extended model of Ca2+ signaling and transcription factor activation in T-lymphocytes (28). In another recent study, Yoast et al. (29) used mathematical modelling to back-up their experimental investigation of the relation between the precise composition of ORAI heteromultimers and global Ca2+ signaling that differentially activates NFAT-mediated transcriptional responses.
Other mathematical models have focused on the spatial aspects of SOCE-mediated influx, and more especially on the influence of the geometry of the ER-PM junction on the spatio-temporal characteristics of Ca2+ entry. These models describe Ca2+ signaling in one PM-ER junction. Unequivocal theoretical considerations allowed establishing the highly local character of the ORAI1-mediated Ca2+ profile through ORAI1 in a realistic junction geometry (30). A 3D spatial model was developed by Samanta et al. (31) to investigate the effect of clustering within the ER-PM junction of RBL-1 cells. They concluded that ORAI1 clustering increases both the amplitude and the spatial spread of the Ca2+ signal in the junction in response to a massive decrease in ER Ca2+. A more detailed description of the junction, taking into account the sub-PM ER and the activity of the SERCAs in the junction, was later developed by McIvor et al. (32). The model allowed to investigate the microscopic patterning of the Ca2+ signal in the junction and the replenishment of the ER after significant depletion, in conditions encountered when cells are treated with massive doses of SERCA inhibitors.
In this study, we adapt the model proposed by McIvor et al. (32) to investigate the molecular origin of the non-TCR/CD3-dependent Ca2+ microdomains that have been observed in T cells adhering to poly-L-lysine coated surface (4). After describing the mathematical model, we successively simulate situations with and without IP3Rs in the sub-PM ER membrane. We found that the local ER depletions created by their spontaneous activity are necessary to account for experimental observations about the average amplitude of Ca2+ microdomains in T cells. We also used the model to investigate the impact of Ca2+ diffusion in the ER and of the distance between ORAI1 channels and found that only the former factor has a significant impact on the characteristics of the Ca2+ signals in the PM-ER junction.
Our model is based on the realistic 3-dimensional mathematical description of the junction proposed by McIvor et al. (32). In this study, the authors investigated Ca2+ dynamics associated with SOCE in conditions corresponding to a significant depletion of the ER, up to [Ca2+] = 150 μM. Here, we used a modified version of this model to investigate the origin of the non-TCR/CD3-dependent Ca2+ microdomains described by Diercks et al. (4).
Model geometry is shown in Figure 1. It represents a portion of ER surrounded by cytoplasm, with the specificity that the ER and the PM membranes are very close to one another. The part of the ER that is closest to the PM is called sub-PM ER (25) and is described by a conic domain. The up and bottom faces have diameters of 200 nm and 400 nm, respectively. The depth of the sub-PM is 485 nm (32). The bottom face stands for the sub-PM ER limit, where it coincides with the bulk of the ER (ERBulk). The sub-PM ER is embedded in a cubic cytosolic domain of 400 nm x 400 nm that includes the ER-PM junction itself, represented as a cylindrical sub-domain of 200 nm in diameter that extends 15 nm from the ER membrane (ERM) up to the PM. The rest of the cube corresponds to the cytosol adjacent to the junction (Figures 1A, B). The lateral faces of the cube are in contact with the bulk cytosol of the cell.
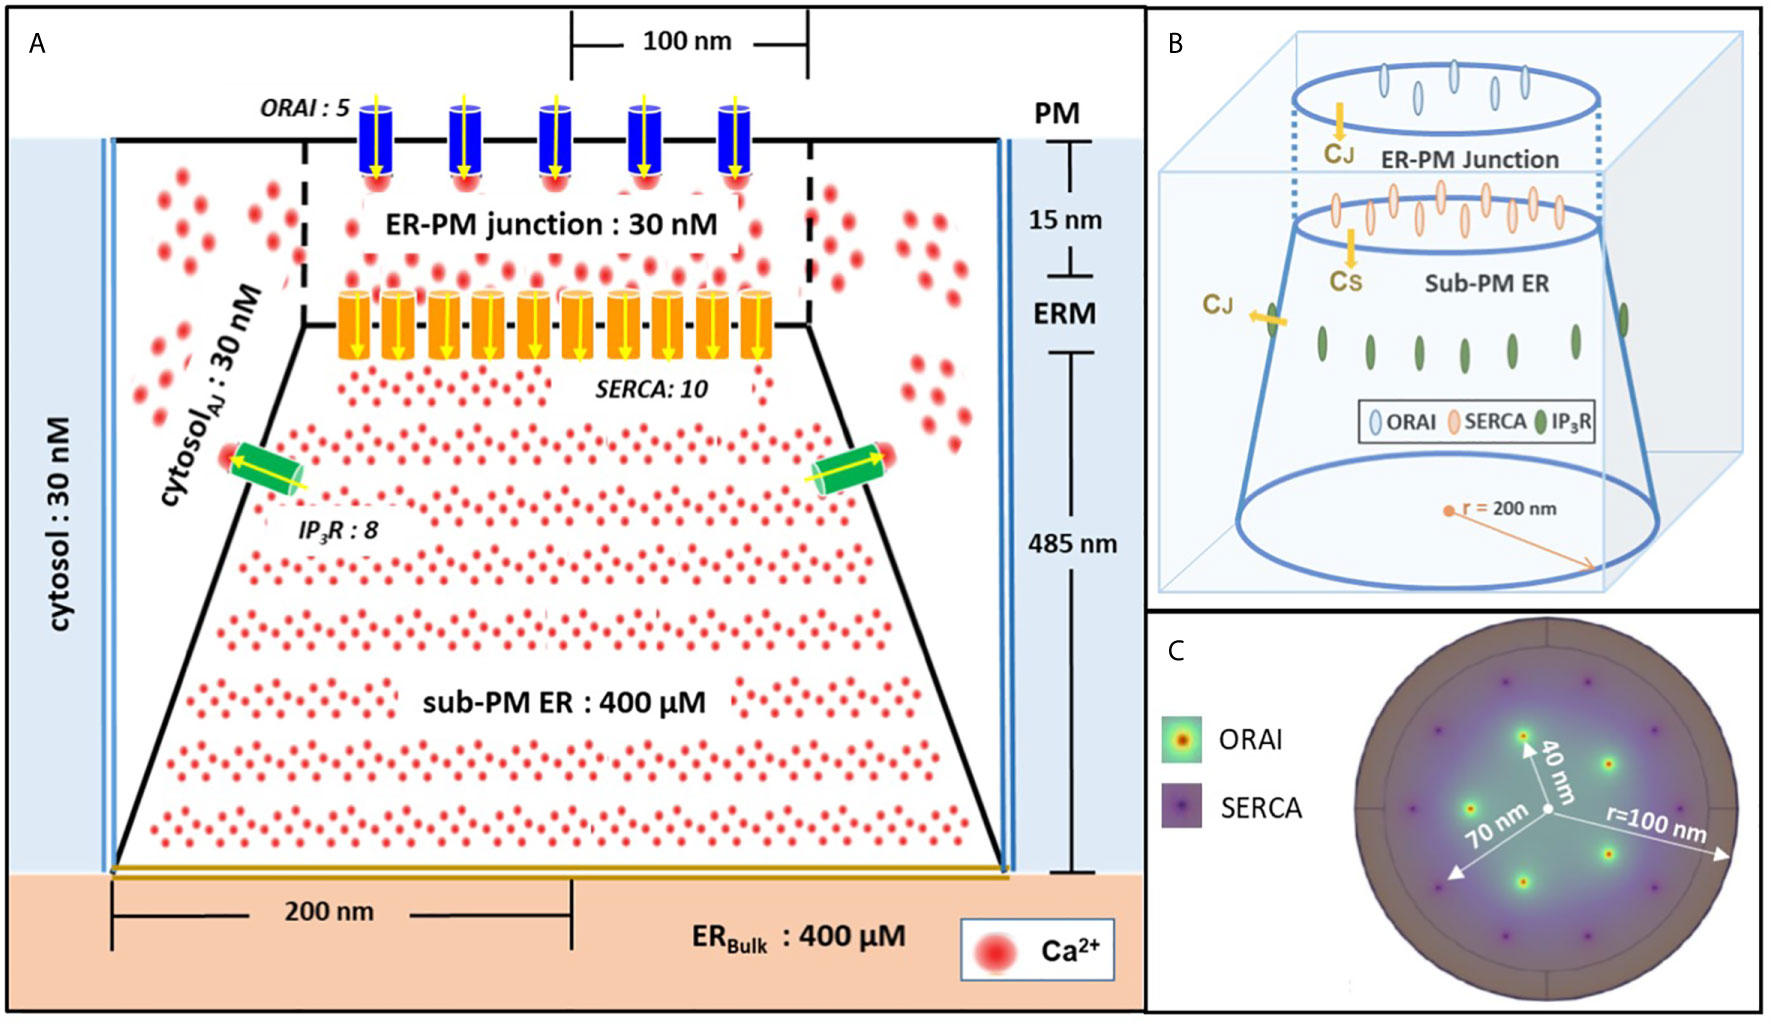
Figure 1 Schematic representation of the model geometry of the ER-PM junction and sub-PM ER used to investigate the origin of the Ca2+ microdomains in T cells. (A) Frontal diagram showing the dimensions of the cone that represents the sub-PM ER, of the junction and of the portion of the cytosol considered in the simulations. ORAI1 channels are in blue, SERCA pumps in yellow and IP3Rs in green. Plain lines represent membrane boundaries; dashed lines, fictitious limits between the junction and the cytosol and double lines indicate the limits of the simulated system. The resting Ca2+ concentrations considered as initial conditions and boundary conditions in the two compartments are indicated. (B) 3D view of the model geometry (C) Upper view of the positions of the ORAI1 channels on the PM, in green, and of the ERM, in purple, using COMSOL. Not to scale. This geometry is based on McIvor et al. (32). See text for details.
We include five ORAI channels on the PM as estimated by Hogan (30) and ten SERCA pumps as proposed by McIvor et al. (32), both placed at the rim of concentric rings with a 40 nm and 70 nm radius, respectively (Figure 1C). The corresponding inter-channel distances are thus 47 nm for ORAI1s, as estimated by Samanta et al. (31) and 44 nm for SERCAs. The arrangement of SERCAs as a ring around the ORAI1s in the junction follows the arrangement proposed by Alonso et al. (33). As will be explained in the “Results” section (15), IP3Rs have to be considered in the simulations to describe junctional Ca2+ microdomains in T cells. Thus, a cluster of eight IP3Rs is included at the boundary between the sub-PM ER and the cytosol. Spatial arrangement of the IP3Rs is based on the work by Thillaiappan et al. (34), who reported clusters of native immobile ‘licensed’ IP3Rs residing alongside the ER-PM junction and facing the PM. The IP3R inter-channel distance varies from 30 nm up to 200 nm (34–36). We chose 90 nm for symmetry reasons and use the same distance to the ER membrane. Actually, as detailed in the next section, this location simply reflects that IP3R’s colocalize with SOC channels.
Continuous black lines in Figure 1A represent membranes and thus correspond to no flux boundary conditions, except across channels and pumps. The black dashed lines represent symbolic boundaries between the ER-PM junction and the cytosol, through which Ca2+ actually diffuses freely. Dirichlet boundary conditions corresponding to the initial Ca2+ concentrations are imposed at the outer boundaries represented by double bold lines, blue to the cytosol and yellow to ERbulk as in McIvor et al. (32). Thus, we fix the free cytosolic [Ca2+] CC at 30 nM at the boundaries between the junction and the cytosol. This is in agreement with the brief and local nature of Ca2+ microdomains (30). Similarly, because the regulation of SOCE is governed mainly by [Ca2+]ER in close proximity to the junction (25), a constant ER Ca2+ concentration equal to 400 μM, corresponding to the Ca2+ resting concentration in the bulk of the ER, is imposed at the bottom boundary of the sub-PM ER domain. All parameter values are given in Table S1.
The model describes the evolutions of Ca2+ concentration in the cytosol (CC) and in the sub-PM ER (Cs). These concentrations obey the diffusion equations
where DC and DS stand for the Ca2+ diffusion coefficient in the cytosol and in the ER, respectively. Default values for these coefficients are 220 and 10 μm2/s (32). Ca2+ fluxes are taken into account in the boundary conditions that are schematized in Figure 1, described in the previous section and detailed in the Supplementary Information.
The flux through the ORAI channel is given by Eq. 2, with IORAI the maximal single channel current, F the Faraday constant, z the charge of a Ca2+ ion and AO the surface of the channel pore:
The function f, which takes discrete values between 0 and 1, allows to consider the different opening states of the ORAI1 channel. These states relate to the local concentration of Ca2+ around the mouth of the IP3R )
In the model, this concentration was evaluated as the average [Ca2+] in a 108 nm3 volume surrounding each IP3R. Each volume is independently sensed by one associated ORAI1 channel. This modelling assumption, through which we explicitly consider SOC channels located in very close proximity of immobile IP3Rs, is based on considerations described in Thillaiappan et al. (34). Eq. 2 implies that the exact distance between ORAI1’s and IP3R’s will not change the outcome of the simulations, as a consequence of the fact that STIM molecules are not modelled explicitly. Function f was defined on the basis of the relation between the SOC current and [Ca2+]ER measured by Luik et al. (10) in Jurka T cells, while taking into account that STIM2 has a lower KD for Ca2+ than STIM1. This relation was combined with the results of Li et al. (37) on the graded activation of ORAI1 channels in HEK cells (see Figure S1 and Supplementary Information for a detailed explanation). A similar graded description of the different opening states of ORAI1 depending in that case on the number of STIM1 attached is used in Schmidt et al. (38). Because we investigate conditions of full ER, STIM1 that has a high affinity for Ca2+ is not explicitly considered in the present simulations (39).
The flux through the IP3R is given by Eq. 3, with IIP3R the current through the IP3R and AIP3R the surface of the channel pore. The second factor allows to scale the current to take the actual gradient across the channel pore into account, where CS,0 and CJ,0 represent resting concentrations of Ca2+ in the ER and in the cytosol (40). A unitary IP3R current of 0.064 pA (41) has been estimated at the baseline concentration difference.
The SERCA pumps are considered as bidirectional. We used the same kinetic expression as McIvor et al. (32). As in the latter study, we did not include Ca2+ buffering explicitly, given both the short time scales considered and the fact that local Ca2+ buffers are near saturation given the high Ca2+ concentrations reached around the channel mouths. Values of parameters are taken from McIvor et al. (32) and indicated in Table S1. For the processes that were not considered in this previous study, parameter values are discussed in the text and indicated in the figure legends or in the Supplementary Information.
To solve the partial differential equations (PDE), we used the finite element method (FEM) and simulation software COMSOL Multiphysics 5.5 (http://www.comsol.com) instead of using Green’s functions as it was done in McIvor et al. (32). This choice is based on the considerable extra flexibility and accuracy provided by the software, since it includes a specific physics-controlled domain discretization and solver configuration, which permits geometry modifications or model expansions. The computational capacity of the software also allowed us to rapidly perform a large number of simulations to explore various possible biological situations.
Non-TCR/CD3-dependent Ca2+ microdomains last for 44 ± 4 ms and reach amplitudes of 290 ± 12 nM (4). Further, such Ca2+ microdomains were not decreased in T cells devoid of RYR1 (4). To determine whether ORAI1 channel openings are sufficient to explain non-TCR/CD3-dependent Ca2+ microdomains mechanistically, in a first approach, we used our model to predict the amplitude and spatial extent of the changes in junctional [Ca2+] induced by the opening of ORAI1 channels, in the presence of SERCA pumps as schematized in Figure 1. IP3Rs are not considered in these first simulations. The ER is assumed to be full to reproduce the situation of unstimulated T cells in which Ca2+ microdomains have been observed. In consequence, ORAI1 channels open at 21% of their full current when attached to Ca2+-unbound STIM2 (Figure S1). This situation is assumed to correspond to the spontaneous opening of an ORAI1 channel in the conditions of a full ER, mediated by a pre-formed ORAI1-STIM2 complex from which ER Ca2+ spontaneously dissociates due to a random fluctuation. In Figure 2, we considered an opening duration of 44 ms, based on the observed lifespan of the microdomains. Opening of one ORAI1 channel leads to a Ca2+ increase up to 4 μM at the cytosolic mouth of the channel. Because of the steep Ca2+ gradient across the PM, Ca2+ increases nearly instantaneously at the channel mouth. When ORAI1 closes, the microdomain disappears as soon as ORAI1 closes, given the small size of the domain respective to the cytosol. The spatial extent around the channel mouth is approx. 40-50 nm in diameter, which much exceeds the dimension of the channel pore, due to diffusion. However, this spatial extent remains significantly below the optical resolution of most current live cell imaging systems, preventing meaningful comparison with experimental data. The amplitude of the average Ca2+ increase in the junction is however below the experimentally determined lower limit (Figures 2C, H). From these computational results, one can conclude that the experimentally observed microdomains do not correspond to the opening of one ORAI1 channel in the conditions of full ER. If three or more ORAI1 open simultaneously, this creates a Ca2+ signal just below the plasma membrane that can be classified as a microdomain, as defined by Diercks et al. (4). For five open channels, the Ca2+ signal has an amplitude of 252 nM and a spatial extent of 0.04 μm2. It is worth noticing that five ORAI1 channels simultaneously open at 21% during 44 ms correspond to the entry of ~300 Ca2+ ions in the junction. However, given the small volume of the junction and the high diffusion coefficient of free Ca2+ (220 μm2/s), the time of residence of an ion in the junction is of the order of 0.045 ms. Because of this small residence time and of the activity of SERCA pumps, average numbers of free Ca2+ ions in the microdomain evaluated on the basis of the simulated concentrations thus remain smaller than one.
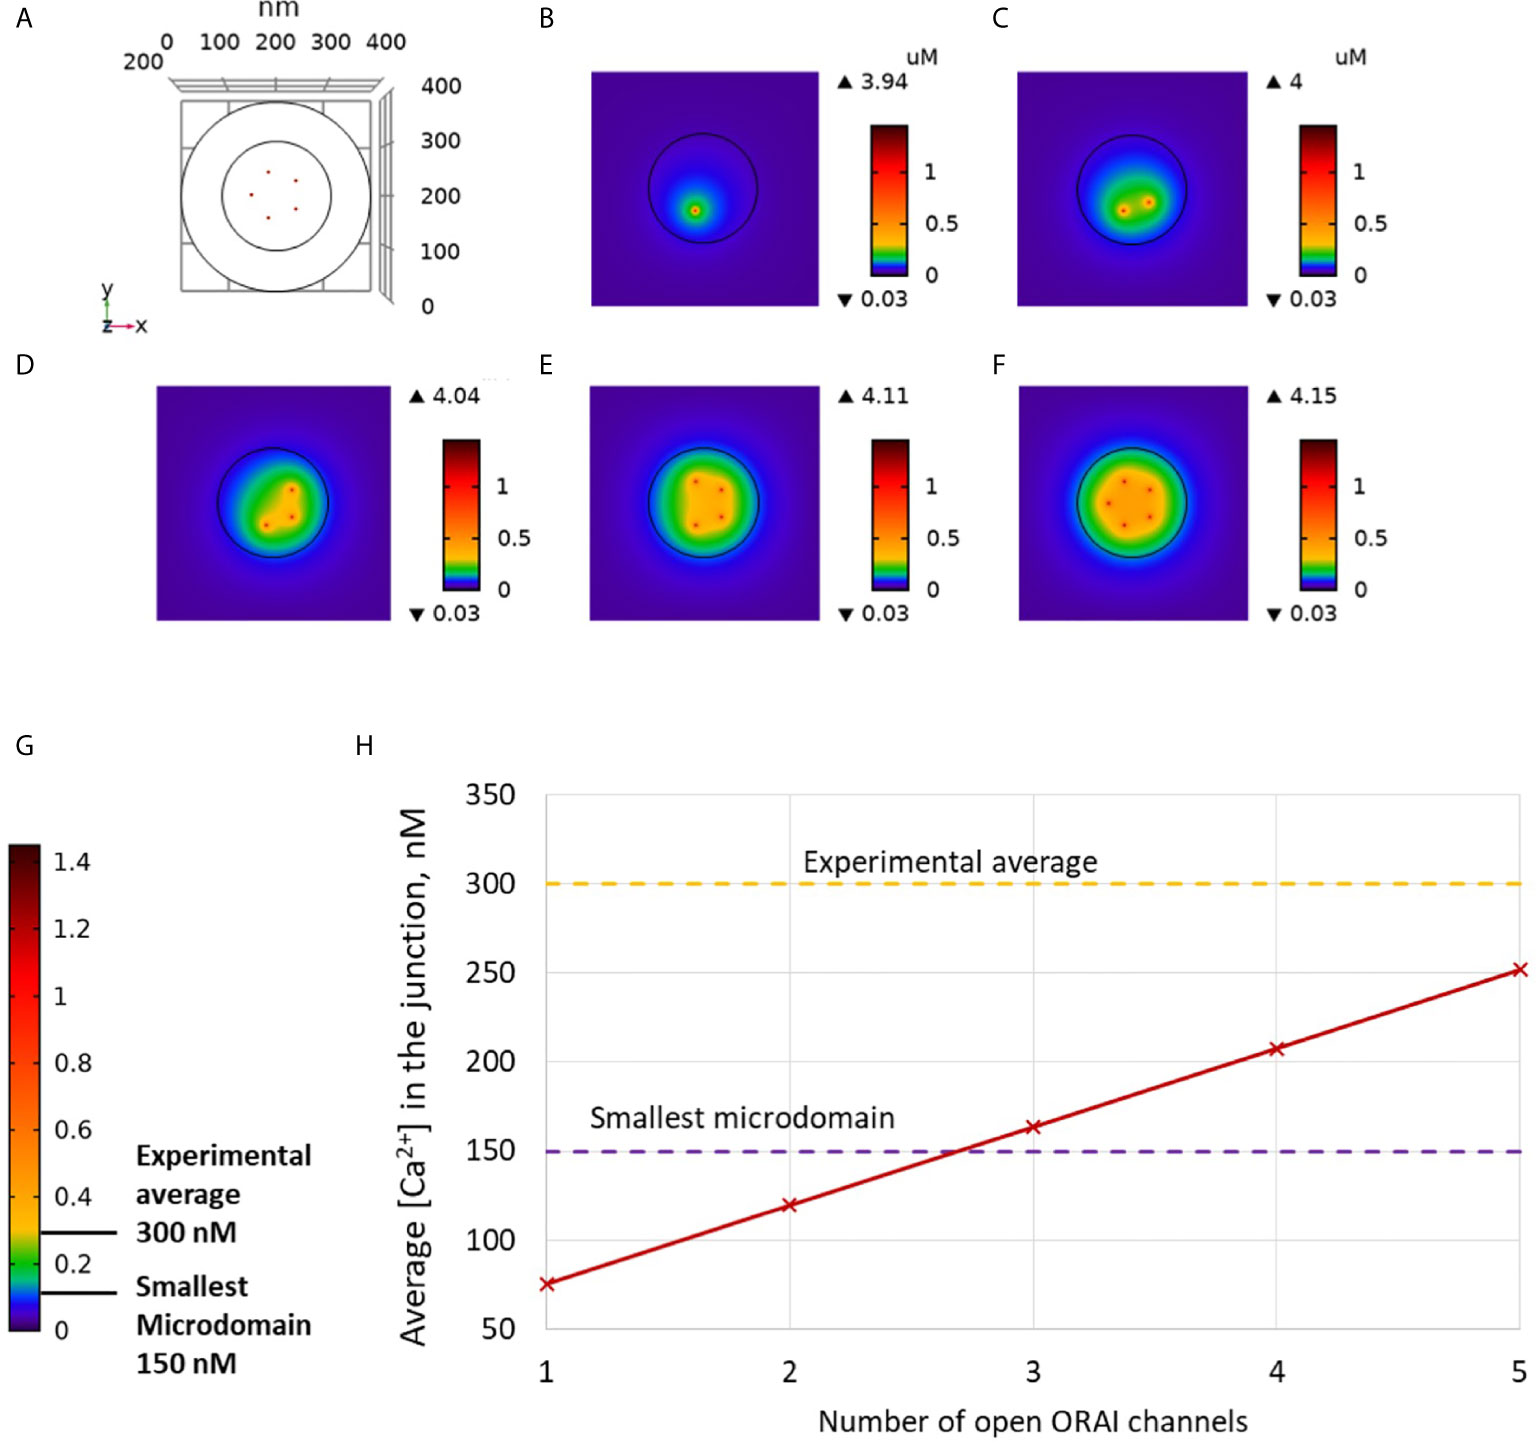
Figure 2 Simulated Ca2+ microdomains resulting from the opening of ORAI1 channels under the conditions of a full ER. (A) Upper view of the arrangement of the ORAI1 channels on the PM of the junction using COMSOL. (B–F) Steady-state Ca2+ profiles in the junction when opening 1 (B) to 5 (F) ORAI1 channels simultaneously. Left bars indicate the color codes, together with the minimal and maximal concentrations reached in the related panels. Shown are the profiles 22ms after opening of the ORAI1s, but these stabilize very rapidly, after a few ms. (G) Extended color code with marking of the smallest amplitude experimentally considered to correspond to a microdomain and of the average amplitude of microdomain in unstimulated T cells (4). (H) Evolution of the amplitude of the simulated Ca2+ microdomains with the number of simultaneously open ORAI1 in the junction, showing that experimentally observed microdomains cannot result from the sole opening of the ORAI1 in conditions of a full ER that only allows for a partial opening of these channels (see text).
The Ca2+ signals created by the simultaneous opening of five ORAI1 channels are thus not compatible with the average amplitude of 300 nM observed experimentally. This indicates that even in the unlikely situation of a simultaneous opening of the five ORAI1 channels of the junction in conditions of a full ER, the amount of Ca2+ entering in the simulated junction is too small to account for experimental observations (Anim. S1). Indeed, SERCA pumps, which may in principle attenuate the Ca2+ increase, have a very limited activity in these conditions. The maximal Ca2+ concentration at the ER mouth of simulated pumps does not exceed 402 μM. In conclusion, simulations of the Ca2+ fluxes in and out the PM-ER junction show that the spontaneous opening of ORAI1 channels in a conductance state that corresponds to a full ER cannot account for the non-TCR/CD3-dependent Ca2+ microdomains observed in T cells.
Junctional small-scale Ca2+ increases thus probably involve an ER-related component. RYRs are not significantly involved in the formation of non-TCR/CD3-dependent microdomains in T cells (4). We thus explored the possible involvement of IP3Rs. It is indeed well known that in resting cells, some IP3R can open in the presence of the basal IP3 concentration to release luminal Ca2+ and create short-lived blips or puffs of Ca2+ in the cytoplasm (13, 42). Thillaiappan et al. (34) have shown that Ca2+ puffs occur nearly exclusively at immobile puncta close to the PM and proposed that these IP3Rs may provide local ER depletion closest to the PM where SOCE can occur. We thus reasoned that Ca2+ microdomains in T cells may be associated with the opening of immobile IP3Rs located close to the junctions, either spontaneously or due to receptors other than TCR/CD3. Indeed, evidence for integrin evoked IP3 was obtained recently (15). In this scenario, microdomains would result in part from Ca2+ flowing through the IP3Rs located near the junction and in another part from the ORAI1-mediated Ca2+ entry that follows the local, IP3-induced decrease in ER Ca2+.
We tested this hypothesis computationally by including IP3Rs in the model, as schematized in Figure 1. In Figure 3 increasing numbers of IP3Rs are opened during 44 ms, to simulate the stochastic opening of these receptors in the presence of a basal concentration of IP3. ORAI1 channels then open according to the ER Ca2+ concentration around the closest IP3Rs. In this situation, Ca2+ microdomains with realistic amplitudes and invading the whole junction are created when 2 to 5 IP3Rs are assumed to open simultaneously (Anim. S2a). Clearly, two sources of Ca2+ contribute to this Ca2+ event: first, Ca2+ released by nearby IP3Rs can diffuse in the junction as discussed below. Second, the local depletion at the luminal extremity of the IP3R activates ORAI1 opening and Ca2+ influx from the extracellular medium. Because in the luminal region surrounding an open IP3R, ER Ca2+ drops to 330 μM, closest ORAI1 channels open half-maximally (Figure S1), generating a Ca2+ flux through ORAI1 that is more than twice the one occurring in the absence of IP3R. The combination between the Ca2+ fluxes through the IP3R and ORAI1 allow the formation of a Ca2+ microdomain in the junction that agrees with observations in T cells. Figure 6A shows that the Ca2+ concentration at the cytosolic side of the IP3R reaches ~16 μM (Anim. S3a, S4a, S5a & S6a). However, IP3Rs are not in the junction itself and the contribution of ER Ca2+ in Ca2+ microdomains is rather limited, as attested by simulations that do not consider Ca2+ entry (Figure 4). The local depletion created by the InsP3-induced Ca2+ release however plays a crucial role in allowing ORAI1 to open to a larger extent than with a full ER. As visible in Figure 3, when more than 6 IP3Rs open simultaneously, the Ca2+ increase in the domain much exceeds those observed experimentally. This is in agreement with the fact that only a fraction of IP3Rs can spontaneously open at basal IP3 concentration. Thus, non-TCR/CD3-dependent Ca2+ microdomains such as those observed in T cells can be reproduced with the model when considering both the ORAI1 channels located in the junction and the adjacent IP3Rs.
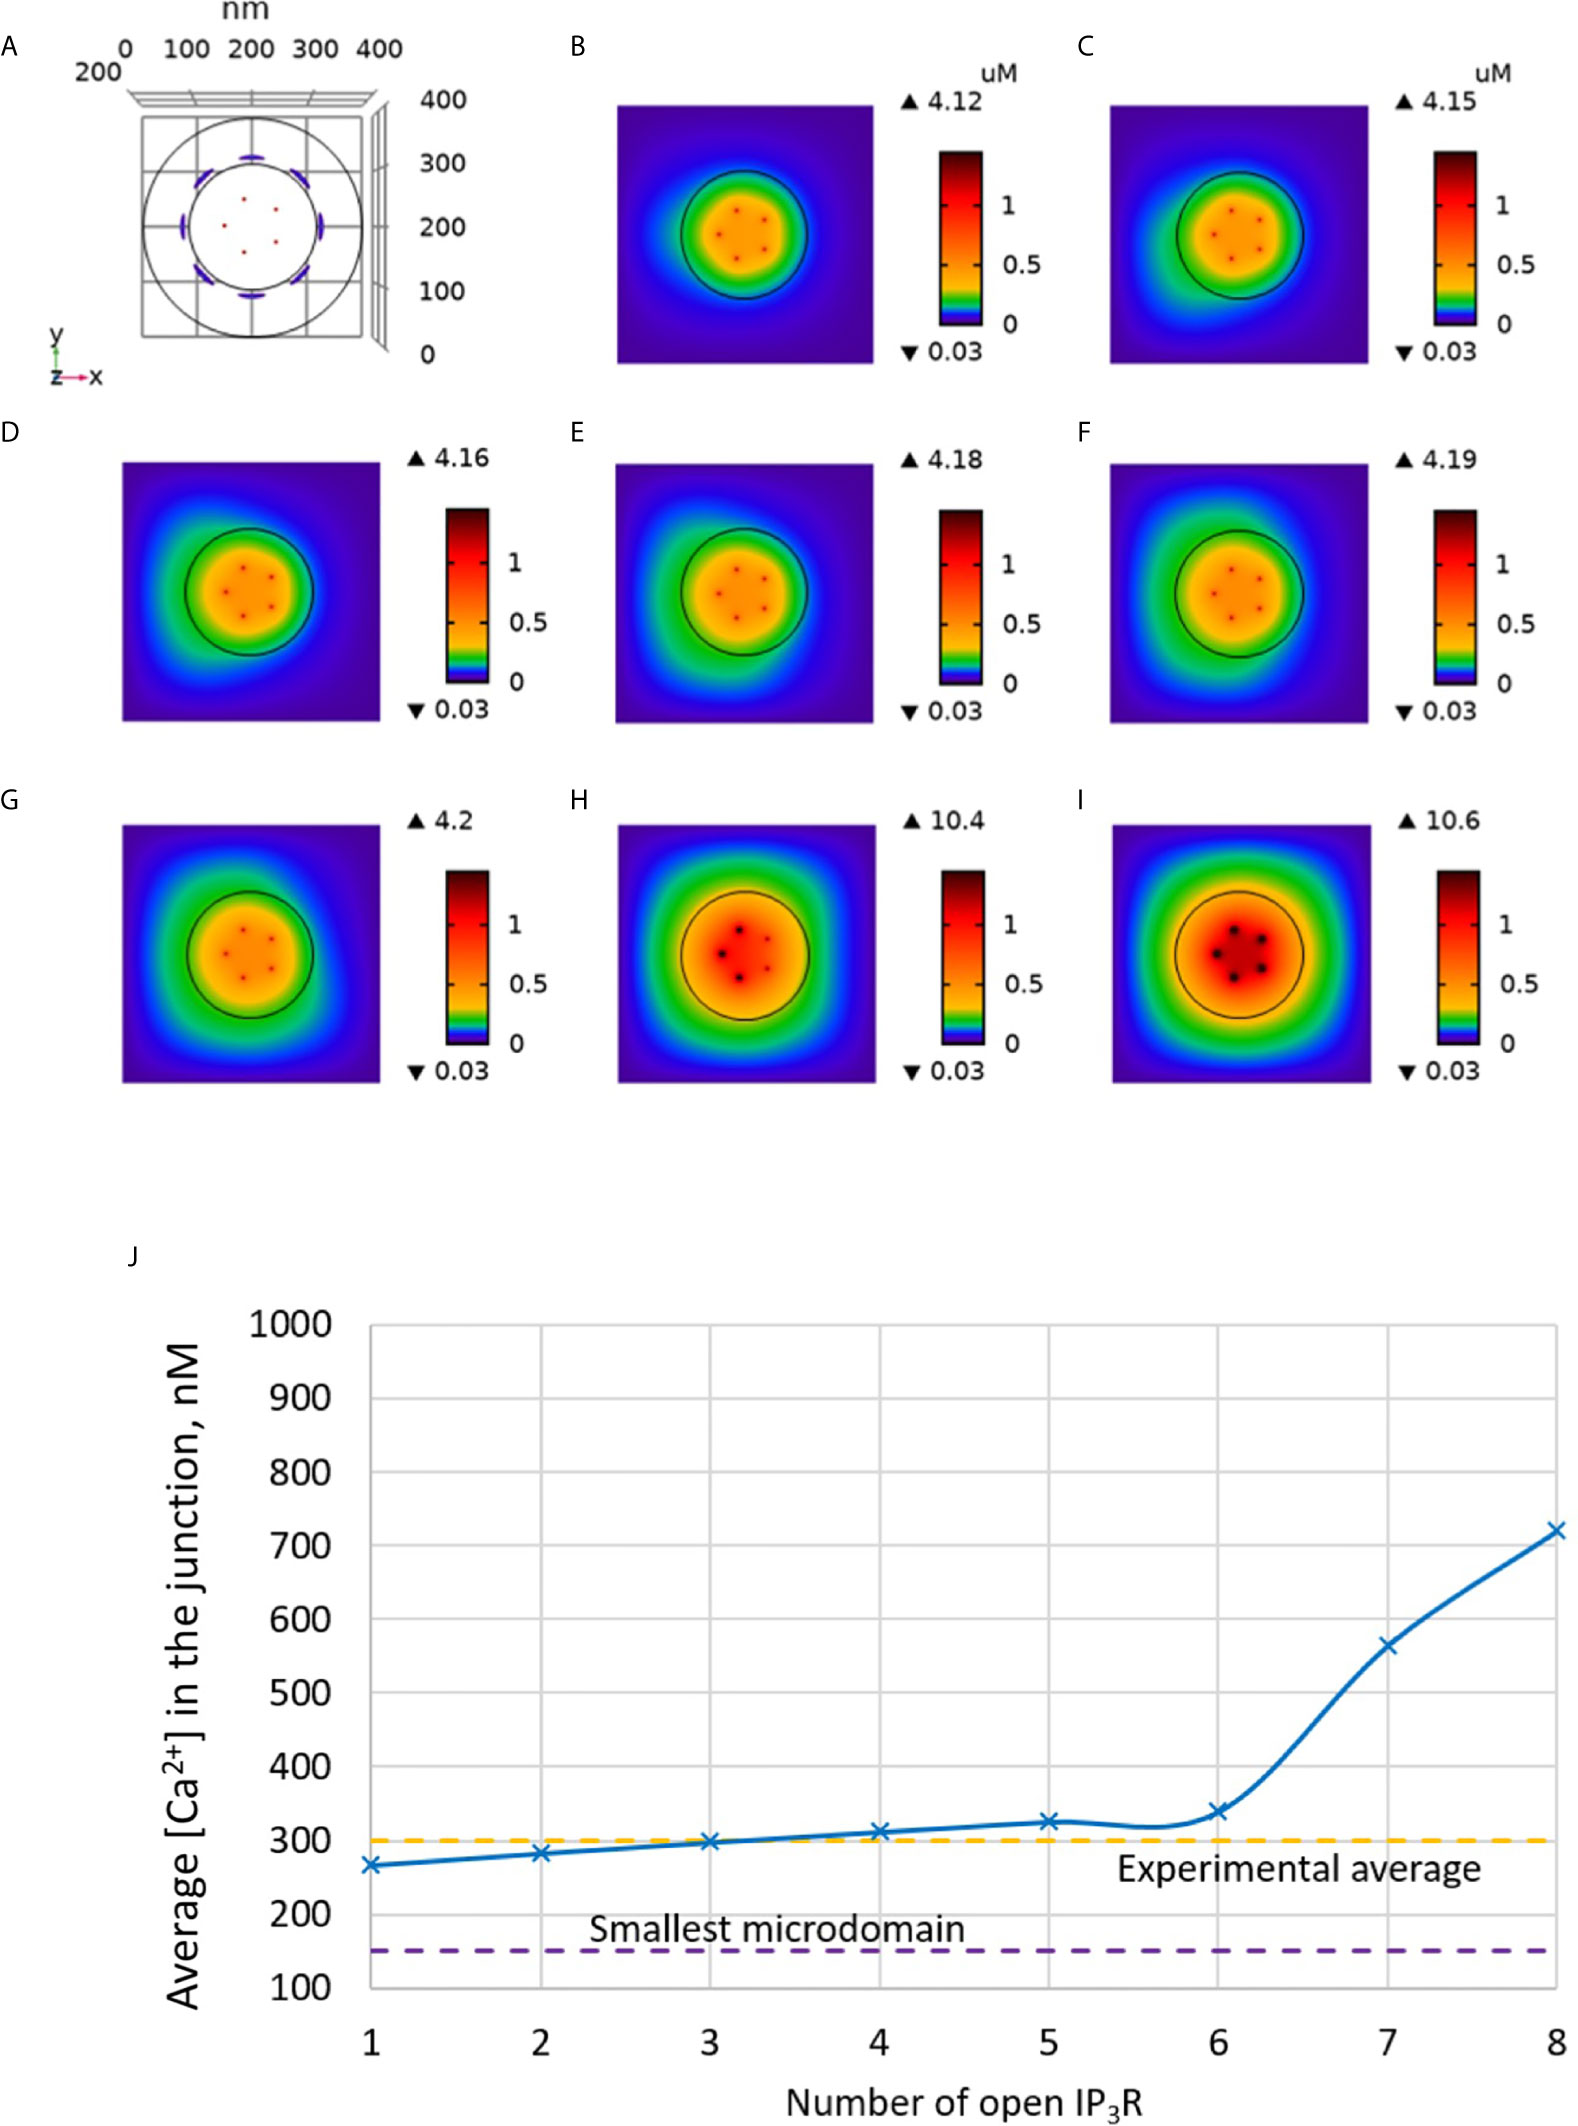
Figure 3 Simulated Ca2+ microdomains resulting from the opening of the IP3Rs adjacent to the junctions, which in turn induces the opening of ORAI1 channels in the junctions as a result of local depletion of ER Ca2+. (A) Upper view of the arrangement of the ORAI1 channels on the PM of the junction (red dots) and of the adjacent IP3Rs (blue lines) using COMSOL. (B–I) Steady-state Ca2+ profiles in the junction when opening 1 (B) to 8 (I) IP3Rs simultaneously. Left bars indicate the color codes, together with the minimal and maximal concentrations reached in the related panel. Shown are the profiles 22ms after opening of the IP3Rs. Upon depletion of local Ca2+ in the ER, which is quasi-instantaneous, ORAI1 channels open to an extent that depends on this local concentration, as defined by the function f (see Supplementary Information). ORAI1 opening is assumed to occur immediately after depletion because ORAI1-STIM2 aggregates are pre-formed (4). (J) Evolution of the amplitude of the simulated Ca2+ microdomains with the number of simultaneously open IP3Rs in the junction, showing that experimentally observed microdomains can in principle result from the opening of ORAI1 channels induced by the spontaneous opening of a few IP3Rs near the junction, in conditions of a full ER.
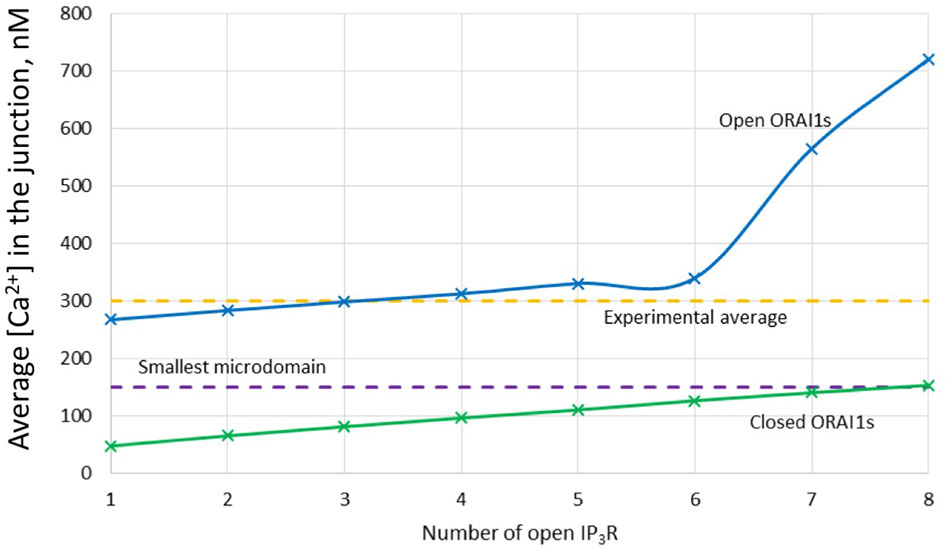
Figure 4 Evolution of the amplitude of the simulated Ca2+ microdomains with the number of simultaneously open IP3Rs in the junction in the presence and in the absence of ORAI1s in the junction. The blue curve (with ORAI1) corresponds to the situation considered in Figure 3. The theoretical situation of a junction that does not contain ORAI1 channels (green curve) allows to appreciate that the contribution of Ca2+ released through the IP3Rs to the Ca2+ microdomain is rather limited.
Much uncertainty remains as to the exact value of the diffusion coefficient of Ca2+ in the ER (21, 32, 43, 44). We thus took profit of the possibility offered by computational modelling to analyze the effect of changing the value of this key parameter. Increasing DS from 10 (43, 44) to 110 (21) has a drastic effect on the dynamics of junctional Ca2+. Such a change could be related to a decrease in the buffering capacity of the ER, or to a change in the tortuosity that characterizes this organelle. As seen in Figure 5, opening of one IP3R with a high value of DS suffices to create an extended microdomain whose amplitude exceeds the experimental average junctional amplitude. Interestingly, simulations show that in this case, ORAI1 channels never open in a more than minimal conductance state because the Ca2+ concentration in a region surrounding an open IP3R does not drop below 360 μM, which is larger than the 330 μM reached in the same volume when DS=10 μm2/s (Anim. S2b). Changes in the value of the diffusion coefficient much affects the Ca2+ profile near the mouth of the channel (Figure 6A). When the diffusion coefficient increases, Ca2+ is replenished faster. This does not only affect the state of ORAI1, but also the flux through the IP3R. The concentration difference between the luminal and cytosolic extremities of the channel is indeed larger than in the slow diffusion situation, which increases the Ca2+ flux (Figure 6B). Such effect is also visible in Figure 7 where the Ca2+ profiles in the presence of ORAI1 channels can be compared for the two values of the diffusion coefficient (Anim. S3b, S4b, S5b & S6b). Simulations thus predict that if Ca2+ diffusion inside the ER is fast (DS = 110 μm2/s), non-TCR/CD3-dependent Ca2+ microdomains could occur in the absence of extracellular Ca2+ or in T cells that do not express ORAI1, which does not agree with experimental observations (4).
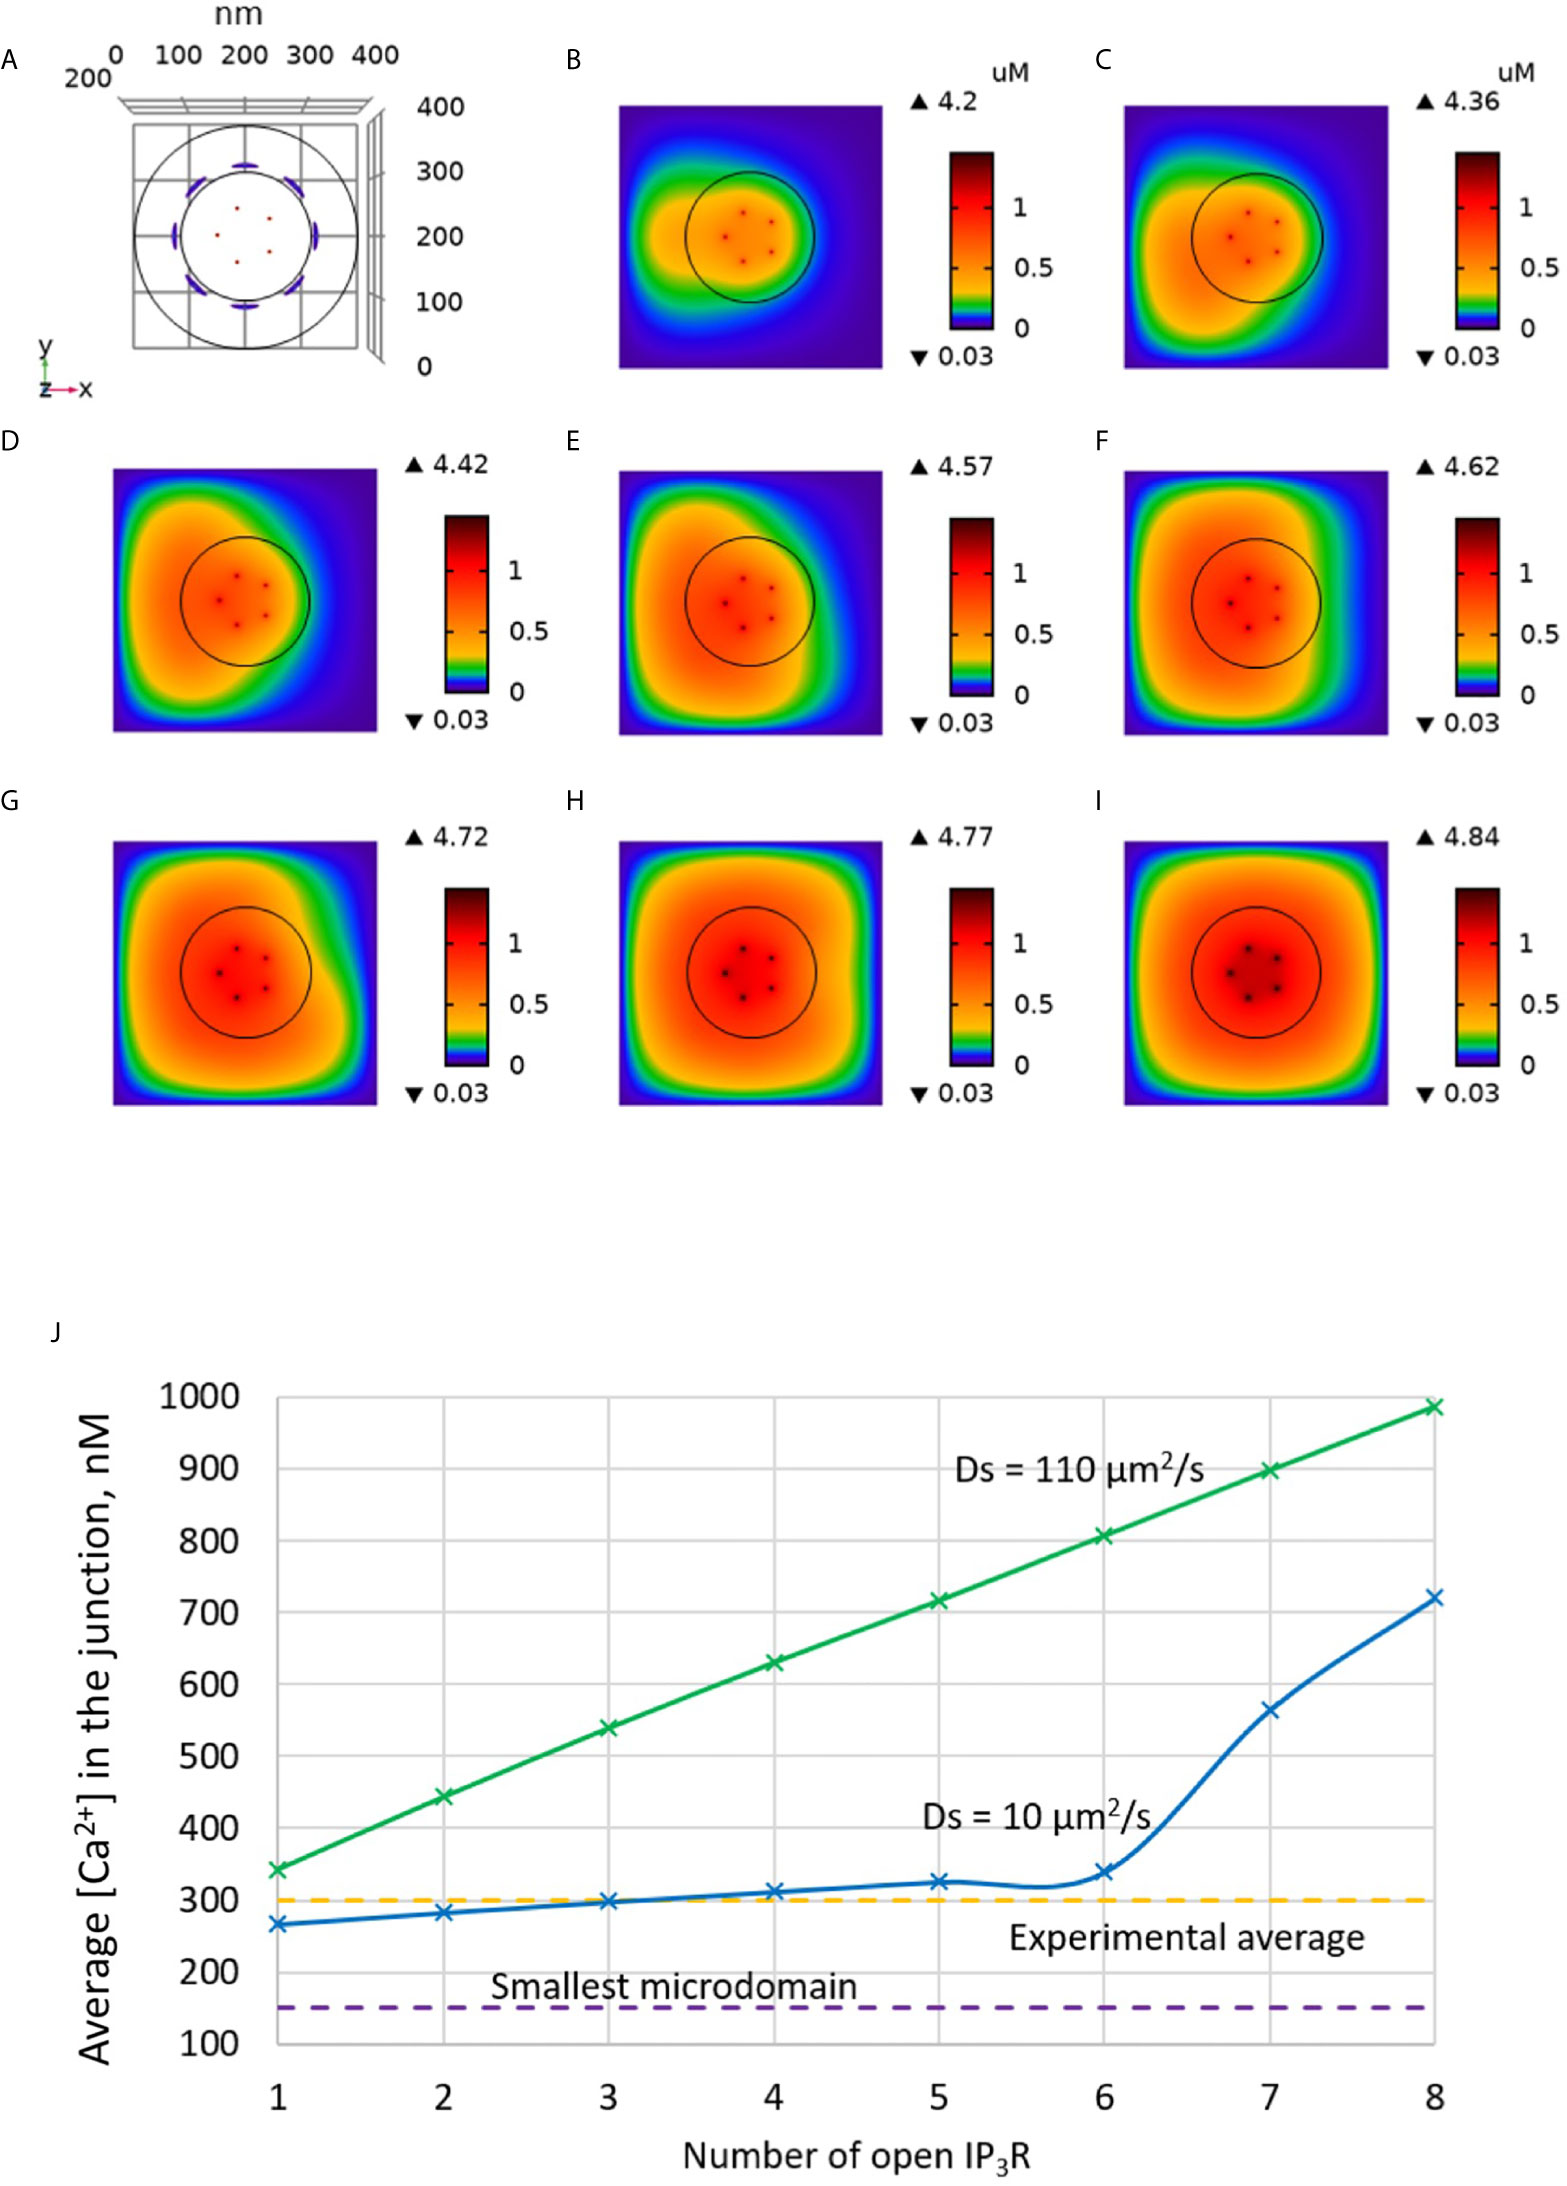
Figure 5 Influence of the value of the Ca2+ diffusion coefficient in the ER (DS) on the Ca2+ microdomains in the ER-PM junction. (A) Upper view of the arrangement of the ORAI1 channels on the PM of the junction (red dots) and of the adjacent IP3Rs (blue lines) using COMSOL. (B–I) Steady-state Ca2+ profiles in the junction when opening 1 (B) to 8 (I) IP3Rs simultaneously with DS = 110 μm2/s. Left bars indicate the color codes, together with the minimal and maximal concentrations reached in the related panels. Shown are the profiles 22ms after opening of the IP3Rs. Upon depletion of local Ca2+ in the ER, which is quasi-instantaneous, ORAI1 channels open to an extent that depends on this local concentration, as defined by the function f (see Supplementary Information). ORAI1 opening is assumed to occur immediately after depletion because ORAI1-STIM2 aggregates are pre-formed (4). (J) Evolution of the amplitude of the simulated Ca2+ microdomains with the number of simultaneously open IP3Rs in the junction. Results obtained with the default value for DS (10 μm2/s) corresponding to the results shown in Figure 3 are also indicated for comparison.
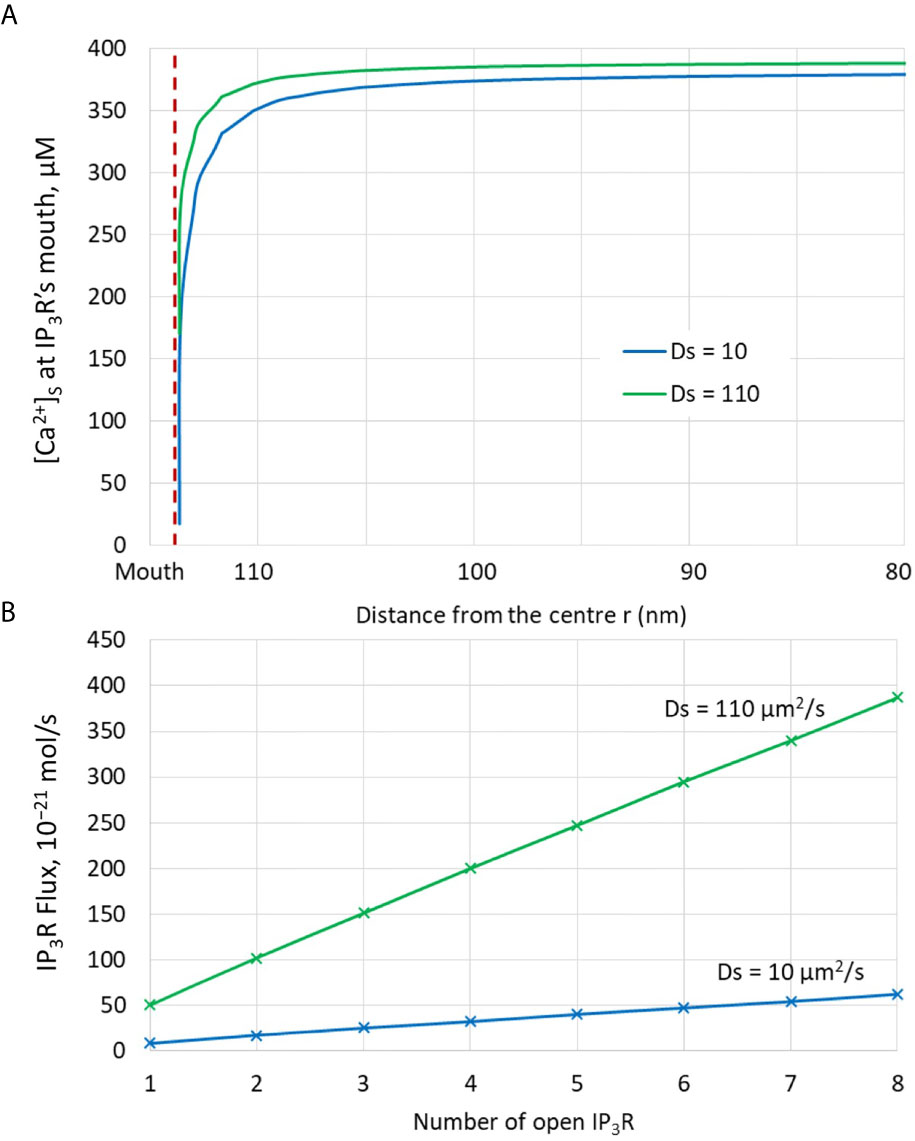
Figure 6 Analysis of the influence of the presence of IP3Rs and of the value of the Ca2+ diffusion coefficient in the ER, DS. (A) Ca2+ concentration around the luminal mouth of an IP3R for the two values of DS considered in the simulations. The largest this value, the fastest the replenishment around an open channel. (B) Fluxes through open IP3Rs for the two values of DS considered in the simulations. Because of faster replenishment around an open channel when DS is larger, the concentration gradient around the two extremities of the channel pore is larger, and hence the flux.
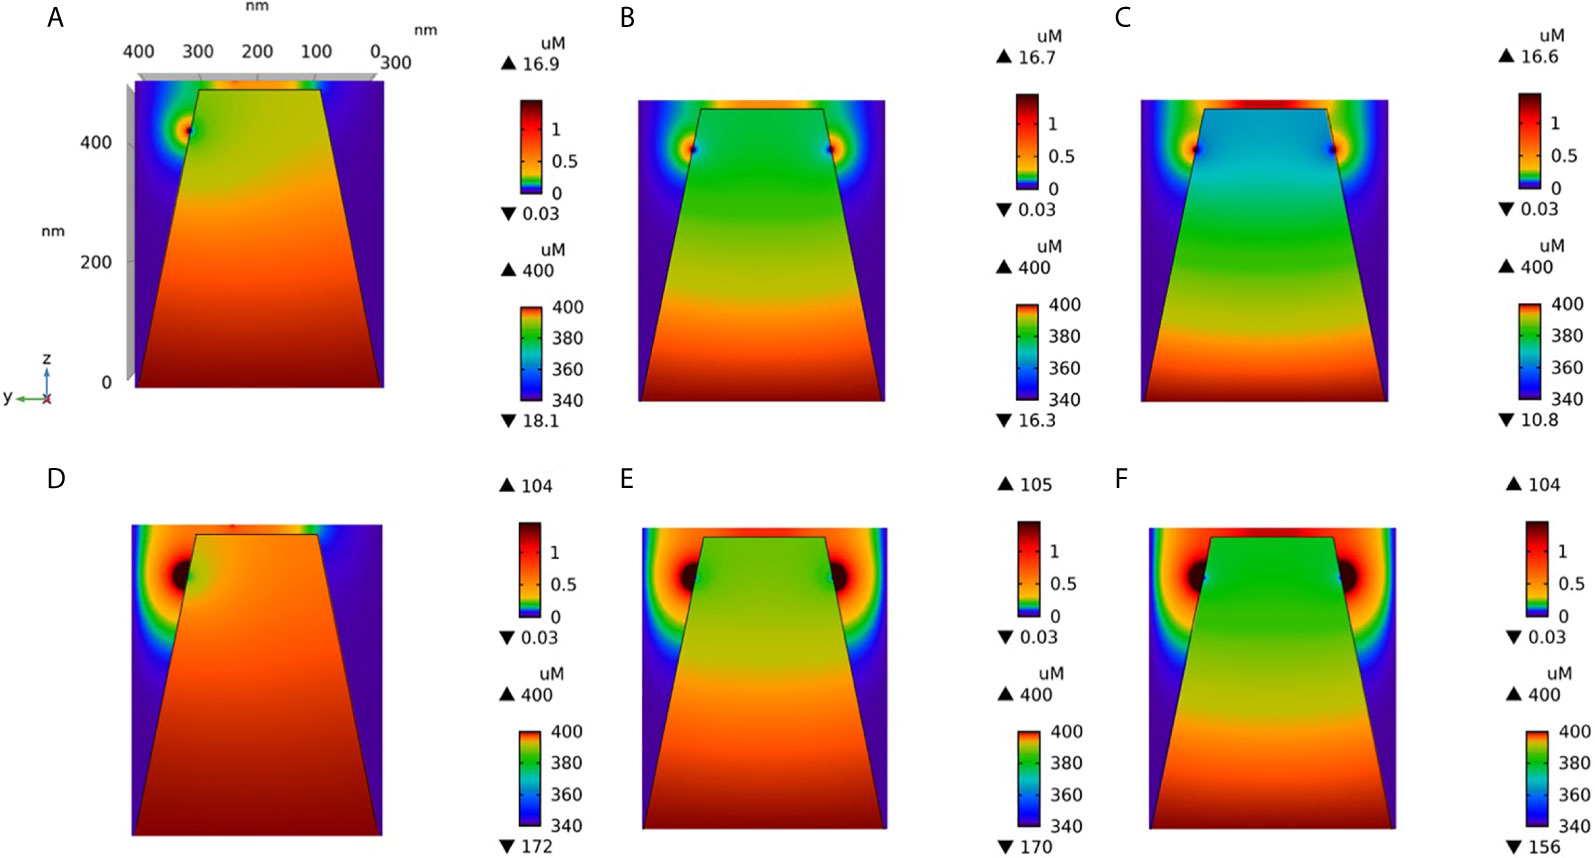
Figure 7 Cross-section of the Ca2+ profiles in the junction, in the cytosol adjacent to the junction and in the sub-PM ER during microdomain for two values of the Ca2+ diffusion coefficient in the ER, DS. (A–C): microdomains created by the opening of 2, 5 and 7 IP3Rs, respectively, for DS = 10 μm2/s. Local depletion of ER Ca2+ provokes the opening of the nearby ORAI1s. This situation corresponds to the one shown in Figure 3. (D–F): microdomains created by the opening of 2, 5 and 7 IP3Rs, respectively, for DS = 110 μm2/s. Local depletion of ER Ca2+ provokes the opening of the nearby ORAI1s. This situation corresponds to the one shown in Figure 5. For all panels, the upper right bar indicates the color code of Ca2+ concentration in the cytosol while the lower right bar indicates the color code of Ca2+ concentration in the ER.
Another factor that may have an influence on the amplitude of the Ca2+ microdomain is the distance between ORAI1 channels in the ER-PM junction. This was investigated in our simulations by decreasing the distance between ORAI1 channels from 47 to 37.7 nm. As shown in Figure 8, channel clustering has a very limited effect on the characteristics of the Ca2+ microdomains, resulting in a slight increase in the amplitude of the Ca2+ signal in the junction. This conclusion does not depend on the value of the diffusion coefficient in the ER (not shown). Actually, clustering of the ORAI1 channels could increase the amplitude of the microdomain if either Ca2+ diffusion in the junction or Ca2+ pumping was affected by the inter-channel distance. Since Ca2+ increases near ORAI1 channels always remain highly localized in both situations, diffusion is not much affected. SERCA pump activity associated with an active microdomain based on clustered or non-clustered ORAI1 channels are shown in Figure 9. Steady-state Ca2+ fluxes through SERCA pumps when IP3Rs and ORAI1 channels are open are clearly not much sensitive to the conditions, whatever the value of the Ca2+ diffusion coefficient in the ER. Interestingly, pumps are not saturated in contrast to the situation encountered with a highly depleted ER (32).
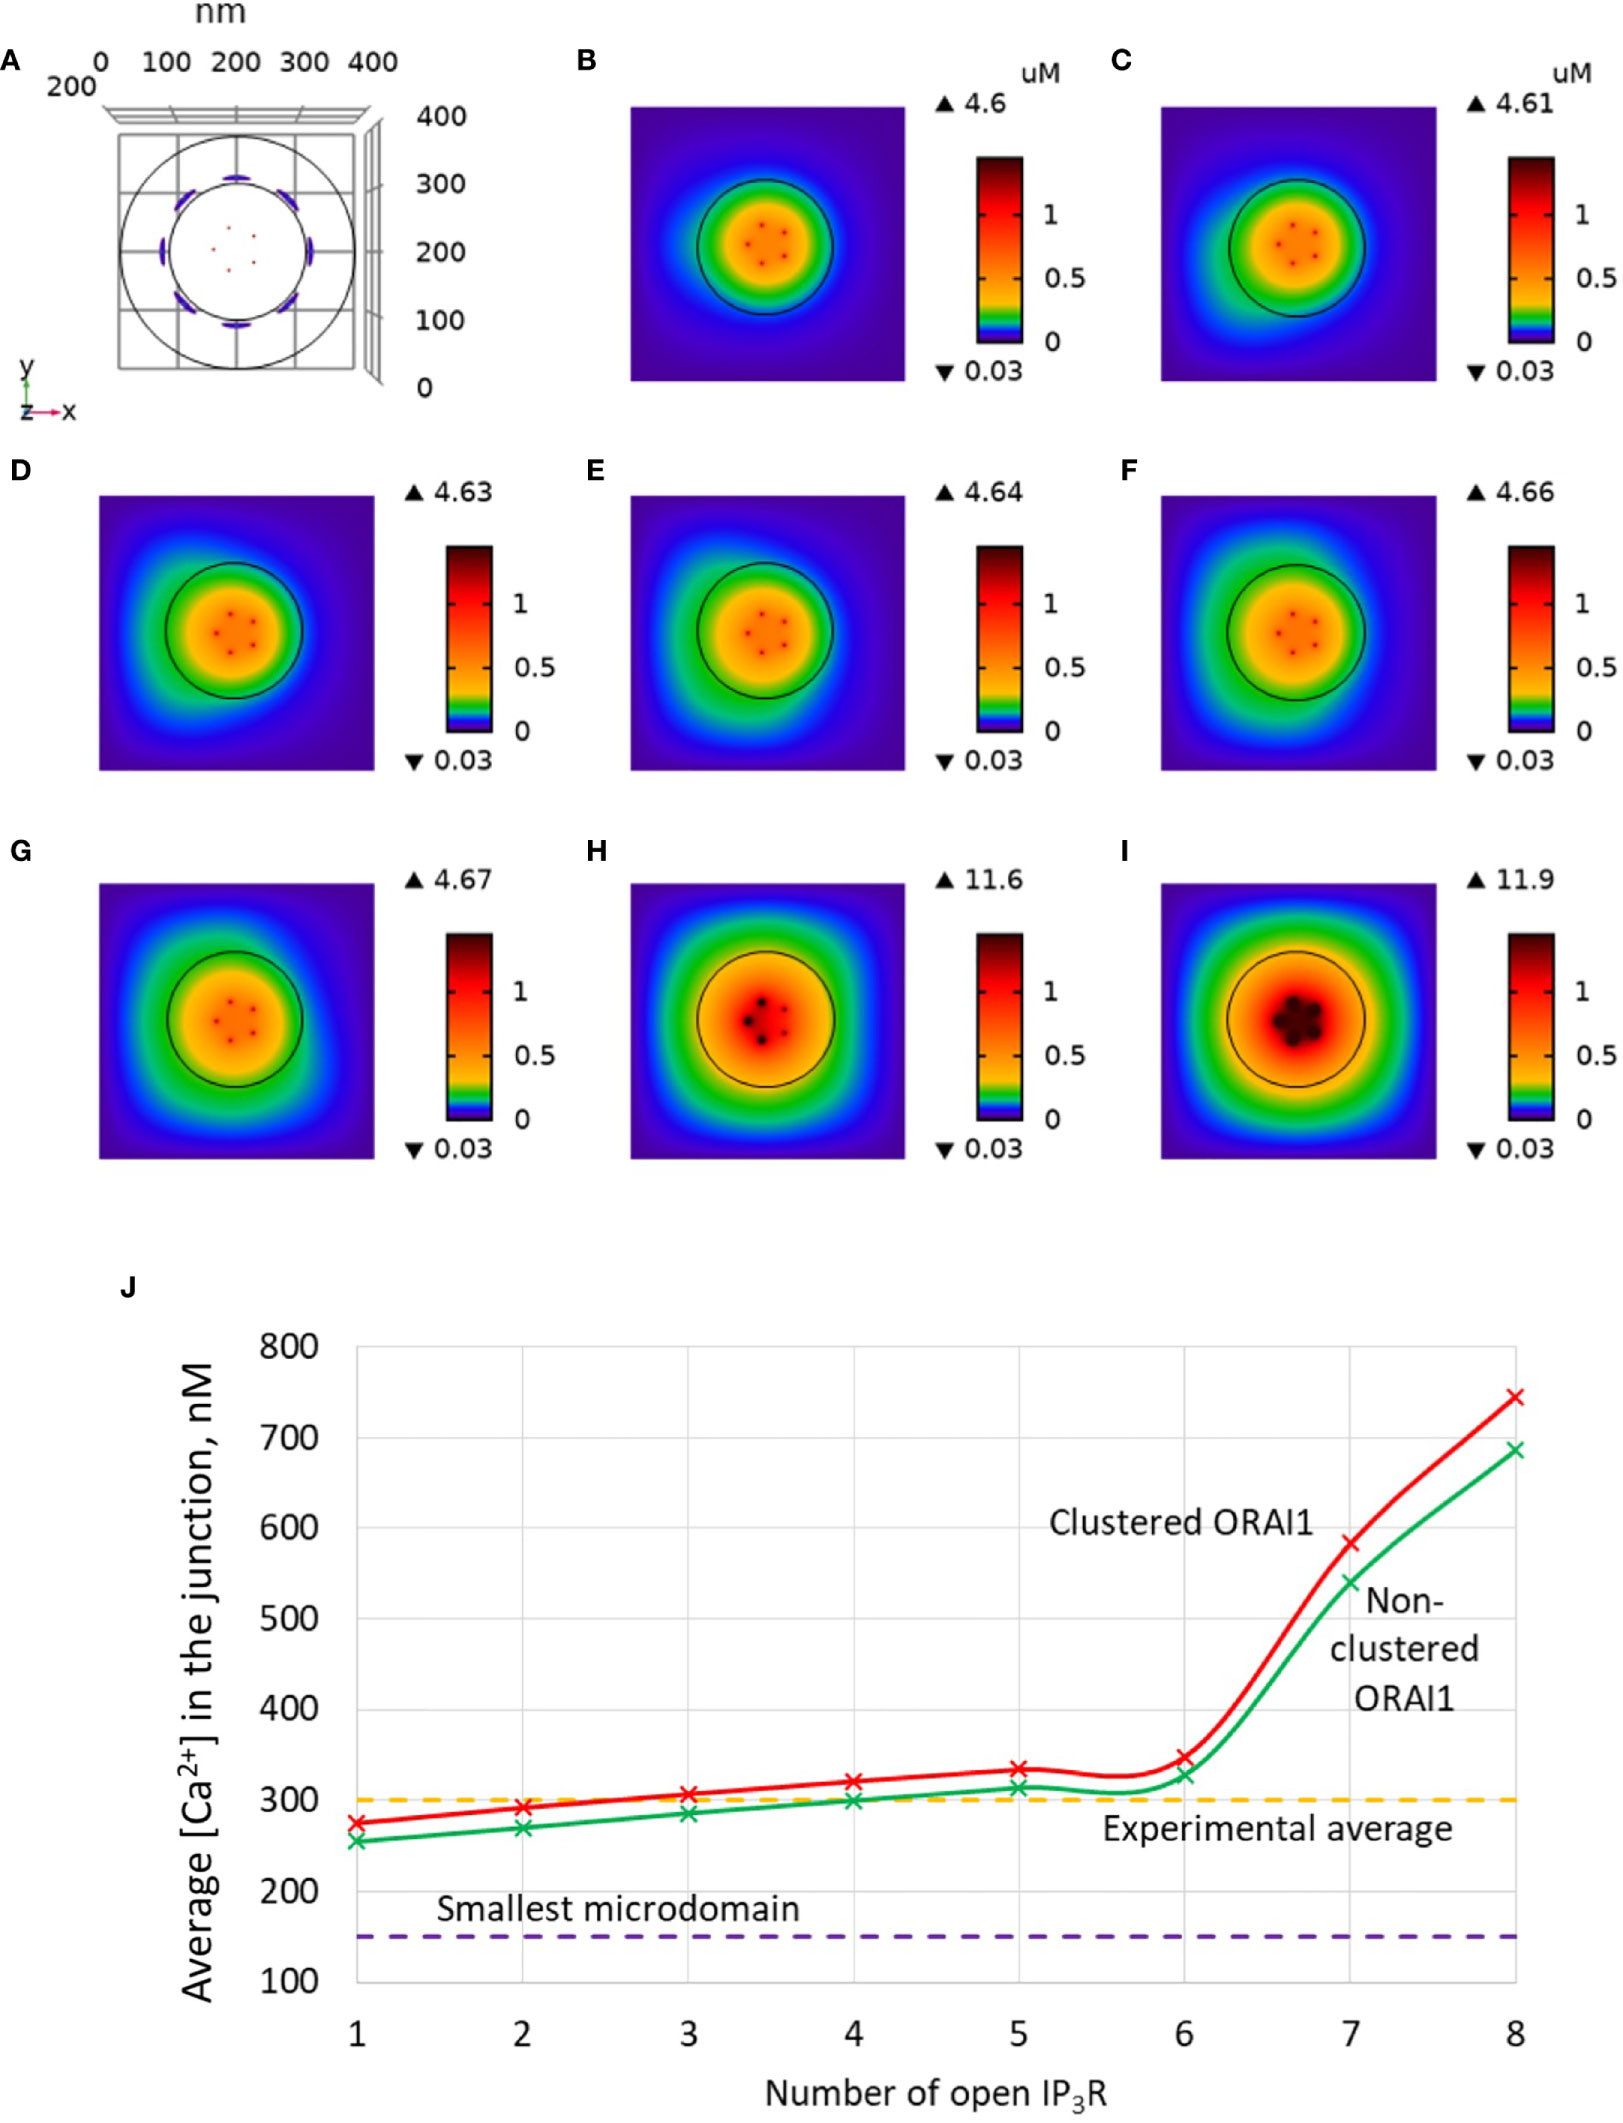
Figure 8 Influence of the distance between ORAI1 channels on the Ca2+ microdomains in the ER-PM junction. The situation is similar to the default situation shown in Figure 3, except for the distance between ORAI1 channels that is here equal to 37.7 nm (clustered) instead of 47 nm (non-clustered). (A) Upper view of the arrangement of the ORAI1 channels on the PM of the junction (red dots) and of the adjacent IP3Rs (blue lines) using COMSOL. (B–I) Steady-state Ca2+ profiles in the junction when opening 1 (B) to 8 (I) IP3Rs simultaneously. Left bars indicate the color codes, together with the minimal and maximal concentrations reached in the related panel. Shown are the profiles 22ms after opening of the IP3Rs. Upon depletion of local Ca2+ in the ER, which is quasi-instantaneous, ORAI1 channels open to an extent that depends on this local concentration, as defined by the function f (see Supplementary Information). ORAI1 opening is assumed to occur immediately after depletion because ORAI1-STIM2 aggregates are pre-formed (4). (J) Evolution of the amplitude of the simulated Ca2+ microdomains with the number of simultaneously open IP3Rs in the junction. Results obtained with the default value of the inter-ORAI1 channels distance (47 nm, non-clustered) corresponding to the results shown in Figure 3 are also indicated for comparison.
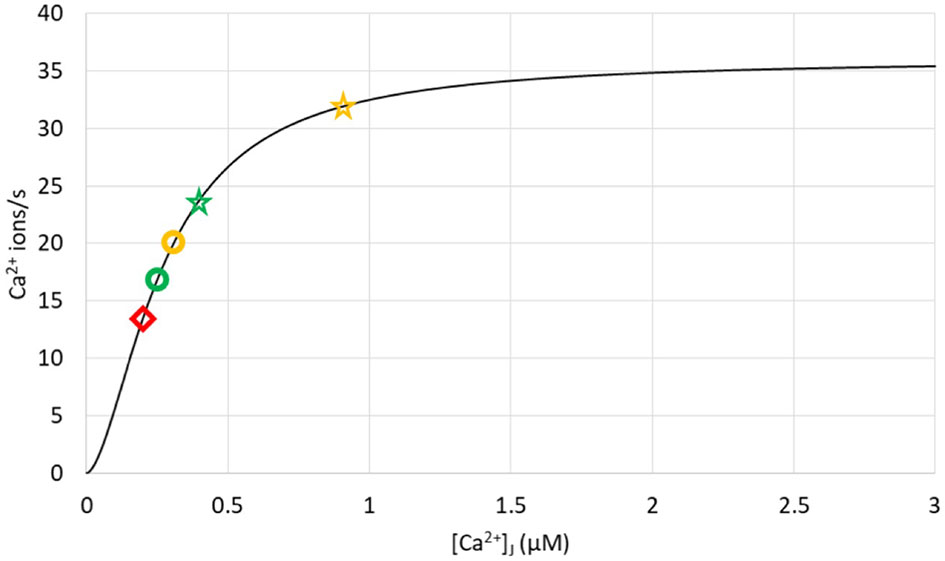
Figure 9 Ca2+ fluxes through SERCA pumps in different simulation conditions showing that pumps are not saturated during Ca2+ microdomains. The curve represents the rate of pumping as a function of cytosolic Ca2+, as given by Eq. S19, with CS = 400 μM. Yellow symbols correspond to the opening of the 4 IP3Rs nearest to the SERCA, with the circle corresponding to DS = 10 μm2/s and the star to DS = 110 μm2/s. Green symbols correspond to the opening of the 4 IP3Rs furthest from the SERCA, with the circle corresponding to DS = 10 μm2/s and the star to DS = 110 μm2/s. The red diamond refers to a situation with closed IP3Rs, 5 ORAI1 channels of the junction being open as in Figure 2.
Ca2+ signaling is fundamental for activation of T cells, where it largely relies on SOCE. Although SOCE controls physiological functions at the cellular level, it creates highly heterogeneous local Ca2+ signals. Given that Ca2+ channels, pumps and downstream signaling molecules are controlled locally, cellular Ca2+ dynamics results from the detailed regulation of SOCE in an ensemble of compartmentalized microdomains.
In the present modeling study, we have investigated Ca2+ dynamics in a confined configuration corresponding to a junctional cytosolic space and the adjacent sub-PM ER, taking into account Ca2+ influx through ORAI1 and IP3R, Ca2+ pumping into the ER through SERCA, and diffusion within the cytosolic and ER compartments. Our main aim was to gain insight into the mechanistic origin of the Ca2+ microdomains observed in non TCR/CD3 stimulated T cells that have been reported in Diercks et al. (4). These are short-lived (<50 ms), low amplitude (~300 nM) Ca2+ increases located just below the PM. Their spatial spread is most probably below the spatial resolution of the optical imaging system, i.e. 368 nm. Importantly, they do not involve Ca2+ release through RYR1, but we obtained initial evidence for a signaling pathway evoked by weak cell adhesion to β1-integrins, IP3 signaling, and ORAI activation via pre-formed complexes with STIM1 and STIM2 (15). Weak adhesion of T cells migrating to inflamed tissue occurs during leukocyte rolling in venules, during diapedesis and migration through basement membrane and interstitium. Thus, such weak adhesion processes during the T cell’s journey into the inflamed area may lift the activation status from a non-activated, quiescent cell to a pre-activated T cell. This shift in activation state would then facilitate full activation through the TCR/CD3 complex by local antigen-presenting cells.
For that purpose, we modified several aspects of the spatial model of SOCE previously proposed by McIvor et al. (32). First, we considered the situation of a full ER with CS = 400 μM, while the former study focused on a massively depleted ER, i.e. CS = 150 μM. This change affects initial and boundary conditions, but also led us to consider the sub-maximal conductance states of ORAI1 corresponding to not fully STIM-bound ORAI channels (37, 45, 46). We indeed hypothesized that a larger CS results in a reduced availability of Ca2+-unbound STIM that are susceptible to bind to and open ORAI1. This assumption agrees with the observed relationship between the SOC current and CS reported at the whole cell level (7, 10). Second, we took into account the presence of IP3Rs in regions of the ER membrane close to the junctional space, following a spatial arrangement suggested by Thillaiappan et al. (34). As a consequence, we also considered a slightly larger portion of the cell than McIvor et al. (32). From a technical point of view, we resorted to COMSOL Multiphysics, which allowed us extra flexibility and considerably reduced the computing time. This software not only allows to simulate realistic geometries but is also very well adapted to the computational study of Ca2+ dynamics in confined domains in which steep concentrations gradients arise, as for example in dendritic spines (47). Additionally, it allows to easily include, remove or spatially rearrange the model’s components (like pumps, channels or Ca2+ stores) in order to match experimental conditions, as it was done by Maccari et al. (48) to show the role of mitochondria relocation and PMCA pumps accumulation at the immunological synapse in global Ca2+ increase during T cell polarization.
Based on our simulations, we concluded that the concerted activity of IP3R and ORAI1 channels is responsible for non-TCR/CD3 dependent Ca2+ microdomains in T cells via the mechanism schematized in Figure 10, where two different states are described. In a first state (Figure 10A), nano-scale [Ca2+] fluctuations in the sub-PM ER (25) are sensed by STIM2 inherently co-localized with ORAI1 (7, 15). The latter ORAI1 channels are then activated shortly and partially (37) and form small microdomains. Although it is likely that these ORAI1-based microdomains correspond to some of the events observed in the absence of TCR/CD3 stimulation, they cannot account on their own for all the events reported since even 5 simulated ORAI1 channels simultaneously open in the junction do not increase [Ca2+] up to a level that corresponds to the experimental average [Ca2+]. In a second state (Figure 10B), following a short activation of one or a few immobile IP3Rs close to the junction (34), Ca2+ is released through IP3Rs from the sub-PM ER into the cytosol. The resulting local Ca2+ depletion close to the IP3R’s mouth provokes the unbinding of Ca2+ from STIM2, which further activates ORAI1 channels (Figure 10C) increasing Ca2+ in the junction and thus forming larger non-TCR/CD3-dependent Ca2+ signals in the microdomains. Although it is important that the IP3Rs are located close to the junction to create local depletions that can be sensed by SOC channels, simulations suggest that these receptors are not located inside the junction (34). Indeed, if this would be the case, their opening would generate an increase in junctional Ca2+ concentration that would much exceed the observed amplitude of a microdomain. Such a computational observation is expected given the respective values of the currents through ORAI1 and IP3Rs.
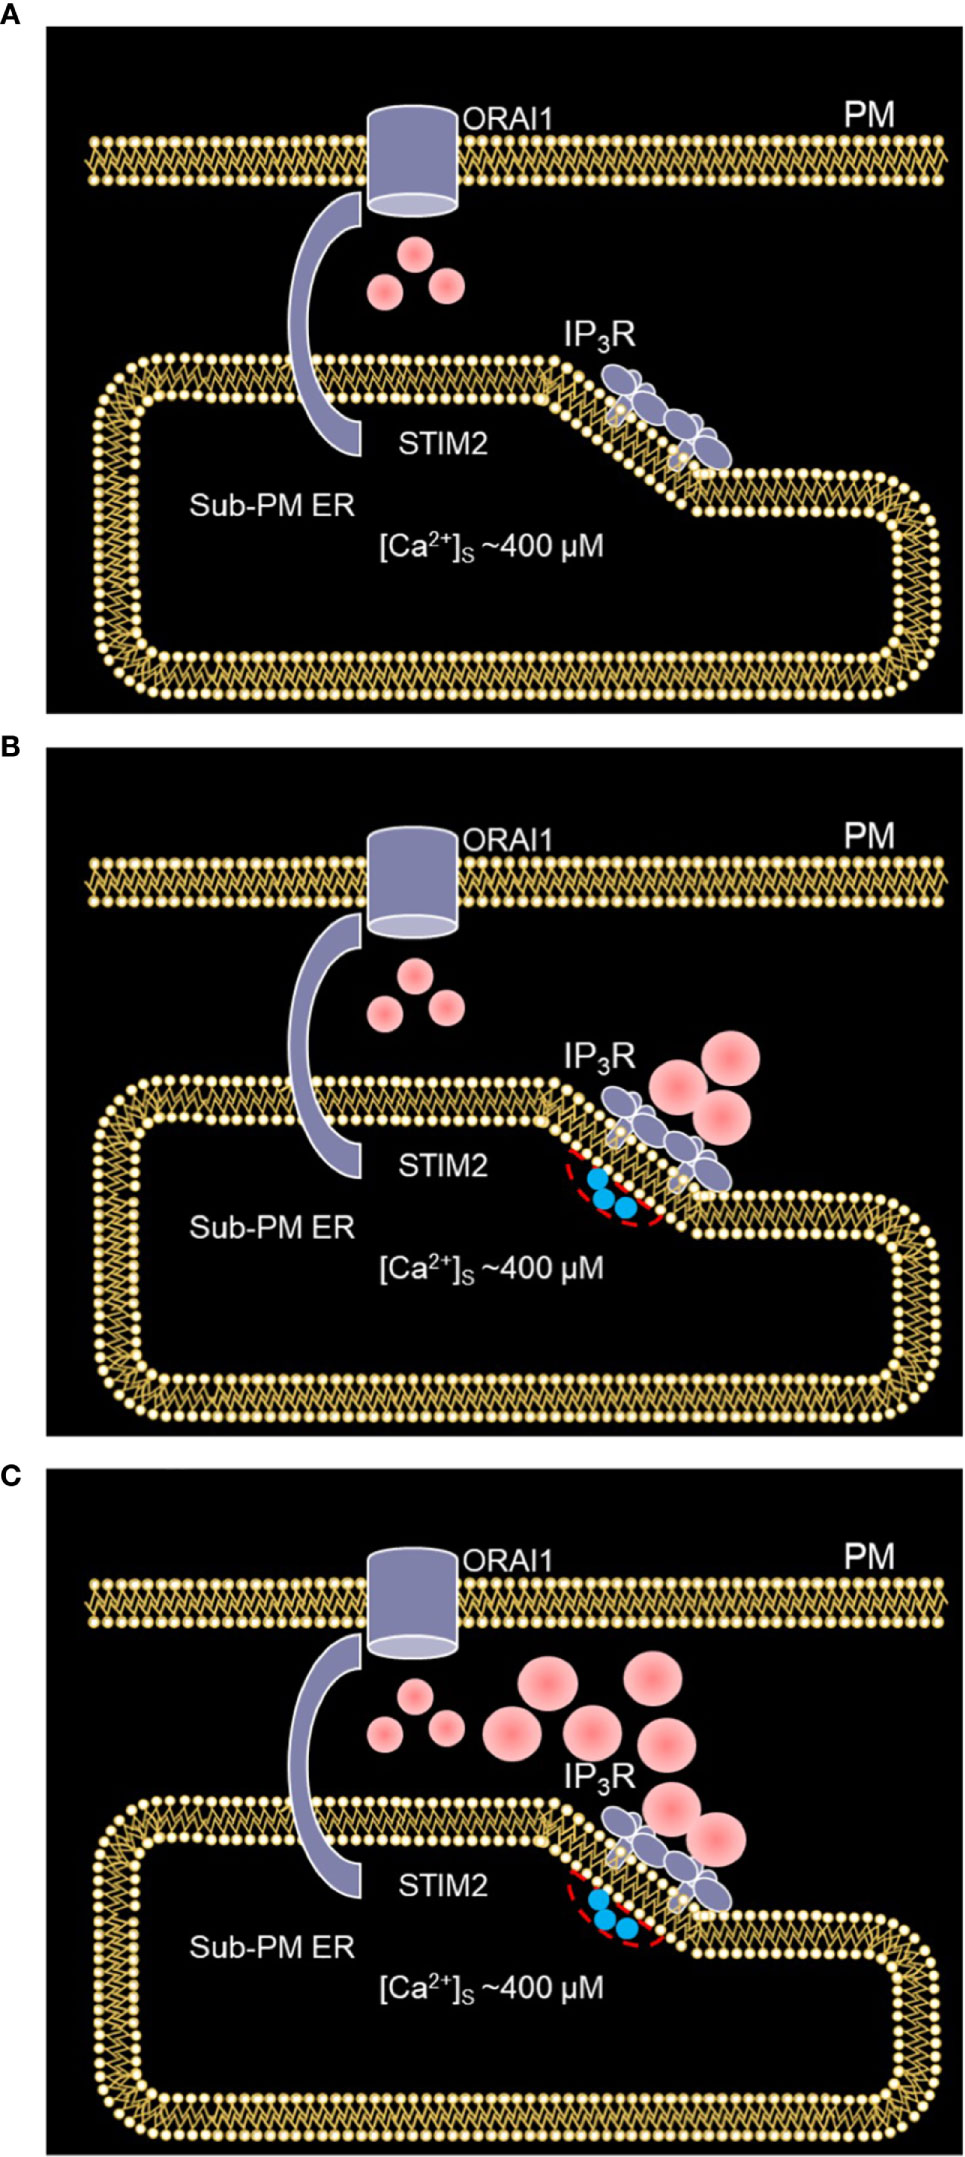
Figure 10 Schematized representation of the proposed mechanism underlying the spontaneous formation of Ca2+ microdomains in T cells. (A) The smallest microdomains arise from nano-scale [Ca2+] fluctuations in the sub-PM ER leading to the opening of ORAI1 channels STIM2 inherently co-localized with STIM2. (B) Following a short, spontaneous activation of one or a few IP3Rs close to the junction, Ca2+ is released from the sub-PM ER into the cytosol. (C) The resulting local Ca2+ depletion close to the IP3R’s mouth provokes the unbinding of Ca2+ from STIM2, which further activates ORAI1 channels. This results in larger Ca2+ signals in the microdomains. Red spots represent Ca2+ ions.
We also used the model to investigate the impact of the distance between ORAI1 channels in the junction. In agreement with the results of McIvor et al. (32), we found that ORAI1 clustering has a limited effect on the characteristics of the Ca2+ microdomain, both in the presence and in the absence of IP3Rs. Clustered ORAI1 channels lead to higher local [Ca2+], an effect that is compensated by the reduced extent of the Ca2+ increase. In contrast, the value of the Ca2+ diffusion coefficient in the ER (Ds) has a drastic effect on the Ca2+ microdomain in the junction. Agreement with observations could only be reached when considering Ds = 10 μm2/s, i.e. a value that is ~20 times smaller than the value reported for the cytoplasm. This smaller value could result from molecular crowding in the lumen (43) and from the tortuosity of the tubular network of the ER (49). The latter effect is expected to be particularly strong in the sub-PM regions of the ER adjacent to the junctions.
At this stage, the contribution of IP3Rs has been included in a simple way. It is well established that the opening of these channels is stochastic and regulated by cytosolic Ca2+ (17, 50), two factors that need to be considered in a refined version of the model. In particular, we have shown here that local depletion of CS following the opening of an IP3R favors the opening of ORAI1. However, resting STIMs negatively regulate IP3R’s activity (51). Moreover, the entry of Ca2+ through ORAI1 could further activate Ca2+ release through the IP3R. These two feed-forward loops are expected to be particularly significant when IP3 is produced, as it is the case upon the intermediate phase of TCR/CD3 stimulation, e.g. after the initial phase of NAADP/RYR1 signaling in the first 15 s (3, 4, 52).
Next, a quantitative model describing Ca2+ microdomains elicited by NAADP/RYR1 signaling, e.g. NAADP/RYR1-dependent increased number of microdomains and transition of Ca2+ microdomains into global Ca2+ signaling in the first 15 s of directed TCR/CD3 signaling, should be established. Such an extended model including a detailed description of the interplay between SOCE dynamics, NAADP signaling, RYR1s and IP3Rs should improve our detailed understanding of the first steps of T cell activation.
The original contributions presented in the study are included in the article/Supplementary Material. Further inquiries can be directed to the corresponding author.
DG, AG and GD contributed to the conceptualization and design of the study. DG, AG and GD contributed to the development and analysis of the model. DG performed all numerical simulations. All authors contributed to the article and approved the submitted version.
This work was supported by the Deutsche Forschungsgemeinschaft (DFG) (project number 335447717; SFB1328, project A01 to AG), by the Joachim-Herz-Stiftung (Hamburg), Infectophysics Consortium (project 4; to AG), by NCL-Stiftung Hamburg (to AG), the Hamburg Ministry of Science, Research and Equality (LFF- FV75/0070-134, to AG), and by University Medical Center Hamburg-Eppendorf (M3I consortium, to AG). Research in the AG labs is also supported by EU project INTEGRATA - DLV-813284. GD is Research Director at the FNRS.
The authors declare that the research was conducted in the absence of any commercial or financial relationships that could be construed as a potential conflict of interest.
The Supplementary Material for this article can be found online at: https://www.frontiersin.org/articles/10.3389/fimmu.2021.659790/full#supplementary-material
1. Trebak M, Kinet JP. Calcium Signalling in T Cells. Nat Rev Immunol (2019) 19:154–69. doi: 10.1038/s41577-018-0110-7
2. Streb H, Irvine RF, Berridge MJ, Schulz I. Release of Ca2+ From a Nonmitochondrial Intracellular Store in Pancreatic Acinar Cells by Inositol-1,4,5-Trisphosphate. Nature (1983) 306:67–9. doi: 10.1038/306067a0
3. Wolf IM, Diercks BP, Gattkowski E, Czarniak F, Kempski J, Werner R, et al. Frontrunners of T Cell Activation: Initial, Localized Ca2+ Signals Mediated by NAADP and the Type 1 Ryanodine Receptor. Sci Signaling (2015) 8:ra102. doi: 10.1126/scisignal.aab0863
4. Diercks BP, Werner R, Weidemüller P, Czarniak F, Hernandez L, Lehmann C, et al. Orai1, STIM1/2, and RYR1 Shape Subsecond Ca2+ Microdomains Upon T Cell Activation. Sci Signaling (2018) 11:eaat0358. doi: 10.1126/scisignal.aat0358
5. Putney JW. Capacitative Calcium Entry: From Concept to Molecules. Immunol Rev (2009) 231:10–22. doi: 10.1111/j.1600-065X.2009.00810.x
6. Brandman O, Liou J, Park WS, Meyer T. STIM2 is a Feedback Regulator That Stabilizes Basal Cytosolic and Endoplasmic Reticulum Ca2+ Levels. Cell (2007) 131:1327–39. doi: 10.1016/j.cell.2007.11.039
7. Subedi KP, Ong HL, Son GY, Liu X, Ambudkar IS. Stim2 Induces Activated Conformation of STIM1 to Control Orai1 Function in ER-PM Junctions. Cell Rep (2018) 23:522–34. doi: 10.1016/j.celrep.2018.03.065
8. Wu MM, Buchanan J, Luik RM, Lewis RS. Ca2+ Store Depletion Causes STIM1 to Accumulate in ER Regions Closely Associated With the Plasma Membrane. J Cell Biol (2006) 174:803–13. doi: 10.1083/jcb.200604014
9. Feske S, Wulff H, Skolnik EY. Ion Channels in Innate and Adaptive Immunity. Annu Rev Immunol (2015) 33:291–353. doi: 10.1146/annurev-immunol-032414-112212
10. Luik RM, Wang B, Prakriya M, Wu MM, Lewis RS. Oligomerization of STIM1 Couples ER Calcium Depletion to CRAC Channel Activation. Nature (2008) 454:538–42. doi: 10.1038/nature07065
11. Stathopulos PB, Li GY, Plevin MJ, Ames JB, Ikura M. Stored Ca2+ Depletion-Induced Oligomerization of Stromal Interaction Molecule 1 (STIM1) Via the EF-SAM Region: An Initiation Mechanism for Capacitive Ca2+ Entry. J Biol Chem (2006) 281:35855–62. doi: 10.1074/jbc.M608247200
12. Chatton JY, Liu H, Stucki JW. Simultaneous Measurements of Ca2+ in the Intracellular Stores and the Cytosol of Hepatocytes During Hormone-Induced Ca2+ Oscillations. FEBS Lett (1995) 368(1):165–8. doi: 10.1016/0014-5793(95)00632-J
13. Bootman MD, Lipp P, Berridge MJ. The Organisation and Functions of Local Ca2+ Signals. J Cell Sci (2001) 114:2213–22. doi: 10.1242/jcs.114.12.2213
14. Quintana A, Pasche M, Junker C, Al-Ansary D, Rieger H, Kummerow C, et al. Calcium Microdomains At the Immunological Synapse: How ORAI Channels, Mitochondria and Calcium Pumps Generate Local Calcium Signals for Efficient T-cell Activation. EMBO J (2011) 30:3895–912. doi: 10.1038/emboj.2011.289
16. Dupont G, Falcke M, Kirk V, Sneyd J. Models of Calcium Signalling. Springer (2016). doi: 10.1007/978-3-319-29647-0
17. Swillens S, Dupont G, Combettes L, Champeil P. From Calcium Blips to Calcium Puffs: Theoretical Analysis of the Requirements for Interchannel Communication. Proc Natl Acad Sci USA (1999) 96:13750–5. doi: 10.1073/pnas.96.24.13750
18. DeRemigio H, Groff JR, Smith GD. Calcium Release Site Ultrastructure and the Dynamics of Puffs and Sparks. Math Med Biol (2008) 25:65–85. doi: 10.1093/imammb/dqn004
19. Solovey G, Fraiman D, Pando B, Ponce Dawson S. Simplified Model of Cytosolic Ca2+ Dynamics in the Presence of One or Several Clusters of Ca2+-release Channels. Phys Rev E Statistical nonlinear soft matter Phys (2008) 78:041915. doi: 10.1103/PhysRevE.78.041915
20. Swaminathan D, Ullah G, Jung P. A Simple Sequential-Binding Model for Calcium Puffs. Chaos (2009) 19:037109. doi: 10.1063/1.3152227
21. Thul R, Falcke M. Release Currents of IP(3) Receptor Channel Clusters and Concentration Profiles. Biophys J (2004) 86:2660–73. doi: 10.1016/S0006-3495(04)74322-2
22. Rückl M, Rüdiger S. Calcium Waves in a Grid of Clustered Channels With Synchronous IP3 Binding and Unbinding. Eur Phys J E Soft matter (2016) 39:108. doi: 10.1140/epje/i2016-16108-4
23. Walker MA, Gurev V, Rice JJ, Greenstein JL, Winslow RL. Estimating the Probabilities of Rare Arrhythmic Events in Multiscale Computational Models of Cardiac Cells and Tissue. PloS Comput Biol (2017) 13:e1005783. doi: 10.1371/journal.pcbi.1005783
24. Cosi FG, Giese W, Neubert W, Luther S, Chamakuri N, Parlitz U, et al. Multiscale Modeling of Dyadic Structure-Function Relation in Ventricular Cardiac Myocytes. Biophys J (2019) 117:2409–19. doi: 10.1016/j.bpj.2019.09.023
25. Ong HL, Liu X, Tsaneva-Atanasova K, Singh BB, Bandyopadhyay BC, Swaim WD, et al. Relocalization of STIM1 for Activation of Store-Operated Ca2+ Entry is Determined by the Depletion of Subplasma Membrane Endoplasmic Reticulum Ca2+ Store. J Biol Chem (2007) 282:12176–85. doi: 10.1074/jbc.M609435200
26. Liu W, Tang F, Chen J. Designing Dynamical Output Feedback Controllers for Store-Operated Ca²+ Entry. Math Biosci (2010) 228:110–8. doi: 10.1016/j.mbs.2010.08.013
27. Croisier H, Tan X, Perez-Zoghbi JF, Sanderson MJ, Sneyd J, Brook BS. Activation of Store-Operated Calcium Entry in Airway Smooth Muscle Cells: Insight From a Mathematical Model. PloS One (2013) 8:e69598. doi: 10.1371/journal.pone.0069598
28. Yang PC, Jafri MS. Ca2+ Signaling in T Lymphocytes: The Interplay of the Endoplasmic Reticulum, Mitochondria, Membrane Potential, and CRAC Channels on Transcription Factor Activation. Heliyon (2020) 6:e03526. doi: 10.1016/j.heliyon.2020.e03526
29. Yoast RE, Emrich SM, Zhang X, Xin P, Johnson MT, Fike AJ, et al. The Native ORAI Channel Trio Underlies the Diversity of Ca2+ Signaling Events. Nat Commun (2020) 11:2444. doi: 10.1038/s41467-020-16232-6
30. Hogan PG. The STIM1-ORAI1 Microdomain. Cell calcium (2015) 58:357–67. doi: 10.1016/j.ceca.2015.07.001
31. Samanta K, Kar P, Mirams GR, Parekh AB. Ca2+ Channel Re-Localization to Plasma-Membrane Microdomains Strengthens Activation of Ca2+-Dependent Nuclear Gene Expression. Cell Rep (2015) 12:203–16. doi: 10.1016/j.celrep.2015.06.018
32. McIvor E, Coombes S, Thul R. Three-dimensional Spatio-Temporal Modelling of Store Operated Ca2+ Entry: Insights Into ER Refilling and the Spatial Signature of Ca2+ Signals. Cell calcium (2018) 73:11–24. doi: 10.1016/j.ceca.2018.03.006
33. Alonso MT, Manjarrés IM, García-Sancho J. Privileged Coupling Between Ca2+ Entry Through Plasma Membrane Store-Operated Ca2+ Channels and the Endoplasmic Reticulum Ca2+ Pump. Mol Cell Endocrinol (2012) 353:37–44. doi: 10.1016/j.mce.2011.08.021
34. Thillaiappan NB, Chavda AP, Tovey SC, Prole DL, Taylor CW. Ca2+ Signals Initiate At Immobile IP3 Receptors Adjacent to ER-plasma Membrane Junctions. Nat Commun (2017) 8:1505. doi: 10.1038/s41467-017-01644-8
35. Diambra L, Marchant JS. Inositol (1,4,5)-Trisphosphate Receptor Microarchitecture Shapes Ca2+ Puff Kinetics. Biophys J (2011) 100:822–31. doi: 10.1016/j.bpj.2011.01.003
36. Rüdiger S, Nagaiah CH, Warnecke G, Shuai JW. Calcium Domains Around Single and Clustered IP3 Receptors and Their Modulation by Buffers. Biophys J (2010) 99:3–12. doi: 10.1016/j.bpj.2010.02.059
37. Li Z, Liu L, Deng Y, Ji W, Du W, Xu P, et al. Graded Activation of CRAC Channel by Binding of Different Numbers of STIM1 to Orai1 Subunits. Cell Res (2011) 21:305–15. doi: 10.1038/cr.2010.131
38. Schmidt B, Alansary D, Bogeski I, Niemeyer BA, Rieger H. Reaction-diffusion Model for STIM-ORAI Interaction: The Role of ROS and Mutations. J Theor Biol (2019) 470:64–75. doi: 10.1016/j.jtbi.2019.02.010
39. Emrich S, Yoast R, Xin P, Zhang X, Pathak T, Nwokonko R. Crosstalk Between N-terminal and C-terminal Domains in Stromal Interaction Molecule 2 (STIM2) Determines Enhanced STIM2 Sensitivity. J Biol Chem (2019) 294:6318–32. doi: 10.1074/jbc.RA118.006801
40. Mazel T, Raymond R, Raymond-Stintz M, Jett S, Wilson B. Stochastic Modelling of Calcium in 3D Geometry. Biophys J (2009) 96:1691–706. doi: 10.1016/j.bpj.2008.10.066
41. Means S, Smith AJ, Shepherd J, Shadid J, Fowler J, Wojcikiewicz RJ, et al. Reaction Diffusion Modeling of Calcium Dynamics With Realistic ER Geometry. Biophys J (2006) 91:537–57. doi: 10.1529/biophysj.105.075036
42. Lock JT, Smith IF, Parker I. Spatial-temporal Patterning of Ca2+ Signals by the Subcellular Distribution of IP3 and IP3 Receptors. Semin Cell Dev Biol (2019) 94:3–10. doi: 10.1016/j.semcdb.2019.01.012
43. Dayel MJ, Hom EF, Verkman AS. Diffusion of Green Fluorescent Protein in the Aqueous-Phase Lumen of Endoplasmic Reticulum. Biophys J (1999) 76:2843–51. doi: 10.1016/S0006-3495(99)77438-2
44. Swietach P, Spitzer KW, Vaughan-Jones RD. Ca2+-mobility in the Sarcoplasmic Reticulum of Ventricular Myocytes is Low. Biophys J (2008) 95:1412–27. doi: 10.1529/biophysj.108.130385
45. Hoover P, Lewis R. Stoechiometric Requirements for Trapping and Gating of Ca2+ Release-Activated Ca2+ (CRAC) Channels by Stromal Interaction Molecule 1 (STIM1) Proc. Natl Acad Sci USA (2011) 108:13299–304. doi: 10.1073/pnas.1101664108
46. Dynes J, Amcheslavsky A, Cahalan M. Genetically Targeted Single-Channel Optical Recording Reveals Multiple Orai1 Gating States and Oscillations in Calcium Influx. Proc Natl Acad Sci USA (2016) 113:440–5. doi: 10.1073/pnas.1523410113
47. Cugno A, Bartol TM, Sejnowski TJ, Iyengar R, Rangamani P. Geometric Principles of Second Messenger Dynamics in Dendritic Spines. Sci Rep (2019) 9:11676. doi: 10.1038/s41598-019-48028-0
48. Maccari I, Zhao R, Peglow M, Schwarz K, Hornak I, Pasche M, et al. Cytoskeleton Rotation Relocates Mitochondria to the Immunological Synapse and Increases Calcium Signals. Cell calcium (2016) 60:309–21. doi: 10.1016/j.ceca.2016.06.007
49. Ölveczky B, Verkman A. Monte Carlo Analysis of Obstructed Diffusion in Three Dimensions: Application to Molecular Diffusion in Organelles. Biophys J (1998) 74:2722–30. doi: 10.1016/S0006-3495(98)77978-0
50. Thul R, Thurley K, Falcke M. Toward a Predictive Model of Ca2+ Puffs. Chaos (2009) 19:037108. doi: 10.1063/1.3183809
51. Emrich S, Yoast R, Xin P, Arige V, Wagner L, Hempel N, et al. Omnitemporal Choreographies of All Five STIM/Orai and IP3Rs Underlie the Complexity of Mammalian Ca2+ Signaling. Cell Rep (2021) 34:108760. doi: 10.1016/j.celrep.2021.108760
Keywords: non-TCR/CD3-dependent microdomains, Calcium Signaling, T-cells, COMSOL, computational model, Store operated calcium entry (SOCE)
Citation: Gil D, Guse AH and Dupont G (2021) Three-Dimensional Model of Sub-Plasmalemmal Ca2+ Microdomains Evoked by the Interplay Between ORAI1 and InsP3 Receptors. Front. Immunol. 12:659790. doi: 10.3389/fimmu.2021.659790
Received: 28 January 2021; Accepted: 06 April 2021;
Published: 28 April 2021.
Edited by:
Khaled Machaca, Weill Cornell Medicine-Qatar, QatarReviewed by:
Alexei Tepikin, University of Liverpool, United KingdomCopyright © 2021 Gil, Guse and Dupont. This is an open-access article distributed under the terms of the Creative Commons Attribution License (CC BY). The use, distribution or reproduction in other forums is permitted, provided the original author(s) and the copyright owner(s) are credited and that the original publication in this journal is cited, in accordance with accepted academic practice. No use, distribution or reproduction is permitted which does not comply with these terms.
*Correspondence: Geneviève Dupont, Z2R1cG9udEB1bGIuYWMuYmU=
Disclaimer: All claims expressed in this article are solely those of the authors and do not necessarily represent those of their affiliated organizations, or those of the publisher, the editors and the reviewers. Any product that may be evaluated in this article or claim that may be made by its manufacturer is not guaranteed or endorsed by the publisher.
Research integrity at Frontiers

Learn more about the work of our research integrity team to safeguard the quality of each article we publish.