 Tingting Zhu1,2,3†Qun Su4†Cuili Wang1,2,3Lingling Shen1,2,3Hongjun Chen1,2,3Shi Feng1,2,3Xiaofeng Peng1,2,3Siyu Chen1,2,3Yucheng Wang1,2,3
 Hong Jiang1,2,3*
 Jianghua Chen1,2,3*
- 1Kidney Disease Center, The First Affiliated Hospital, College of Medicine, Zhejiang University, Hangzhou, China
- 2Key Laboratory of Nephropathy, Hangzhou, China
- 3Institute of Nephropathy, Zhejiang University, Hangzhou, China
- 4Critical Care Medicine Department, The First Affiliated Hospital, College of Medicine, Zhejiang University, Hangzhou, China
Sepsis is a heterogeneous syndrome induced by infection and results in high mortality. Even though more than 100 biomarkers for sepsis prognosis were evaluated, prediction of patient outcomes in sepsis continues to be driven by clinical signs because of unsatisfactory specificity and sensitivity of these biomarkers. This study aimed to elucidate the key candidate genes involved in sepsis response and explore their downstream effects based on weighted gene co-expression network analysis (WGCNA). The dataset GSE63042 with sepsis outcome information was obtained from the Gene Expression Omnibus (GEO) database and then consensus WGCNA was conducted. We identified the hub gene SDF4 (stromal cell derived factor 4) from the M6 module, which was significantly associated with mortality. Subsequently, two datasets (GSE54514 and E-MTAB-4421) and cohort validation (n=89) were performed. Logistic regression analysis was used to build a prediction model and the combined score resulting in a satisfactory prognosis value (area under the ROC curve=0.908). The model was subsequently tested by another sepsis cohort (n=70, ROC= 0.925). We next demonstrated that endoplasmic reticulum (ER) stress tended to be more severe in patients PBMCs with negative outcomes compared to those with positive outcomes and SDF4 was related to this phenomenon. In addition, our results indicated that adenovirus-mediated Sdf4 overexpression attenuated ER stress in cecal ligation and puncture (CLP) mice lung. In summary, our study indicates that incorporation of SDF4 can improve clinical parameters predictive value for the prognosis of sepsis, and decreased expression levels of SDF4 contributes to excessive ER stress, which is associated with worsened outcomes, whereas overexpression of SDF4 attenuated such activation.
Background
Sepsis, a syndrome of physiologic, pathologic, and biochemical abnormalities induced by infection, is a major cause of mortality among critical ICU patients (1). The annual incidence rate of sepsis ranges from 437 to 1031 per 100000 person-years, while its hospital mortality rate remains at a high level of over 25% even with modern surveillance and monitoring, prompt initiation of therapy, and advances in the support of failing organs (2–5). In addition to rapid diagnosis, one of the clinical dilemmas that we faced is that once a sepsis diagnosis is made and appropriate treatment is taken, it is often difficult to distinguish between a positive and a negative prognosis. In the past thirty years, more than 100 markers have been evaluated for sepsis prognosis, including cytokine/chemokine biomarkers, cell and receptor biomarkers, coagulation biomarkers, vascular endothelial damage biomarkers, vasodilation biomarkers, organ dysfunction biomarkers, and acute-phase protein biomarkers (6, 7). Nevertheless, the prediction of patient outcomes in sepsis continues to be driven by clinical signs because of the unsatisfactory specificity and sensitivity of these currently available biomarkers. Therefore, it is vital to research novel biomarkers for a better prediction of sepsis progression to improve the prognosis of sepsis patients.
In recent years, analysis of differentially expressed genes (DEGs) detected by high-throughput sequencing, followed by enrichment analyses to established functional pathways were performed in several studies to improve prognostic accuracy and establish the underlying molecular processes (8–10). However, host responses during sepsis are highly heterogeneous, which involve multidimensional networks of molecules and cells. Therefore, the sensitivity of individual genes might be low while network analysis might be more informative, especially when the set of available expression data is large (11, 12). Weighted correlation network analysis (WGCNA) is a systems biology approach for describing the correlation patterns among genes across microarray samples (13). It is widely applied to various biological contexts, such as tumor (14–16), metabolic disease (17), neurological disorders (18), and autoimmune disease (19, 20). WGCNA has also been used to analyze correlation patterns in sepsis. These research efforts focused on inflammatory cells in vitro (21), long non-coding RNA (22), transcription factors and miRNA (23) based on samples with or without sepsis, but did not distinguish between patients with positive outcomes from those with negative outcomes. A recent study identified two transcription factors, CEBPB and ETV6, associated with mortality outcome via WGCNA (24).
In the present study, we performed a WGCNA analysis to identify co-expression modules relating to the outcome of sepsis. KEGG enrichment analysis was performed on the interested modules and a hub gene was identified. We validated the hub gene in ICU patients in our hospital and conducted a logistic regression analysis to build a prediction module. Downstream effects of the hub gene were then explored, which might provide potential targets for sepsis treatment in the future.
Materials and Methods
RNA Sequencing Data and Data Pre-Processing
The publicly available gene expression profile GSE63042 was downloaded from the Gene Expression Omnibus (GEO) database (https://www.ncbi.nlm.nih.gov/geo/). The dataset contained 129 peripheral blood RNA samples, including 23 with systemic inflammatory response syndrome (SIRS) and 106 with sepsis. Furthermore, the sepsis patients could be further categorized into non-survivors and survivors at 28 days. Details of samples preparation and RNA sequencing method were elaborated in the previous study (25). 28 sepsis non-survivors and 78 sepsis survivors were used for the follow-up WGCNA analysis after filtering low-expression gene (mean RPM of all samples less than 0.5) and removing duplicate genes randomly.
Construction of the Gene Co-Expression Network and Module Detection via WGCNA
WGCNA was used to assess the weighted gene co-expression network and its module membership under the R platform (13). First, we selected the soft threshold (β) for network construction in the WGCNA algorithm. The soft threshold makes the adjacency matrix to be a continuous value between 0 and 1 so that the constructed network conforms to the power-law distribution and is closer to the real biological network state. Then, a topological overlap matrix (TOM) similarity function was used to convert the matrix to a TOM. Co-expression genes were assigned to modules via dynamic minimum tree-cutting arithmetic.
Identification of Trait-Related Modules
Similar modules were merged into one and then 11 total modules were obtained. The module eigengenes (ME), which represented the expression level for each module, were calculated. Then, the correlation between ME and clinical traits in each module was calculated, and a P-value < 0.05 was considered to be statistically significant for determining trait-related modules. There were two parameters to further access the relationship between module and trait. Gene Significance (GS) represented the correlation between individual genes and traits and Module Membership (MM) calculated the association between individual genes and the MEs of the module.
Differentially-Expressed Genes (DEGs) in Trait-Related Modules and the Identification of a Hub Gene
DEGs analysis between sepsis survivors and sepsis non-survivors was performed by authors of GSE63042. There are 1,238 genes differentially expressed (1,099 annotated) between sepsis survivors and sepsis non-survivors (25). Then, the M6 module, which included the majority of DEGs, was imported into Cytoscape with their weighted correlations. We identified hub gene with the following criteria:1) DEGs; 2) GS > 0.2, MM > 0.8; 3) highest 20 Maximal Clique Centrality(MCC)value calculated by the Cytohubba package in Cytoscape (26).
KEGG Analysis
DAVID, an online bioinformatics tool, is designed to predict a large number of gene function (27). Kyoto Encyclopedia of Genes and Genomes (KEGG) pathways were used to represent the detailed information of the biological functions of genes in known signaling or metabolic pathways. Therefore, we used DAVID to visualize the gene enrichment of pathways (P < 0.05).
Dataset Validation
In order to verify the expression of hub genes with larger sample size, two datasets (GSE54514 and E-MTAB-4421) (28, 29) with sepsis prognosis information were downloaded from GEO and ArrayExpress (https://www.ebi.ac.uk/arrayexpress/), respectively. In GSE54514, we only selected the samples collected within the initial 24 h of admission to the ICU to be consistent with the GSE63042 and E-MTAB-4421. The sepsis criteria were consistent in three datasets. Then, the expression of the hub gene was compared between sepsis survivors and non-survivors.
Patients and Blood Sample Collection
Studies involving human participants were reviewed and approved by the Research Ethics Committee of the First Affiliated Hospital, College of Medicine, Zhejiang University. The patients/participants (or their next of kin) provided written informed consent to participate in this study. Patients over 18 years of age diagnosed with sepsis in the intensive care unit (ICU) were included in the study. These patients had been hospitalized at the First Affiliated Hospital, College of Medicine, Zhejiang University between 1 March 2020 and 30 May 2021. Sepsis was defined according to The Third International Consensus Definitions for Sepsis and Septic Shock (Sepsis-3) [1]. Detailed information of the selected patients was further reviewed by a clinician. Blood samples were obtained within the first 24 h following admission. Peripheral blood mononuclear cells (PBMCs) separation was performed within 3 h following collection. Patients status was monitored up to 28 days after the initial blood draw.
RNA Extraction, cDNA Synthesis, and Real-time Quantitative PCR
PBMCs RNA was isolated via TRIzol® reagent (Invitrogen, CA, USA). PrimeScript™ II Reverse Transcriptase (Takara, Shiga, Japan) was used to reverse transcribe 1000 ng of RNA to cDNA for each sample. Before qPCR, we diluted first-strand cDNA synthesis products 1:4 for each sample. A two-step PCR reaction was performed as follows: pre-denaturation, 95°C for 30 seconds; PCR reaction, denaturation at 95°C for 5 s, annealing at 60°C for 31 s for 40 cycles; dissociation at 95°C for 15 s, 60°C for 1 min, and 95°C for 15 s. The relative mRNA expression of target genes was normalized to GAPDH in the same sample. Results were expressed as fold change in expression, and values were calculated as the ratio of target gene expression to control gene expression. Gene-specific primers were designed via Primer-Blast (Supplementary Table 1). The efficiency of the primers was estimated by Ct< 30 and no multiple Tm peaks. Real time-PCR reactions were carried out using SYBR Green reagent and the CFX96™ Real-Time PCR Detection System (Bio-rad, CA, USA).
Transmission Electron Microscopy
PBMCs were fixed in 2.5% (w/v) glutaraldehyde overnight, washed with PBS three times, stained with 1% osmium tetroxide, and then counterstained with 2% (w/v) uranyl acetate. After dehydration in a gradient series of ethanol (50% for 15min, 70% for 15min, 90% for 15min, and 100% for 20min) and 100% acetone for 20min, samples were embedded in Epon 812 (Electron Microscopy China, Beijing). Specimens were then cut into sections of 70 nm in thickness using the Leica EM UC7 microtome (Leica Biosystems) and ultrathin sections were visualized via transmission electron microscopy (FEI, Tecnai G2 Spirit Bio TWIN).
Flow Cytometry
PBMCs were first fixed and permeabilized with IC Fixation Buffer (Invitrogen) and Permeabilization Buffer (Invitrogen). Cells were then incubated with specific primary antibodies against ATF6(Invitrogen, PA5-72554), CHOP (Invitrogen, PA5-35129), and GRP78 (Invitrogen,14-9768-82) for 1 h at 4°C. Isotype antibodies that lack specificity to the target but possess the class and type of the relevant primary antibodies served as a negative control. Cells were then washed with Permeabilization Buffer followed by incubation with APC labeled goat anti-rabbit IgG cross-adsorbed secondary antibody (Invitrogen, A-10931) and FITC labeled goat anti-mouse IgG cross-absorbed secondary antibody (Invitrogen, F-2761) for 1 h at 4°C in dark. After washing, cells were resuspended in Flow Cytometry Staining Buffer, and data were acquired by flow cytometry in a FACSCanto II device (BD Bioscience). Further analysis was performed in FlowJo.
Cell Immunofluorescence
Freshly-isolated PBMCs were used for immunofluorescence assays. PBMCs were plated on poly-L-lysine-coated coverslips. 4% paraformaldehyde was used to fix the cells for 15 min. Cells were permeabilized with 0.3% TritonX-100 for 5 min and blocked with 3% BSA for 1 h at room temperature. Then, cells were incubated with primary antibody against ATF6 (1:200 dilution in 3% BSA), CHOP (1:100 dilution in 3% BSA), and GRP78 (1:200 dilution in 3% BSA) for 40 min. After three washes with PBS, cells were incubated with a 1:1000 dilution in 3% BSA of Alexa-488 or -594 conjugated secondary antibody. Stained cells were given a final wash and mounted with Prolong Gold antifade reagent with DAPI (Invitrogen). Images were taken with a 40× objective lens by immunofluorescence microscopy (Lacia, DM4000).
Adenovirus Production and Adenovirus Delivery
The adenovirus used to overexpress Sdf4 in mice were purchased from Hanbio Biotechnology Co., Ltd. (Shanghai, China). Mice were intratracheally treated with 1010 plaque-forming units (PFU) of recombinant Sdf4 adenovirus (AdSdf4), EGFP adenovirus (AdCon) or PBS and allowed to recover for 72 hours before CLP.
Cecal Ligation and Puncture (CLP) Model
All mice were maintained in the animal center of Zhejiang University according to animal care regulations. Research Ethics Committee of the First Affiliated Hospital, College of Medicine, Zhejiang University approved the experimental protocols. All experiments were carried out in accordance with the NIH Guide for the Care and Use of Laboratory Animals. Six to eight weeks old C57BL/6 wild type male mice were used for modeling. Polymicrobial sepsis was induced via CLP as previously described (30). Briefly, abdominal anesthesia was performed with 1% sodium pentobarbital (80mg/kg). Each abdomen was disinfected using 75% alcohol, and the skin was paralleled on the right side of the midline of the abdomen (operator’s field of vision). 75% cecum was ligated with 6/0 line and punctured using a 22G needle. 1–2mm3 of fecal material was expelled from the cecum into the peritoneal cavity, the cecum was returned to the abdominal cavity, and the abdominal muscle layer and skin were sutured layer by layer with a 4/0 line. The mice in the sham operation group were not subjected to cecal ligation and puncture, but all other procedures were the same as those for the experimental group. Mice were sacrificed 6 h,12 h, 18 h and 24h following CLP and lung was harvested.
Western Blotting
Mice lungs were homogenized using RIPA containing a protease and phosphatase inhibitor (Roche). Protein content was quantified using a PierceTM BCA Protein Assay Kit (Thermo) and proteins were separated via SDS-PAGE with 10% acrylamide and transferred into PVDF membranes (Millipore, Burlington, MA, USA). Next, blots were blocked with 5% milk and probed with specific primary antibodies against SDF4 (1:500 dilution in 3% milk, Santa, sc-393930), ATF6, GRP78 and CHOP (1:1000 dilution in 3% milk) overnight. The membranes were then washed with TBST and incubated with horseradish peroxidase-conjugated secondary antibodies at room temperature for 1 h. Next, target proteins were detected using chemiluminescence via Bio-rad ChemiDoc MP and normalized to β-actin.
Histology and Immunostaining
Formalin-fixed and paraffin-embedded lung tissues were cut into sections of 3 um in thickness for immunohistochemistry (IHC). 4% paraformaldehyde-fixed lung tissues were cut into sections of 6 um in thickness for immunofluorescence (IF) staining. IHC and IF were performed as previously (31). The primary antibody used were SDF4 (1:100 dilution in 3% BSA), ATF6 (1:200 dilution in 3% BSA), GRP78 (1:200 dilution in 3% BSA) and CHOP (1:200 dilution in 3% BSA). Images were acquired using Leica DM4000 microscope and Nikon A1 Ti confocal microscope.
Statistical Analyses
The data are expressed as mean ± SD. Student’s t-tests and chi-square test were used for comparisons between two groups. A logistic regression model was conducted to create a combined predictive score. Diagnostic ability was evaluated using a receiver operating characteristic (ROC) curve and the area under the ROC curve (AUC) for individual and combined scores. The association between SDF4 and GRP78 or ATF6 expression was examined by Pearson correlation analysis. Significance was set at P < 0.05. Statistical analyses and diagrams were performed using SPSS 20 (IBM) and GraphPad Prism 7.0 (GraphPad Software, CA, USA).
Results
Weighted Co-Expression Network Construction and Module Identification
The input dataset for WGCNA analysis, GSE63042, consisted of the gene expression data from 28 non-surviving sepsis patients and 78 surviving sepsis patients. We Set cut height= 30000 and no abnormalities were detected after sample clustering that warranted their removal (Figure 1A). In this study, we chose the power of β=10 for scale-free topology construction due to its scale independence and mean connectivity (Figure 1B). Then we set MEDissThres to 0.4 to merge similar modules and obtained a total of eleven modules (M1-11) (Figure 1C). Genes that could not be clustered into any modules were put into the M11 module and were identified as non-co-expressed genes.

Figure 1 (A) Sample clustering to detect outliers. All samples were in the clusters and there was no outlier. (B) Analysis of network topology for different soft‐thresholding powers. The soft-thresholding power of 10 was selected for scale-free topology construction. (C) Clustering dendrogram of genes with dissimilarity based on the topological overlap, together with assigned module colors. (D) Eigengene adjacency heatmap. The color of column and row square represents the adjacency of corresponded modules. In the heatmap, red represents high adjacency (positive correlation), while blue color represents low adjacency (negative correlation). Squares of red color along the diagonal are the meta‐module. (E) Network heatmap plot of 1000 randomly-selected genes. Light color represents low overlap and darker color represents higher overlap. The gene dendrogram and module assignment are also shown along the left side and the top.
We analyzed the eigengenes adjacency of the modules in order to determine the proximity of modules (Figure 1D). We also performed a network analysis of 1000 randomly selected genes to analyze the interaction relationships among these modules (Figure 1E). These two results showed low adjacency between modules, which suggested a large-scale degree of independence in our clustering.
Identification of Hub Genes and Dataset Validation
To identify modules related to the prognosis of sepsis, we performed a heatmap of module-trait relationships (Figure 2A). There are two modules (M7, P = 6e-04 and M6, P = 0.004) significantly associated with positive outcomes when expressed at a higher level, while one module (M3, P = 0.016) significantly associated with negative outcomes when expressed at a higher level. Mean gene significance and errors of each module were then calculated and three modules were found to rank in the top three (Supplementary Figure 1). Subsequently, we used two parameters, gene significance (GS) and module membership (MM), to assess the relationship between module and trait (Figures 2B–D).

Figure 2 (A) Module-trait associations. Each row corresponds to a module eigengene, and each column corresponds to a trait. Each cell contains the corresponding correlation and P-value. The table is color-coded by correlation according to the color legend. (B) Correlation between module membership and gene significance in the M7 module. (C) Correlation between module membership and gene significance in the M6 module. (D) Correlation between module membership and gene significance in the M3 module. (E) Identification of the hub gene in the intersection of MCC TOP20, DEGs, and GS > 0.2, and MM > 0.8. (F) SDF4 expression in survivors compared to non-survivors in the validation dataset E-MTAB-421. (G) SDF4 expression in survival compared to death in validation dataset GSE54514. **p < 0.01, *p < 0.05.
A total of 1,238 genes differentially expressed (1,099 annotated) (25). Only 78 DEGs were confirmed in M7 module while 5 DEGs were confirmed in M3. In M6 module, we ultimately identified 875 DEGs, which accounted for 79.6% of the total DEGs. More DEGs in modules indicated more contribution to the trait, therefore we chose the M6 module for subsequent analysis.
In order to identify hub genes in the target module, gene-gene connections with a weight > 0.1 were filtered out and imported to Cytoscape. Then, we calculated the MCC values via Cytohubba and constructed a network based on the top 20 genes (Supplementary Figure 2). Together with the criteria GS > 0.2, MM > 0.8, and differential expression, SDF4 was regarded as the hub gene (Figure 2E). Finally, SDF4 was preliminarily validated using other datasets with sepsis prognosis information (GSE54514 and E-MTAB-4421). SDF4 was also down-regulated in patients who would later die compared to sepsis survivors (Figures 2F, G).
Quantification of SDF4 in Predicting Sepsis Outcome
A total of 89 patients diagnosed with sepsis after admission to the ICU were in our cohort. Table 1 shows the baseline demographics and clinical characteristics of survivors and non-survivors. Survivors and non-survivors had average ages of 59.1 and 63.7 respectively. Those patients with cancer (P = 0.02) and chronic kidney disease (P = 0.01) tended to have worse outcomes within 28 days. Patients who died within 28 days had higher APACHE II scores (20.1 ± 6.2 versus 15.8 ± 5.4, P = 0.004) and SOFA scores (9.5 ± 3.1 versus 6.1 ± 3.3, P < 0.001) compared to patients who survived when initially admitted to ICU (Table 1 and Figures 3B, C).
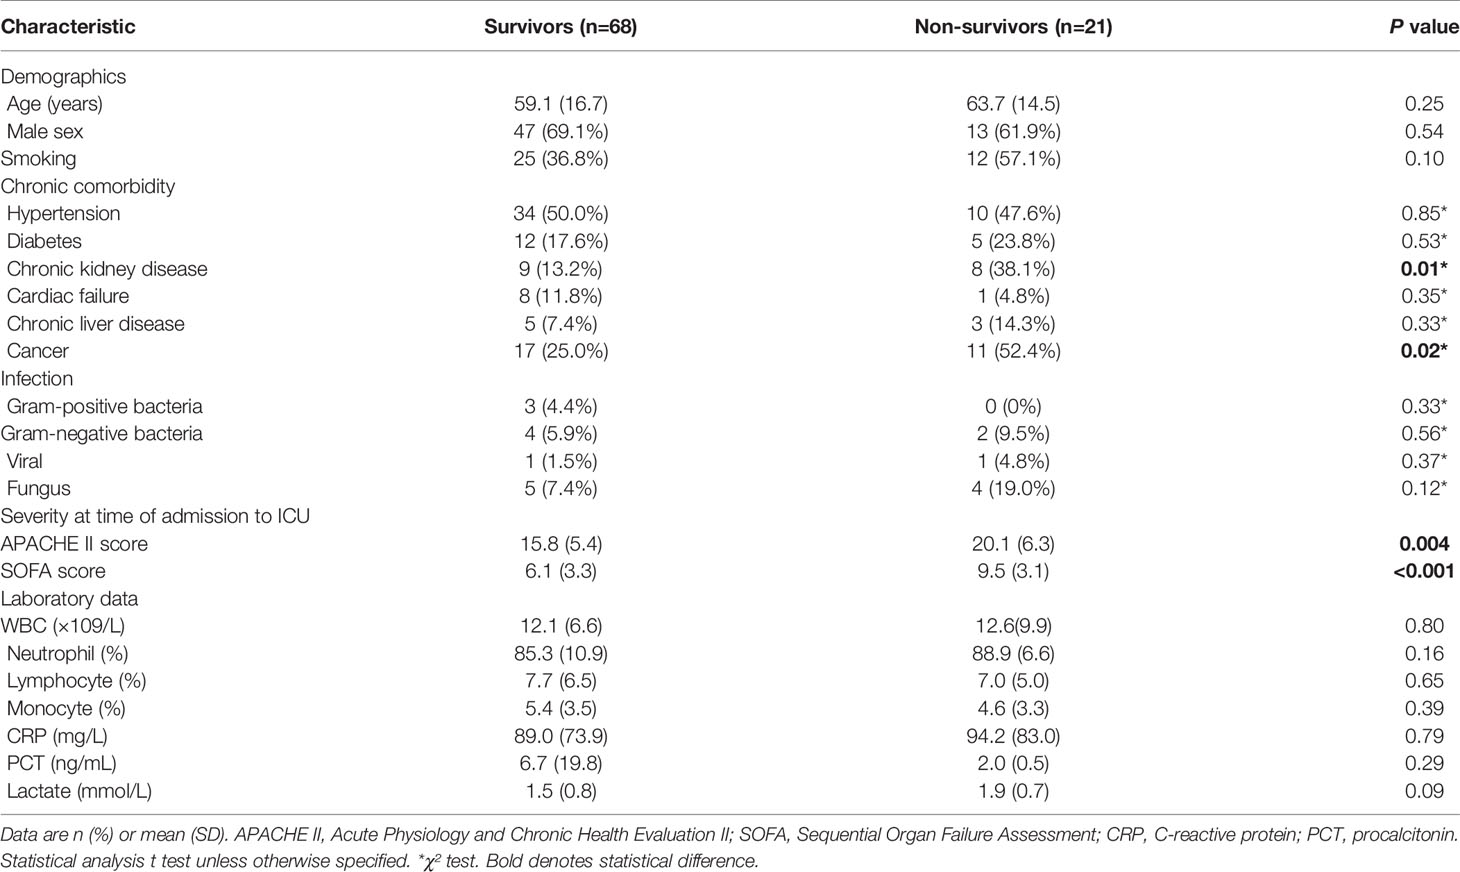
Table 1 Characteristics of patients included in the study.
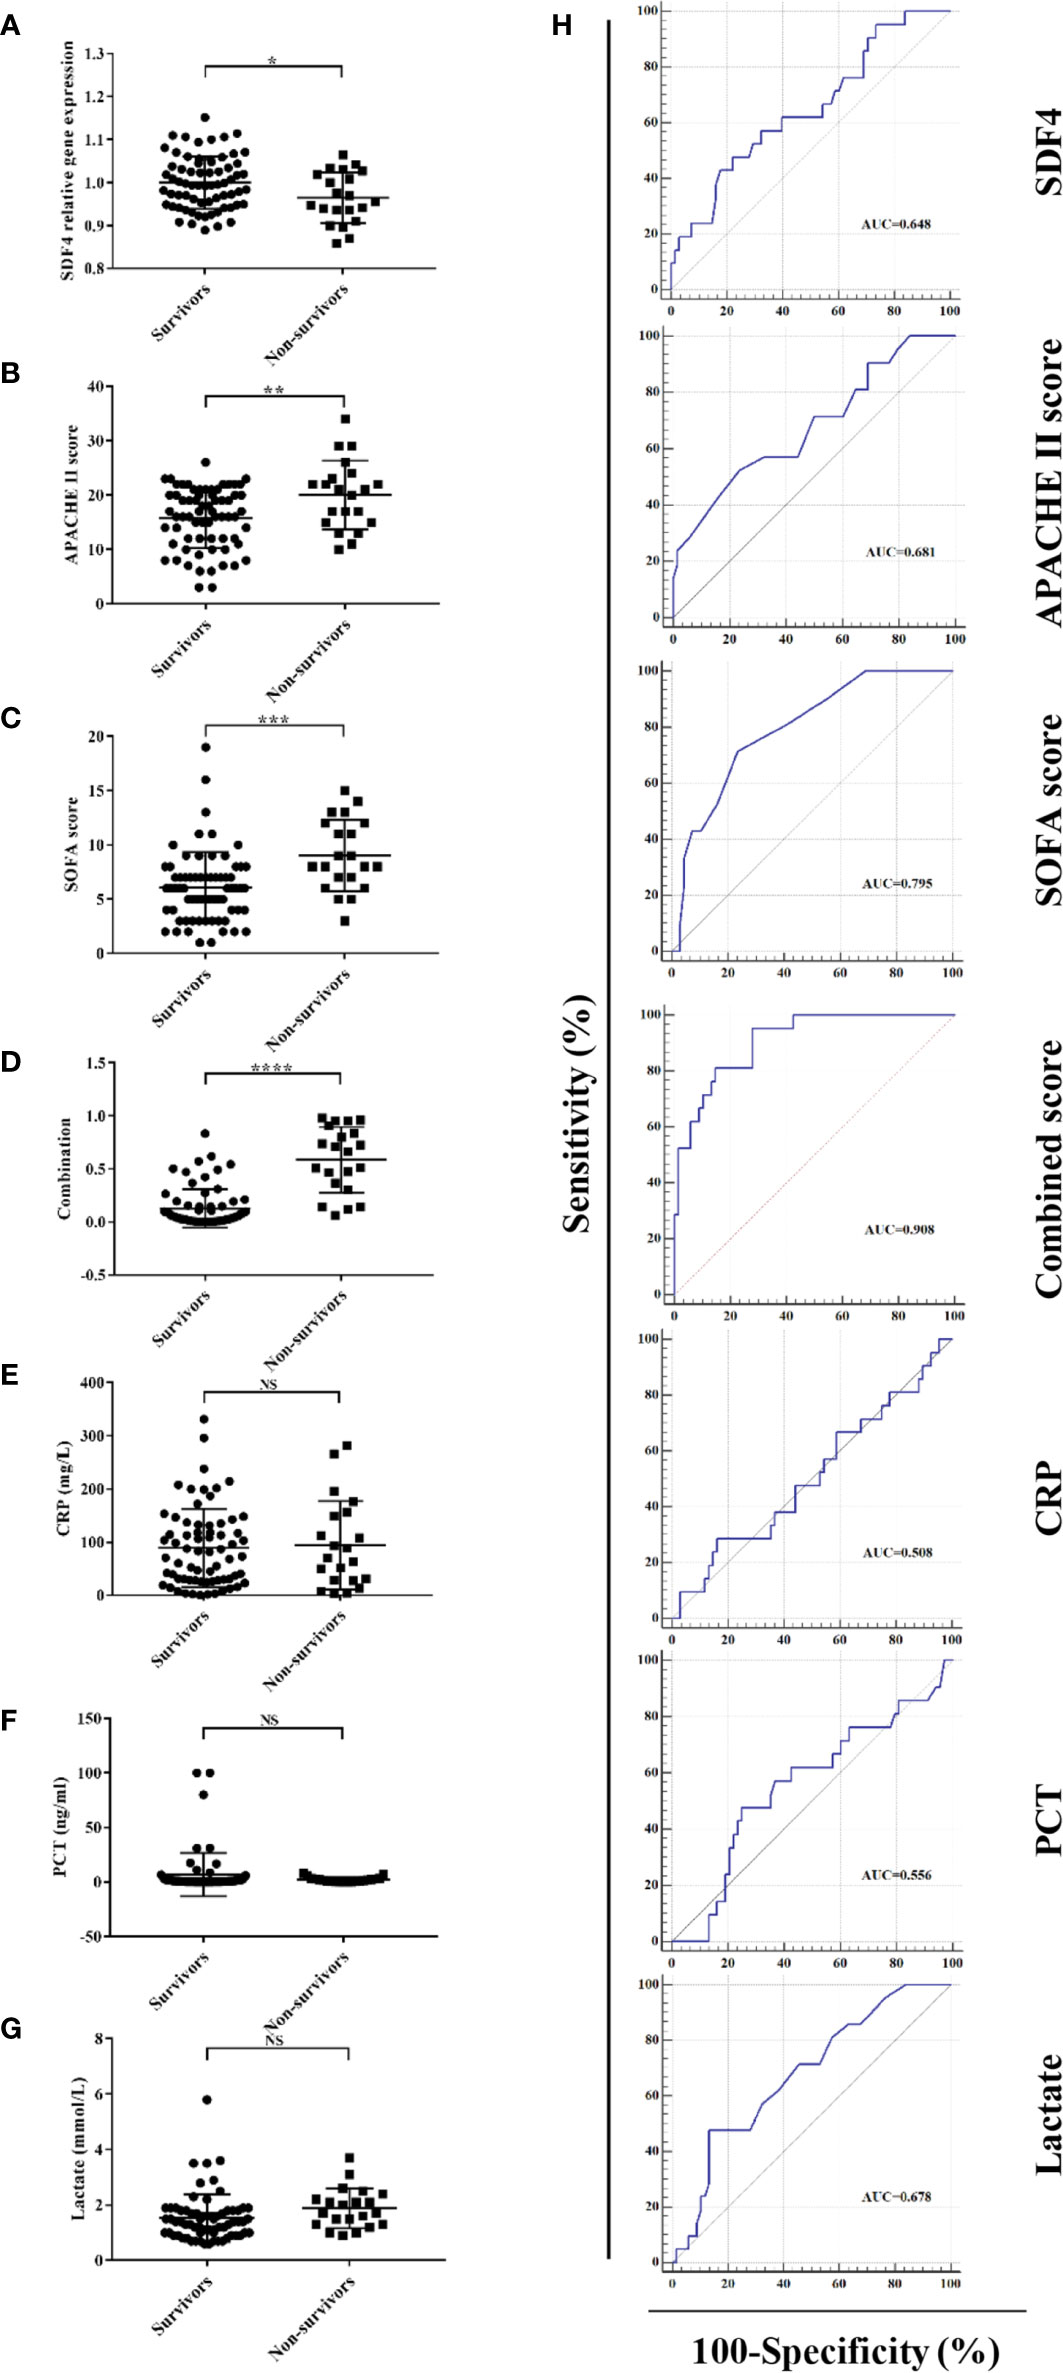
Figure 3 (A) SDF4 expression in survivors (n=68) compared to non-survivors (n=21) within the cohort. (B) APACHE II score in survivors compared to non-survivors. (C) SOFA score in survivors compared to non-survivors. (D) Combined score in survivors compared to non-survivors. (E) CRP in survivors compared to non-survivors. (F) PCT in survivors compared to non-survivors. (G) Lactate in survivors compared to non-survivors. (H) Receiver operating characteristics (ROC) curve of a diagnostic test based on SDF4 expression, APACHE II score, SOFA score, combined score, CRP, PCT, and lactate. ****P < 0.0001, ***P < 0.001, **P < 0.01, *P < 0.05. NS, not significant.
For further validation, we inspected SDF4 expression level in PBMCs within the cohort and as expected, patients who died had significantly lower SDF4 expression in comparison with the survivors (0.96 ± 0.01 versus 1 ± 0.01) (Figure 3A). To identify the combined signature, we performed a logistic regression analysis. Among all characteristics, cancer, chronic kidney disease, APACHE II score, SOFA score, and SDF4 expression levels revealed statistical significance (P < 0.1) in univariate analysis. With these variables, multivariate analysis was conducted and the result was the following: Combined score = -23.845 * (SDF4 relative expression level) + 0.123 * (APACHE II score) + 0.323*(SOFA score) + 3.183 * (cancer status: 0 for without, 1 for with) + 1.988 * (chronic kidney disease: 0 for without, 1 for with) + 15.789 (Table 2 and Figure 3D). ROC analysis was constructed to examine the performance of indicators as predictors of outcome, and the AUC for each indicator was calculated, respectively (Figure 3H). PCT (procalcitonin), CRP (C-reactive protein), and lactate were previous reported as biomarkers for prognosis (32–34). Thus, these three variables were also analyzed in the study (Figures 3E–H). The AUC of the expression level of SDF4 (AUC = 0.648) is superior to CRP (AYC = 0.508) and PCT (AUC = 0.556), similar to APACHE II score (AUC = 0.681) and lactate (AUC = 0.678), and slightly inferior to the SOFA score (AUC = 0.795). The combined score (AUC = 0.908) had the highest power to discriminate between the two groups, which improved the predictive value of model only with clinical parameters (APACHE II score+ SOFA score+ CKD + cancer, AUC= 0.828).
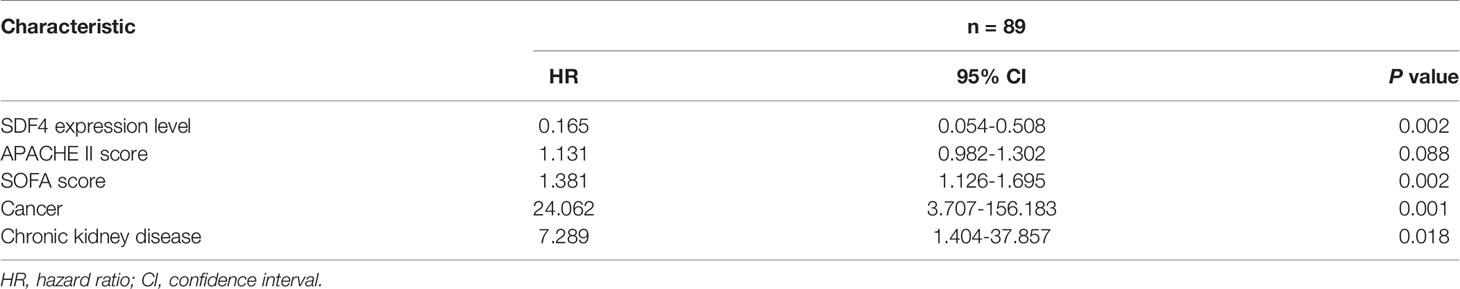
Table 2 Results of multivariate logistic regression modeling.
To evaluate the performance of the model, 70 patients diagnosed with sepsis after admission to the ICU were involved and RNA from their PBMCs were extracted. Patients who died (n=19) had significantly lower SDF4 expression in comparison with the survivors (n=51) (Figure 4A). The AUC of combined score is superior to APACHE II score, SOFA score (Figure 4B) and laboratory parameter (Figure 4C).
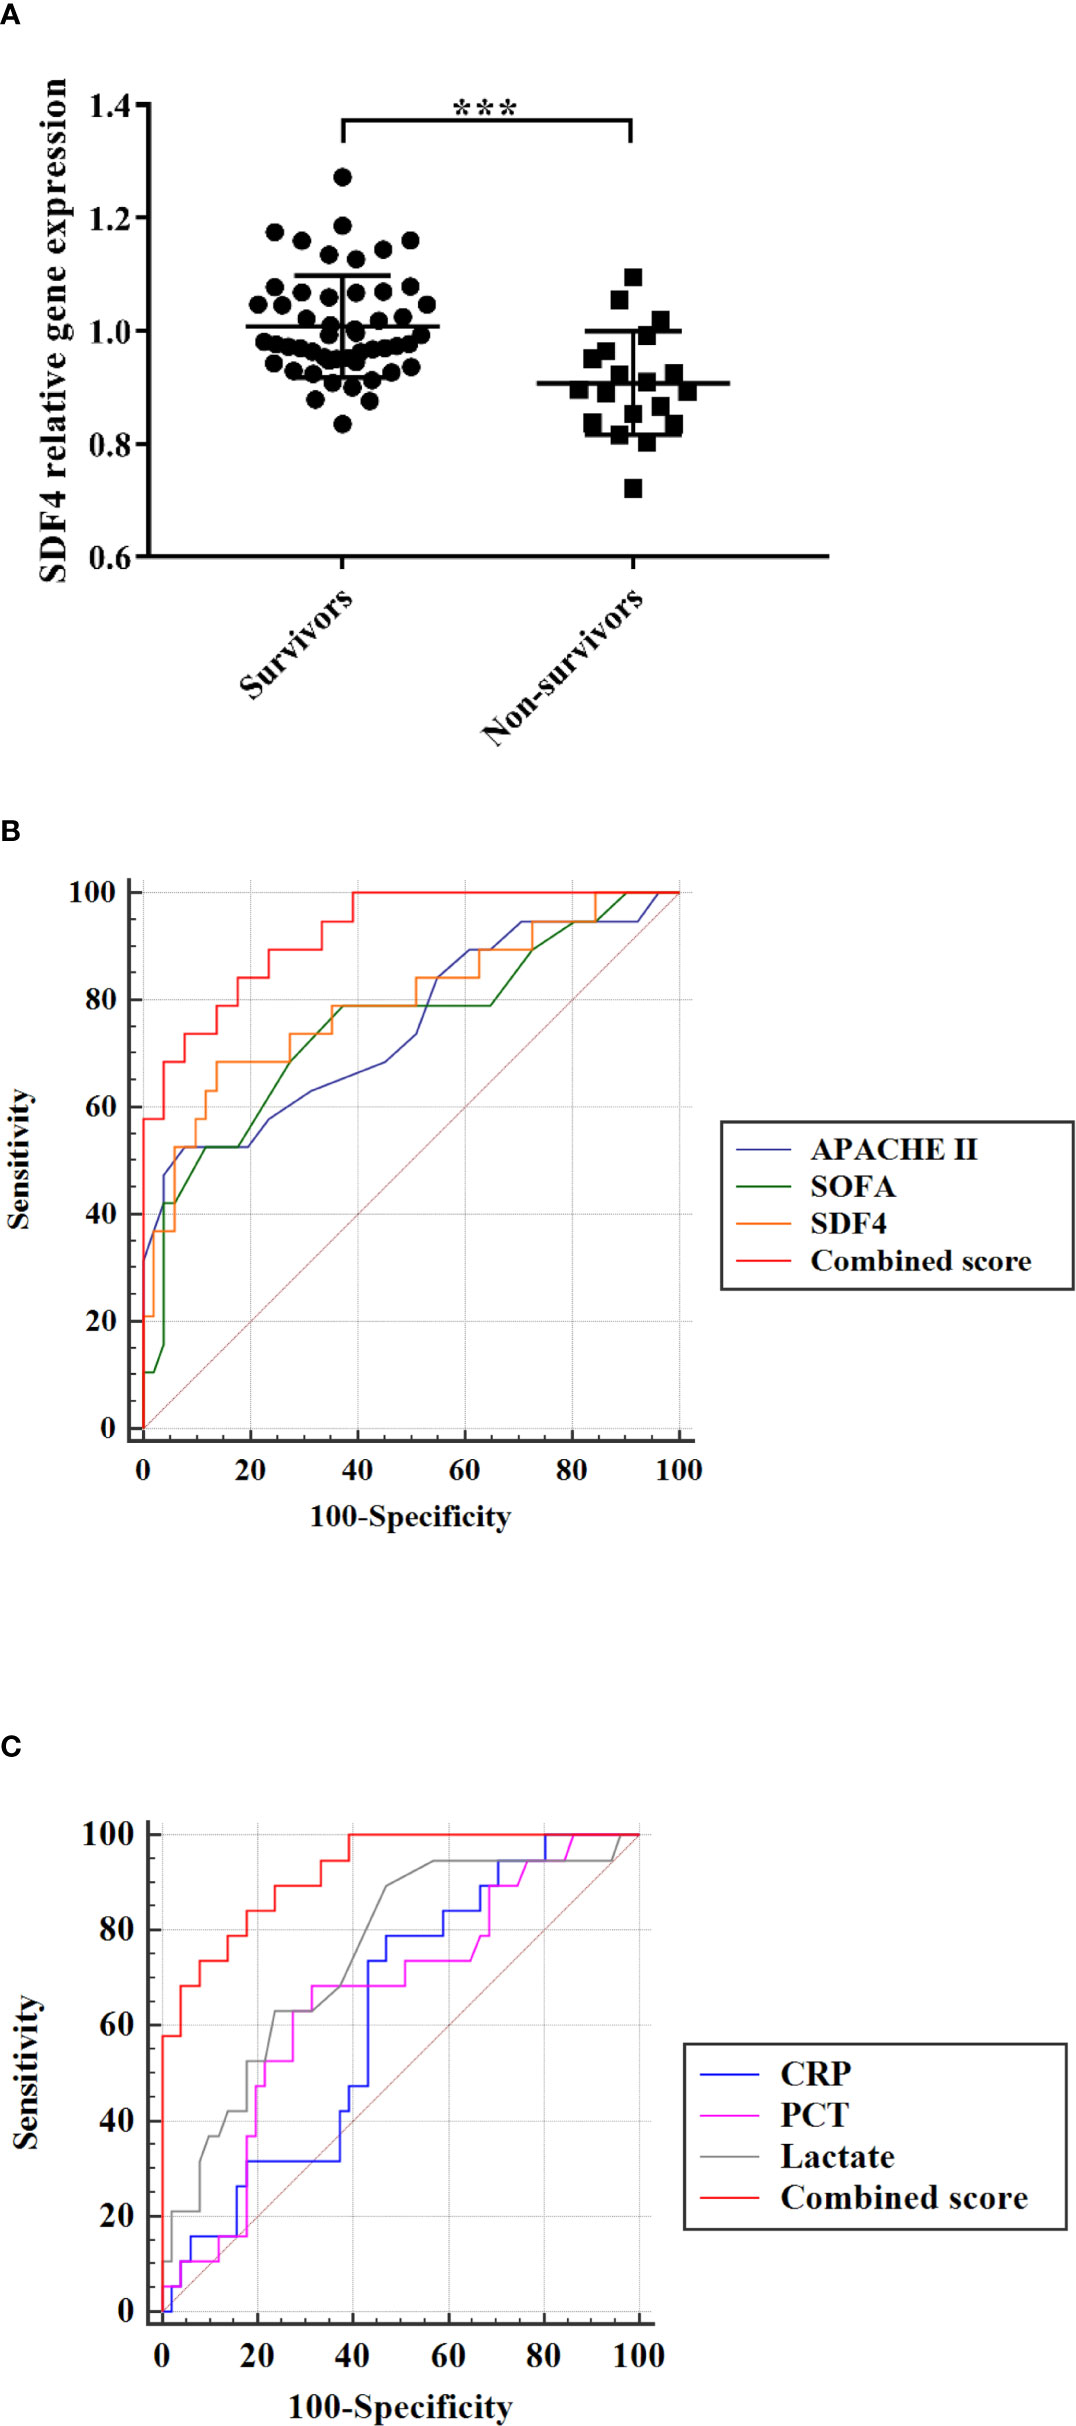
Figure 4 (A) SDF4 expression in survival (n=51) compared with death (n=19) in validation cohort. (B) Receiver operating characteristics (ROC) curve of a diagnostic test based on SDF4 (AUC=0.794), APACHE II score (AUC=0.750), SOFA score (AUC=0.751) and combined score (AUC=0.925). (C) Receiver operating characteristics (ROC) curve of a diagnostic test based on CRP (AUC=0.624), PCT (AUC=0.659), lactate (AUC=0.752) and combined score. ***p < 0.001.
Endoplasmic Reticulum Stress May Be the Downstream Effect of SDF4
KEGG pathway enrichment was performed for M6 module for functional annotation. Protein processing in the endoplasmic reticulum (ER) was the pathway with the highest enrichment factor (Figure 5A and Supplementary Table 2).
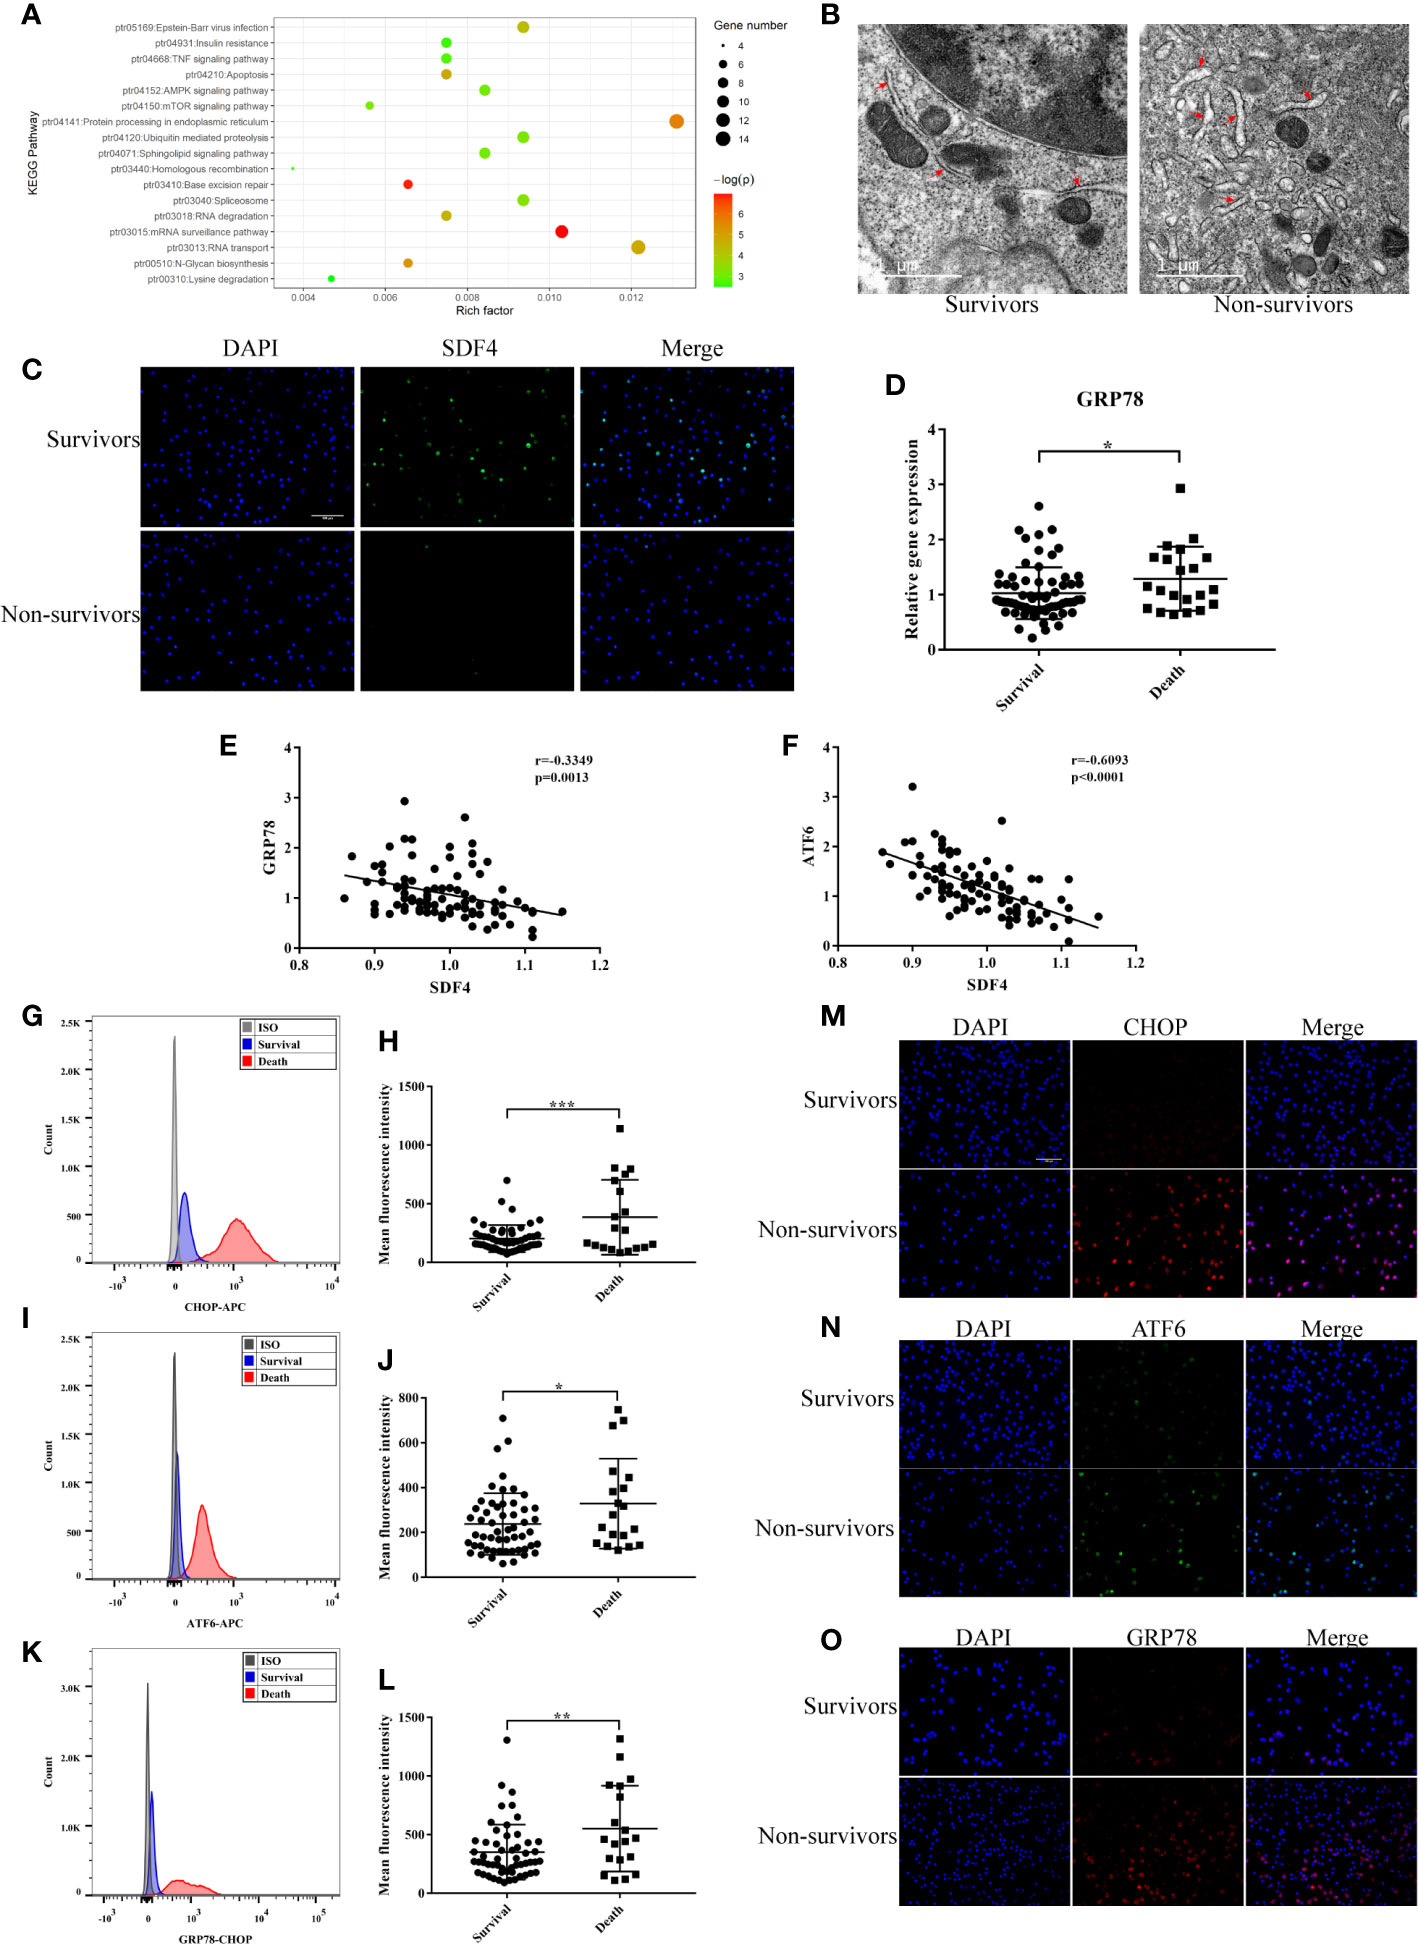
Figure 5 (A) Kyoto Encyclopedia of Genes and Genomes (KEGG) enrichment analysis of DEGs (p < 0.05). (B) Representative TEM picture in survival and death. (C) Representative photomicrographs showing SDF4 (green), DAPI (blue) and their merged images (original magnification ×400). Scale bar, 100um. (D) GRP78 expression in survival (n=68) compared with death (n=21) in cohort. (E) Pearson correlation analysis between the expression level of GRP78 and SDF4 in cohort. (F) Pearson correlation analysis between the expression level of ATF6 and SDF4 in cohort. (G) Representative histograms of CHOP expression among survival and death in flow cytometry. (H) Mean fluorescence intensity of CHOP in survival (n=54) and death (n=19). (I) Representative histograms of ATF6 expression among survival and death in flow cytometry. (J) Mean fluorescence intensity of ATF6 in survival and death. (K) Representative histograms of GRP78 expression among survival and death in flow cytometry. (L) Mean fluorescence intensity of GRP78 in survival and death. (M) Representative photomicrographs showing CHOP (red), DAPI (blue) and their merged images (original magnification ×400). Scale bar, 100um. (N) Representative photomicrographs showing ATF6 (green), DAPI (blue) and their merged images (original magnification ×400). (O) Representative photomicrographs showing GRP78 (red), DAPI (blue) and their merged images (original magnification ×400). ***p < 0.001, **p < 0.01, *p < 0.05.
Alternative splicing of SDF4 encoded protein, Cab45, produces three different isoforms: Cab45C, Cab45G, and Cab45S (35). Cab45C is reported to be a cytosolic splice variant and participates in Ca2+-induced amylase secretion (36). Cab45G is localized to the Golgi lumen, required for Ca2+-dependent cargo sorting at the trans-Golgi network, and can regulate impairment elicited by ethanol or UV (37–39). Cab45S, is related to ER Ca2+ signaling (40) and ER stress response genes (41, 42). Therefore, we speculated that the underlying mechanism of SDF4 is associated with ER function. Firstly, PBMCs were observed with transmission electron microscopy (TEM). Those patients with negative outcomes showed more severe swelling of the ER and ribosome degranulation (Figure 5B). After the expression level of SDF4 was verified (Figure 5C), we next determined the expression levels of GRP78, CHOP, and ATF6 in our cohort, which are key genes in signaling cascades to reduce the accumulation of unfolded proteins. We found that patients who died within 28 days tended to express GRP78 more highly (1.29 ± 0.13 versus 1.03 ± 0.06, Figure 5D). Moreover, we evaluated the correlation between SFD4 expression and GRP78 expression in PBMCs and found that GRP78 expression was negatively correlated with SDF4 (Figure 5E). Similar results were observed for the correlation between SDF4 and ATF6 expression (Figure 5F). In addition, our data showed that GRP78, CHOP, and ATF6 were over-expressed in patients with severe sepsis that led to death via calculating the mean fluorescence intensity in flow cytometry (Figures 5G–L), which was further verified by immunofluorescence (Figures 5M–O) in another cohort. Taken together, our data indicate that ER stress may be up-regulated as a result of down-regulation of SDF4, leading to worsened sepsis outcomes.
Sdf4 Overexpression Inhibited Endoplasmic Reticulum Stress in CLP Mice Lung
Considering the decreased expression of SDF4 in sepsis patients, we investigated whether Sdf4 was down-regulated in CLP-induced sepsis in mice. Acute lung damage is one of the main causes of death among sepsis patients, thus we selected lung as the target organ. We first detected the level of Sdf4 expression and ER stress of lungs 6 h, 12 h, 18 h and 24 h following our CLP models. We found that Sdf4 gradually decreased along with an increasing of cleaved-Atf6, Grp78 and Chop as the disease progressing (Figure 6). Therefore, 24 h after CLP was selected as the observation point in the following study.
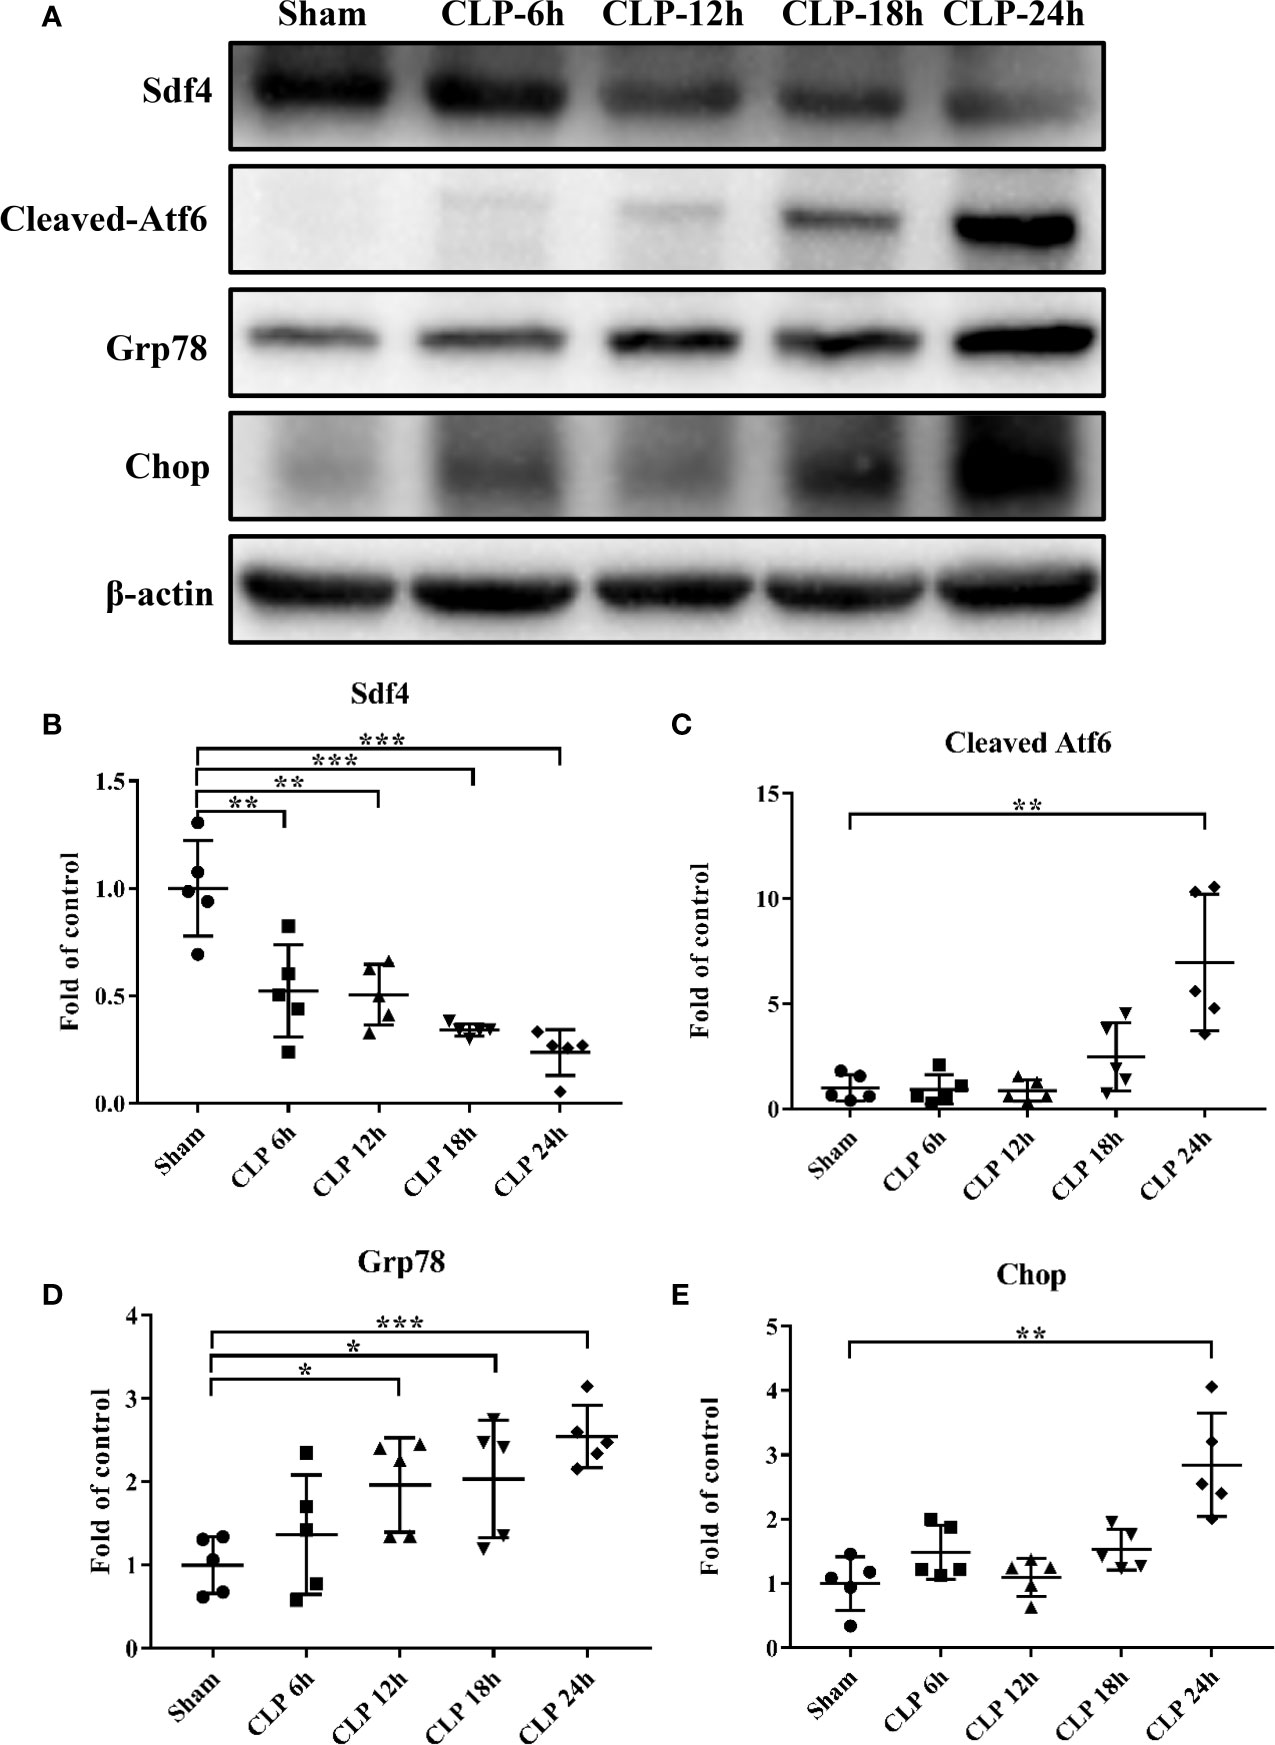
Figure 6 (A). Representative western blot results from sham-operated and CLP mice lung for levels of cleaved- Atf6, Grp78, Chop, and β-actin. (B–E) The cleaved- Atf6, Grp78 and Chop bands were quantified by densitometry and normalized to the density of β-actin. n=5. Data were shown in Mean ± SD. ***p < 0.001, **p < 0.01, *p < 0.05.
To determine the role of Sdf4 in sepsis-induced lung injury, we overexpressed Sdf4 using adenovirus vector. Each mouse was intratracheally treated with 1010 plaque-forming units (PFU) of recombinant Sdf4 adenovirus (AdSdf4), EGFP adenovirus (AdCon) or PBS and allowed to recover for 72 hours. We first confirmed adenoviral gene delivery and transfection. EGFP signals were detected in both AdSdf4 and AdCon group (Supplementary Figure 3A). Sdf4 overexpression is verified by immunofluorescence (Supplementary Figure 3B) and western blot (Supplementary Figures 3C, D). Then, AdSdf4 and AdCon mice were subjected to CLP-induced sepsis and were sacrificed 24h after CLP. IHC staining against Grp78 and Chop showed ER stress was down-regulated in AdSdf4 mice compared with AdCon mice (Figures 7A–C). Western blot presented a similar change (Figures 7D–G).
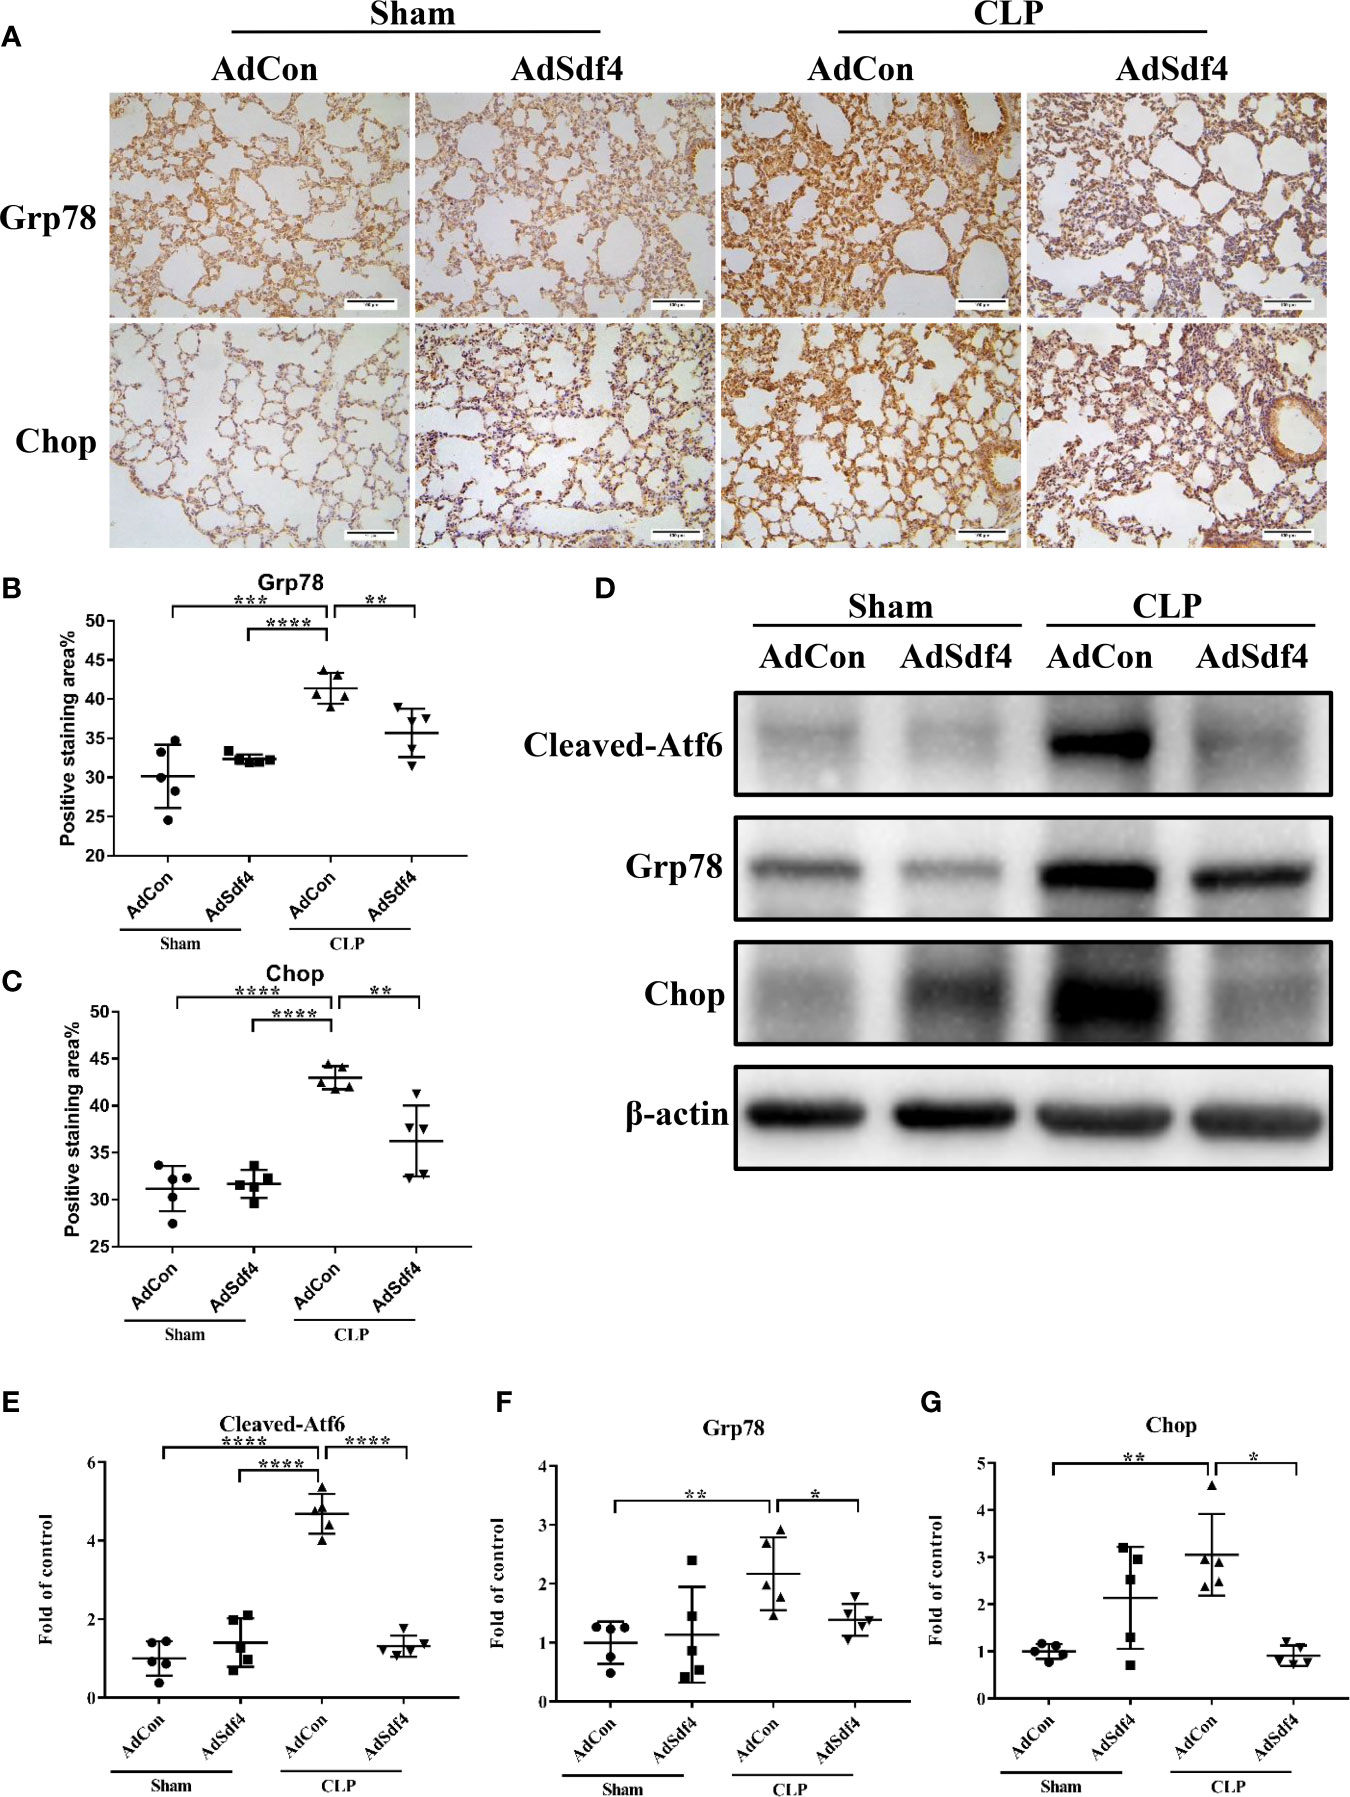
Figure 7 (A) Representative photomicrographs of Grp78 and Chop from sham-operated and CLP mice lung treated with AdCon or AdSdf4 (original magnification ×400). Scale bar, 100um. (B, C) Positive staining area of Grp78 and Chop from four groups. (D) Representative western blot results from four groups for levels of cleaved- Atf6, Grp78, Chop, and β-actin. (E–G) The cleaved- Atf6, Grp78 and Chop bands were quantified by densitometry and normalized to the density of β-actin. n=5. Data were shown in Mean ± SD. ****p < 0.001, ***p < 0.001, **p < 0.01, *p < 0.05.
Considered together, these results indicated that the Sdf4 is a negative upstream regulator of ER stress in sepsis-induced lung injury, whereas overexpression of Sdf4 attenuated excessive ER stress.
Discussion
Sepsis is a life-threatening complication caused by infections, leading to severe host response dysregulation and organ dysfunction (1). A recent study has revealed that sepsis is a complex and dynamic syndrome with great heterogeneity (43). Therefore, co-expression network analysis was employed in the current study to mine the hub gene and explore the underlying mechanisms of sepsis responses in the current study. Expression data of 28 sepsis non-survivors and 78 sepsis survivors were used for WGCNA analysis. Through WGCNA, we divided all genes into 11 separate modules and found that the M6 module was indicative of sepsis outcome. SDF4 was then screened out satisfying three criteria: 1) DEGs; 2) GS > 0.2, MM > 0.8; 3) the 20 highest MCC value, followed by validation in both two datasets and clinical cohorts. Evidence from KEGG and a literature review further demonstrated the potential relationship between SDF4 expression and ER stress.
For sepsis patients, screening for risk factors and prognosis could have a role in triaging direct resources appropriately to the most vulnerable patients (44). Meaningful definitions of sepsis severity are supposed to capture a subset of patients where severe physiological derangements led to a substantially great mortality risk (45–47). In addition, more than 100 biomarkers have been evaluated for sepsis prognosis in the last few decades (6, 7). Regardless of this, no gold standard for prognosis yet exists and clinicians still rely on a number of traditional biomarkers to discriminate between patients with positive and negative outcomes. Reportedly, PCT, CRP, lactate levels, and SOFA scores have a moderate predictive value in sepsis prognosis (33, 48, 49), while prognosis accuracy depends much on multiple assessments and measurements throughout disease progression. Our findings showed that SDF4 expression level was significantly lower in non-survivors compared to survivors and that its prediction value is superior to that of CRP and PCT, equal to lactate and the APACHE II score, and inferior to the SOFA score. As a combination of several sepsis biomarkers might be more effective (6), we applied a multivariable logistic regression approach and the combined score turned out to be a satisfactory predictor with an AUC of 0.908. Incorporation of SDF4 can improve clinical parameters predictive value for the prognosis of sepsis, showing a potential for future applications.
SDF4, mapping to 1p36.33, is a member of the CREC family (50). Previous DNA methylation analysis revealed that the promoter region of SDF4 was hypomethylated in porcine mammary epithelial cells faced with Escherichia coli challenge (51), suggesting the potential effect of SDF4 in sepsis. Alternative splicing of its encoded protein, Cab45, produces three different isoforms: Cab45C, Cab45G, and Cab45S (35). Cab45C is reported to be a cytosolic splice variant and participates in Ca2+-induced amylase secretion (36). Cab45G is localized to the Golgi lumen, required for Ca2+-dependent cargo sorting at the trans-Golgi network, and can regulate impairment elicited by ethanol or UV (37–39). Cab45S, a secreted variant of Cab45, can inhibit ER stress and apoptosis via GRP78/Bip and can promote cell proliferation through inhibition of Ca2+ signaling in tumors (40, 42). The downregulation of apoptosis was also observed in neurons when SDF4 was overexpressed (41). We observed that SDF4 was a protective factor for sepsis patients in both the validation datasets and cohort. KEGG pathway analysis also revealed protein processes in the ER as the most enriched pathway in the M6 module, so we shifted our focus to ER dysfunction.
The ER is a vital intracellular organelle in eukaryotic cells, which is constructed of a continuous membrane system of tubules and sheets (52). The ER plays a major role in protein translocation, folding, post-translational modifications, and transportation to the Golgi body, commonly considered as a protein folding factory (53). The ER also serves a role in calcium storage and lipid metabolism (54). Accumulated evidence supports that the ER is altered in septic pathology and ER stress is involved in the progression of sepsis, which is marked by the accumulation of misfolded or unfolded proteins (55). ER stress not only contributes to abnormal lymphocyte apoptosis (56), but also impairs beneficial autophagy activity in septic mice (57). In addition, it was reported that ER stress can modulate the NF-κB/IκB and HIF-1α signaling pathways in LPS-induced lung inflammation (58). Nevertheless, there is little research focusing on the relation between ER stress and sepsis prognosis. In the current study, ATF6, GRP78, and CHOP were significantly overexpressed in non-survivors compared to survivors, which was confirmed in both flow cytometry and immunofluorescence. And to further verify our hypothesis, we established the mice CLP model and found that ER stress gradually increased within 24 hours after surgery, accompanied by the decreasing of Sdf4. And overexpression of Sdf4 by intratracheally injecting recombinant adenovirus attenuated such activation. In mild or temporary ER stress, this signaling cascade can restore the cell to homeostasis. Conversely, if stress is long-term or excessive and cellular function is compromised, apoptosis is initiated involving the transcription factor C/EPB homologous protein (CHOP) (59).
In conclusion, using WGCNA analysis, our study identified SDF4 as a biomarker of sepsis prognosis, and a prediction model was established based on SDF4 expression levels and clinical characteristics. Then, the mechanism was speculated and preliminarily verified in sepsis patients and CLP mice. Upon inflammatory overload in severe sepsis, the SDF4 expression level was decreased, leading to an ER stress signaling cascade. ER stress beyond the regulation level of cells results in compromised cellular function, which gives rise to a worsened outcome. Nevertheless, the study also has some limitations. Firstly, the performance of the combined score for sepsis outcome prediction requires an evaluation in a larger multicenter and prospective study to compare with existing biomarkers. Secondly, we only followed up for 28 days but did not confirm the impact of SDF4 expression and ER stress levels on the long-term mortality of septic patients. Finally, studies elucidating dynamic changes in SDF4 and ER stress with disease process or therapeutic intervention and the molecular mechanism of SDF4 and ER stress in sepsis in vivo or in vitro might be of great significance in the future.
Data Availability Statement
Publicly available datasets were analyzed in this study. This data can be found here: GSE63042, GSE54514 and E-MTAB-4421.
Ethics Statement
The studies involving human participants were reviewed and approved by the Research Ethics Committee of the First Affiliated Hospital, College of Medicine, Zhejiang University. The patients/participants provided their written informed consent to participate in this study. The animal study was reviewed and approved by Research Ethics Committee of the First Affiliated Hospital, College of Medicine, Zhejiang University.
Author Contributions
JC, HJ, TZ, and QS designed the study. TZ and HC analyzed bioinformatics. QS, XP, and SC recruited sepsis patients cohort and collected clinical characteristics. TZ, CW, SF, and LS carried out experiments. QS and YW analyzed data. All authors contributed to the article and approved the submitted version.
Funding
This work was supported by the key research project of precision medicine in National Key Research and Development Plan (2017YFC0907603), and Natural Science Foundation of China (81900611), LQ19H050008, 2018M642464.
Conflict of Interest
The authors declare that the research was conducted in the absence of any commercial or financial relationships that could be construed as a potential conflict of interest.
Acknowledgments
We thank Li Wang in the Center of Cryo-Electron Microscopy (CCEM), Zhejiang University for her technical assistance on Transmission Electron Microscopy.
Supplementary Material
The Supplementary Material for this article can be found online at: https://www.frontiersin.org/articles/10.3389/fimmu.2021.659193/full#supplementary-material
Supplementary Figure 1 | Distribution of average gene expression significance and errors in the modules associated with sepsis outcome.
Supplementary Figure 2 | The network contains the top 20 genes in the MCC of the M6 module. The gradation of the color represents the MCC score and the width represents the weight of each two nodes.
Supplementary Figure 3 | (A) Representative photomicrographs showing EGFP from mice treated with PBS, AdCon and AdSdf4. (B) Representative photomicrographs showing Sdf4 (red), DAPI (blue) and their merged images from mice treated with PBS, AdCon and AdSdf4. (C) Representative western blot results from mice treated with PBS, AdCon and AdSdf4 for levels of Sdf4 and β-actin. (D) The Sdf4 bands were quantified by densitometry and normalized to the density of β-actin. n=5. Data were shown in Mean ± SD. **p < 0.01.
References
1. Singer M, Deutschman CS, Seymour CW, Shankar-Hari M, Annane D, Bauer M, et al. The Third International Consensus Definitions for Sepsis and Septic Shock (Sepsis-3). JAMA (2016) 315(8):801–10. doi: 10.1001/jama.2016.0287
2. Fleischmann C, Scherag A, Adhikari NK, Hartog CS, Tsaganos T, Schlattmann P, et al. Assessment of Global Incidence and Mortality of Hospital-Treated Sepsis. Current Estimates and Limitations. Am J Respir Crit Care Med (2016) 193(3):259–72. doi: 10.1164/rccm.201504-0781OC
3. Cohen J, Vincent JL, Adhikari NK, Machado FR, Angus DC, Calandra T, et al. Sepsis: A Roadmap for Future Research. Lancet Infect Dis (2015) 15(5):581–614. doi: 10.1016/S1473-3099(15)70112-X
4. Paoli CJ, Reynolds MA, Sinha M, Gitlin M, Crouser E. Epidemiology and Costs of Sepsis in the United States-an Analysis Based on Timing of Diagnosis and Severity Level. Crit Care Med (2018) 46(12):1889–97. doi: 10.1097/CCM.0000000000003342
5. Gaieski DF, Edwards JM, Kallan MJ, Carr BG. Benchmarking the Incidence and Mortality of Severe Sepsis in the United States. Crit Care Med (2013) 41(5):1167–74. doi: 10.1097/CCM.0b013e31827c09f8
6. Pierrakos C, Vincent JL. Sepsis Biomarkers: A Review. Crit Care (2010) 14(1):R15. doi: 10.1186/cc8872
7. Sandquist M, Wong HR. Biomarkers of Sepsis and Their Potential Value in Diagnosis, Prognosis and Treatment. Expert Rev Clin Immunol (2014) 10(10):1349–56. doi: 10.1586/1744666X.2014.949675
8. Burnham KL, Davenport EE, Radhakrishnan J, Humburg P, Gordon AC, Hutton P, et al. Shared and Distinct Aspects of the Sepsis Transcriptomic Response to Fecal Peritonitis and Pneumonia. Am J Respir Crit Care Med (2017) 196(3):328–39. doi: 10.1164/rccm.201608-1685OC
9. Scicluna BP, van Vught LA, Zwinderman AH, Wiewel MA, Davenport EE, Burnham KL, et al. Classification of Patients With Sepsis According to Blood Genomic Endotype: A Prospective Cohort Study. Lancet Respir Med (2017) 5(10):816–26. doi: 10.1016/S2213-2600(17)30294-1
10. Sweeney TE, Shidham A, Wong HR, Khatri P. A Comprehensive Time-Course-Based Multicohort Analysis of Sepsis and Sterile Inflammation Reveals a Robust Diagnostic Gene Set. Sci Transl Med (2015) 7(287):287ra71. doi: 10.1126/scitranslmed.aaa5993
11. De Smet R, Marchal K. Advantages and Limitations of Current Network Inference Methods. Nat Rev Microbiol (2010) 8(10):717–29. doi: 10.1038/nrmicro2419
12. Langfelder P, Horvath S. Fast R Functions for Robust Correlations and Hierarchical Clustering. J Stat Software (2012) 46(11):i11. doi: 10.18637/jss.v046.i11
13. Langfelder P, Horvath S. WGCNA: An R Package for Weighted Correlation Network Analysis. BMC Bioinformatics (2008) 9:559. doi: 10.1186/1471-2105-9-559
14. Niemira M, Collin F, Szalkowska A, Bielska A, Chwialkowska K, Reszec J, et al. Molecular Signature of Subtypes of Non-Small-Cell Lung Cancer by Large-Scale Transcriptional Profiling: Identification of Key Modules and Genes by Weighted Gene Co-Expression Network Analysis (WGCNA). Cancers (Basel) (2019) 12(1):37. doi: 10.3390/cancers12010037
15. Luo Z, Wang W, Li F, Songyang Z, Feng X, Xin C, et al. Pan-Cancer Analysis Identifies Telomerase-Associated Signatures and Cancer Subtypes. Mol Cancer (2019) 18(1):106. doi: 10.1186/s12943-019-1035-x
16. Alaei S, Sadeghi B, Najafi A, Masoudi-Nejad A. LncRNA and mRNA Integration Network Reconstruction Reveals Novel Key Regulators in Esophageal Squamous-Cell Carcinoma. Genomics (2019) 111(1):76–89. doi: 10.1016/j.ygeno.2018.01.003
17. Chen M, Yan J, Han Q, Luo J, Zhang Q. Identification of Hub-Methylated Differentially Expressed Genes in Patients With Gestational Diabetes Mellitus by Multi-Omic WGCNA Basing Epigenome-Wide and Transcriptome-Wide Profiling. J Cell Biochem (2020) 121(5-6):3173–84. doi: 10.1002/jcb.29584
18. Xu J, Bankov G, Kim M, Wretlind A, Lord J, Green R, et al. Integrated Lipidomics and Proteomics Network Analysis Highlights Lipid and Immunity Pathways Associated With Alzheimer’s Disease. Transl Neurodegener (2020) 9(1):36. doi: 10.1186/s40035-020-00215-0
19. Sezin T, Vorobyev A, Sadik CD, Zillikens D, Gupta Y, Ludwig RJ. Gene Expression Analysis Reveals Novel Shared Gene Signatures and Candidate Molecular Mechanisms Between Pemphigus and Systemic Lupus Erythematosus in CD4(+) T Cells. Front Immunol (2017) 8:1992. doi: 10.3389/fimmu.2017.01992
20. Yao Q, Song Z, Wang B, Qin Q, Zhang JA. Identifying Key Genes and Functionally Enriched Pathways in Sjogren’s Syndrome by Weighted Gene Co-Expression Network Analysis. Front Genet (2019) 10:1142. doi: 10.3389/fgene.2019.01142
21. Godini R, Fallahi H, Ebrahimie E. Network Analysis of Inflammatory Responses to Sepsis by Neutrophils and Peripheral Blood Mononuclear Cells. PloS One (2018) 13(8):e0201674. doi: 10.1371/journal.pone.0201674
22. Cheng L, Nan C, Kang L, Zhang N, Liu S, Chen H, et al. Whole Blood Transcriptomic Investigation Identifies Long Non-Coding RNAs as Regulators in Sepsis. J Transl Med (2020) 18(1):217. doi: 10.1186/s12967-020-02372-2
23. Dong L, Li HW, Zhang SL, Yang GZ. miR-148 Family Members Are Putative Biomarkers for Sepsis. Mol Med Rep (2019) 19(6):5133–41. doi: 10.3892/mmr.2019.10174
24. Zhang Z, Chen L, Xu P, Xing L, Hong Y, Chen P. Gene Correlation Network Analysis to Identify Regulatory Factors in Sepsis. J Transl Med (2020) 18(1):381. doi: 10.1186/s12967-020-02561-z
25. Tsalik EL, Langley RJ, Dinwiddie DL, Miller NA, Yoo B, van Velkinburgh JC, et al. An Integrated Transcriptome and Expressed Variant Analysis of Sepsis Survival and Death. Genome Med (2014) 6(11):111. doi: 10.1186/s13073-014-0111-5
26. Chin CH, Chen SH, Wu HH, Ho CW, Ko MT, Lin CY. cytoHubba: Identifying Hub Objects and Sub-Networks From Complex Interactome. BMC Syst Biol (2014) 8 Suppl 4:S11. doi: 10.1186/1752-0509-8-S4-S11
27. Huang DW, Sherman BT, Lempicki RA. Systematic and Integrative Analysis of Large Gene Lists Using DAVID Bioinformatics Resources. Nat Protoc (2009) 4(1):44–57. doi: 10.1038/nprot.2008.211
28. Parnell GP, Tang BM, Nalos M, Armstrong NJ, Huang SJ, Booth DR, et al. Identifying Key Regulatory Genes in the Whole Blood of Septic Patients To Monitor Underlying Immune Dysfunctions. Shock (2013) 40(3):166–74. doi: 10.1097/SHK.0b013e31829ee604
29. Davenport EE, Burnham KL, Radhakrishnan J, Humburg P, Hutton P, Mills TC, et al. Genomic Landscape of the Individual Host Response and Outcomes in Sepsis: A Prospective Cohort Study. Lancet Resp Med (2016) 4(4):259–71. doi: 10.1016/S2213-2600(16)00046-1
30. Rittirsch D, Huber-Lang MS, Flierl MA, Ward PA. Immunodesign of Experimental Sepsis by Cecal Ligation and Puncture. Nat Protoc (2009) 4(1):31–6. doi: 10.1038/nprot.2008.214
31. Li B, Zhu C, Dong L, Qin J, Xiang W, Davidson AJ, et al. ADAM10 Mediates Ectopic Proximal Tubule Development and Renal Fibrosis Through Notch Signalling. J Pathol (2020) 252(3):274–89. doi: 10.1002/path.5517
32. Jekarl DW, Lee S, Kim M, Kim Y, Woo SH, Lee WJ. Procalcitonin as a Prognostic Marker for Sepsis Based on SEPSIS-3. J Clin Lab Anal (2019) 33(9):e22996. doi: 10.1002/jcla.22996
33. Ryoo SM, Lee J, Lee YS, Lee JH, Lim KS, Huh JW, et al. Lactate Level Versus Lactate Clearance for Predicting Mortality in Patients With Septic Shock Defined by Sepsis-3. Crit Care Med (2018) 46(6):e489–e95. doi: 10.1097/CCM.0000000000003030
34. Cui N, Zhang H, Chen Z, Yu Z. Prognostic Significance of PCT and CRP Evaluation for Adult ICU Patients With Sepsis and Septic Shock: Retrospective Analysis of 59 Cases. J Int Med Res (2019) 47(4):1573–9. doi: 10.1177/0300060518822404
35. Blank B, von Blume J. Cab45-Unraveling Key Features of a Novel Secretory Cargo Sorter at the Trans-Golgi Network. Eur J Cell Biol (2017) 96(5):383–90. doi: 10.1016/j.ejcb.2017.03.001
36. Lam PP, Hyvarinen K, Kauppi M, Cosen-Binker L, Laitinen S, Keranen S, et al. A Cytosolic Splice Variant of Cab45 Interacts With Munc18b and Impacts on Amylase Secretion by Pancreatic Acini. Mol Biol Cell (2007) 18(7):2473–80. doi: 10.1091/mbc.e06-10-0950
37. Scherer PE, Lederkremer GZ, Williams S, Fogliano M, Baldini G, Lodish HF. Cab45, a Novel Ca2+-Binding Protein Localized to the Golgi Lumen. J Cell Biol (1996) 133(2):257–68. doi: 10.1083/jcb.133.2.257
38. Zhu YF, Wang QL, Xu WR, Li S. The Ethanol Response Gene Cab45 can Modulate the Impairment Elicited by Ethanol and Ultraviolet in PC12 Cells. J Genet Genomics (2008) 35(3):153–61. doi: 10.1016/S1673-8527(08)60021-1
39. von Blume J, Alleaume AM, Kienzle C, Carreras-Sureda A, Valverde M, Malhotra V. Cab45 is Required for Ca2+-Dependent Secretory Cargo Sorting at the Trans-Golgi Network. J Cell Biol (2012) 199(7):1057–66. doi: 10.1083/jcb.201207180
40. Chen L, Xu S, Xu Y, Lu W, Liu L, Yue D, et al. Cab45S Promotes Cell Proliferation Through SERCA2b Inhibition and Ca2+ Signaling. Oncogene (2016) 35(1):35–46. doi: 10.1038/onc.2015.56
41. Shen J, Zhou T, Li H, Li W, Wang S, Song Y, et al. Cab45s Inhibits Neuronal Apoptosis Following Intracerebral Hemorrhage in Adult Rats. Brain Res Bull (2018) 143:36–44. doi: 10.1016/j.brainresbull.2018.09.016
42. Chen L, Xu S, Liu L, Wen X, Xu Y, Chen J, et al. Cab45S Inhibits the ER Stress-Induced IRE1-JNK Pathway and Apoptosis Via GRP78/Bip. Cell Death Dis (2014) 5:e1219. doi: 10.1038/cddis.2014.193
43. Rittirsch D, Flierl MA, Ward PA. Harmful Molecular Mechanisms in Sepsis. Nat Rev Immunol (2008) 8(10):776–87. doi: 10.1038/nri2402
44. Larsen FF, Petersen JA. Novel Biomarkers for Sepsis: A Narrative Review. Eur J Intern Med (2017) 45:46–50. doi: 10.1016/j.ejim.2017.09.030
45. Shankar-Hari M, Phillips GS, Levy ML, Seymour CW, Liu VX, Deutschman CS, et al. Developing a New Definition and Assessing New Clinical Criteria for Septic Shock For the Third International Consensus Definitions for Sepsis and Septic Shock (Sepsis-3). JAMA (2016) 315(8):775–87. doi: 10.1001/jama.2016.0289
46. Seymour CW, Liu VX, Iwashyna TJ, Brunkhorst FM, Rea TD, Scherag A, et al. Assessment of Clinical Criteria for Sepsis: For the Third International Consensus Definitions for Sepsis and Septic Shock (Sepsis-3). JAMA (2016) 315(8):762–74. doi: 10.1001/jama.2016.0288
47. Rhodes A, Evans LE, Alhazzani W, Levy MM, Antonelli M, Ferrer R, et al. Surviving Sepsis Campaign: International Guidelines for Management of Sepsis and Septic Shock: 2016. Intensive Care Med (2017) 43(3):304–77. doi: 10.1007/s00134-017-4683-6
48. Guo S, Mao X, Liang M. The Moderate Predictive Value of Serial Serum CRP and PCT Levels for the Prognosis of Hospitalized Community-Acquired Pneumonia. Respir Res (2018) 19(1):193. doi: 10.1186/s12931-018-0877-x
49. Ferreira FL, Bota DP, Bross A, Melot C, Vincent JL. Serial Evaluation of the SOFA Score to Predict Outcome in Critically Ill Patients. JAMA (2001) 286(14):1754–8. doi: 10.1001/jama.286.14.1754
50. Honore B. The Rapidly Expanding CREC Protein Family: Members, Localization, Function, and Role in Disease. Bioessays (2009) 31(3):262–77. doi: 10.1002/bies.200800186
51. Sajjanar B, Trakooljul N, Wimmers K, Ponsuksili S. DNA Methylation Analysis of Porcine Mammary Epithelial Cells Reveals Differentially Methylated Loci Associated With Immune Response Against Escherichia Coli Challenge. BMC Genomics (2019) 20(1):623. doi: 10.1186/s12864-019-5976-7
52. Zhang H, Hu J. Shaping the Endoplasmic Reticulum Into a Social Network. Trends Cell Biol (2016) 26(12):934–43. doi: 10.1016/j.tcb.2016.06.002
53. Oakes SA, Papa FR. The Role of Endoplasmic Reticulum Stress in Human Pathology. Annu Rev Pathol (2015) 10:173–94. doi: 10.1146/annurev-pathol-012513-104649
54. Schwarz DS, Blower MD. The Endoplasmic Reticulum: Structure, Function and Response to Cellular Signaling. Cell Mol Life Sci (2016) 73(1):79–94. doi: 10.1007/s00018-015-2052-6
55. Khan MM, Yang WL, Wang P. Endoplasmic Reticulum Stress in Sepsis. Shock (2015) 44(4):294–304. doi: 10.1097/SHK.0000000000000425
56. Ma T, Han L, Gao Y, Li L, Shang X, Hu W, et al. The Endoplasmic Reticulum Stress-Mediated Apoptosis Signal Pathway Is Involved in Sepsis-Induced Abnormal Lymphocyte Apoptosis. Eur Surg Res (2008) 41(2):219–25. doi: 10.1159/000135631
57. Chen HG, Han HZ, Li Y, Yu YH, Xie KL. Hydrogen Alleviated Organ Injury and Dysfunction in Sepsis: The Role of Cross-Talk Between Autophagy and Endoplasmic Reticulum Stress: Experimental Research. Int Immunopharmacol (2020) 78:106049. doi: 10.1016/j.intimp.2019.106049
58. Kim HJ, Jeong JS, Kim SR, Park SY, Chae HJ, Lee YC. Inhibition of Endoplasmic Reticulum Stress Alleviates Lipopolysaccharide-Induced Lung Inflammation Through Modulation of NF-kappaB/HIF-1alpha Signaling Pathway. Sci Rep (2013) 3:1142. doi: 10.1038/srep01142
Keywords: sepsis, prognosis, SDF4, gene co-expression network, endoplasmic reticulum stress, CLP
Citation: Zhu T, Su Q, Wang C, Shen L, Chen H, Feng S, Peng X, Chen S, Wang Y, Jiang H and Chen J (2021) SDF4 Is a Prognostic Factor for 28-Days Mortality in Patients With Sepsis via Negatively Regulating ER Stress. Front. Immunol. 12:659193. doi: 10.3389/fimmu.2021.659193
Received: 27 January 2021; Accepted: 28 June 2021;
Published: 13 July 2021.
Edited by:
Bernahrd Ryffel, Centre National de la Recherche Scientifique (CNRS), FranceReviewed by:
Antonio Edson R. Oliveira, University of São Paulo, BrazilBenjamin Ethan Steinberg, University of Toronto, Canada
Copyright © 2021 Zhu, Su, Wang, Shen, Chen, Feng, Peng, Chen, Wang, Jiang and Chen. This is an open-access article distributed under the terms of the Creative Commons Attribution License (CC BY). The use, distribution or reproduction in other forums is permitted, provided the original author(s) and the copyright owner(s) are credited and that the original publication in this journal is cited, in accordance with accepted academic practice. No use, distribution or reproduction is permitted which does not comply with these terms.
*Correspondence: Jianghua Chen, Y2hlbmppYW5naHVhQHpqdS5lZHUuY24=; Hong Jiang, amlhbmdob25nOTYxMTA2QHpqdS5lZHUuY24=
†These authors have contributed equally to this work and share first authorship