
95% of researchers rate our articles as excellent or good
Learn more about the work of our research integrity team to safeguard the quality of each article we publish.
Find out more
ORIGINAL RESEARCH article
Front. Immunol. , 10 March 2021
Sec. Microbial Immunology
Volume 12 - 2021 | https://doi.org/10.3389/fimmu.2021.651619
This article is part of the Research Topic Fighting an Elusive Enemy: Staphylococcus aureus and its Antibiotic Resistance, Immune-Evasion and Toxic Mechanisms View all 20 articles
 Tanja C. Meyer1
 Stephan Michalik1
 Silva Holtfreter2
 Stefan Weiss1Nele Friedrich3Henry Völzke4
 Thomas Kocher5Christian Kohler6
 Frank Schmidt1,7
 Barbara M. Bröker2*
 Uwe Völker1*
Our goal was to provide a comprehensive overview of the antibody response to Staphylococcus aureus antigens in the general population as a basis for defining disease-specific profiles and diagnostic signatures. We tested the specific IgG and IgA responses to 79 staphylococcal antigens in 996 individuals from the population-based Study of Health in Pomerania. Using a dilution-based multiplex suspension array, we extended the dynamic range of specific antibody detection to seven orders of magnitude, allowing the precise quantification of high and low abundant antibody specificities in the same sample. The observed IgG and IgA antibody responses were highly heterogeneous with differences between individuals as well as between bacterial antigens that spanned several orders of magnitude. Some antigens elicited significantly more IgG than IgA and vice versa. We confirmed a strong influence of colonization on the antibody response and quantified the influence of sex, smoking, age, body mass index, and serum glucose on anti-staphylococcal IgG and IgA. However, all host parameters tested explain only a small part of the extensive variability in individual response to the different antigens of S. aureus.
The interactions between Staphylococcus aureus and humans span a broad range from unnoticed colonization to severe damage in various diseases including blood-stream infections (1) and recurrent episodes of skin and soft tissue infections (2). Due to the wide spread of S. aureus within the population, the resulting high frequency of infections, and an increase of community-acquired antibiotic-resistant strains, the burden on health-care systems has been continuously growing over the past decades (3). Since about 20% of the human population carries staphylococci continuously and the remainder intermittently with transient phases of colonization, a mean carriage rate of 37.2% has been estimated (4, 5). Some subgroups of the population show higher colonization rates, for instance 73–94% in atopic eczema patients (6, 7), 56.4% in insulin-dependent diabetics, and 51.5% in hemodialysis patients (4).
Besides disease-associated variation in carriage rates, multiple host factors have been described that influence the individual chance for a persistent colonization. Apart from genetic host factors [for overview see (8, 9)], additional factors like age, sex, nutritional status, and further lifestyle choices have an impact on the rate of contacts with S. aureus and carriage rates. Carriage is highest in children within the first 8 weeks after birth reaching 40–50% in infants and decreases with increasing age (10–12). A sex bias was reported hinting to higher colonization rates in males using culture-based detection methods (12), which might be due to overall higher bacterial loads in males (13). In a large colonization prevalence study in the US, obesity was linked to increased colonization rates (11), and in the Rotterdam Study diabetes and elevated fasting serum glucose showed a correlation to higher colonization rates (14). Active smoking was described to result in lower carriage rates (14), and a combined influence of vitamin D levels in serum and smoking was shown in the Tromsø Staph and Skin Study (15).
The majority of the persistently colonized individuals carry the same strain over long time spans, but also abrupt changes and periods of co-carriage with two different strains were described in a weekly swab study of healthy students conducted by Ritchie et al. (16). A rapid turnover of strains was reported for intermittent carriers with a median carriage duration of 4 weeks and an estimated six episodes within 1 year (16). Applying a staged protocol, the detection of multiple-strain colonization has been improved, detecting up to four different spa types in a single nasal swab (17).
It is known that persistently colonized individuals have a higher risk of S. aureus bacteremia compared to non-colonized patients when undergoing clinical surgery. This is usually caused by their own colonizing strain (18, 19). Notably, in case of blood stream infection, S. aureus carriers have a significantly better chance of survival of severe infections (20). We previously proposed that a pre-established memory immune response to the colonizing strain due to long term exposure and repeated minor infections may confer some degree of clinical protection (21). Indeed, S. aureus carriers mount a strain-specific antibody response against their colonizing strain (22). Moreover, high antibody titers at the onset of S. aureus blood stream infection are correlated with a milder disease course (23–25).
Depending on the mode of interaction between S. aureus and the human host, specific antibody classes are triggered. Since S. aureus colonizes and infects mucosal surfaces in humans, the appearance of an anti-staphylococcal IgA response can be expected. IgA occurs in two variants in the human body: the monomeric IgA circulating in the blood stream, and a dimeric form known as secretory IgA which mainly prevents mucosa-associated bacteria from entering the human body (26). IgA has neutralizing properties but comparably low inflammatory potential (27). A strong clonal relationship between serum and gut IgA was shown, allowing the use of serum monomeric IgA as a proxy for the hardly accessible secretory dimeric IgA of mucosae (28). In contrast, an anti-staphylococcal IgG response is likely mounted after invasive episodes. Apart from neutralizing bacterial factors, these antibodies promote inflammation and bacterial clearance by professional phagocytes. Both IgA and IgG with the potential of binding to S. aureus have been found in the epidermis showing the importance of this first line of defense (29). Systemic anti-staphylococcal IgG and IgA show an early onset in childhood, with no correlation between the two antibody classes, and not limited to individuals with clinical symptoms of infection (30).
To lower the clinical burden on the human population, various anti-S. aureus strategies including antibiosis and vaccination have been tested, but with limited success so far. Multiple strategies to develop a vaccine have failed until now, including active as well as passive immunization approaches (31, 32). The failure of early trials targeting adhesins and surface glyocopolymers forced S. aureus researchers to revisit S. aureus pathogenesis and potential correlates of protection. Targeting single adhesion factors can fail due to multiple functionally redundant proteins present in S. aureus. The focus on opsonophagocytosis may not be as effective as in other pathogens, since many additional virulence factors, including toxins and immune evasion proteins, are involved in S. aureus pathogenesis (33). As a consequence, current approaches shifted to the use of multiple targets, e.g., the pore-forming toxins targeted by a monoclonal antibody (34). The selection of protective vaccine candidates targeting the majority of staphylococcal strains is not an easy task due to the high variability of genomes between various strains. Bosi et al. (35) described the variable pangenome to harbor four times as many entries as the core genome common to all strain (35). A detailed understanding of the anti-staphylococcal antibody repertoire in healthy individuals and disease cohorts is essential to identify suitable vaccine targets for future trials.
The anti-staphylococcal antibody repertoire in humans has already been addressed in earlier studies. In a study by Verkaik et al. (36) profiling 19 antigens, it was shown that all included individuals had specific IgG to at least CHIPS and SCIN, underlining the wide spread of S. aureus in the human population (36). The authors reported a high inter-individual variability in antibody titers, but also a significant difference between persistent carriers and non-carriers in the IgG and IgA response to toxic shock syndrome toxin (TSST-1) and staphylococcal enterotoxin A, and the IgA response to clumping factor A and B. In patients suffering from acute infection caused by S. aureus, Dryla et al. (30) reported increased IgG titers directed against six of 19 staphylococcal antigens (30). Rigat et al. (37) confirmed the “nearly universal” natural exposure of humans to S. aureus using a panel of 134 antigens, but found only little changes of the antibody levels due to a clinically significant S. aureus infection (37). All the aforementioned studies were limited in their dynamic range as only one serum dilution was analyzed per sample, rendering them prone to saturation and limit-of-detection effects. Additionally, most studies were limited in sample size, with only small numbers of healthy control individuals available for comparison to a disease group.
To overcome these limitations, we applied a high-dynamic-range bead-based multiplex assay (based on the Luminex® system) to 996 individuals of the population-based cohort SHIP-TREND-0. By measuring each sample at seven dilutions, we broadened the detection range of this assay format enabling exact calculation of antibody response values for both low and high titer sera. With our panel of 79 antigens, we describe the extreme heterogeneity of the antibody response in healthy adults and identify multiple host factors that influence the anti-staphylococcal antibody repertoire. Additionally, we shed light on the natural immunogenicity of the included antigens which could guide the selection of vaccine candidates.
The heterologous expression of most staphylococcal antigens was accomplished using Escherichia coli SCS1 cells equipped with a two-plasmid system purchased from Protagen AG (Germany). Sequences were derived from the S. aureus strain NCTC 8325 if not indicated otherwise. Five proteins were not suitable for expression in full length and were thus expressed as two separate domains (see Supplementary Table 1 for detailed information). A two-plasmid setup was used for all expressions. The helper plasmid pSE111 was selected via a kanamycin resistance cassette and contained genes coding for the Lac repressor protein and a rare tRNA for arginine. The expression plasmid pQE30NST was selected via an ampicillin resistance cassette and contained the sequence for the desired staphylococcal antigen joined to a N-terminal hexa-His-tag for purification via a multi-cloning site. The expression was controlled by the Lac repressor, allowing an induction using Isopropyl-β-D-1-thiogalactopyranoside (IPTG). The strains were cultivated in super broth supplemented with 100 μg/mL ampicillin and 30 μg/mL kanamycin at 37°C with orbital shaking at 250 rpm starting with an overnight pre-culture set-up as a dilution series followed by the main cultivation inoculated to an optical density at 540 nm (OD540nm) of 0.1. When the culture reached an OD540nm of 2.0, IPTG was added to a concentration of 1 mM. Two hours after induction, the cells were harvested by centrifugation. The bacterial pellet was washed with PBS, then flash frozen in liquid nitrogen, and stored at −80°C until cell disruption.
The expression of truncated, non-functional Protein A (Spa_trunc) was accomplished using E. coli BL21 (DE3) pLysS_SAC_spa_His, with the spa cassette inserted into pASK-IBA33+ (IBA GmbH, Germany) under the control of a tetracycline-inducible promoter with an ampicillin resistance cassette for selection. Cultivation was performed in super broth supplemented with 100 μg/mL ampicillin and 25 μg/mL chloramphenicol. The main culture was inoculated with growing bacteria from an overnight pre-culture to an OD540nm of 0.1; target protein expression was induced at an OD540nm of 0.5 by adding anhydrotetracycline to a concentration of 0.2 μg/mL. The cells were harvested 2 h after induction by centrifugation, washed with PBS, flash frozen in liquid nitrogen, and stored at −80°C.
Cell disruption was performed using glass beads for mechanical disruption within a FastPrep cell homogenizer (Thermo Savant, US). The harvested pellets were resuspended in lysis/equilibration/binding buffer and then shaken with the glass beads three times for 30 s with cooling on ice in between. After centrifugation of the glass beads the supernatant was collected. For purification of the His-tagged proteins Protino® 96 Ni-IDA purification plates were used according to the manufacturer's protocol (MACHEREY-NAGEL GmbH & Co. KG, Germany). The purity of the protein products was verified by one-dimensional sodium dodecyl sulfate polyacrylamide gel electrophoresis followed by Coomassie staining and additionally by mass spectrometric analyses of the eluates.
Human plasma samples were derived from the SHIP-TREND-0 cohort of the Study of Health in Pomerania (SHIP). In brief, a stratified random sample of adults living in the region of Western Pomerania was invited for a personal interview as well as medical examinations to assess their state of health. A full list of initial instruments of investigation can be found in Völzke et al. (38), followed by multiple subsequent initiatives like the description of the molecular epidemiology of nasal S. aureus isolates obtained from this cohort by Holtfreter et al. (39). A subset of 996 subjects was used for this study, for detailed characteristics see Table 1. The study protocol of the SHIP-TREND-0 cohort was approved by the local ethics committee of the University of Greifswald (registration no. BB39/08) with all participants giving informed written consent.
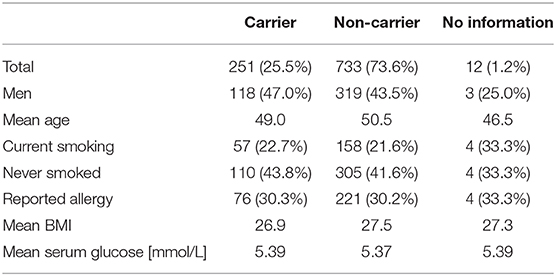
Table 1. Characteristics of the study cohort.
The serological assay to detect specific antibody titers directed against the staphylococcal antigens was performed according to Meyer et al. (40). All antigens were presented on the surface of magnetic fluorophore-coded microspheres (MagPlex®/Luminex®, US) in a 79-plex assay. To achieve a high quality of data, seven serial dilutions spanning the range from 1:50 to 1:204,800 were analyzed for each serum. Human IgG and IgA specific detection antibodies labeled with R-Phycoerythrin were purchased from Jackson ImmunoResearch Europe Ltd (Ely, UK; order numbers 109-116-098 and 109-115-011). To retrieve a single characteristic value per serum/antigen from the multiple data points of the dilution series, the xMAPr analysis tool (40) was used for curve fitting and calculation of the response value. To avoid missing values in the data set, an imputation was performed to include cases where curve fitting failed based on a loess fit over all measurement of a single dilution. All statistical testings and data visualizations were performed using R [v4.0.2; (41)] together with Rstudio [v1.3.1056; (42)] and the tidyverse package [v1.3.0; (43)]. Data analysis was conducted separately for IgG and IgA, binary variables like S. aureus carriage or biological sex were addressed using the Wilcoxon signed rank test, reporting p-values after Benjamini-Hochberg correction (44) for multiple testing with a significance level of 0.05, whereas continuous and discrete variables like BMI or age were analyzed using spline interpolations. The spline regression analysis was performed using R (v4.0.1) in combination with tidyverse (v1.3.0) and limma (v3.44.3) packages. The phenotypes age, BMI or serum glucose were used as predictor variables for a natural cubic spline regression with four degrees of freedom, followed by a linear modeling and an empirical Bayes moderate F-test for each antigen, for the detection of general changes over the predictor variable for each antigen. The resulting p-values were adjusted using the Benjamini–Hochberg correction (44) and the significance level was set to 0.05.
Anti-staphylococcal antibody responses were detected in 996 individuals of the SHIP-TREND-0 cohort. The resulting data sets for IgG and IgA span a wide dynamic range due to the application of a dilution-based approach. The main findings are presented separately for IgG and IgA in the first and second section, with the combined findings following in the later sections.
Serum IgG titers against S. aureus antigens covered a very broad range with large differences between the 996 tested individuals as well as the 79 staphylococcal antigens. Every single individual harbored serum IgG antibodies against numerous S. aureus antigens. The wide dynamic range is depicted in Figure 1A as a heatmap, showing the calculated response values, which reflect antibody concentrations, for all antigens and all subjects. The dynamic range of the seven single dilutions included in the response calculation is shown in separate heatmaps in Supplementary Figures 1–7. The calculated antibody response values ranged from 5.5*101 to 5.2*108 for the 79 antigens spanning close to seven orders of magnitude. The average range of the response values per single antigen was 3.7 orders of magnitude. SAOUHSC_01584 showed the smallest span of about 2.5 orders of magnitude between minimal and maximal detected specific antibody response, while PSMα2 presented with the widest range of over 5 orders of magnitude (Figure 1C). Antibody responses against antigens did not cluster into distinguishably groups but are rather scattered over a large range of values. The antigen with the highest median antibody responses was CHIPS, followed by Ssl9, IsdB, HlgC, and SplB. The overall highest response value was acquired for PSMα2, one of the short peptide antigens of the group of phenol soluble modulins. SEQ, SceD, SAOUHSC_01584, BOF837_902400132, and EsxB make up the lower end in the ranking of all antigens according to the median antibody response.
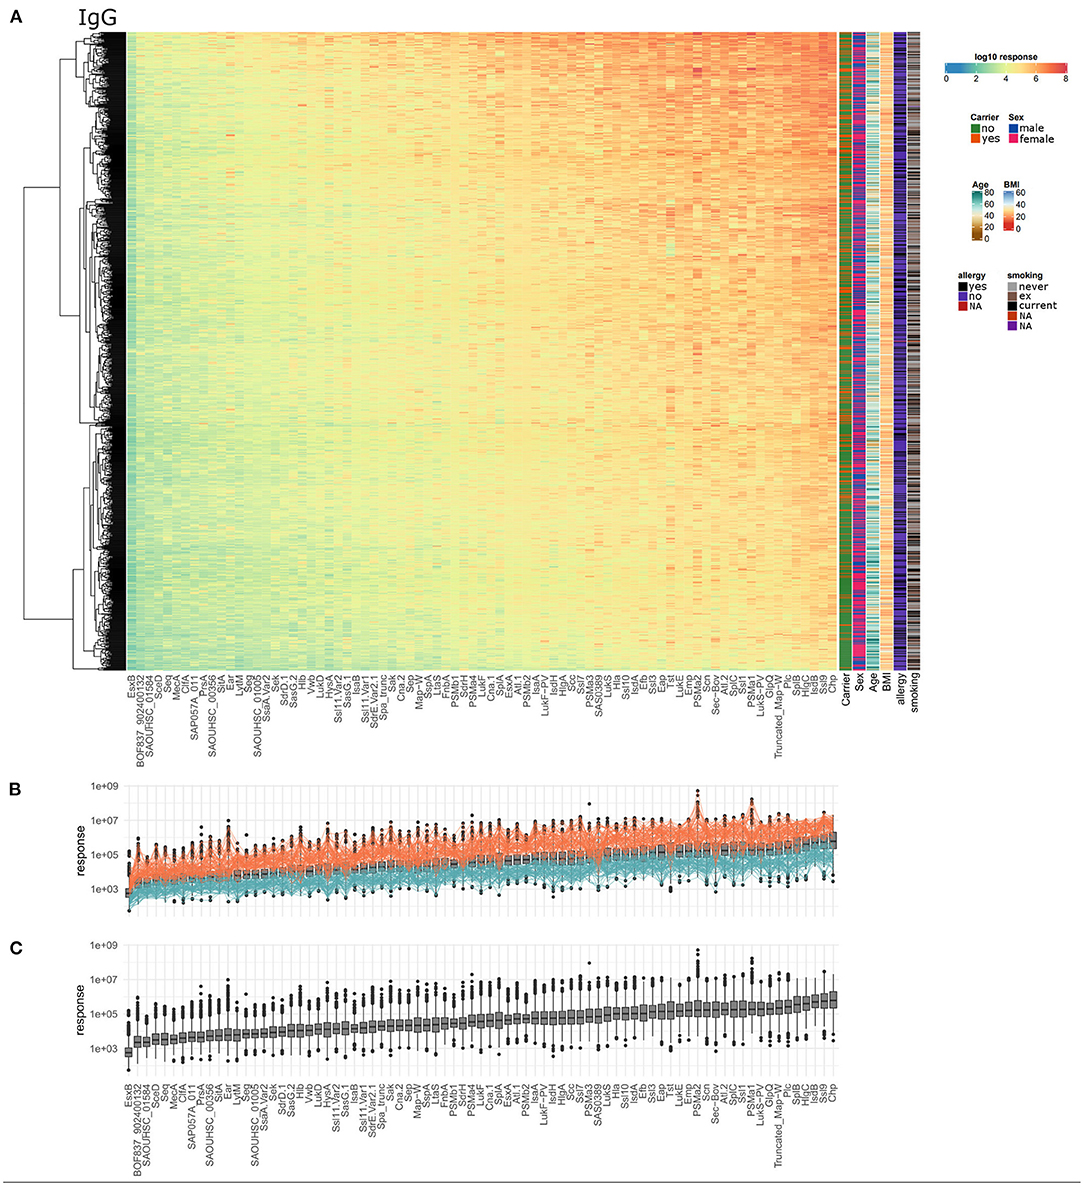
Figure 1. Serum IgG titers against S. aureus are highly variable with very large differences among the 996 tested individuals and also among the 79 included staphylococcal antigens. (A) The calculated IgG response values of all 996 individuals (y-axis) were plotted against the 79 antigens (x-axis) on a log10-transformed scale. Phenotypic information on the individuals is presented in additional columns on the right of the heatmap including carriage status, sex, age, BMI, allergy, and smoking. (B) Overview of overall high (orange) and overall low (petrol) responders, the calculated response is plotted as boxplot as in (C). (C) Ranking of the antigens according to the median specific IgG levels.
A group of 60 individuals can be considered as “overall low responders” showing antibody response values in the lower third for more than 80% of the included antigens. On the other side, 66 individuals had antibody responses in the upper third of the range of each antigen for more than 80% of the antigens and can therefore be termed “overall high responders” (Figure 1B). Remarkably, the groups of high and low responders comprised <7% of the cohort each, reflecting the extraordinary diversity of the antibody binding patterns to the 79 staphylococcal antigens. Since the nasal S. aureus carriage status had been determined microbiologically during the medical examination of the probands, we know that 25.2% (251/996) of the individuals were colonized with S. aureus at the time of blood sampling, while 73.6% (733/996) were not carrying detectable amounts of S. aureus in the nose (39). For 12 individuals no carriage information was available. Non-carriers were strongly enriched among low responders (56 non-carriers, 3 carriers, 1 unknown) as compared to the high responders (42 non-carriers, 24 carriers) (Fisher's exact test resulting in p = 1.8*10−5).
Next, we correlated the IgG response values of each antigen with several phenotypes, i e., S. aureus carriage, sex, smoking status, allergies, age, BMI, and blood glucose levels to identify determinants for high antibody levels. Notably, S. aureus carriers (n = 251) presented a higher mean antibody response than non-carriers (n = 733) against each single S. aureus antigen (Figure 2, left panel showing a volcano plot of ratio and adjusted p-value; the full antigen-wise depiction of all ratios is shown in Supplementary Figure 8; details in Supplementary Table 2). The maximum ratio was detected for Scc, with a 1.98-fold higher mean antibody response in carriers. The median ratio of all 79 antigens was 1.40 between carriers and non-carriers. For 74 antigens this difference in mean antibody responses was significant (see detailed information on all addressed phenotypes in Supplementary Table 2).
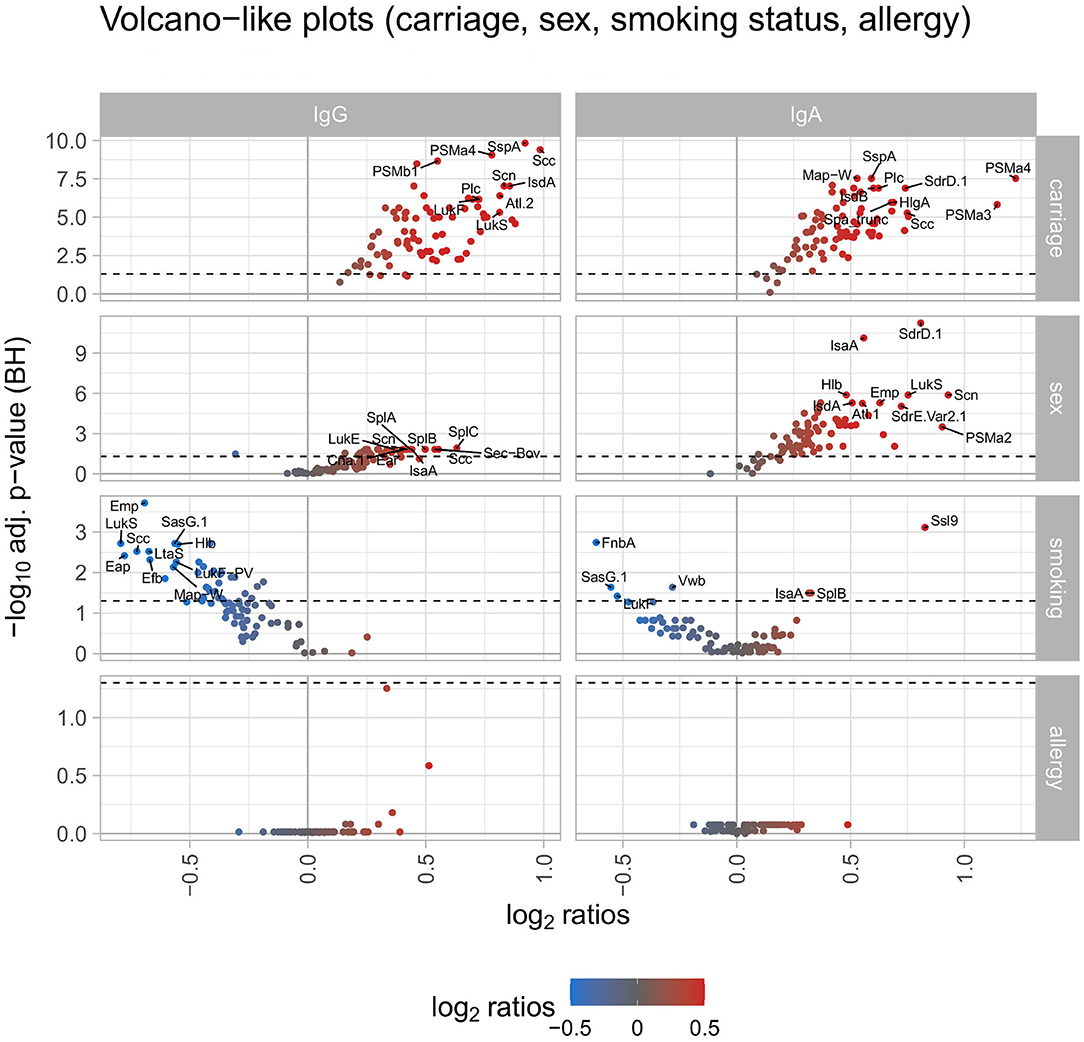
Figure 2. Volcano-like plots displaying the association of response values of antigens with carriage, sex, smoking, and allergy. For the categorical variables S. aureus carriage (carrier/non-carrier), sex (male/female), smoking (current smoker/non-smoker), and allergy (allergy/no allergy) the ratio was calculated between the means of each antigen and the p-value was derived from the Wilcoxon signed rank test. The Benjamini-Hochberg-adjusted p-values are depicted on the y-axis against the log2-ratios on the x-axis. The left column shows differences for IgG, the right column for IgA. The log2 ratio of 0 (no difference between the groups) is indicated as a solid vertical line. The significance threshold of 0.05 is indicated as a dotted line. The top 10 antigens showing the strongest associations in each comparison are labeled with the respective antigen's name. The color code displays associations from negative (blue) to positive (red).
A similar, though less pronounced effect was observed for males (n = 440) vs. females (n = 556). The mean antibody response for 68 antigens was higher in males than in females, for 26 antigens this difference was statistically significant. Of the 11 antigens with a higher mean IgG response in females, only one showed a significant result. To address the impact of smoking habits, the two extreme groups of current smokers (n = 219) vs. non-smokers (n = 419) were selected. The mean antibody response was higher in non-smokers for 75 antigens, a subgroup of 34 antigens reached statistical significance (Figure 2).
Correlating the antibody responses with the age of the study participants revealed declining anti-staphylococcal IgG values with increasing age for 69 antigens, with statistical significance for 61 antigens. The remaining 10 antigens showed an increase of antibody responses with increasing age with 6 of them reaching significance (namely SEQ, SEK, SasG.1, SAS0389, LukS-PV, LukF-PV). For BMI and serum glucose levels of the study participants the spline analysis resulted in similar findings: IgG binding to 66 antigens tended to decrease with increasing BMI as well as increasing serum glucose concentrations. Only two of those (namely Cna.1 and PSMb1) were significantly correlated within this group. For 10 antigens the antibody responses were increasing with the increase of BMI and serum glucose levels, the remaining 3 antigens showed trends in contrary directions for BMI and serum glucose levels (Figure 3).
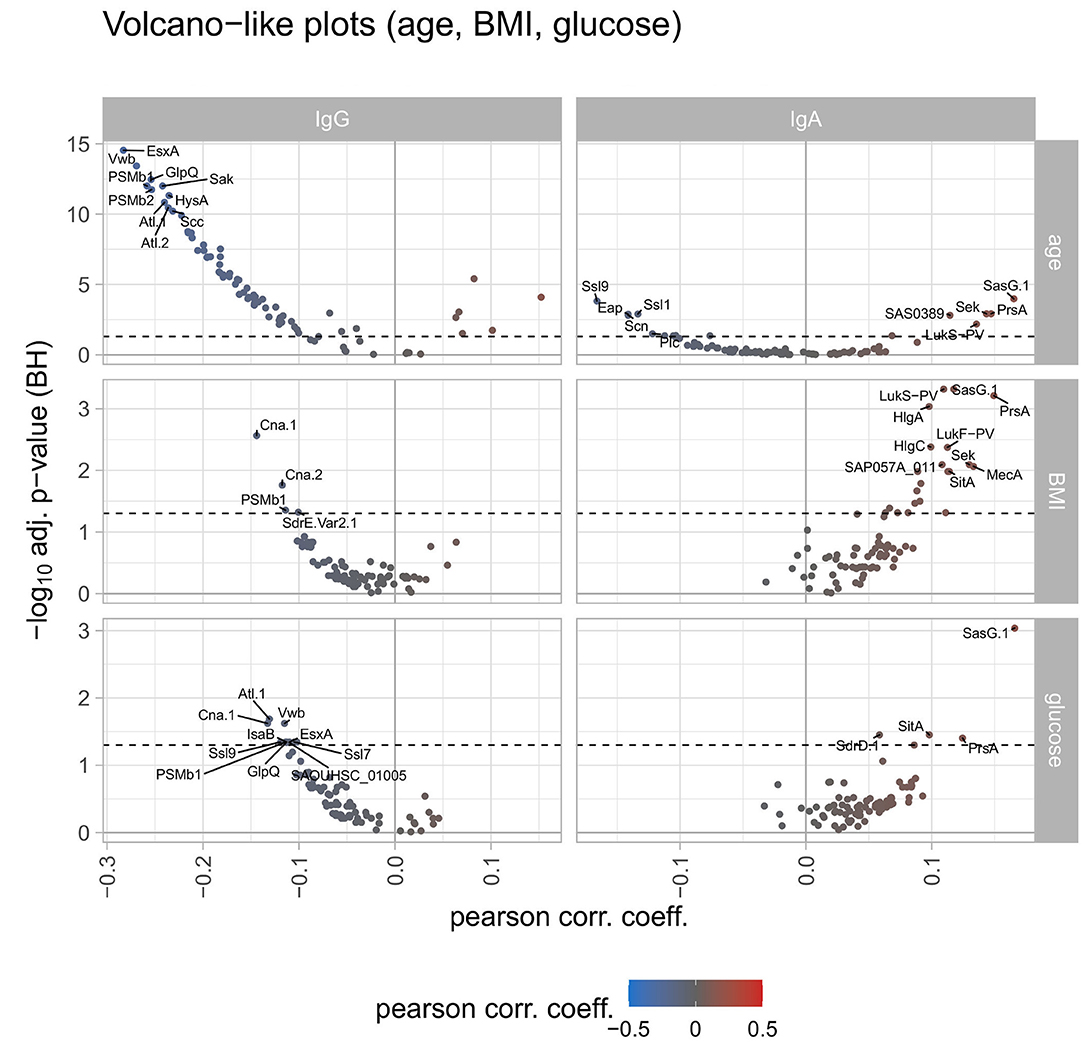
Figure 3. Volcano-like plots displaying the association of response values of antigens with age, BMI, and serum glucose. For the continuous variables age, BMI, and serum glucose levels a spline regression analysis was conducted followed by linear modeling to derive the Pearson correlation coefficient together with the p-value from the spline analysis. The Benjamini-Hochberg-adjusted p-values are depicted on the y-axis against the Pearson correlation coefficient on the x-axis. The left column shows differences for IgG, the right column for IgA. The log2 ratio of 0 (no difference between the groups) is indicated as a solid vertical line. The significance threshold of 0.05 is indicated as a dotted line. The top 10 antigens showing the strongest associations in each comparison are labeled with the respective antigen's name. The color code displays associations from negative (blue) to positive (red).
Finally, we tested whether allergies influence the anti-S. aureus IgG response. Using information from the anamnestic interview of the SHIP-TREND-0 cohort, individuals were grouped according to the presence (n = 301) or absence (n = 694) of a medical diagnosis of allergy. While there were no significant differences between the two groups, 57 antigens trended to elicit higher and 22 antigens lower antibody responses in the allergic compared to the non-allergic individuals (Figure 2).
In summary, high anti-staphylococcal IgG responses were strongly associated with S. aureus carriage and male sex, and inversely correlated with age. Smoking, BMI and blood glucose levels moderately influenced the anti-staphylococcal serum IgG response, while allergies did not play a role.
Similar to the anti-staphylococcal IgG response, the IgA response was very heterogeneous with regard to the tested healthy individuals and staphylococcal antigens. Anti-staphylococcal serum IgA was detected in every single individual, but the spectrum of recognized antigens and the IgA response values differed strongly (Figure 4A). The IgA response values ranged from 8.0*100 to 9.4*106, covering about six orders of magnitude. The average range of antibody response values per antigen was 3.3 orders of magnitude, with GlpQ showing the smallest variability (2.4 orders of magnitude) and SasG.1 the highest (4.5 orders of magnitude). The top five antigens with the highest median IgA antibody response were CHIPS, IsdB, Ssl7, Truncated Map-W, and Efb. The antigens showing the lowest median IgA responses were SAOUHSC_01584, SsaA.Var2, SceD, SitA, and EsxB on the last position. The highest overall detected response value in the IgA data set was 9.4*106 for CHIPS. The full data set is shown as a heatmap in Figure 4A, with the individual dilution plots included in Supplementary Figures 9–15.
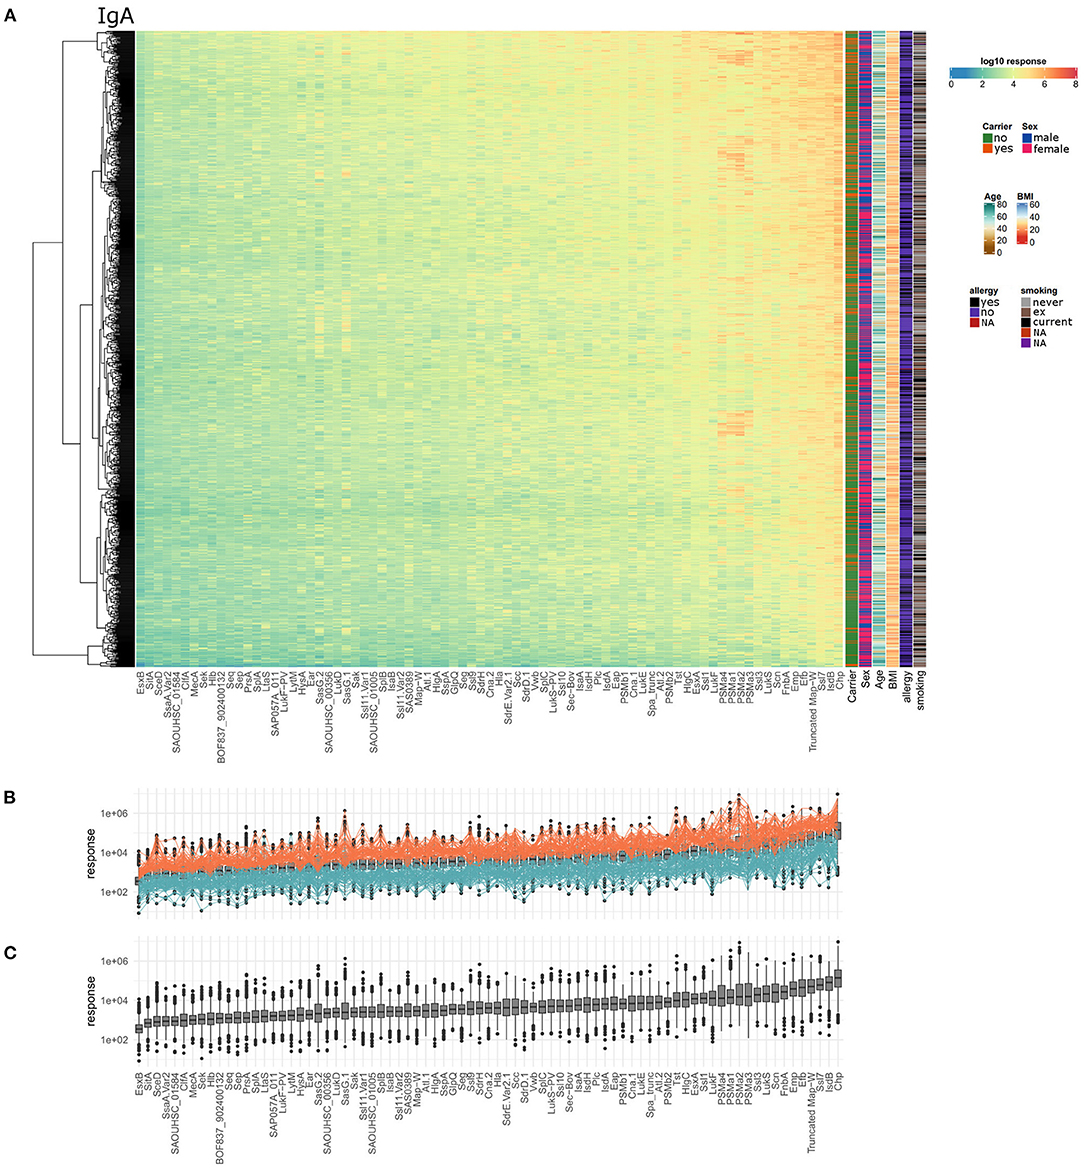
Figure 4. Serum IgA titers against S. aureus are highly variable with very large differences among the 996 tested individuals as well as the 79 included staphylococcal antigens. (A) The calculated IgA response values of all 996 individuals (y-axis) were plotted against the 79 antigens (x-axis) on a log10-transformed scale. Phenotypic information on the individuals was included in the additional columns on the right of the heatmap including carriage status, sex, age, BMI, allergy, and smoking. (B) Overview of overall high (orange) and overall low (petrol) responders, the calculated response is plotted as boxplot for all antigens and individuals, ordered with increasing median responses. (C) Ranking of the antigens according to IgA responses from all individuals.
Considering overall high and low responder groups for IgA, 59 individuals had response values in the upper third of the ranges for over 80% of the antigens (Figures 4B, 29 carriers, 29 non-carriers, 1 unknown). In one colonized individual, the antibody responses against all 79 antigens were within the upper third. At the lower end, 68 individuals had antibody response values in the lower third for more than 80% of the antigens (58 non-carriers, 9 carriers, 1 unknown). Thus, similar to the data obtained for IgG, S. aureus nasal carriers were overrepresented in the group of high responders (Fisher's exact test resulting in p = 0.0013).
Since IgA responses are triggered under different conditions than IgG responses, we aimed to identify determinants for strong anti-staphylococcal serum IgA responses using the same phenotypes as in 3.1.2. Similar to the IgG response, the serum IgA response was higher in carriers than non-carriers for each tested antigen and reached statistical significance for 75 antigens (Figure 2, right panel; antigen-wise depiction of all ratios in Supplementary Figure 16; details in Supplementary Table 3). The ratio between carriers and non-carriers was the largest for two PSMs, namely PSMα4 and PSMα3, with a ratio of 2.33 and 2.21, respectively. The median ratio was 1.37 considering all 79 antigens. Again, in line with the IgG response, the mean IgA responses against 78 antigens were higher in males than females, 68 of those differences reached statistical significance.
In contrast to IgG, smoking habits were only weakly related to the anti-staphylococcal IgA response. Thirty-six antigens elicited higher IgA responses in current smokers than in non-smokers, whereas the opposite was true for 43 antigens. Three of the antibody responses with increased levels in smokers were tested significant, four of the antigens with higher responses in non-smokers showed significance as well (Figure 2).
Serum IgA antibody titers did not generally decline with advanced age, which was also different from IgG. For 52 antigens we detected decreasing mean antibody responses with increasing age, with 9 antigens reaching significance. The opposite trend was observed for the remaining 27 antigens, with 6 antigens showing a significant increase with age (namely LtaS, SAS0389, LukS-PV, SEK, PrsA, and SasG.1). Contrary to the IgG response, the IgA response values increased for most antigens with increasing BMI and serum glucose levels. A total of 71 antigens had higher antibody responses for IgA for both parameters, with 21 antigens reaching significance for BMI and 4 antigens for serum glucose levels (overlap: 3 antigens) (Figure 3). In terms of reported allergies, no statistically significant differences were observed for IgA antibody responses against the staphylococcal antigens included in this study (Figure 2).
Since IgG and IgA responses are triggered under different conditions (bacterial invasion vs. mucosal challenge), we hypothesized that the overlap between the groups of high IgG and IgA responders as well as that between low IgG and IgA responders should be small. Indeed, only 21 individuals belonged to the group of low responders for IgG (total: 60 individuals, see results 3.1.1) as well as for IgA (total: 68 individuals, see results 3.2.1). Even more striking, the overlap between the groups of high IgG and IgA responders comprised only 8 individuals (IgG high responders: 66 individuals; IgA high responders: 59 individuals). This suggests that IgG and IgA responses are indeed independent.
As mentioned above, IgG and IgA responses reflect pathogen-host encounters in different micro-environmental niches where bacterial gene expression profiles and hence antigen release might differ strongly. Protein abundance, however, influences immunogenicity and antibody induction. Figure 5 depicts the ranking of the S. aureus antigens according to the median strength of antibody binding for IgG and IgA, those antigens already tested in vaccine trials are highlighted. In Figure 6 we compare the relative strength of antibody binding between IgG and IgA. CHIPS and EsxB make up the top and bottom end of the panel, with most antigens shifted toward higher median response values for IgG (below the blue dashed diagonal). SplB and Ssl9 elicited far more IgG than IgA, while in the case of FnbA and Ssl7, the IgA response was more prominent. A comparison of the ranking of all antigens can be found in Supplementary Table 4.
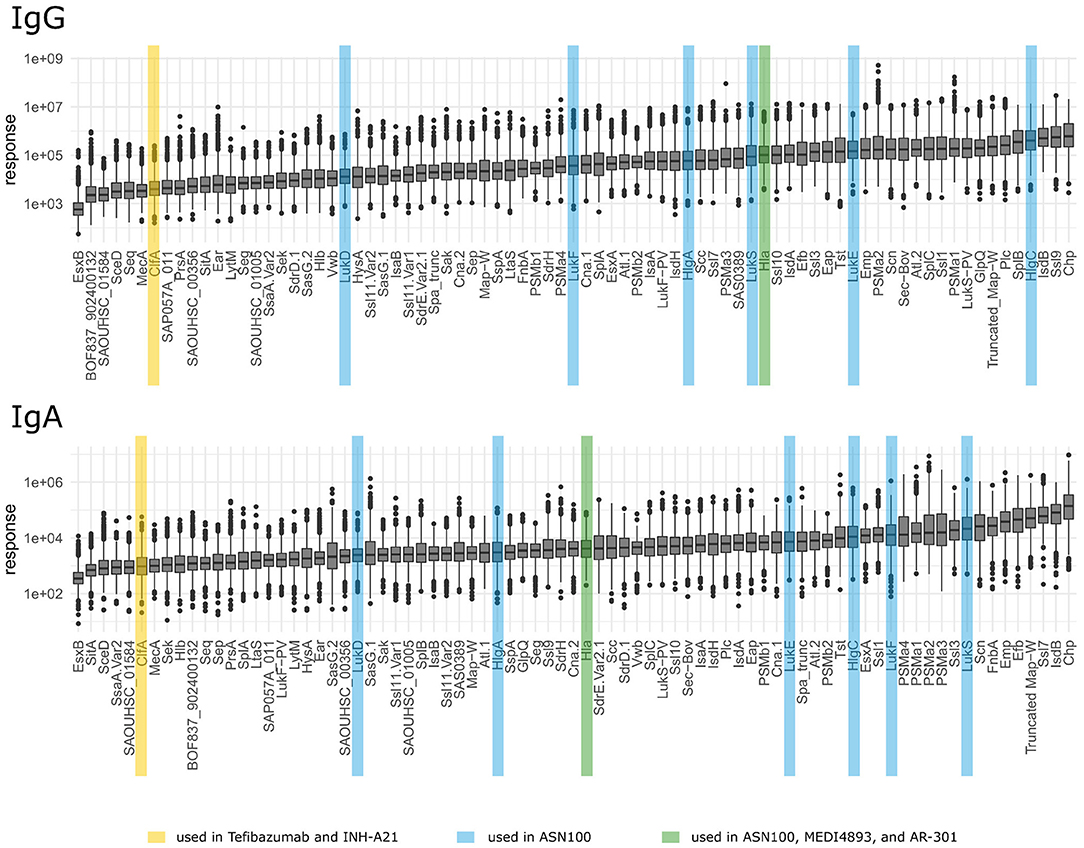
Figure 5. Ranking of antigens for IgG and IgA. Antigens used in vaccination studies before are highlighted by colors depending on the vaccine as explained in the bottom legend.
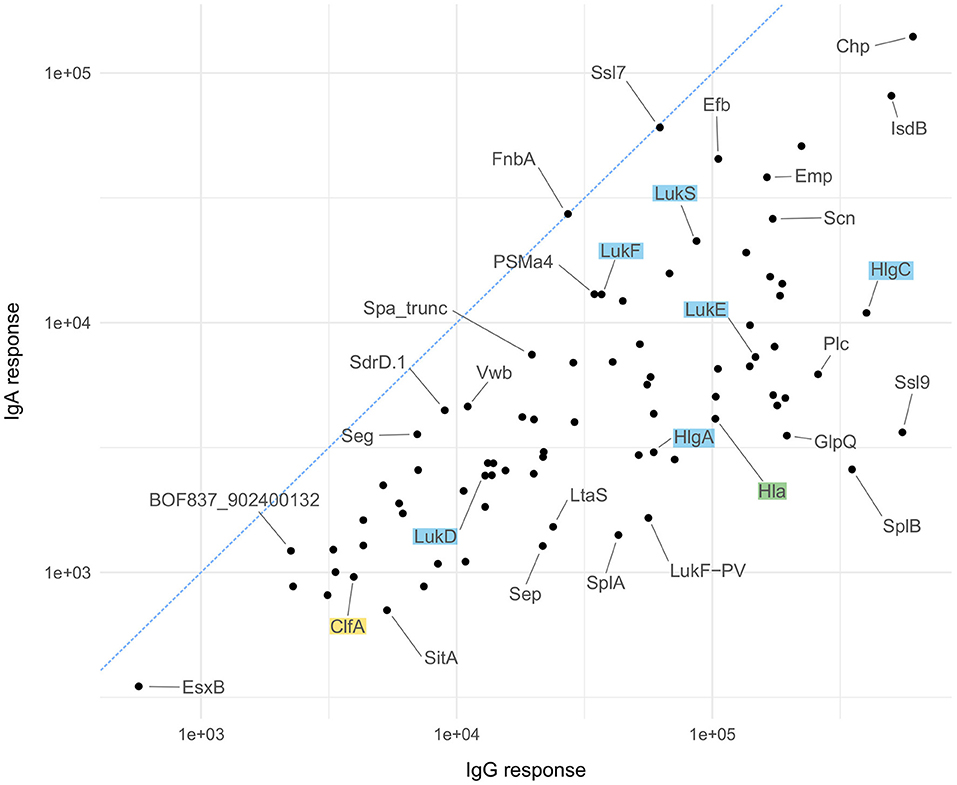
Figure 6. Antigen-wise comparison of IgG and IgA results. Comparison of median antibody responses between IgG (x-axis) and IgA (y-axis) for all 79 antigens. Candidates used in vaccination studies are highlighted in the same color scheme as explained for Figure 5.
The IgG and IgA response values correlated with several phenotypic traits, with marked variations between the two antibody classes (Figures 2, 3). To visualize commonalities and differences more clearly, the association of phenotypes with the antibody levels over all antigens was summarized in a principal component analysis (PCA) shown in Figure 7 for the first and second dimension and Supplementary Figures 17, 18 until the fifth dimension. For both IgG and IgA, S. aureus carriage was identified as the main determinant, whereas sex showed a larger impact on IgA compared to IgG. Age had an influence on IgG, but not on IgA. Smoking, BMI, serum glucose, and allergy had only minor influence on both antibody classes. We further analyzed the impact of the associated phenotypes depending on the dimension of the PCA (results shown in Supplementary Figure 19), with carriage as main influencing factor in the first dimension for IgG and IgA, followed by age in the third dimension.
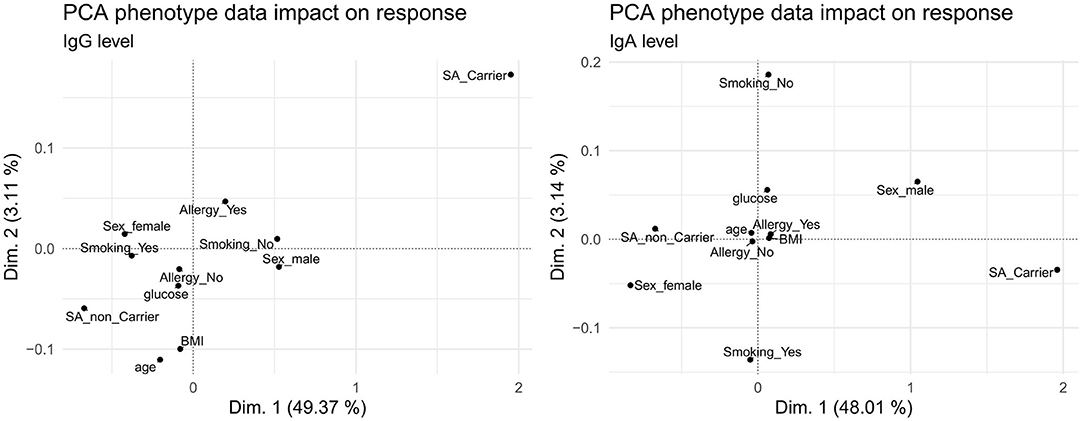
Figure 7. Principal component analysis of phenotype association with the overall IgG (left) and IgA (right) antibody response. In each panel, the first (x-axis) and second (y-axis) dimension are plotted against each other.
Given the correlations of the IgG and IgA response with certain phenotypes (Figures 2, 3), we next asked whether these were due to the same antigens in both cases. The results are shown in the Venn diagrams in Figure 8. We found the strongest overlap when comparing carriers with non-carriers because antigen-specific IgG and IgA binding was always stronger in carriers. In 72 antigens the difference reached statistical significance for both antibody classes. For sex differences 67 antigens showed increased responses in males for IgG and IgA, but with more significant results on the side of IgA. The opposite direction was found for increased responses in non-smokers with far more antigens showing statistically significant results for IgG compared to IgA. As allergy did not correlate with antibody binding to the bacterial antigens, there were no significant differences at all. Age, the BMI as well as serum glucose seemed to influence IgG more strongly than IgA; in all cases there was an inverse correlation between the phenotype parameters and the strength of antibody binding.
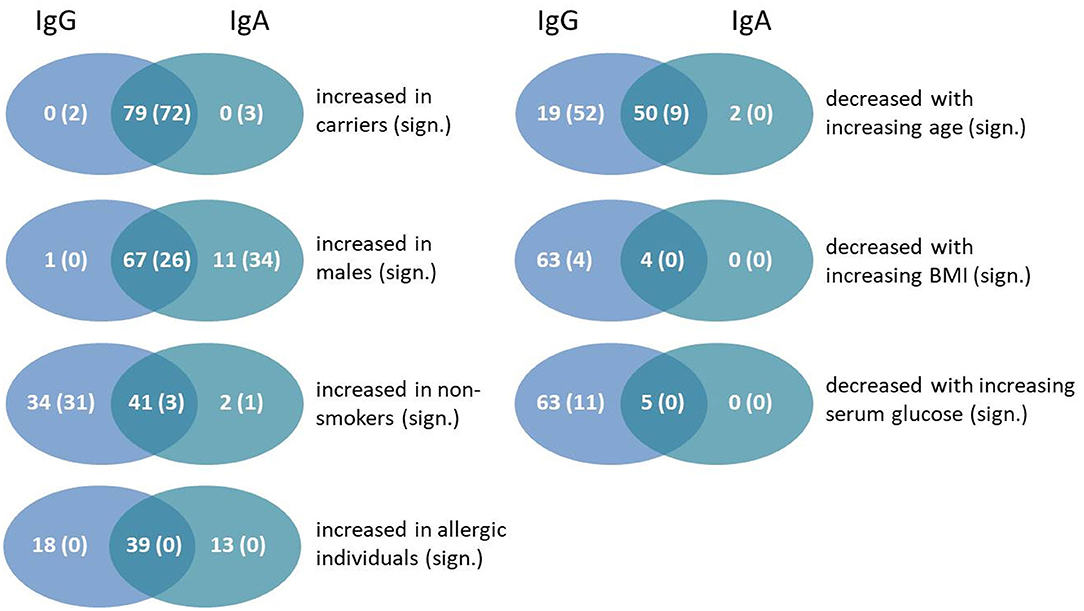
Figure 8. Venn diagrams showing the number and overlap of antigens showing an association of antibody responses values for IgG and IgA with particular phenotypes. The first number of each group gives the total amount of antigens with this characteristic, whereas the number in brackets includes only statistically significant numbers of antigens (Benjamini-Hochberg-adjusted p-value below 0.05).
We previously reported that S. aureus carriers mount a strain-specific antibody response against the superantigens produced by their colonizing strain with limited cross-reactivity to other superantigens (22). To re-evaluate this observation in our cohort, we took advantage of the genetic information that was available for a subset of 240 colonizing S. aureus isolates from this study cohort, which comprised the spa type, clonal complex, and presence of genes coding for the superantigens TSST-1 and the staphylococcal enterotoxins (39). To test for strain-specific antibody responses we compared anti-superantigen IgG and IgA profiles in individuals colonized with strains harboring or lacking the corresponding superantigen genes.
Carriers of tst-encoding S. aureus isolates (n = 48) showed a significantly higher IgG and IgA response against TSST-1 and also SEP than carriers of tst-negative isolates (n = 192) (Supplementary Figure 20). Similarly, individuals colonized with S. aureus strains harboring the pathogenicity island (SaPI1)-encoded superantigen genes sek and/or seq (n = 7 for sek/seq and n = 2 for seq alone) showed higher antibody responses for SEK, SEQ, and Ear, with Ssl1 additionally for individuals with seq-positive strains.
Surprisingly, there was no correlation between the occurrence of the sep gene and the SEP-specific antibody titers. This might be explained by a discrepancy between the sep allele amplified with our PCR and that encoding the recombinant SEP protein used for the measurement of antibody binding. The primer sequence for the genetic analysis was derived from strain S. aureus N315 (45), while the sep sequence of strain T0131 was used for recombinant protein expression. The two SEP-variants have only 77% sequence identity. Comparing the antibody titers of carriers colonized with strains equipped with sep to those without the gene the former showed significantly increased levels of antibodies against Ssl6 (SAS0389) and BOF837_902400132 for IgG and IgA, and additionally SplA, SplB, and SplC for IgA only.
This study provides a comprehensive overview on the S. aureus-specific antibody repertoire in a large population-based study, SHIP-TREND-0. Using a dilution series approach rather than single-point measurements allowed us to precisely quantify anti-staphylococcal antibodies in both low and high titer sera and to detect subtle differences [for details on the used method see (40)]. We mainly focused on extracellular antigens of S. aureus including both secreted and surface-associated proteins, since these are accessible to the humoral immune system when facing live bacterial cells and hence induce a strong antibody response (25). Antigens were derived from S. aureus NCTC8325 only, but there are numerous allelic variants in the species S. aureus. Studies of superantigens illustrate that the antibody response to S. aureus virulence factors has a strain-specific component (22, 46). However, superantigens are an extreme example of antigenic variability in S. aureus that exceeds allelic variation. Most antigens are more conserved than superantigens, and allelic variation usually affects only a small portion of an antigens. Thus, conserved antigens and epitopes likely dominate the (polyclonal) antibody response to S. aureus and therefore, the analysis of antigens from a selected, well-established strain, while not perfect, provides a reliable estimate of the immunodominance of S. aureus antigens.
Using available meta data we could pinpoint multiple factors correlating with the strength of the anti-staphylococcal antibody response in naturally exposed humans. Comparing our results to earlier studies, we corroborate the large inter-individual differences in the anti-staphylococcal antibody profiles that cannot be tracked down to single factors (36). Nevertheless, we report several factors such as smoking habits that have not been directly linked to reduced antibody levels until now, or BMI and serum glucose showing only small but distinct differences. Combining our antibody data with the genetic background information on the colonizing S. aureus strains we could show the impact of single staphylococcal antigens on the antibody response in individuals whose immune system is confronted with these proteins on a regular basis.
Both serum IgG and IgA titers against S. aureus were highly heterogeneous. Anti-staphylococcal IgG and IgA were detected in every single individual, albeit in highly variable quantity and composition. In this respect, our data confirm and extend previous studies (e g., 36) because we analyzed a large set of antigens (n = 79) and many individuals (n = 996). The highly individual antibody repertoire likely reflects the history of encounters with S. aureus. Indeed, we observed that carriers mount a specific response against the superantigens of their colonizing strains (namely TSST-1, SEK, and SEQ), which is in line with our previous observations (22). However, genetic variation between strains can make it hard to track down such correlations, as shown for SEP.
Using our highly sensitive multiplex approach, we were able to detect antibodies against all tested antigens. This emphasizes the ubiquitous nature of S. aureus. Likely, every individual encounters numerous S. aureus strains with very diverse antigen repertoires throughout their lifetime. This infers that even persistent S. aureus carriers are exposed to different S. aureus isolates, either by consecutive colonization with different isolates over the years, by co-colonization with multiple strains, or by infection with exogenous S. aureus strains (17, 46). In addition, antibody binding could reflect cross-reactivity to closely related antigens such as superantigens (47) and pore-forming toxins.
Even though anti-S. aureus antibodies obviously do not eliminate S. aureus from the nasal mucosa and do not reliably protect from infection, there is growing evidence that a strong immune memory, as reflected by high antibody titers, protects from severe S. aureus disease (23–25). Our data clearly show that around 6% of the tested individuals were low responders with antibody response values in the lower third of the binding range for more than 80% of the antigens. Based on our current knowledge, these individuals would be prone to a severe disease course in case of S. aureus infection. Tailored preventive or therapeutic measures, e g., decolonization, intravenous immunoglobulins (IVIG), and monoclonal antibodies could improve the outcome of such vulnerable patients in the future (48, 49).
The protective potential of anti-staphylococcal antibodies has been most convincingly shown for the superantigen-driven toxic shock syndrome (TSS). Anti-TSST-1 antibodies are highly prevalent in the Caucasian population (about 90%). Only people without detectable anti-TSST-1 antibodies are at risk of TSS, and symptoms can be treated by IVIG containing neutralizing antibodies (50, 51). Using the multiplex approach with seven serial dilutions of serum samples, we detected antibodies against TSST-1 in all samples (response values spanning from 7.5*102 to 1.3*107), pointing toward a higher assay sensitivity as compared to the ELISA used in earlier studies (51). This suggests that very low anti-TSST-1 antibody responses might not confer protection.
The quality of the antibody response to S. aureus depends on the nature of the encounter with the bacteria. Antibody responses in the mucosa are governed by IgA, with local mucosal titers being reflected in the systemic availability of specific monomeric IgA (28, 36), while invasive infections are controlled by IgG. This dichotomy is also reflected by our results. The ranking of antigens based on the median antibody response was similar for only 28 antigens, suggesting that different gene expression profiles are executed during mucosal encounters vs. systemic infection. Similarly, others also observed limited overlap in the anti-staphylococcal IgG and IgA response in healthy carriers and non-carriers (30, 36). CHIPS ranked first for both IgG and IgA as previously reported (36), implying a high immunogenicity of this immune evasion factor. Moreover, the overlap between high IgG vs. IgA responders was limited, suggesting that these immune response modes are indeed independent.
In this study, we used serum IgA as a surrogate marker for mucosal IgA production, because nasal secretions were not available. This approach is supported by growing evidence for a clonal relationship of serum IgA and mucosal IgA responses. For example, proteomic analyses of a celiac disease cohort identical antigen-binding regions of gluten-specific serum IgA and mucosal IgA (secreted by gut-derived plasma blasts) (28). This suggests that serum and mucosal IgA originate from the same B cell clones but are produced by individual plasmablasts in different locations. Indeed, several studies demonstrate that B cells activated in the gut immune system give rise to plasma cells that reside in the lamina propria and produce dimeric IgA for transport across the epithelium as well as an equivalent population of plasma cells that migrate to the bone marrow and secrete monomeric IgA into the circulation (28, 52–54). Hence, serum monomeric IgA can serve as a proxy for the hardly accessible secretory dimeric IgA of mucosae (28). In line with this, it has already been shown by Verkaik et al. (36) that for staphylococcal antigens serum antibody titers of IgG and IgA can be correlated to those in the nasal secretion.
Carrying S. aureus as part of a healthy human microbiome has long been suspected to increase the amount of anti-staphylococcal antibodies due to repeated minor invasive episodes caused by the colonizing strain (36). With our data we support this notion. All antigen-specific antibody responses were stronger in carriers than in non-carriers, in most cases significantly. With ratios of 1.10–1.98 between the mean responses of the carrier group vs. the non-carrier group the direction of the trend is very clear. However, the effect size of carriage was minute compared to the variability of the individual antibody response to each antigen.
Men had on average higher anti-S. aureus antibody levels than women, both IgG and IgA. This is unusual because generally women produce higher antibody levels than men. Klein and Flanagan reviewed multiple features of immunity in humans influenced by biological sex (55). Combining the results of many studies, they concluded that regardless of age, females tend to show stronger antibody responses than males, with higher basal levels of immunoglobulin and increased B cell numbers (55). The more pronounced antibody response to S. aureus antigens in men could be explained by their more extensive exposure to the bacteria. Using culture-based detection methods, men tended to have higher colonization rates than females (12). DNA sequencing, however, revealed overall higher colonization rates (53%) that were equal for men and women (13). This discrepancy can be explained by a 10–100-fold higher absolute abundance of S. aureus in men and its influence on culture outcomes. This higher bacterial load is probably the main reason for the consistently higher anti-staphylococcal antibody levels in men. In our study cohort we reported a culture-based carriage rate of 27.0 vs. 24.3% for males and females, respectively, but according to Liu et al. (13) we might have failed to detect carriers with low bacterial loads, especially among female study participants (39).
Only the IgG responses consistently decreased with age. Regarding IgA, there was no clear trend; antibody binding to two thirds of the antigens decreased with age, the remainder showed the opposite trend. The decline in specific IgG titers could reflect a gradual decline of the adaptive immune functions with age, called immunosenescence. It diminishes the host's ability to clear pathogens and also to develop long-term memory to vaccination. This results in a steady increase of the incidence of infections with age in the elderly. In the humoral immune system alterations in the B cell repertoire and subcompartment distribution, as well as defects in B lymphopoiesis, cell development and homeostasis are observed. These lead to reduced pathogen-specific antibodies in the elderly [reviewed in (56, 57)]. Since age-dependent analyses of the B cell response and antibody repertoires against S. aureus have not been performed yet, it remains to be shown which features of immune aging are responsible for the decline in S. aureus-specific antibody levels. S. aureus colonization rates also decrease with increasing age in humans, which is counterintuitive considering the decreasing antibody levels. A noteworthy exception from this general trend are two matching candidate antigens namely LukF-PV and LukS-PV where antibody titres increased with age. The genes for the pore-forming toxin Luk-PV are very rare in colonization strains in our cohort; they are carried by only 0.1% of the nasal isolates. Probably age groups face different strains because of their different lifestyle; e g., contacts at work or in health care facilities. Long-term observational studies correlating the changes in the antibody repertoire with challenges by various strains with distinct sets of mobile genetic elements are required to assess the impact of such factors.
Besides sex and age, we included additional lifestyle factors in our study, revealing even more pieces of influence on the anti-staphylococcal antibody repertoire in the puzzle of individual variability. Obesity, chronic diseases of the skin (e g., atopic eczema), but also smoking habits have been shown to alter colonization rates (7, 11, 14). With our data we could show that BMI, elevated serum glucose, and regular smoking impact on the antibody levels against staphylococcal antigens, while medically diagnosed allergies did not play a role.
Elevated BMI and serum glucose levels were inversely correlated with antibody responses against most of the included antigens. This may be due to the impaired function of the adaptive immunity in obese people already described in the context of vaccination against hepatitis and influenza [reviewed in (58)]. We found the opposite trend in our IgA measurements: antibodies to most antigens increased with increasing BMI or serum glucose. This falls in line with the observation of a higher S. aureus colonization rate in obese individuals and patients with diabetes than in healthy individuals (59). The higher challenge to the immune system of the nasopharyngeal mucosa could trigger more IgA secretion.
Smoking has been described to alter the nasal microbiome and decrease the S. aureus colonization rate in humans (14). Interestingly smoking was associated with lower specific IgG levels, while for IgA no clear trend could be observed. Higher anti-Ssl9 and lower anti-FnbA levels in current smokers were sticking out. Obviously, there must be other factors besides colonization that influence the systemic (IgG) and local (IgA) immune response to S. aureus.
Our analyses have implications for vaccine development against S. aureus. The selection of vaccine targets needs to consider their relevance in different staphylococcal diseases, prevalence in clinical isolates but also the pre-existing immunity in the population and the quality of the immune response that is generated during infection. Judging by the broad range of the median antibody response values observed in this healthy cohort that is spanning several orders of magnitude, selecting vaccine targets with a low pre-existing response may improve vaccine efficacy. Notably, past and current vaccine candidates strongly differ in their natural immunogenicity, with rather low antibody levels against ClfA (passive vaccine Tefibazumab) (60), and intermediate to high antibody levels against pore-forming toxins (Hla, HlgBC, LukED, LukSF, LukS-PV) (34, 61). However, the huge interindividual variation in antibody titers that cover several orders of magnitude suggests that a considerable proportion of individuals lacks protective antibody levels even against the highly immunogenic bacterial proteins. These would benefit from vaccination. Besides active vaccination, passive vaccination approaches might help to overcome this problem in the future: monoclonal antibody cocktails could be individualized by factoring in the virulence factor repertoire of the invasive strain as well as the antibody profile of the patient.
The raw data supporting the conclusions of this article will be made available by the authors, without undue reservation.
The studies involving human participants were reviewed and approved by The Clinical Ethics Committee University Medicine Greifswald, Greifswald, Germany. The patients/participants provided their written informed consent to participate in this study.
TM, SH, FS, HV, BB, and UV: conceptualization. TM, SM, SH, NF, TK, and CK: data generation. TM, SM, SH, SW, NF, BB, and UV: data analysis. TM, SM, SH, BB, and UV: writing-original draft. TM, SM, SH, SW, NF, HV, TK, CK, FS, BB, and UV: writing-review and editing. BB and UV: project administration and funding. All authors: have read and agreed to the published version of the manuscript.
The study was supported by grants of the DFG within the SFB-TR34 (project C16) and by the European Social Fund, Card-ii-Omics, ESF/14-BMA55-0037/16.
The authors declare that the research was conducted in the absence of any commercial or financial relationships that could be construed as a potential conflict of interest.
We like to thank Sophie Eisenlöffel for excellent technical assistance and Isabelle Bekeredjian-Ding (Division of Microbiology, Paul-Ehrlich-Institut) for providing the plasmid for expression of truncated, non-functional Protein A (Spa_trunc).
The Supplementary Material for this article can be found online at: https://www.frontiersin.org/articles/10.3389/fimmu.2021.651619/full#supplementary-material
1. Gagliotti C, Balode A, Baquero F, Degener J, Grundmann H, Gür D, et al. Escherichia coli and Staphylococcus aureus: bad news and good news from the European Antimicrobial Resistance Surveillance Network (EARS-Net, formerly EARSS), 2002 to (2009). Euro Surveillance. (2011) 16:19819. doi: 10.2807/ese.16.11.19819-en
2. Chiller K, Selkin BA, Murakawa GJ. Skin microflora and bacterial infections of the skin. J Investig Dermatol Symp Proc. (2001) 6:170–4. doi: 10.1046/j.0022-202x.2001.00043.x
3. Noskin GA, Rubin RJ, Schentag JJ, Kluytmans J, Hedblom EC, Jacobson C, et al. National trends in Staphylococcus aureus infection rates: impact on economic burden and mortality over a 6-year period (1998-2003). Clin Infect Dis. (2007) 45:1132–40. doi: 10.1086/522186
4. Kluytmans J, van Belkum A, Verbrugh H. Nasal carriage of Staphylococcus aureus: epidemiology, underlying mechanisms, associated risks. Clin Microbiol Rev. (1997) 10:505–20. doi: 10.1128/CMR.10.3.505
5. van Belkum A, Verkaik NJ, de Vogel CP, Boelens HA, Verveer J, Nouwen JL, et al. Reclassification of Staphylococcus aureus nasal carriage types. J Inf Dis. (2009) 199:1820–6. doi: 10.1086/599119
6. Breuer K, Häussler S, Kapp A, Werfel T. Staphylococcus aureus: colonizing features and influence of an antibacterial treatment in adults with atopic dermatitis. Brit J Dermatol. (2002) 147:55–61. doi: 10.1046/j.1365-2133.2002.04872.x
7. Clausen ML, Edslev SM, Andersen PS, Clemmensen K, Krogfelt KA, Agner T. Staphylococcus aureus colonization in atopic eczema and its association with filaggrin gene mutations. Brit J Dermatol. (2017) 177:1394–400. doi: 10.1111/bjd.15470
8. Sivaraman K, Venkataraman N, Cole AM. Staphylococcus aureus nasal carriage and its contributing factors. Future Microbiol. (2009) 4:999–1008. doi: 10.2217/fmb.09.79
9. Sollid JU, Furberg AS, Hanssen AM, Johannessen M. Staphylococcus aureus: determinants of human carriage. infection, genetics and evolution. J Mol Epidemiol Evol Genet Inf Dis. (2014) 21:531–41. doi: 10.1016/j.meegid.2013.03.020
10. Peacock SJ, Justice A, Griffiths D, de Silva GD, Kantzanou MN, Crook D, et al. Determinants of acquisition and carriage of Staphylococcus aureus in infancy. J Clin Microbiol. (2003) 41:5718–25. doi: 10.1128/JCM.41.12.5718-5725.2003
11. Gorwitz RJ, Kruszon-Moran D, McAllister SK, McQuillan G, McDougal LK, Fosheim GE, et al. Changes in the prevalence of nasal colonization with Staphylococcus aureus in the United States, 2001-2004. J Inf Dis. (2008) 197:1226–34. doi: 10.1086/533494
12. Erikstrup LT, Dinh KM, Andersen PS, Skov RL, Kaspersen KA, Nielsen KR, et al. Cohort description: the danish blood donor Staphylococcus aureus carriage study. Clin Epidemiol. (2019) 11:885–900. doi: 10.2147/CLEP.S218637
13. Liu CM, Price LB, Hungate BA, Abraham AG, Larsen LA, Christensen K, et al. Staphylococcus aureus and the ecology of the nasal microbiome. Sci Adv. (2015) 1:e1400216. doi: 10.1126/sciadv.1400216
14. Nouwen JL. Determinants, Risks & Dynamics of Staphylococcus aureus Nasal Carriage. (dissertation) Rotterdam, NL: Erasmus Universiteit Rotterdam (2004).
15. Olsen K, Falch BM, Danielsen K, Johannessen M, Ericson Sollid JU, Thune I, et al. Staphylococcus aureus nasal carriage is associated with serum 25-hydroxyvitamin D levels, gender and smoking status. the Tromsø Staph and Skin Study. Eur J Clin Microbiol Inf Dis. (2012) 31:465–73. doi: 10.1007/s10096-011-1331-x
16. Ritchie SR, Isdale E, Priest P, Rainey PB, Thomas MG. The turnover of strains in intermittent and persistent nasal carriers of Staphylococcus aureus. J Infect. (2016) 72:295–301. doi: 10.1016/j.jinf.2015.12.010
17. Votintseva AA, Miller RR, Fung R, Knox K, Godwin H, Peto TE, et al. Multiple-strain colonization in nasal carriers of Staphylococcus aureus. J Clin Microbiol. (2014) 52:1192–200. doi: 10.1128/JCM.03254-13
18. Pujol M, Peña C, Pallares R, Ariza J, Ayats J, Dominguez MA, et al. Nosocomial Staphylococcus aureus bacteremia among nasal carriers of methicillin-resistant and methicillin-susceptible strains. Am J Med. (1996) 100:509–16. doi: 10.1016/S0002-9343(96)00014-9
19. von Eiff C, Becker K, Machka K, Stammer H, Peters G. Nasal carriage as a source of Staphylococcus aureus bacteremia. study group. New England J Med. (2001) 344:11–16. doi: 10.1056/NEJM200101043440102
20. Wertheim HF, Vos MC, Ott A, van Belkum A, Voss A, Kluytmans JA, et al. Risk and outcome of nosocomial Staphylococcus aureus bacteraemia in nasal carriers versus non-carriers. Lancet. (2004) 364:703–5. doi: 10.1016/S0140-6736(04)16897-9
21. Holtfreter S, Kolata J, Bröker BM. Towards the immune proteome of Staphylococcus aureus- The anti-S. aureus antibody response. Intern J Med Microbiol. (2010) 300:176–92. doi: 10.1016/j.ijmm.2009.10.002
22. Holtfreter S, Roschack K, Eichler P, Eske K, Holtfreter B, Kohler C, et al. Staphylococcus aureus carriers neutralize superantigens by antibodies specific for their colonizing strain: a potential explanation for their improved prognosis in severe sepsis. J Inf Dis. (2006) 193:1275–8. doi: 10.1086/503048
23. Adhikari RP, Ajao AO, Aman MJ, Karauzum H, Sarwar J, Lydecker AD, et al. Lower antibody levels to Staphylococcus aureus exotoxins are associated with sepsis in hospitalized adults with invasive S. aureus infections. J Infect Dis. (2012) 206:915–23. doi: 10.1093/infdis/jis462
24. Fritz SA, Tiemann KM, Hogan PG, Epplin EK, Rodriguez M, Al-Zubeidi DN, et al. A serologic correlate of protective immunity against community-onset Staphylococcus aureus infection. Clin Infect Dis. (2013) 56:1554–61. doi: 10.1093/cid/cit123
25. Stentzel S, Sundaramoorthy N, Michalik S, Nordengrün M, Schulz S, Kolata J, et al. Specific serum IgG at diagnosis of Staphylococcus aureus bloodstream invasion is correlated with disease progression. J Prot. (2015) 128:1–7. doi: 10.1016/j.jprot.2015.06.018
26. Leong KW, Ding JL. The unexplored roles of human serum IgA. DNA Cell Biol. (2014) 33:823–9. doi: 10.1089/dna.2014.2639
27. Cerutti A, Cols M, Gentile M, Cassis L, Barra CM, He B, et al. Regulation of mucosal IgA responses: lessons from primary immunodeficiencies. Ann New York Acad Sci. (2011) 1238:132–44. doi: 10.1111/j.1749-6632.2011.06266.x
28. Iversen R, Snir O, Stensland M, Kroll JE, Steinsbø Ø, Korponay-Szabó IR, et al. Strong clonal relatedness between serum and Gut IgA despite different plasma cell origins. Cell Rep. (2017) 20:2357–67. doi: 10.1016/j.celrep.2017.08.036
29. Jiang D, Ge J, Liao Q, Ma J, Liu Y, Huang J, et al. IgG and IgA with potential microbial-binding activity are expressed by normal human skin epidermal cells. Int J Mol Sci. (2015) 16:2574–90. doi: 10.3390/ijms16022574
30. Dryla A, Prustomersky S, Gelbmann D, Hanner M, Bettinger E, Kocsis B, et al. Comparison of antibody repertoires against Staphylococcus aureus in healthy individuals and in acutely infected patients. Clin Diag Lab Immunol. (2005) 12:387–98. doi: 10.1128/CDLI.12.3.387-398.2005
31. Proctor RA. Is there a future for a Staphylococcus aureus vaccine? Vaccine. (2012) 30:2921–7. doi: 10.1016/j.vaccine.2011.11.006
32. Miller LS, Fowler VG, Shukla SK, Rose WE, Proctor RA. Development of a vaccine against Staphylococcus aureus invasive infections: evidence based on human immunity, genetics and bacterial evasion mechanisms. FEMS Microbiol Rev. (2020) 44:123–53. doi: 10.1093/femsre/fuz030
33. Fowler VG, Allen KB, Moreira ED, Moustafa M, Isgro F, Boucher HW, et al. Effect of an investigational vaccine for preventing Staphylococcus aureus infections after cardiothoracic surgery: a randomized trial. JAMA. (2013) 309:1368–78. doi: 10.1001/jama.2013.3010
34. Rouha H, Badarau A, Visram ZC, Battles MB, Prinz B, Magyarics Z, et al. Five birds, one stone: neutralization of α-hemolysin and 4 bi-component leukocidins of Staphylococcus aureus with a single human monoclonal antibody. mAbs. (2015) 7:243–54. doi: 10.4161/19420862.2014.985132
35. Bosi E, Monk JM, Aziz RK, Fondi M, Nizet V, Palsson BØ. Comparative genome-scale modelling of Staphylococcus aureus strains identifies strain-specific metabolic capabilities linked to pathogenicity. Proc Nat Acad Sci USA. (2016) 113:E3801–E9. doi: 10.1073/pnas.1523199113
36. Verkaik NJ, de Vogel CP, Boelens HA, Grumann D, Hoogenboezem T, Vink C, et al. Anti-staphylococcal humoral immune response in persistent nasal carriers and noncarriers of Staphylococcus aureus. J Inf Dis. (2009) 199:625–32. doi: 10.1086/596743
37. Rigat F, Bartolini E, Dalsass M, Kumar N, Marchi S, Speziale P, et al. Retrospective identification of a broad IgG repertoire differentiating patients with S. aureus skin and soft tissue infections from controls. Front Immunol. (2019) 10:114. doi: 10.3389/fimmu.2019.00114
38. Völzke H, Alte D, Schmidt CO, Radke D, Lorbeer R, Friedrich N, et al. Cohort profile: the study of health in Pomerania. Int J Epidemiol. (2011) 40:294–307. doi: 10.1093/ije/dyp394
39. Holtfreter S, Grumann D, Balau V, Barwich A, Kolata J, Goehler A, et al. Molecular epidemiology of Staphylococcus aureus in the general population in northeast germany: results of the study of health in pomerania (SHIP-TREND-0). J Clin Microbiol. (2016) 54:2774–85. doi: 10.1128/JCM.00312-16
40. Meyer TC, Schmidt F, Steinke J, Bröker BM, Völker U, Michalik S. Technical report: xMAPr - High-dynamic-range (HDR) quantification of antigen-specific antibody binding. J Prot. (2020) 212:103577. doi: 10.1016/j.jprot.2019.103577
41. R Core Team. R: A Language and Environment for Statistical Computing. R Foundation for Statistical Computing. Vienna (2017). Available online at: https://www.R-project.org/ (accessed September 01, 2021).
42. RStudio Team. RStudio: Integrated Development for RStudio R, PBC. Boston, MA (2020). Available online at: http://www.rstudio.com/
43. Wickham H, Averick M, Bryan J, Chang W, D'Agostino McGowan L, François R, et al. Welcome to the tidyverse. Journal of Open Source Software. Journal of Open Source Software. (2019) 4:1686. doi: 10.21105/joss.01686
44. Benjamini Y, Hochberg Y. Controlling the false discovery rate: a practical and powerful approach to multiple testing. J Royal Statistical Soc Series B. (1995) 57:289–300. doi: 10.1111/j.2517-6161.1995.tb02031.x
45. Holtfreter S, Grumann D, Schmudde M, Nguyen HT, Eichler P, Strommenger B, et al. Clonal distribution of superantigen genes in clinical Staphylococcus aureus isolates. J Clin Microbiol. (2007) 45:2669–80. doi: 10.1128/JCM.00204-07
46. Kolata J, Bode LG, Holtfreter S, Steil L, Kusch H, Holtfreter B, et al. Distinctive patterns in the human antibody response to Staphylococcus aureus bacteremia in carriers and non-carriers. Proteomics. (2011) 11:3914–27. doi: 10.1002/pmic.201000760
47. Bavari S, Ulrich RG, LeClaire RD. Cross-reactive antibodies prevent the lethal effects of Staphylococcus aureus superantigens. J Inf Dis. (1999) 180:1365–9. doi: 10.1086/314977
48. Diep BA, Le VT, Badiou C, Le HN, Pinheiro MG, Duong AH, et al. IVIG-mediated protection against necrotizing pneumonia caused by MRSA. Sci Transl Med. (2016) 8:357ra124. doi: 10.1126/scitranslmed.aag1153
49. Raafat D, Otto M, Reppschläger K, Iqbal J, Holtfreter S. Fighting Staphylococcus aureus biofilms with monoclonal antibodies. Trends Microbiol. (2019) 27:303–22. doi: 10.1016/j.tim.2018.12.009
50. Xu SX, McCormick, JK. Staphylococcal superantigens in colonization and disease. Front Cell Infection Microbiol. (2012). 2:52. doi: 10.3389/fcimb.2012.00052
51. Parsonnet J, Goering RV, Hansmann MA, Jones MB, Ohtagaki K, Davis CC, et al. Prevalence of toxic shock syndrome toxin 1 (TSST-1)-producing strains of Staphylococcus aureus and antibody to TSST-1 among healthy Japanese women. J Clin Microbiol. (2008) 46:2731–8. doi: 10.1128/JCM.00228-08
52. Mei HE, Yoshida T, Sime W, Hiepe F, Thiele K, Manz RA, et al. Blood-borne human plasma cells in steady state are derived from mucosal immune responses. Blood. (2009) 113:2461–9. doi: 10.1182/blood-2008-04-153544
53. Bemark M, Hazanov H, Stromberg A, Komban R, Holmqvist J, Koster S, et al. Limited clonal relatedness between gut IgA plasma cells and memory B cells after oral immunization. Nat Commun. (2016) 7:12698. doi: 10.1038/ncomms12698
54. Lemke A, Kraft M, Roth K, Riedel R, Lammerding D, Hauser AE. Long-lived plasma cells are generated in mucosal immune responses and contribute to the bone marrow plasma cell pool in mice. Mucosal Immunol. (2016) 9:83–97. doi: 10.1038/mi.2015.38
55. Klein SL, Flanagan KL. Sex differences in immune responses. Nature Rev Immunol. (2016) 16:626–38. doi: 10.1038/nri.2016.90
56. Kogut I, Scholz JL, Cancro MP, Cambier JC. B cell maintenance and function in aging. Sem Immunol. (2012) 24:342–9. doi: 10.1016/j.smim.2012.04.004
57. Pinti M, Appay V, Campisi J, Frasca D, Fülöp T, Sauce D, et al. Aging of the immune system: Focus on inflammation and vaccination. Eur J Immunol. (2016) 46:2286–301. doi: 10.1002/eji.201546178
58. Painter SD, Ovsyannikova IG, Poland GA. The weight of obesity on the human immune response to vaccination. Vaccine. (2015) 33:4422–9. doi: 10.1016/j.vaccine.2015.06.101
59. Olsen K, Danielsen K, Wilsgaard T, Sangvik M, Sollid JU, Thune I, et al. Obesity and Staphylococcus aureus nasal colonization among women and men in a general population. PLoS ONE. (2013) 8:e63716. doi: 10.1371/journal.pone.0063716
60. Weems JJ Jr, Steinberg JP, Filler S, Baddley JW, Corey GR, Sampathkumar P, et al. Phase II. randomized, double-blind, multicenter study comparing the safety and pharmacokinetics of tefibazumab to placebo for treatment of Staphylococcus aureus bacteremia. Ant Agents Chem. (2006) 50:2751–5. doi: 10.1128/AAC.00096-06
Keywords: S. aureus, host-pathogen-interaction, antibody repertoire, anti-S. aureus IgG response, anti-S. aureus IgA response, immunoproteomics
Citation: Meyer TC, Michalik S, Holtfreter S, Weiss S, Friedrich N, Völzke H, Kocher T, Kohler C, Schmidt F, Bröker BM and Völker U (2021) A Comprehensive View on the Human Antibody Repertoire Against Staphylococcus aureus Antigens in the General Population. Front. Immunol. 12:651619. doi: 10.3389/fimmu.2021.651619
Received: 10 January 2021; Accepted: 16 February 2021;
Published: 10 March 2021.
Edited by:
Rachel McLoughlin, Trinity College Dublin, IrelandReviewed by:
Dolores Correa, Anahuac University of North Mexico, MexicoCopyright © 2021 Meyer, Michalik, Holtfreter, Weiss, Friedrich, Völzke, Kocher, Kohler, Schmidt, Bröker and Völker. This is an open-access article distributed under the terms of the Creative Commons Attribution License (CC BY). The use, distribution or reproduction in other forums is permitted, provided the original author(s) and the copyright owner(s) are credited and that the original publication in this journal is cited, in accordance with accepted academic practice. No use, distribution or reproduction is permitted which does not comply with these terms.
*Correspondence: Barbara M. Bröker, YnJvZWtlckB1bmktZ3JlaWZzd2FsZC5kZQ==; Uwe Völker, dm9lbGtlckB1bmktZ3JlaWZzd2FsZC5kZQ==
Disclaimer: All claims expressed in this article are solely those of the authors and do not necessarily represent those of their affiliated organizations, or those of the publisher, the editors and the reviewers. Any product that may be evaluated in this article or claim that may be made by its manufacturer is not guaranteed or endorsed by the publisher.
Research integrity at Frontiers
Learn more about the work of our research integrity team to safeguard the quality of each article we publish.