 Srikanth Sadhu1
 Zaigham Abbas Rizvi1
 Ramendra Pati Pandey2
 Rajdeep Dalal1
 Deepak Kumar Rathore3
 Bhoj Kumar4
 Manitosh Pandey3
 Yashwant Kumar5
 Renu Goel5
 Tushar K. Maiti4
 Atul Kumar Johri6
 Ashutosh Tiwari1†
 Amit Kumar Pandey3
 Amit Awasthi1*
- 1Infection and Immunobiology, Translational Health Science and Technology Institute, Faridabad, India
- 2Department of Biotechnology and Biochemistry, SRM University, Sonepat, India
- 3Infection and Immunity, Translational Health Science and Technology Institute, Faridabad, India
- 4Functional Proteomics Laboratory, Regional Centre for Biotechnology, Faridabad, India
- 5Non Communicable Diseases, Translational Health Science and Technology Institute, Faridabad, India
- 6Infection and Immunity, Jawaharlal Nehru University, New Delhi, India
The global rise of antibiotic-resistant strains of Salmonella has necessitated the development of alternative therapeutic strategies. Recent studies have shown that targeting host factors may provide an alternative approach for the treatment of intracellular pathogens. Host-directed therapy (HDT) modulates host cellular factors that are essential to support the replication of the intracellular pathogens. In the current study, we identified Gefitinib as a potential host directed therapeutic drug against Salmonella. Further, using the proteome analysis of Salmonella-infected macrophages, we identified EGFR, a host factor, promoting intracellular survival of Salmonella via mTOR-HIF-1α axis. Blocking of EGFR, mTOR or HIF-1α inhibits the intracellular survival of Salmonella within the macrophages and in mice. Global proteo-metabolomics profiling indicated the upregulation of host factors predominantly associated with ATP turn over, glycolysis, urea cycle, which ultimately promote the activation of EGFR-HIF1α signaling upon infection. Importantly, inhibition of EGFR and HIF1α restored both proteomics and metabolomics changes caused by Salmonella infection. Taken together, this study identifies Gefitinib as a host directed drug that holds potential translational values against Salmonella infection and might be useful for the treatment of other intracellular infections.
Introduction
Typhoidal and non-typhoidal fever caused by Salmonella infection is a global health challenge with an estimated annual mortality of 128000-161000 (1–3). Salmonella infects the host through the intake of contaminated food or water and crosses the intestinal epithelial barrier causing inflammatory response (3, 4). Like other intracellular pathogens, Salmonella is phagocytosed by macrophages, monocytes, neutrophils, and subsequently leads to localized gastrointestinal or systemic infections that are characterized by diarrhea (3–6). However, therapeutic approaches against Salmonella have long relied upon the use of antibiotics with high success (3, 4, 7).The emergence of antibiotic-resistant strains (8) posing an urgent and emerging need to develop the novel therapeutic strategies. In addition to antibiotics, new approaches involve the development and faster testing of vaccines against Salmonella using a controlled human infection model (9). Nonetheless, the emergence of HDT (Host Directed Therapeutics) provides an alternative and attractive strategy to treat sporadic Salmonella infection (10–12), and it is becoming increasingly popular because it offers effective targeting of bacterial multi-drug resistance strains with cost-effectiveness. HDT involves designing of novel drug candidates after the identification of host factors that are being utilized and modulated for their survival by the pathogens. These factors, such as signaling molecules (calcium signaling and G protein-coupled receptors), and membrane cholesterol distribution enzymes of essential metabolic pathways, transcription factors or immune checkpoints, make attractive HDT targets since these are exploited by the pathogens to support their replication within the host cell (10, 11). These pathways play an essential role in adhesion, entry and replication of bacteria’s inside the host cell. Therefore, we screened ENZO library of small molecules which targets these processes in the host cell. The screening of the library results in identification of compounds that interfere with the host molecules to suppress the replication of the salmonella with in the host cell (11).
The infection of intracellular pathogens is accompanied by rapid metabolite changes within the host as pathogen divides and multiplies by utilizing the host machinery (13–15). It is now well established that multiplication of these intracellular bacteria may induce hypoxia resulting in the Warburg effect to meet energy demands (14–17). Interestingly, induced low oxygen burden in the host cells resulting in hypoxia has also been reported in Salmonella infection (16–18). In response to a hypoxic condition, infected host cells express HIF (Hypoxia induced Factor), the master regulators sensing low oxygen levels (16, 18). HIF consists of a constitutively active β-subunit and an oxygen labile α-subunit, which exists in three forms termed HIF-1α, -2α and -3α. HIF-1α is known to be expressed by all the immune cells, including macrophages, and is central to the response against hypoxia (16, 19–21). HIF-1α protein is induced and stabilized under low oxygen conditions and leads to shifting of the balance from aerobic oxidation of glucose to anaerobic oxidation (19). Furthermore, during infection, hypoxia is often accompanied by Warburg effects resulting in metabolic reprogramming, which involves switching to anaerobic oxidation from the Krebs cycle with subsequent metabolism of glucose to lactate (13, 22, 23). This results in a high rate of glycolysis to produce biosynthetic precursors, which provides building blocks for cellular macromolecules during its rapid multiplication inside the host cell.
In the present study, we establish, using compounds library screening and proteome analysis of uninfected and Salmonella-infected THP1 cells that utilizes EGFR-HIF-1α axis to promote its replication within the macrophages. EGFR inhibitor, Gefitinib, suppresses the replication of Salmonella by suppression of EGFR signaling within macrophages. Furthermore, in vivo treatment of Salmonella-infected mice with Gefitinib showed remarkable recovery associated with enhanced Th1 response and decreased frequency of myeloid-derived suppressor cell (MDSC). Moreover, inhibition of EGFR signaling induces proteo-metabolomics reprogramming that mitigates the effects of Salmonella infection. Taken together, we report that blocking of the EGFR-HIF1α axis may act as a potent HDT, which may have translational potential in targeting drug-resistant Salmonella infection.
Materials and Methods
Mice
FVB mice were obtained from National Institute of Immunology, New Delhi, India (Small animal facility) and maintained at THSTI (small animal facility) under the condition of 12 h light/dark cycle with Ad libitum chow and water supply. All animals used for the experimental purpose were of age group 6-8 weeks and were approved by the institutional IAEC Committee.
Reagents
Acriflavine (A8251), Rapamycin (SML 1657), EGF (Sigma RP 3027), p-EGFR (CST 2234S), p-S6 (CST 4858S), ATP (Sigma A2383), Suramin (Sigma S2671), 2-DG (Sigma D8375), Gefitinib, PMA were obtained from Sigma Aldrich (US). Reagents for ELISA, including anti-mouse IFNγ, anti-mouse TNFα, anti-mouse IL-17A, anti-mouse IL-10 (purified and biotinylated) were obtained from Biolegend (California). Western blot antibodies, anti-human HIF1α, anti-human mTOR, anti-human p70-S6, and anti-human β-actin were purchased from CST (US). Purified anti-mouse HIF1α antibody for immunohistochemistry was purchased from R&D systems (US). Anti-mouse CD3 BV510, anti-mouse γδTCR FITC, anti-mouse Gr1 BV421, anti-mouse CD11b PerCp-Cy5.5 for immunophenotyping were purchased from BioLegend (California). Gentamycin, SS agar (Hi media M108D), LB media, RPMI-1640 (Sigma AL060A; 500ml), L-glutamine (Invitrogen A2916801), Pen/Strep (Thermo Scientific 11360070), Tween 20 (Sigma 9005-64-5), ENZO compound library.
Salmonella Strains and THP-1 Cell Line
S. Typhimurium (SL 1344) and luciferase-expressing Xen33 (FDA 1189) strains were a kind gifted by C. V. Srikanth (RCB) while S. typhi (Vi+) was gifted by A. Sharma (THSTI). Bacteria were cultured until the log phase and then sub-cultured in LB media with a (1:50 dilution) for 3 h at 37°C with constant shaking. The optical density of the culture was then taken at 600 nm for a quick estimation of CFU (1 OD600nm= 1x10⁸CFU/ml).
THP-1 cell line was purchased from ATCC (Rockville, MD, USA) and cultured in DMEM, reconstituted with 10% heat-inactivated FBS (Gibco 10082147) and 55µM β-mercaptoethanol (Sigma M6250) in 5% CO2 incubator at 37°C.
Salmonella Infection and Compound Screening
For establishing infection, 0.04 million THP-1 cells were seeded in 96-well plates per well and cultured in the presence of PMA (50ng/ml) for24 h at 37°C. An infection of 1:10 MOI was then established in the wells containing activated THP-1 cells and co-incubated at 37°C in 5% CO2 incubator. Treatments of inhibitors/modulators were given post-infection for 24 h to determine the intracellular survival rate. For assessing the inhibition of internalization by compounds, the cells were pre-treated, washed with PBS, and then infected with Salmonella (For 30min.), further incubated in RPMI containing 100 µg/ml gentamicin for 1 h at 37°C followed by an RPMI wash. The infected THP-1 cells were then used directly or lysed in 0.1% Triton X-100. From the lysate of the THP-1 cells, colony plating was carried out for Salmonella on SS agar plates. The number of colonies was counted manually. The viability of THP-1 cells was determined by using a trypan blue exclusion assay by using a hemocytometer under a microscope.
Direct Killing Assay
The direct killing assay was performed using Presto blue dye (Thermo Scientific) in a colorimetry based assay. Briefly, the compounds were added directly to S. typhi cells in a 96 well plate. The cells and the compounds were co-incubated in a 5% CO2 incubator for 24 h. After 24 h incubation, 20µl of Presto blue (Thermo scientific) was added directly to the culture media, and changes in color were determined through colorimetry.
Establishment of Salmonella Infection Model in BMDMs
Femurs and tibia were collected from sacrificed C57BL/6 mice. These bones were then cleaned and flushed from one side in a culture dish. The cells obtained were centrifuged and cultured in DMEM containing 10% FBS and 50 ng/ml M-CSF (BD Biosciences) for 5-6 days, and purity was analyzed by Flow cytometry. These differentiated macrophages were used for further Salmonella infection experiments.
Hypoxia Study
THP1 differentiated macrophages were infected with Salmonella with 1:10 MOI (Cells: Bacteria) and were cultured in presence or absence of Rapamycin (50nM), Gefitinib (1µM, 5µM, 10µM) or Acriflavin (5µM; HIF1α inhibitor). These cells were incubated either in 5% CO2 incubator or in an artificial hypoxia chamber (1% O2) for 24h. Thereafter, the cultured cells were washed twice with PBS. The cells were then lysed with 0.1% Triton X-100 and the diluted lysate was then spread on SS agar plates to enumerate viable CFU count.
mRNA Expression Profiling Through qPCR
RNA isolation by RNAeasy kit (Qiagen) followed by cDNA synthesis (BIO-RAD) was carried out as per the manufacturer’s manual. Real-time PCR was performed as described by Malik et al. (24) by using SYBR green dye KAPA SYBR FAST qPCR Master Mix (2X) Universal kit (KK 4600) on Fast 7500 Dx real-time PCR system (Applied biosystems) (24). Obtained results were analyzed by SDS2.1 software. The cycling threshold value of the endogenous control genes β-actin (for mouse) and GAPDH (for Human) was subtracted from the cycling threshold value of each target gene to generate the change in the cycling threshold (ΔCT). The relative expression of each target gene was expressed as “fold change” relative to that of respective samples (2ΔCT). We used the previously used formula (POWER (2,-ΔCT)*10000 to calculate the relative gene expression (24, 25). The acquisition of qPCR was done on Applied Biosystems 7500 RT-PCR systems. The sets of primers (forward and reverse respectively) used for the THP-1 cells were GAPDH (5’-ACAGTTGCCATGTAGACC-3’;
5’-TTGAGCACAGGGTACTTTA-3’), HIF1α (5’-AAAATCTCATCCAAGAAGCC-3’
5’-AATGTTCCAATTCCTACTGC-3’), Glut1 (5’CAGTTCGGCTATAACACTGGTG-3’
5’-GCCCCCGACAGAGAAGATG-3), HK2 (5’-TGATCGCCTGCTTATTCACGG-3’
5’-AACCGCCTAGAAATCTCCAGA-3’), LDH5 (5’-CATTGTCAAGTACAGTCCACACT-3’ 5’-TTCCAATTACTCGGTTTTTGGGA-3’), PKM (5’-GCCGCCTGGACATTGACTC-3’ 5’-CCATGAGAGAAATTCAGCCGAG-3’), MCT4 (5’-TCACGGGTTTCTCCTACGC-3’ 5’-GCCAAAGCGGTTCACACAC-3’), TPI (5’-CCAGGAAGTTCTTCGTTGGGG-3’ 5’-CAAAGTCGATGTAAGCGGTGG-3′), Eno 1 (5’-TGCGTCCACTGGCATCTAC-3’ 5’-CAGAGCAGGCGCAATAGTTTTA-3’). For studies involving mouse samples following sets of primers were used: β-actin (5’-GATGTATGAAGGCTTTGGTC-3’ 5’-TGTGCACTTTTATTGGTCTC-3’), IFNγ (5’-TGAGTATTGCCAAGTTTGAG-3’ 5’-CTTATTGGGACAATCTCTTCC-3’), HIF-1α (5’- CGATGACACAGAAACTGAAG-3’ 5’-GAAGGTAAAGGAGACATTGC-3’), IL-10 (5’-CAGGACTTTAAGGGTTACTTG-3’ 5’-ATTTTCACAGGGGAGAAATC-3’), EGFR (5’-TGACTACTACGAAGTGGAAG-3’ 5’-CATTACAAACTTTGCGACAG-3’).
Western Blotting
Cell samples were washed with PBS and protein extraction was carried out by RIPA buffers. The concentration of protein in each sample was determined by performing BCA protein assay (Bio-Rad). 50 µg of protein extracts were loaded on a 10% Tris-tricine gel in an MES buffer (Invitrogen) or 3–8% Tris-glycine gel in a Tris-acetate buffer (Invitrogen) for Mtor (CST 2972S), p70-S6, HIF-1α, P-EGFR, P-s6, β-actin respectively. After electrophoresis, proteins were transferred to a nitrocellulose membrane; the membrane was blocked in 5% non-fat milk and then incubated in primary antibody diluted in 5% non-fat milk overnight at 4°C. The peroxidase-conjugated goat anti-rabbit (BD Biosciences) secondary antibody was incubated further for 1 h. Immunoreactive proteins were detected using the ECL chemiluminescent system (BIO-RAD) and bands were captured on Gel-doc (BIO-RAD). Band intensities for each western blot were calculated by using ImageJ software.
Nucleofection Protocol
Cultured THP-1 cells were seeded 1.5x10⁷ in a 75cm2 flask and activated with 10ng/ml L-Glutamine and 50µM β-mercaptoethanol for 48 h. Cells were then treated with accutaseI and kept at 37°C incubator for 30 min. Healthy cells as confirmed under the microscope were pelleted down at 300xg for 15 min. 0.2x10⁶ THP-1 cells were then suspended in 100µl Amaxa™ 4D-Nucleofector Solution (LONZA; V4XP-3024) and nucleofected with HIF1α gRNA plasmid on 4D-Nucleofector™ X unit (Lonza) using THP-1 Cell 4D-Nucleofector™ X Kit (Lonza, V4XP-3024) as per manufacturers protocol. Nucleofection was confirmed by western and flow cytometry and was used for further experiments.
Salmonella Infection in the Mice
The gastroenteritis model for Salmonella infection was established through oral gavage administration. Briefly, FVB mice were starved of food and water for 4 h and then orally gavaged with 7.5 mg streptomycin to sterile the gut. After 20h mice were again starved of food and water for 4 h. Overnight culture of Salmonella and further sub-cultured for 4h were infected in these mice at 1x10⁶ CFU by oral gavage. After the successful establishment of infection, mice received either Gefitinib (80mg/kg every alternate day) (26, 27) or Acriflavin (5mg/kg each day). At the end of the study, the mice were sacrificed and their tissues and organs were utilized for molecular and histological studies.
Histology and Immunohistochemistry Studies
FVB mice were infected with S. Typhimurium and received Gefitinib or Acriflavin as described above. The mice were sacrificed at day 7 and their intestine, caecum was removed and used further for histological studies. The organs were washed with PBS and fixed in 10% formaldehyde for overnight. Tissue blocks were prepared on Paraffin wax and thereafter the organs were fine-sectioned on microtome and hematoxylin and eosin (HE) staining was carried out. The HE stained sections were washed and rat anti-mouse hypoxia-inducible factor- 1α antibody was exposed to the sections followed by a secondary antibody. The finally stained sections for HIF1α were then observed and images were captured under The Eclipse Nikon microscope. The quantitation of staining was done by random scoring by unbiased unrelated observers.
Immunophenotyping
On 7th day post-infection the mice were sacrificed and their spleen and MLN were isolated. Single-cell suspension prepared and stained (1 x 10⁶ cells) with fluorescently labeled anti CD3 (BD Biosciences USA), anti-mouse CD4 (BD Biosciences USA), anti-mouse γδ-TCR (eBioscience Invitrogen, USA), CD11b (eBioscience Invitrogen, USA) or Gr1 antibody (eBioscience Invitrogen, USA) for 20 min at RT followed by twice washing with PBS. Stained samples were then acquired on BD FACS Canto (BD Bioscience) and analyzed with the help of FlowJo software (Vx 0.7 Treestar).
In Vivo Imaging for Therapeutic Efficacy
FVB mice were infected orally with Xen-33 Typhimurium and its bioluminescence was measured on 5th day post-infection. Mice were anesthetized with 2% Isoflurane for bioluminescence in vivo imaging with IVIS Lumina (Perkin Elmer) and quantified with living image software version 4.2. Bioluminescent levels were measured as radiance (p/sec/cm2/sr), by using a pseudo scale for measurement in which blue represents low intensity, and red represents high intensity. Posts in vivo imaging, the bacterial burden in stool sample cultures were also measured.
ELISA
Sandwich ELISA was performed for the quantitation of IFN-γ, TNF-α, IL-17, IL-10 cytokines obtained from mouse serum samples by using their respective ELISA antibodies (Biolegend). The absolute quantitation of the cytokines (in pg/ml) was done by using individual standard recombinant cytokines. ELISA was performed by a coating of the primary antibody to the walls of the flat bottom 96 well plate. Thereafter, the unbound antibody was washed with PBS + 0.05% tween20. Blocking was done with a 3% FBS solution at 4°C overnight followed by biotin-conjugated secondary antibody incubation for 1 h at room temperature. HRP-peroxidase conjugated with streptavidin was used to label the antigen bound secondary antibody complex. TMB (BD Biosciences) substrate (50µl/well) was then added to each well and incubated for 10-20 min, and the reaction was stopped by 0.2N HNO3 solution. The changes in the color intensity were measured through colorimetry at 540nm.
Bacterial Burden in Mouse Feces
Group of 6 FVB mice of 8 weeks old were infected orally (1x10⁶CFU). The inoculum was prepared from a log phase culture of 0.7- 0.8 OD. This was grown at 37°C on a shaker in standard broth with kanamycin. Cells were washed and re-suspended in sterile PBS and administered orally by a 1 mm ball-tipped gavage needle. Feces were collected at the peak of infection and plated on the SS agar plate for determining its CFU.
Metabolomics Profiling by LC-MS/MS
Serum from FVB mice was isolated, and protein precipitation was carried out with the help of LC-MS grade methanol 1:3 ratio (Sample: methanol) with continuous vortex for 30 sec followed by incubation on ice for 10 min. These samples were then centrifuged at 15000g for 20min at 4°C. The supernatant was collected, from this fraction (60μl) of the samples and transferred to sterile LC vials. These samples were kept for drying (mi Vac Duo Concentrator, Gene vac Ltd., U.K.), and the dry pellet was dissolved in 8:2 (v/v) acetonitrile: water for metabolomics analysis using chromatography system 5000 (Thermo Fisher). Polar metabolite dissociation attained with the NH2 column were further processed and analyzed.
All data were acquired on the orbitrap fusion mass spectrometer equipped with heated electrospray ionization (HESI) source. Data were acquired on positive and negative mode at 120,000 resolution in MS1 mode and 30000 resolution in data-dependent MS2 scan mode. We used a spray voltage of 4000 and 3500 volt for positive and negative modes respectively. Sheath gas and auxiliary gas were set to 42 and 11 respectively. The mass scan range was 60-900 m/z, AGC (Automatic gain control) target at 100000 ions and maximum injection time was 50 ms for MS and AGC target was 20000 ions and maximum injection time 60 ms for MSMS was used.
Extracted metabolites were separated on UPLC ultimate 3000 using XBridge BEH Amide column (100x2.1 mm i.d, 2.5 micrometers, Waters Corporation) maintained at 35 degrees C temperature. The mobile phase A was 20mM ammonium acetate in the water of PH 9.0 and mobile phase B was 100% acetonitrile. The elution gradient is used as follows: 0 min, 85% B, 2 min, 85%B, 12 min, 10%B, 14 min, 10%B, 14.1min, 85%B, and 16 min, 85%B. The flow rate of 0.35mL/min and the sample injection volume was 5 microliter.
Data Processing
All acquired data has been processed using Progenesis QI for metabolomics (Waters Corporation) software using the default setting. The untargeted metabolomics workflow of Progenesis QI was used to perform retention time alignment, feature detection, deconvolution, and elemental composition prediction. Metascope plug of Progenesis QI has been used for the in-house library with accurate mass, fragmentation pattern and retention time for database search. We have also used online polar compounds spectral library for further confirmation of identification.
Sample Preparation for Proteomic Study
1x10⁶ THP-1 cells were seeded in 6 well plates and activated with PMA (50ng/μl) for 48 h. Thereafter, Salmonella infection was established at 1:10 MOI in the presence or absence of Gefitinib or Acriflavin for 24 h. Cells were then washed with PBS, and their protein content was isolated by using RIPA buffer (Sigma) following the manufacturer protocol. Total protein concentration of cell lysate was determined using BCA™ protein assay kit (Thermo Scientific). Proteins from cell lysate was further subjected to in-solution digestion, 30 µg proteins were reduced (10 mM DTT for 1 h at 60°C), alkylated (20 mM IAA in dark at room temperature for 30 min) and then digested by trypsin (1:20 w/w in 50 mM TEAB) at 37°C for overnight. The digested sample was desalted and purified using C18 tip and further vacuum dried and stored at -20°C for mass spectrometry analysis For each condition three biological samples was prepared.
Quantitative Proteomic Using Data-Independent Acquisition (DIA) Method
Digested peptides were analyzed on Triple- TOF 5600 (AB Sciex, Canada) mass spectrometer coupled with ekspert nanoLC400 (Eksigent, CA, USA) in high-sensitivity mode. Data were collected in SWATH acquisition mode and the instrument was configured as described by earlier (28) with slight modification. Briefly, a set of 45 overlapping (1 Da) windows were constructed covering the mass range 350–1250 Da. Peptide were separated using ChromXPcolumn (150×0.15mm, 3µm, 120 Å)with 125 min linear gradient of 2% to 40% mobile phase (Mobile phase A: 98% water, 2% acetonitrile with 0.1% (v/v) formic acid, mobile phase B: 98% acetonitrile with 0.1% (v/v) formic acid) at a flow rate of 250 nl/min. Fragment spectra were collected from 200 to 1600 m/z with 60 ms dwell time for fragment-ion scans resulting in a duty cycle of 3.4s. For SWATH processing and quantification, the raw file was processed in Spectronaut Pulsar (Biognosys) in the Direct-DIA method using default parameters, data were searched against UniProtKB protein database (contains 20069 human protein entries) includes iRT peptides (Biognosys). The FDR was set to 1% at the peptide precursor level. The extracted-ion peak intensities were further used for the quantitative analysis of proteins. We used Post Analysis Perspective feature of Spectronaut Pulsar (Biognosys) for further quantitative statistical analysis. Fold changes was expressed as log2 transformed ratios of mean value of three biological replicates. One-way analysis of variance (ANOVA) was used to compare natural log-transformed protein abundance values of control, infected, infected+ Gefitinib, infected+ Acriflavin, and infected+ Rapamycin samples. The proteins were considered to have changed significantly only if abundance changed > ± 1.5 fold with <0.05 corrected p-value (two multiple test correction method Bonferroni and Benjamini-Hochberg was applied).
Functional enrichment analysis
The functions of differentially regulated proteins were analyzed using KEGG database, Network analysis was performed using Network Analyst (29) and DAVID (30) was used for pathway analysis. The intensities of regulated proteins were log (base 2) transformed and then used for volcano and heatmap for plot using the R software package.
ATP Quantification
ATP levels were measured in the culture supernatants harvested from the THP-1 cells in different conditions using ATP determination kit (ThermoFisher; A22066) as per manufacturer instructions.
Statistical Analyses
Each experiment was repeated at least three times independently and three biological replicates were used. Data were plotted as mean – SEM. Student’s t-test (Mann-Whitney), two way ANOVA and one way ANOVA (Kruskal-Wallis) were performed wherever applicable by using Graph Pad Prism 7.0 software. For the survival curve, Kaplan Meier statistical analysis was performed. P < 0.05 was considered to be statistically significant.
Results
EGFR Signaling Essential for the Survival of Salmonella Within Macrophages
To understand the role of cholesterol distribution on plasma membrane, calcium signaling and G protein-coupled receptors in Salmonella-infected macrophages, an FDA approved ENZO library of small molecules (Supplementary Table 1) was screened to identify the inhibitors against intracellular replication of Salmonella within the macrophages. We measured internalization and intracellular replication of S. typhi in THP-1 cells, a prototypic human immature macrophage cell line, as shown in a schematic diagram (Figure 1A). Library was first tested for its direct toxicity on S. typhi or THP-1 cells through Presto blue dye (Supplementary Figure 1A). Interestingly, none of the small molecules of the library exerted any direct toxicity on S. typhi or THP-1-derived macrophages (Supplementary Figure 1A). These compounds were then screened individually to evaluate their ability to inhibit the intracellular replication of S. typhi in PMA (Phorbol 12-myristate 13-acetate) -induced differentiated THP-1cells (Supplementary Figure 1B). Further, dose-dependent kinetics for intracellular replication of S. typhi was performed for the compound library and it was observed that Gefitinib inhibits the intracellular replication of S. typhi within the macrophages even at low concentrations (Figure 1B). We observed that 23 compounds of the library were showing >90% inhibition of Salmonella survival at 1.0 µM concentration, as we decrease the doses from 1.0 µM to 100nm and 10nm, the antimicrobial activity of small molecules reduces greatly (Supplementary Figure 1C). Interesting to note that Compound D3 (Gefitinib) of the small molecule library able to suppress intracellular replication of S. typhi even at the lower concentration (Supplementary Figure 1C). These small molecules were further screened to test their ability to inhibit the internalization of S. typhi by pre-treatment of the THP-1 cells with small molecules. For this purpose, THP-1 cells were incubated with library compounds and washed thereafter, followed by S. typhi infection. We found that 5 compounds showed ≥ 90%, 9 compounds showed>80%, 14 compounds >50% showed inhibition of S. typhi internalization (Figure 1C). We further combined the data of inhibition and internalization of S. typhi within the THP-1 cells, and found that 23 compounds of the library showed <90% inhibition of intracellular survival while 5 compounds showed <90% of inhibition of S. typhi uptake (Figure 1D). We further selected the compounds that can suppress both intracellular survival and uptake of S typhi efficiently (<90%). Venn diagram indicated that 3 out of 61 compounds blocked intracellular survival and uptake of S. typhi (Figure 1E). These three compounds, Gefitinib, Butaconozole nitrate, Naloxonazine 2HCl, were further tested for dose kinetics experiment to identify compound/s which can block both intracellular survival and uptake of S. typhi at lower concentrations. As indicated, among three compounds, Gefitinib potently inhibited both intracellular survival and uptake of S. typhi in THP-1 at lower concentrations (Figures 1F, G), suggesting Gefitinib as a potential candidate that suppresses Salmonella infection. Since Salmonella also infects the epithelial lining of the gut, therefore we tested whether Gefitinib also suppresses Salmonella replication in Caco2 cells, a prototype intestinal epithelial cell. We found that similar to macrophages, Gefitinib also suppresses the intracellular survival of S. typhi in Caco-2cells (Supplementary Figure 1E, F).
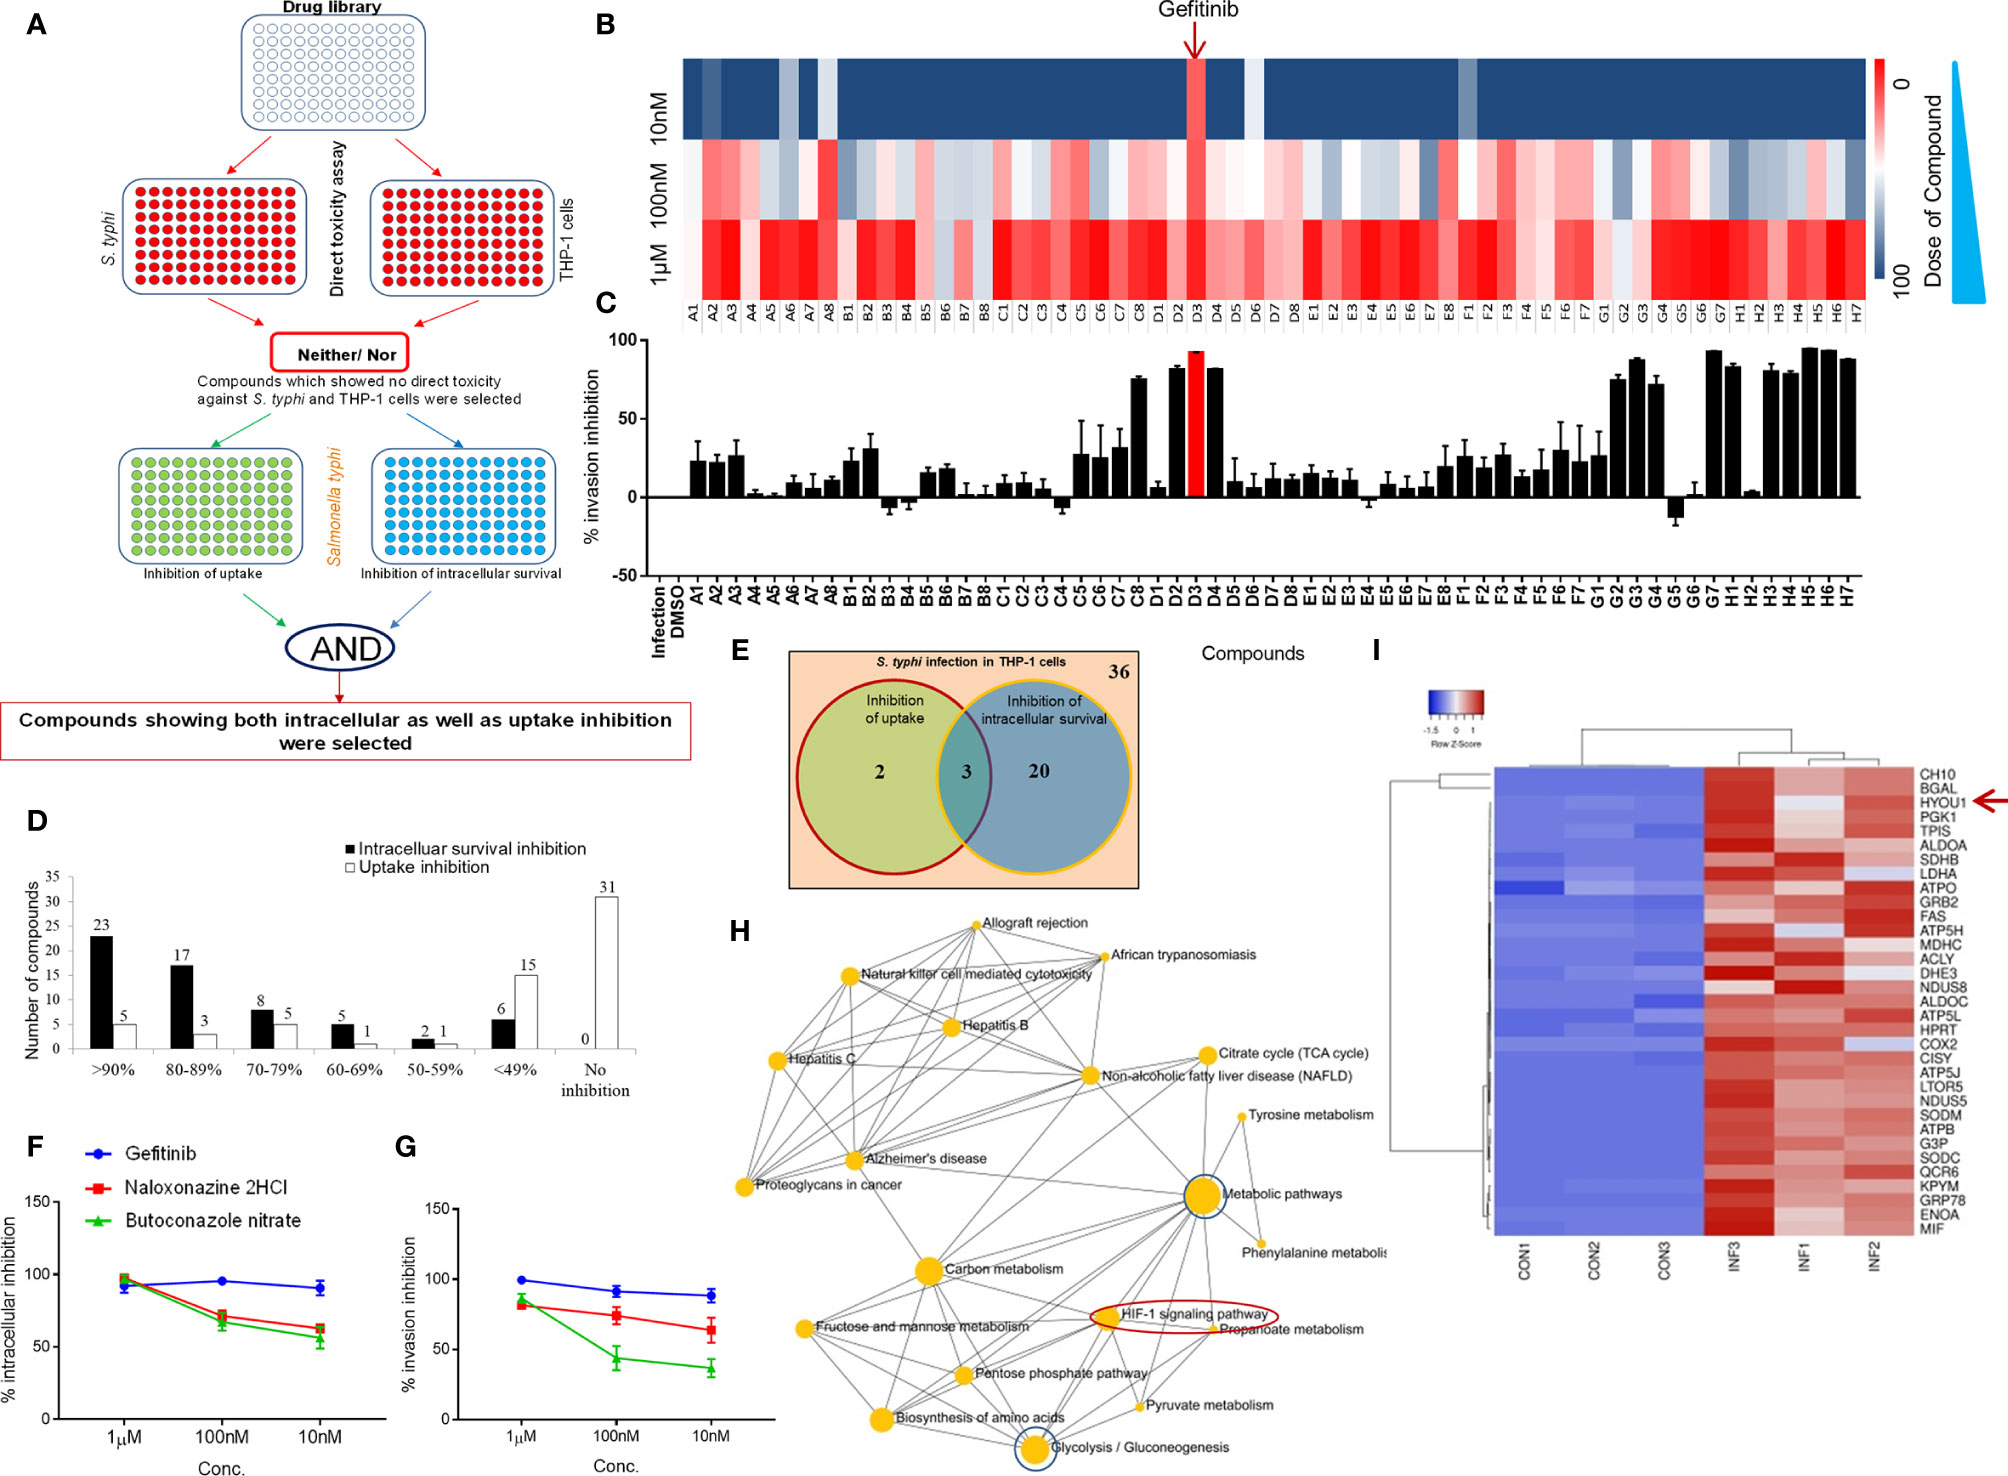
Figure 1 EGFR signaling essential for the survival of Salmonella within macrophages. Panel (A) representative strategy for the screening of ENZO compound library. (B) Intracellular replication as % inhibition was evaluated at different concentration (1µM, 100nM & 10nM) and plotted as intensity heatmap. Panel (C) represents % inhibition ± SEM upon pre-exposure of compounds (1µM) plotted as bar graphs. (D) The number of hits in the form of compounds showing good inhibition was plotted as a bar graph. (E) Venn diagram showing the number of compounds with ≥ 90% inhibition and 3 overlapping compounds with significant inhibition for both intracellular survival and internalization. These 3 compounds were further tested for intracellular and internalization inhibition in a dose kinetics assay (F, G respectively). (H) Network analysis of control and infection conditions. (I) Heatmap analysis of a subset of top significantly expressed genes in Control vs Infection. Data are representative of mean ± SEM from three replicates and each individual experiments repeated three times.
Gefitinib is an EGFR inhibitor, which suppress EGFR phosphorylation reversibly and further block EGFR signaling (31). Next, to identify the downstream of the EGFR signaling pathway, which supports Salmonella survival within the macrophages, we analyzed a subset of the proteome to understand the pathways which are upregulated in Salmonella-infected THP-1. We found that the HIF-1α signaling pathway was enriched in S. typhi infected THP-1 as compared to uninfected THP-1 cells (Figure 1H). Our proteome analysis also finds the upregulation of HYOU1 (Hypoxia upregulated protein 1) protein in S. typhi-infected THP-1 cells (Figure 1I). Altogether, these data demonstrated that EGFR and Hypoxia effect Salmonella survival in THP-1 cells.
Host Proteomic Analysis Identifies Pathways That Support Salmonella Replication Within Macrophages
It had been demonstrated that EGFR pathways leads to HIF-1α activation through mTOR (32–38); therefore, we tested whether EGFR-mTOR-HIF-1α pathway is potentially used by Salmonella to supports its survival. To understand the role of EGFR-mTOR-HIF-1α pathway in Salmonella infection, we treated the infected cells with respective inhibitors like Gefitinib, Rapamycin, and Acriflavin to check whether Salmonella survival within the macrophages is affected. Our data indicated that the inhibition of mTOR and HIF-1α suppressed intracellular replication of S. typhi within the macrophages (Supplementary Figure 2F). Further, we wanted to understand the changes in protein profiling upon the treatment of S. typhi-infected macrophages with Gefitinib, Rapamycin and Acriflavin. We adapted Direct-DIA (Data independent acquisition) method to quantify changes in protein abundance of uninfected and Salmonella infected-THP-1 by SWATH-MS. SWATH data was median normalized (Supplementary Figure 2B) The quality of SWATH-MS data was assessed using the coefficient of variance (CV) and it was less than 14% over three biological replicates in all groups (Supplementary Figure 2C). Distribution of ration of all protein abundance was shown in Supplementary Figure 2D.
In Direct-DIA method we build a spectral library from SWATH files that gives a library of 930 proteins and 4168 peptides. This spectral library however could be expanded using one or more combined peptide fractionation methods. This library was used for quantitative analysis of proteins in uninfected, infected, Salmonella-infected macrophages treated with the Gefitinib, Rapamycin and Acriflavin. Based on the statistical analysis, the changes in protein abundance was considered significant only if abundance changed > 1.5 fold with <0.05 adjusted p-value and all reported proteins and peptides were within 1% FDR (False Detection Rate). In S. typhi-infected macrophages, a total of 303 proteins were altered (upregulated: 225, downregulated: 78). Upon Acriflavin, Gefitinib and Rapamycin treatment of Salmonella-infected macrophages, 423 (Up 132, Dn 291), 226 (Up 30, Dn 196) and 266 (Up 86, Dn 180) proteins were modulated respectively (Supplementary Table 2). Further, we analyzed modulated proteins to find out common proteins between Infection and Gefitinib/Rapamycin/Acriflavin treatment condition; a total 99, 109, 160 proteins were commonly modulated respectively (Figure 2B). Volcano plot obtained from S. typhi-infected THP-1 cells indicate a global upregulation of 225proteins as compared to uninfected THP-1 cells most of them were reversed upon the treatment of Gefitinib, Rapamycin or Acriflavin (Figure 2A; Supplementary Figure 2E). The PCA plot indicates the distinct distribution of modulated proteins in uninfected and S. typhi-infected macrophages (Supplementary Figure 2A). More importantly, the distribution of proteins upon Gefitinib, Rapamycin or Acriflavin treatment of S. typhi-infected macrophages changes are significantly grouped closer to uninfected macrophages (Supplementary Figure 2E), indicating that Gefitinib, Rapamycin or Acriflavin treatment might be modulating the host protein to suppress S. typhi replication within the macrophages.
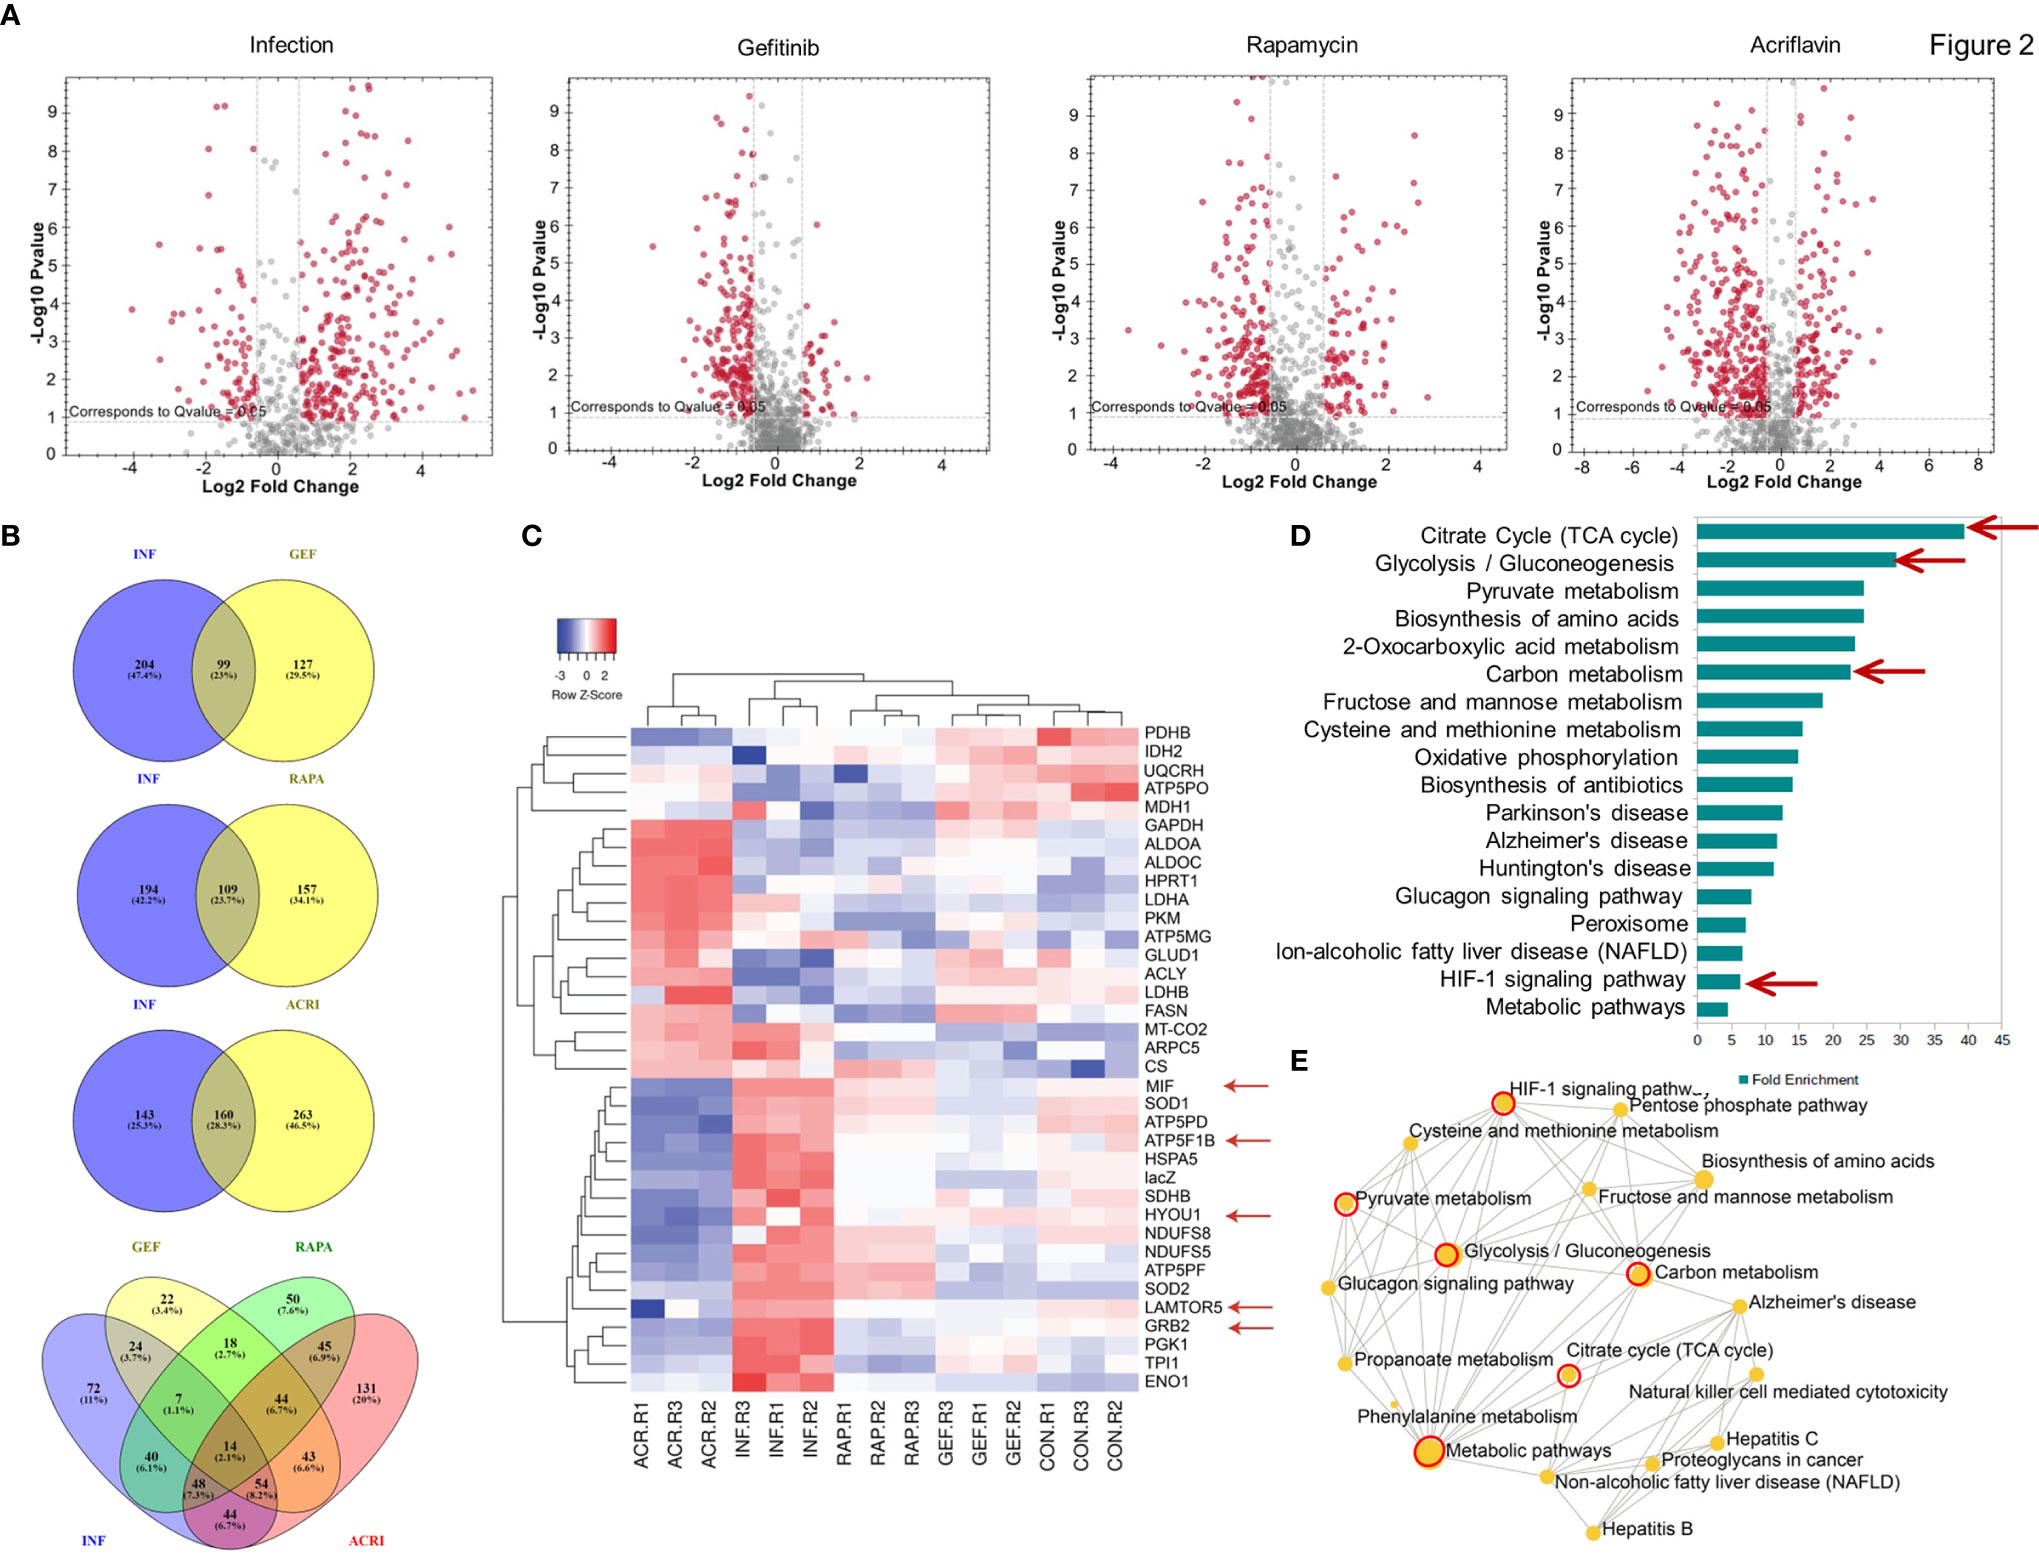
Figure 2 Host proteomic analysis identifies pathways that support Salmonella growth within macrophages. Cell lysates obtained from S. typhi infected and Gefitinib, Acriflavin or Rapamycin treated were used for proteomic profiling using uninfected lysates as a control. (A) Shows volcano plot of changes in protein abundance in infection, Gefitinib, Rapamycin and Acriflavin treatment. (B) Venn diagram represents a comparison of proteins between Infection and treatment groups whose p-value was <0.05 (C) Heat map indicating the relative expression of proteins, blue and red color indicates down and upregulation respectively same as green and red color indicates down and upregulation (n=3). (D) Shows significantly enriched KEGG pathway terms and their fold enrichment of 36 modulated proteins, and (E) Gene ontology term enrichment analysis. All 36 modulated proteins were analyzed using network analyst, related biological function is displayed in a circle, and circle size indicates the level of significance of enrichment; INF, Infection; GEF, Gefitinib; ACR, Acriflavin; RAP, Rapamycin. Data are representative of mean ± SEM from three biological replicates and one individual technical experiments.
Heatmap obtained from the proteomic analysis indicated that S. typhi-infected macrophages causes dramatic changes in the protein abundance profile of metabolic pathway proteins like Glycolysis (TPI, PKM, Enolase, LDH, G-3-PDH), TCA cycle (Citrate Synthase, PDH, NADH DH) ATP production, Oxidative phosphorylation (G-3-PDH, LDH, NADH DH, ATP synthase, Cyt-c-Oxidase) and also importantly EGFR–mTOR–HIF1α signaling pathway was highly upregulated in infection group compared to treatment groups, as GRB2 (Growth factor receptor-binding protein 2), LTOR5 (mTOR regulating protein), HYOU 1 (Hypoxia upregulated protein 1) which are key proteins for this pathway, and these proteins are highly abundant in infection condition, whereas in treatment conditions these proteins are comparable as a control condition (Figures 2C, D Red arrows; Supplementary Figure 2G–P). Interestingly, treatment with Gefitinib, Acriflavin or Rapamycin resulted in a significant reversal of proteome changes caused by S. typhi infection in macrophages (Supplementary Figure 2E). Additionally, it was found that pathways involved in glycolysis, ATP turn over, HIF-1α signaling and TCA cycle were among others, which are majorly influenced (Figures 2D, E; Supplementary Table 2). Moreover, an increased level of MIF (Macrophage migration inhibition factor) in infection condition was observed, as its upregulation was known in sepsis condition (39). Interestingly, the protein abundance of MIF inhibited upon Gefitinib, Rapamycin and Acriflavin as compared to infected-macrophages (Supplementary Figure 2P) Taken together these data suggest that the changes observed reflect the host response to Salmonella infection.
Salmonella Exploits mTOR-HIF-1α Axis to Promote Its Intracellular Survival
To understand the intracellular pathway of the macrophages, which is exploited by S. typhi for its replication within the macrophages, downstream signaling of the EGFR pathway was investigated. One of the downstream signaling of EGFR involves mTOR and HIF-1α axis, which was also found to be significantly affected by Salmonella infection in THP-1 cells (40). We first tested whether EGF, one of the ligands of EGFR, can promote the intracellular replication of S. typhi within the macrophages. Our data indicated that EGF enhanced the intracellular survival of S. typhi within the macrophages (Figure 3A). Interestingly, Gefitinib treatment suppressed the EGF-mediated intracellular replication of S. typhi within the macrophages (Figure 3A), indicating that EGFR activity is critical for the intracellular survival of S. typhi.
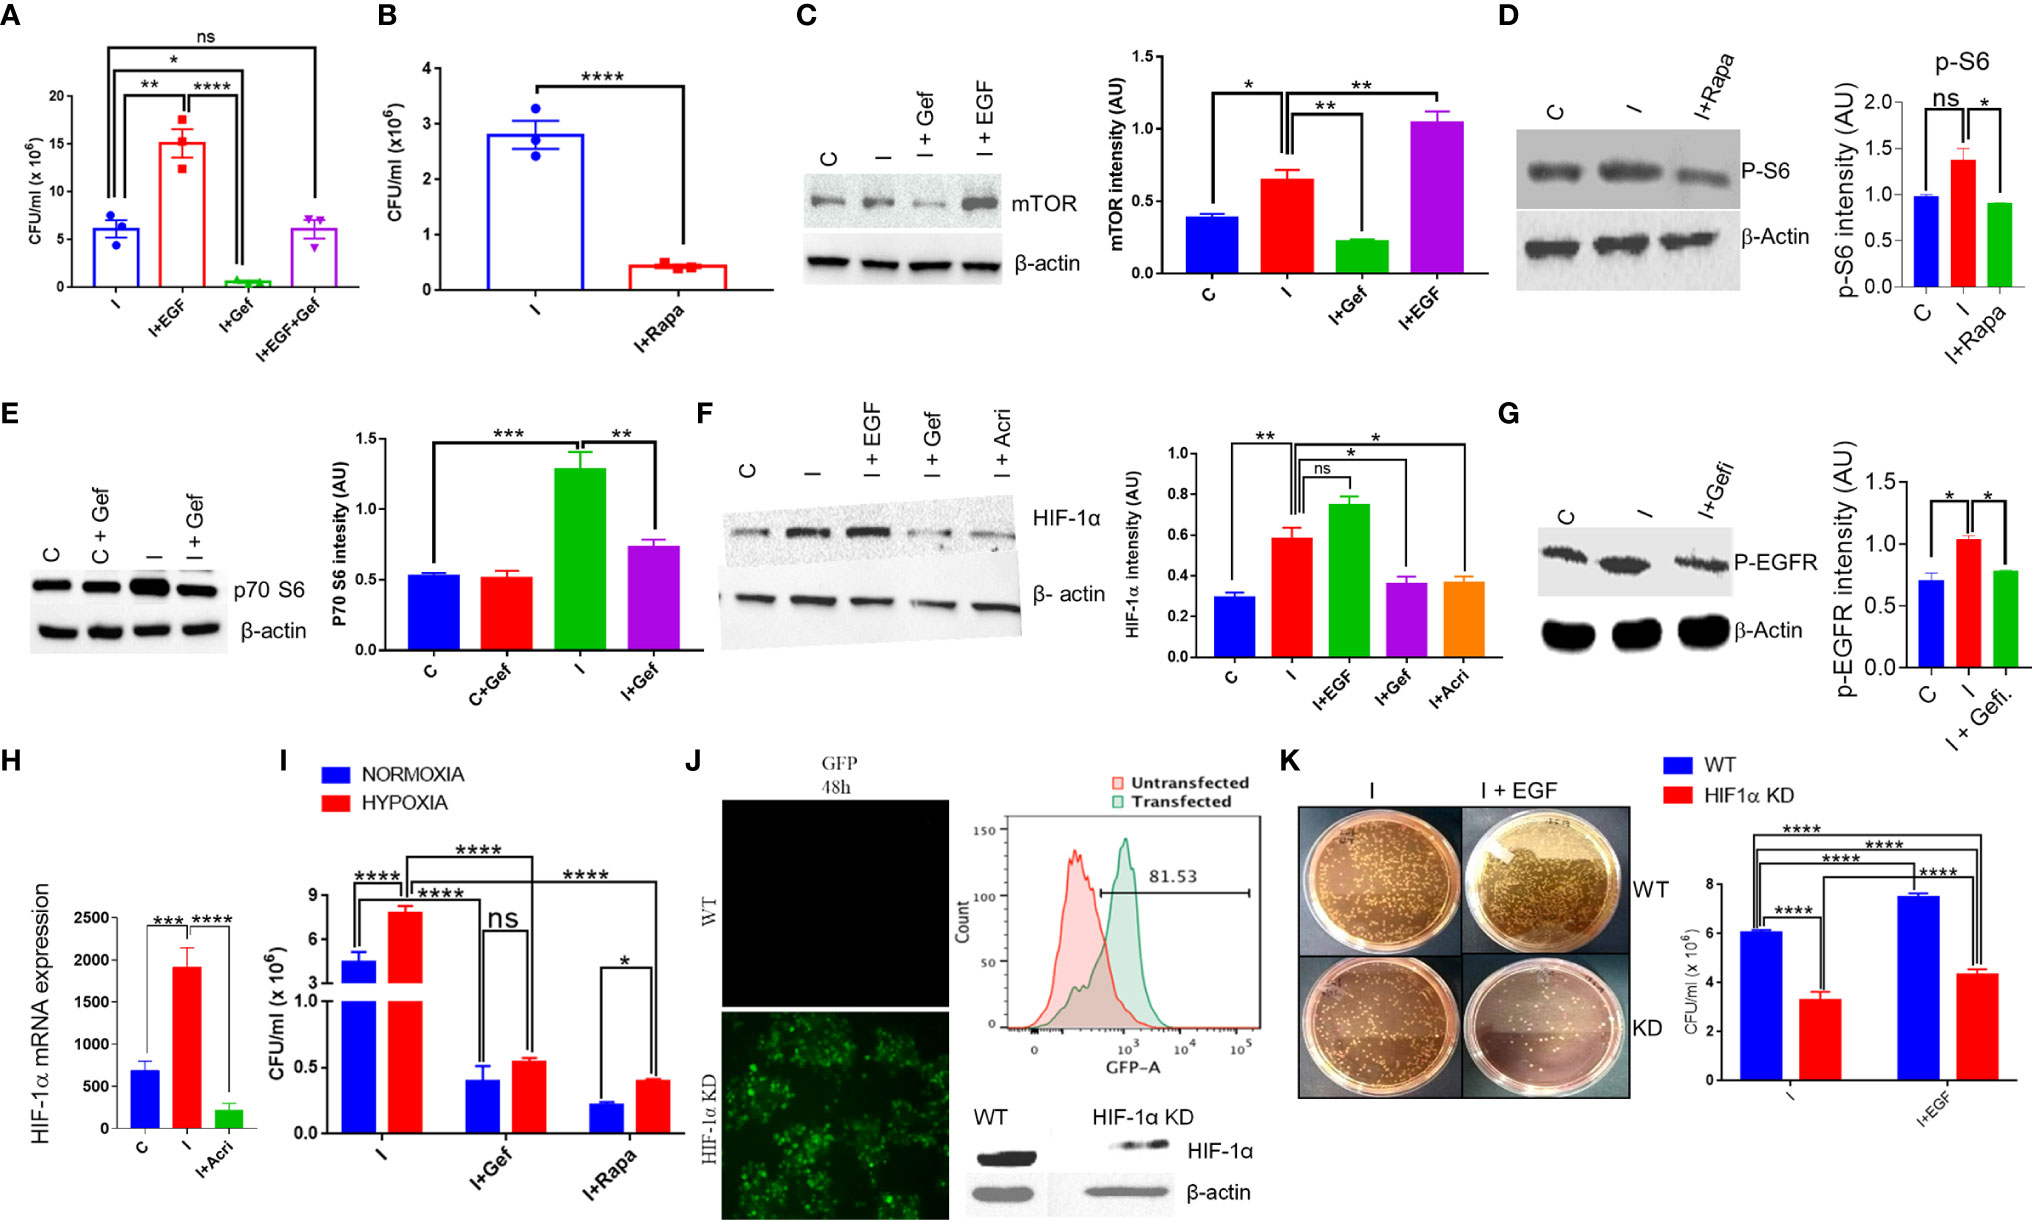
Figure 3 S. typhi exploits mTOR-HIF-1α axis to promote its own survival. (A) Colony-forming assay in the presence of an EGFR agonist or reverse agonist was performed for S. typhi infection in THP-1 cells. A similar assay was performed in the presence of Rapamycin, (B). CFU in presence of Rapamycin. (C–G). Protein expression of mTOR, p70-S6, HIF-1α and p-EGFR in THP-1 cells was determined by western blotting and quantitated by using ImageJ software in the presence or absence of infection and treatments (Panel C-G). (H) q-PCR for mRNA expression of HIF-1α in THP-1 cells with or without infection,. (I) Intracellular survival of S. typhi inside THP-1 cells under normoxia or hypoxia condition. HIF-1α guided RNA tagged with GFP was used to knock out the HIF-1α gene in THP-1 cells. Confocal microscopy images acquired 48 h after HIF-1α knockout showing high GFP expression in knockout THP-1 cells (J left panel), which was further confirmed by flow cytometry showing histogram overlay (J upper right panel); data represent two independent experiments. Western blot (J lower right panel) showing low expression of HIF-1α. (K) Intracellular survival of S. typhi in WT or HIF-1α knockout cells. Data are representative of mean ± SEM from three replicates and repeated three times each individual experiments *P < 0.05, **P < 0.01, ***P < 0.001, ****P < 0.0001 (Student’s t-test and one way ANOVA).
Since mTOR is one of the major signaling targets downstream of EGFR, therefore we tested whether blocking of mTOR activity by Rapamycin, a known antagonist for mTOR, could affect the intracellular survival of S. typhi within the macrophages. It was found that inhibiting mTOR activity by Rapamycin results in about 90% inhibition of intracellular replication of S. typhi as indicated by CFU count (Figure 3B), indicating a potential role of mTOR in intracellular replication of S. typhi. We measured the changes in protein level expression of molecules involved in mTOR signaling by western blot analysis. As indicated, S. typhi infected macrophages increases both mTOR and p70-S6 kinase levels (Figures 3C, E). Interestingly, EGF treatment further enhanced the mTOR expression in S. typhi infected macrophages (Figure 3C), indicating that EGFR signaling enhances the mTOR. Moreover, Gefitinib treatment found to decrease both mTOR and p70-S6 kinase (Figures 3C, E). We also observed that both Gefitinib and Rapamycin treatment inhibits phosphorylation of EGFR and p-S6 (Activation state of mTOR) respectively (Figures 3D, G). To further understand whether S. typhi infection in THP-1 increases HIF-1α at protein level. Our Western blotting data clearly indicated that S. typhi-infected THP-1 macrophages enhanced HIF-1α protein as compared to uninfected THP-1 macrophages (Figure 3F). Interestingly, treatment of S. typhi-infected macrophages with EGF further increased the HIF-1α while Gefitinib and Rapamycin treatment of S. typhi-infected THP-1 macrophages suppressed HIF-1α expression, indicated that S. typhi -induced EGFR and mTOR signals converge to HIF-1α. Moreover, our data indicates that S. typhi also induced the mRNA expression of HIF-1α in infected THP-1 macrophages, which is suppressed by Acriflavin (Figure 3H). Since HIF-1α s induced during hypoxic conditions, therefore we further studied whether hypoxic condition supports the intracellular replication of S. typhi within the macrophages. Consistently, culturing S. typhi- infected THP-1 macrophages under experimental hypoxic conditions was found to facilitate intracellular replication of bacteria as compared to normoxic conditions (Figure 3I). Interestingly, EGFR and mTOR inhibition through Gefitinib and Rapamycin respectively, significantly suppressed the intracellular replication of S. typhi within macrophages (Figure 3I), further supporting that EGFR-mTOR activation supports intracellular replication of S. typhi within THP-1 macrophages by enhancing HIF-1α.
We further confirmed the role of HIF-1α in supporting the intracellular replication of S. typhi within the macrophages by knock-out HIF-1α using CRISPR-Cas9 in THP-1 cells. CRISPR-Cas9-mediated knock-out of HIF-1α in THP-1 cells was confirmed by GFP expression (Figure 3J), which was further confirmed by flow cytometry and HIF-1α protein expression (Figure 3J right upper & below panel respectively). The intracellular survival of S. Typhi was then studied in WT or HIF-1α-KO non clonal THP-1 cells through colony-forming assay. HIF-1α-KO resulted in a significant loss of ability for intracellular survival of S. typhi (Figure 3K), corroborating our previous observations using pharmacological inhibition of HIF1α. Taken together, these data indicated the EGFR-mTOR-HIF-1α axis is essential for the intracellular replication of Salmonella.
Inhibition of EGFR Signaling Suppresses S. Typhimurium Infection in Mice
To study the in vivo relevance of our findings, we studied S. Typhimurium infection in FVB mice, which is known as acute enteritis and chronic animal model to investigate the therapeutic potential of Gefitinib treatment (1, 4, 41). S. Typhimurium infected mice treated with Gefitinib or Acriflavin as indicated in (Figure 4A, left panel) showed lower diarrhea associated with lower S. Typhimurium burden as compared to infection (Figure 4A, middle and right panel). We further use in vivo imaging to confirm our findings using genetically engineered luciferase-expressing Xen33 (FDA 1189) Salmonella infected FVB mice. Our data showed the lower intensity of luciferase signal for mice treated with Gefitinib or Acriflavin at day 5th (Figure 4B, left panel). The luciferase signal was further quantitated, which showed a 2.3 fold lower bacterial burden in the gut in Gefitinib treated mice as compared to the control group (Figure 4B, right panel). The bioluminescence analysis in the stool of Xen33 infected mice groups also showed a significantly lower number of bacteria in Gefitinib or Acriflavin treated group as displayed by decreased luminescence intensity (Figure 4C). Besides, the other infection parameters such as percent change in body mass, diarrhea, disease index, and animal survival showed significant recovery in Gefitinib and Acriflavin treated mice as compared to S. Typhimurium infected groups (Figures 4D–F). Moreover, the food and water intake of Gefitinib and Acriflavin group were found to be similar to that of healthy control (Supplementary Figure 3). It was found S. Typhimurium infection in mice significantly reduced the colon length as compared to healthy control mice (Figure 4G), however Gefitinib or Acriflavin treatment of S. Typhimurium infected mice restored the length of the colon as compared to the infection group (Figure 4G). It is well established that within the gut S. Typhimurium infects and colonizes in the colon where it causes severe inflammation, associated with neutrophils and macrophages infiltration and edema. Histological examination of colon and cecum using H & E staining for the section of the proximal, middle and distal colon, as well as cecum showed that Gefitinib and Acriflavin treatment leads to a significant recovery in the gross anatomy of colon and cecum as compared to the chronically infected FVB mice groups (Figure 4H). Further, immunohistochemistry for HIF-1α expression was carried out in the colon sections to investigate the role of HIF-1α in disease progression. Our results indicate that infection of S. Typhimurium leads to increased HIF-1α expression in the colon, which was significantly reduced upon Gefitinib and Acriflavin treatment (Figure 4I). Overall, these in vivo observations ascertained that EGFR-HIF1α is essential to establish infection in vivo.
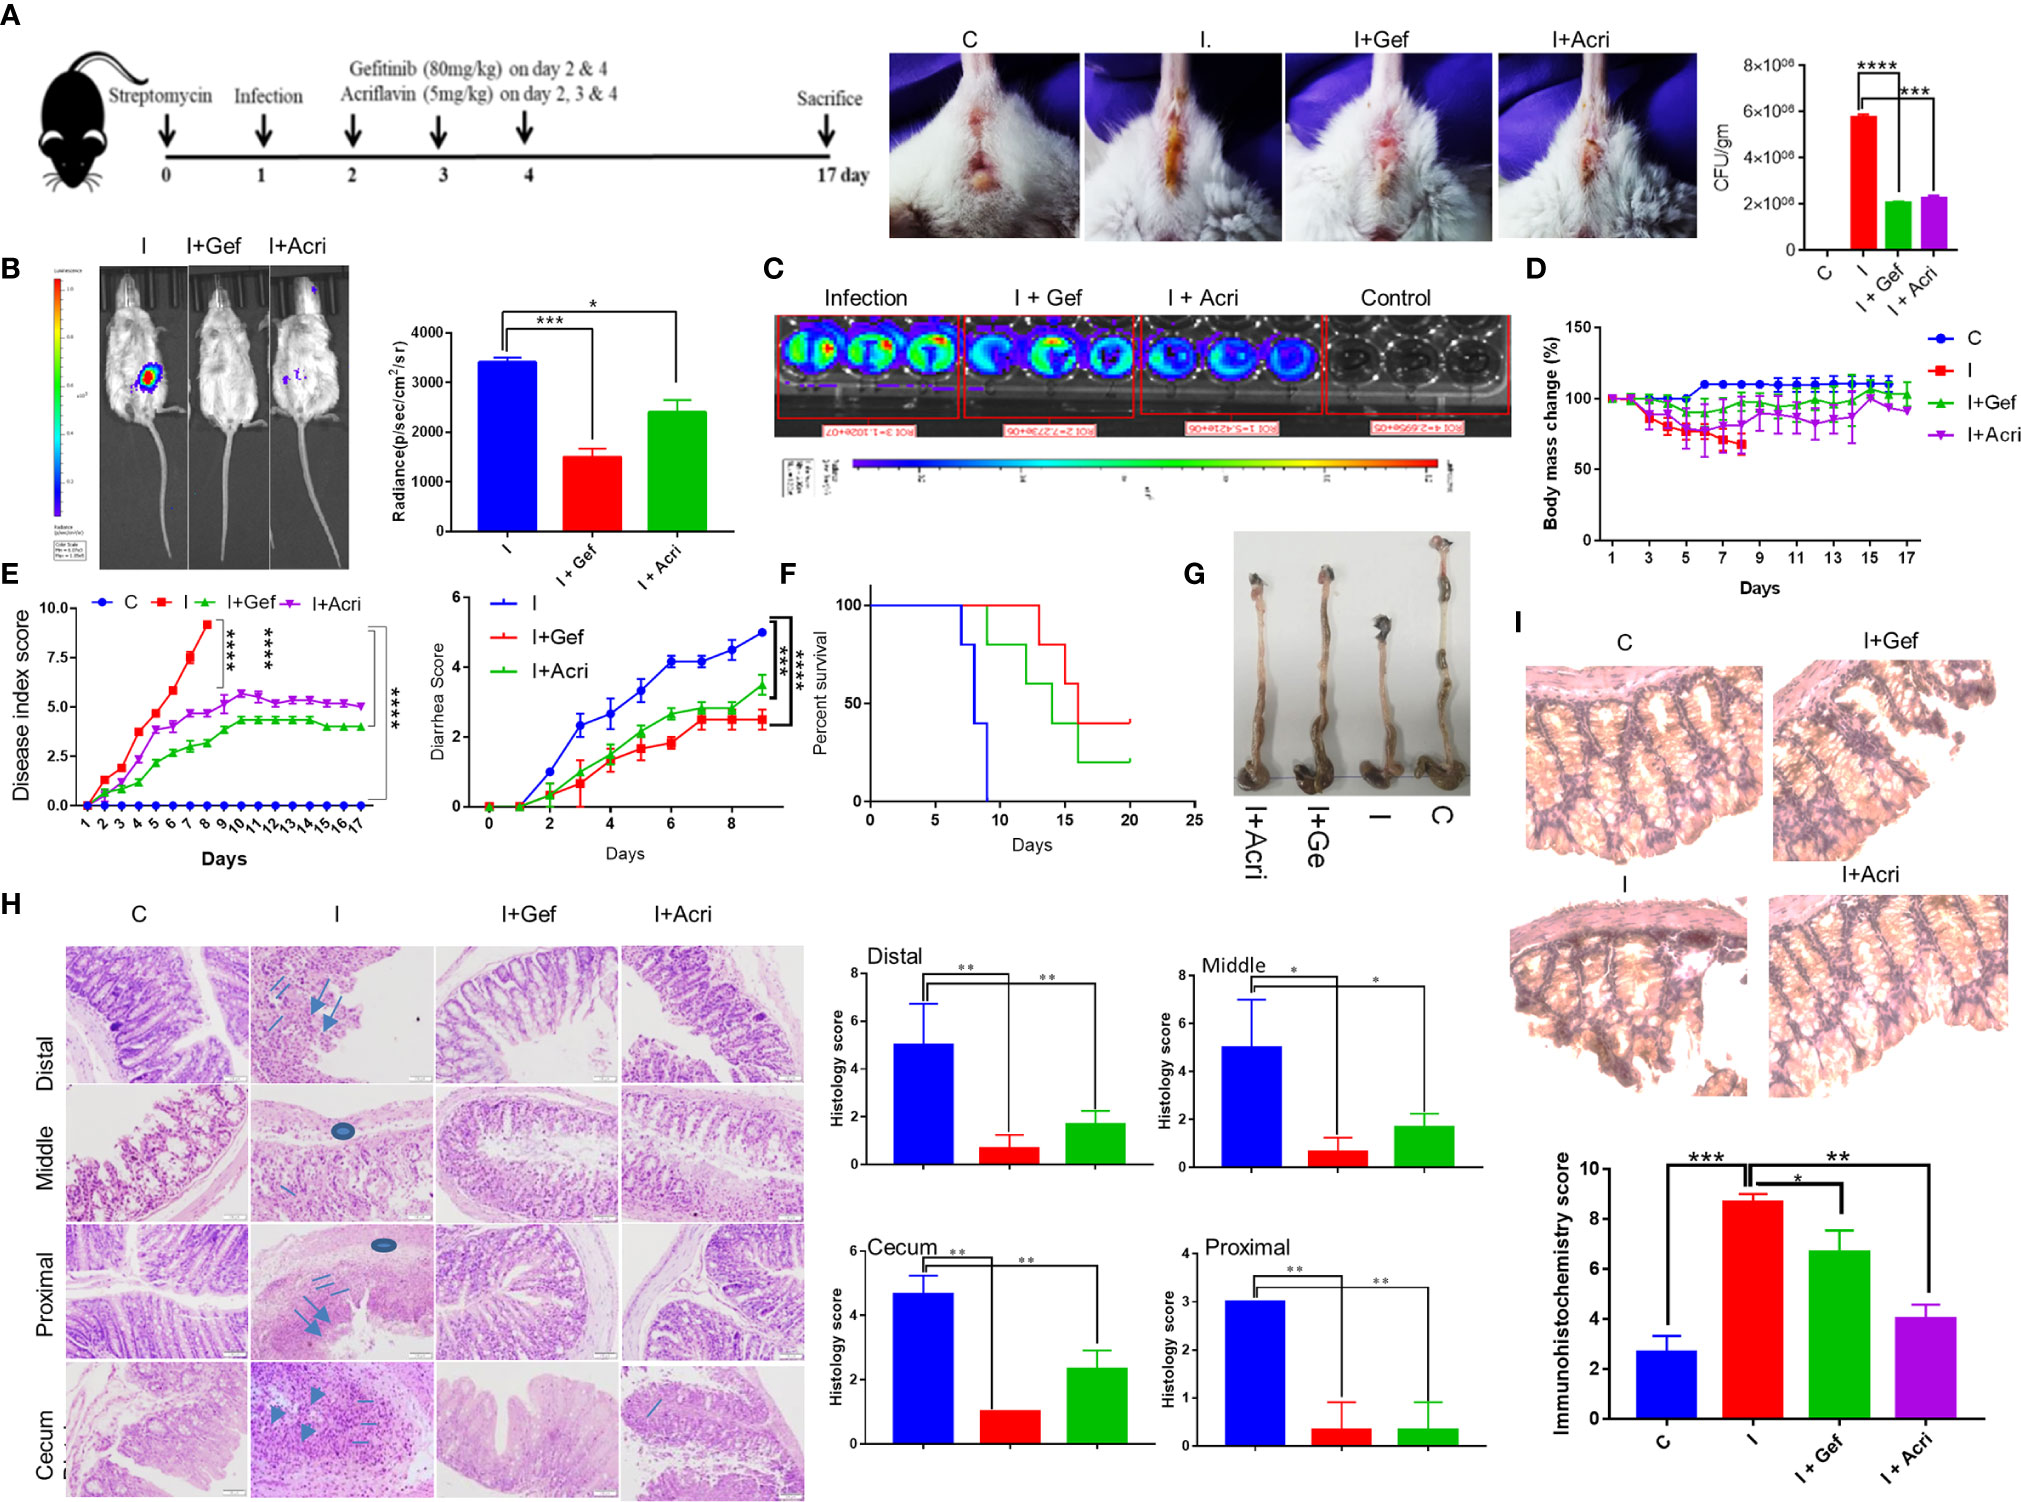
Figure 4 Inhibition of EGFR signaling suppresses S. Typhimurium infection in mice. Recovery of chronically S. Typhimurium infected FVB mice was studied in the presence of Gefitinib or Acriflavine. (A) Shows the pictorial representation of the dose regime for the establishment of infection and Gefitinib/Acriflavin treatment. Panel a (right), shows mouse images indicating diarrhea index for 6th post-infection. The stool was collected and plated on SS agar to determine S. Typhimurium colony formation (a, Far right). (B) In vivo imaging and intensity quantitation (right panel) of FVB mice infected with S. Typhimurium strain (Xen33) expressing luciferase on the 6th day (n=5 mice per group). (C) Luminescence imaging of stool obtained from Xen33 infected mice, data indicates three independent experiments. Panel (D–F) shows the percentage change in body mass, disease index score, diarrhea score and percent survival (Kaplan Meier survival analysis) for FVB mice infected with S. Typhimurium in the presence or absence of Gefitinib or Acriflavin (n=5 mice per group). (G) The image shows the length of the colon isolated from treated or untreated mice. (H) H & E staining (10X) of the proximal, middle and distal colon along with cecum showing regions of ulcers (arrow), inflammation (line), edema(circle)of different groups along with their histological scores. (I) Immunohistochemistry images (40X) showing expression of HIF-1α and its quantification in the colon (n=5). Data representative of triplicates and repeated three times each individual experiments *P < 0.05, **P < 0.01, ***P < 0.001, ****P < 0.0001, ns-non-significant. (Student’s t-test and one-way ANOVA).
Blocking EGFR Signaling Reprograms Metabolomic Changes in S. Typhimurium Infection
In order to understand the mechanism underlying host-directed immunity against Salmonella infection by Gefitinib, we carried out serum metabolomic profiling for S. Typhimurium infected mice with or without Gefitinib or Acriflavin treatment and compared their metabolomic profile with the healthy FVB mice. Our results obtained on MetaboAnalyst software shows that all the four groups (healthy, infected, infected plus Gefitinib and infected plus Acriflavin) showed less variation within the group as revealed by 3D PCA and PLSDA plots (Supplementary Figure 4A left and right respectively). Further, the abundance of individual metabolites across four groups was converted on the intensity scale of 3 to -3 and plotted as a heatmap. The results showed global metabolic changes during chronic S. Typhimurium infection in FVB mice. As shown in the heatmap, S. Typhimurium infection changes metabolites as compared to healthy group (Figure 5A). Interestingly, these changes in the metabolomic profile were found to be partly restored from disease profile by the treatment of Gefitinib and to a lesser extent by Acriflavin (Figure 5A). Remarkably, the metabolomic pathways which were significantly affected by S. Typhimurium infection and then restored by Gefitinib treatment were found to be those involving the Warburg effect, glycolysis, ATP turnover, Urea, etc. (Figures 5B, C; Supplementary Figure 4C-L). Interestingly, metabolites involved in glycolysis such as Glucose-6-phosphate, Fructose-6-phosphate and phosphoenolpyruvate (Figure 5D), Warburg effect and ATP turn-over such as D-lactic acid, succinate, Nicotinamide (Figure 5E) and Urea cycle such as L-ornithine, 4-pyridoxic acid and uracil (Figure 5F) were found to be significantly perturbed upon Gefitinib treatment indicating a global metabolomic reprogramming. Furthermore, enzymes and transporters involved in glucose influx and glycolysis were also found to be significantly upregulated under Salmonella infection (Figure 5G; Supplementary Figure 4B–L). To validate the role of glucose and ATP, as suggested in the metabolomic profile, promoting the intracellular replication of S. typhi in macrophages. Interestingly, S. typhi-infected THP-1 macrophages cultured with increasing concentration of glucose showed an increase in intracellular replication of S. typhi (Figure 5H, left panel), suggesting that increased glucose concentration might be enhancing the rate of glycolysis which might in turn be promoting the replication of Salmonella within the macrophages. To support this, we cultured S. typhi-infected THP-1 macrophages with 2-DG, an inhibitor of glycolysis, and found that 2-DG treatment was able to suppress the intracellular replication of S. typhi within the macrophages (Figure 5H, right panel). We further validated the role of host ATP, as suggested by metabolic profile, in the intracellular replication of Salmonella. Increasing concentration of ATP enhanced the S. typhi replication within the macrophages (Figure 5I, left panel). In contrast, treatment of S. typhi-infected macrophages with Suramin, a blocker of ATP, suppressed the intracellular replication of S. typhi (Figure 5I, right panel). Interestingly, Gefitinib was able to limit the ATP generation from the host cells (Supplementary Figure 5B). All these results suggested that both glucose metabolism and ATP generation affected by the Gefitinib and inhibit the replication of Salmonella inside the host.
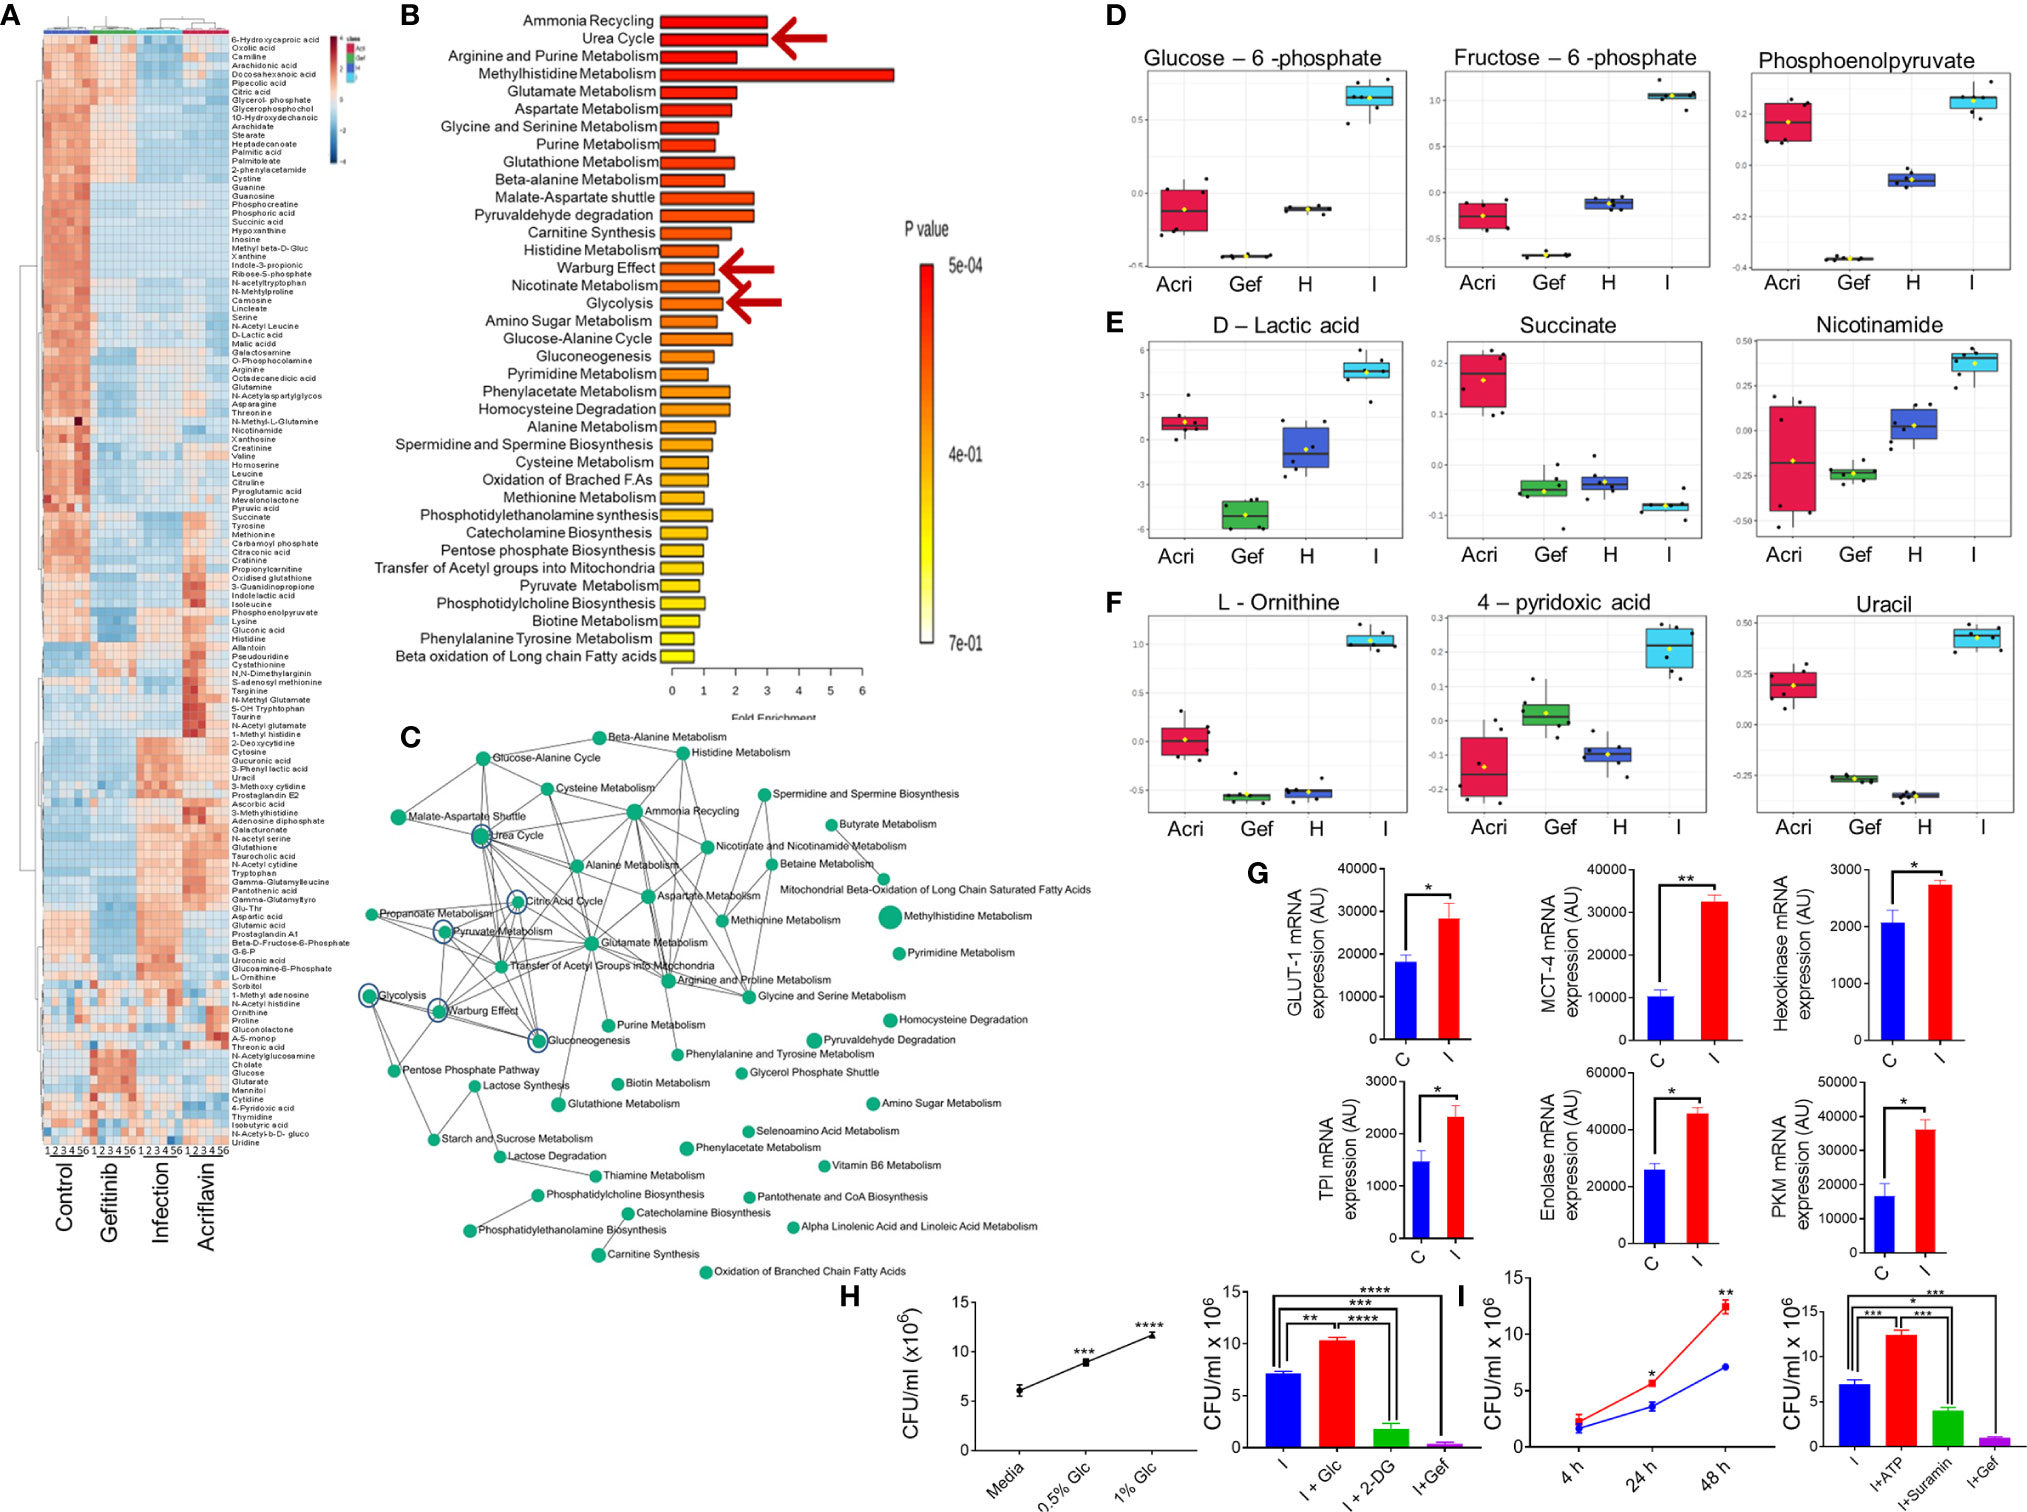
Figure 5 Blocking EGFR signaling reprograms metabolomic changes in S. Typhimurium infection. Serum obtained from S. Typhimurium infected FVB mice receiving Gefitinib or Acriflavin treatment was used for metabolomics profiling using healthy serum control. (A) Heat map indicating changes in the metabolites for different groups (n=6 mice per group). (B, C) Pathway enrichment and pathway network. (D-F) shows the distribution of important metabolites for glycolysis, Warburg effect and urea cycle across different groups. (G) mRNA expression of genes involved in glucose transport and glycolysis in the presence or absence of S. Typhimurium infection in BMDM cells, bars show duplicate values for each gene. (H, I) dose kinetics for glucose and ATP response against intracellular replication of S. Typhimurium inside BMDM cells, Data are representative of mean ± SEM from one individual experiments *P < 0.05, **P < 0.01, ***P < 0.001, ****P < 0.0001 (Student’s t-test).
EGFR-HIF1α Axis Is Essential to Promote MDSCs in Salmonella Infection
To understand the immunological response mediated by EGFR and HIF-1α during Salmonella infection, we infected the mice with S. Typhimurium and treated them with Gefitinib or Acriflavin. As shown in Figure 4, both Gefitinib and Acriflavin suppressed S. Typhimurium in mice; the immune population in lymphoid organs (mesenteric lymph nodes and spleen) was characterized in S. Typhimurium-infected FVB mice. Our results demonstrated that there was a significant increase in γδ T cells in MLN upon the treatment with Gefitinib and Acriflavin in infected mice (Figure 6A, right and left panel). We further tested monocytes, macrophages and myeloid-derived suppressor cells (MDSCs) population in both spleen and MLN in these animals. While monocytes frequency is increased upon S. Typhimurium infection in both spleen and MLN, Gefitinib and Acriflavin treatment suppressed the frequency of monocytes in S. Typhimurium infected mice. Moreover, myeloid-derived suppressor cells (MDSCs) population was found to be significantly reduced by Gefitinib and Acriflavin treatment in S. Typhimurium infection (Figure 6B), indicating a possible role of MDSCs in driving the Salmonella infection in vivo.
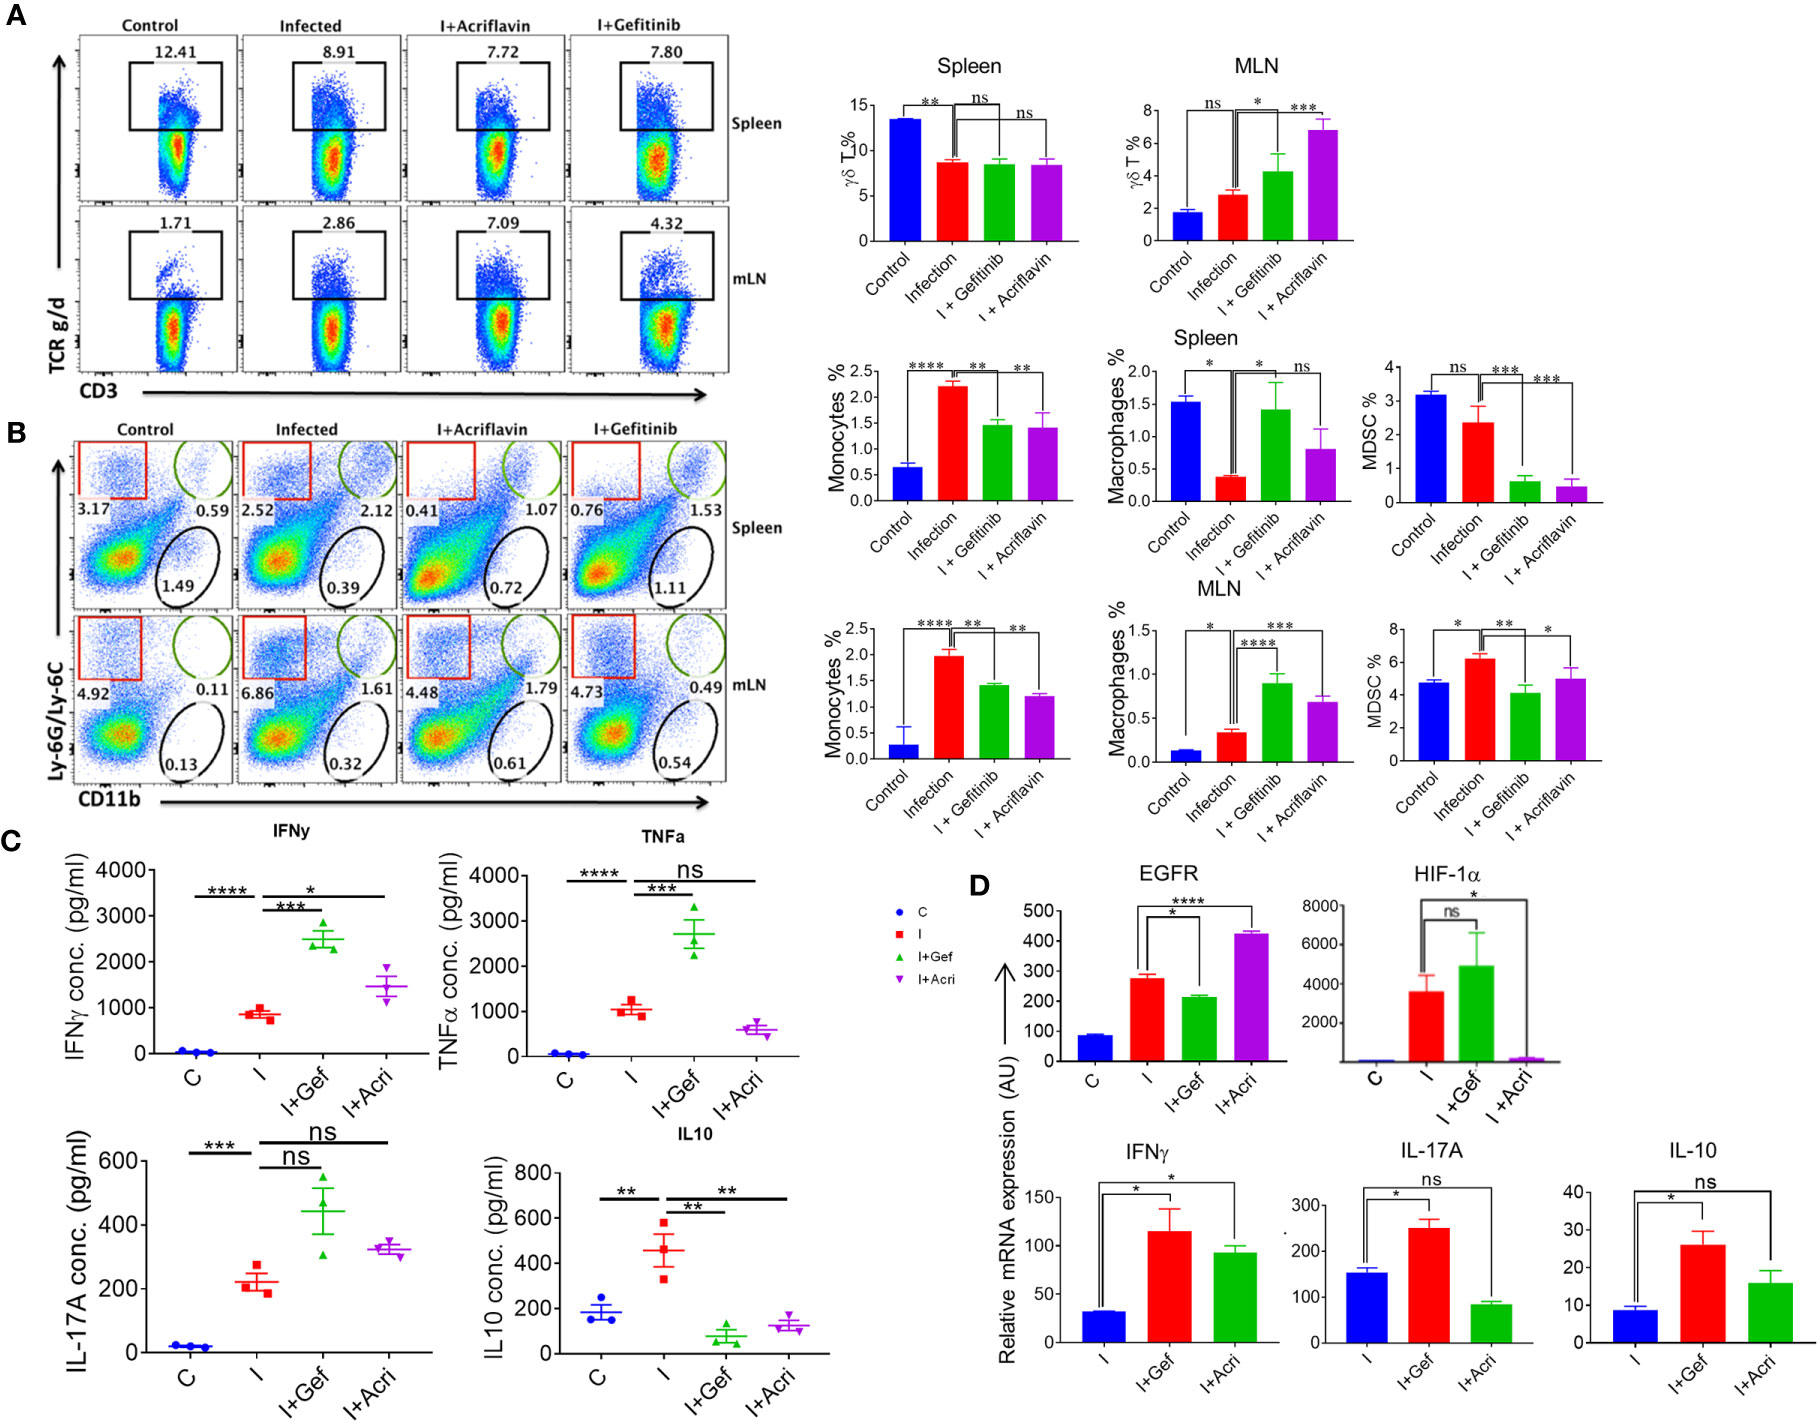
Figure 6 EGFR-HIF1α axis is essential to promote MDSCs in Salmonella infection. (A, B) Dot plots and bar graphs indicating % frequency of γδ T cells, macrophages, MDSCs, monocytes in spleen and MLN in mice infected with S. Typhimurium (n=3 mice per group), analyzed using Flowjo. (C) Graph showing the concentration of different pro and anti-inflammatory cytokine (IFN-γ, TNF-α, IL-17a, IL-10) in the blood serum (n=3), data representative of triplicates *P < 0.05, **P < 0.01, ***P < 0.001, ****P < 0.0001 (one way ANOVA). (D) Bar graph for mRNA expression of EGFR, HIF1α, IFNγ, IL17A, and IL10 in the MLN cells, data representative of triplicates *P < 0.05, **P < 0.01, ***P < 0.001, ****P < 0.0001 a-d. one way ANOVA.
To understand the status of overall immune activation upon the treatment of S. Typhimurium-infected mice with either Gefitinib or Acriflavin, serum circulating cytokines levels were measured by ELISA. Interestingly, the level of IFN-γ, TNF-a, IL-17A which is the major cytokine required for mounting potent immunity against intracellular pathogen, was found to upregulate (Figure 6C). Similar changes were also observed in IL-1β levels during infected THP-1 cells (Supplementary Figure 5C). Level of IL-10, an anti-inflammatory cytokine, was found to be downregulated upon Gefitinib or Acriflavin treatment as compared to S. Typhimurium-infection (Figure 6C). mRNA expression for EGFR, HIF-1α, IFNγ, IL-17A and IL-10 genes from MLN isolated from S. Typhimurium infected FVB mice in the presence or absence of Gefitinib or Acriflavin showed similar expression profiles (Figure 6D). These observations together demonstrated that both Gefitinib and Acriflavin suppress the replication of Salmonella by enhancing pro-inflammatory response while suppressing the MDSCs.
Discussion
Salmonella infection is one of the leading causes of enteric fever in humans, arising due to gastroenteritis with an estimated 11-20 million new cases with about 128000-161000 cases of mortality annually (1, 2, 42). To treat the drug resistant strains of Salmonella, an alternative strategies are required to combat the life-threatening infections of multi-drug resistant Salmonella. Three such exciting alternatives include vaccine development, phage therapy, and use of compounds for the host-directed immunity (10–12, 43). Among these, HDT provides a rapid yet cost-effective strategy to counter the growing challenge posed by drug-resistant bacteria. In the current study, we screened an FDA approved library of 61 compounds known to target distinct host functions, such as cholesterol distribution on the plasma membrane, G-protein coupled receptors and intracellular calcium signaling, for their potential host-mediated therapeutic effects against Salmonella infection in macrophages. Our analysis of intracellular survival inhibition during the establishment of S. typhi infection followed by post-exposure of the compounds for 24h showed various degrees of inhibitions for all 61 compounds. Additionally, inhibition of internalization based on pre-exposure of the compound followed by S. typhi infection, suggesting that most of the compounds hold the minimal inhibitory potential for internalization of S. typhi. Among all compounds, we found Gefitinib significantly suppressed both intracellular and uptake of Salmonella, indicating the possibility of Salmonella modulating host EGFR pathway for its own survival as Gefitinib targets EGFR signaling (10, 26, 44–46). Dirk Brehmer et al., in 2005 has described the 20 new cellular targets of the Gefitinib besides EGFR that might behave as off-targets (47). But we haven’t looked at other cellular targets as EGFR is the most prominent and well-studied target for Gefitinib. Interestingly, Salmonella exploit EGFR for its entry and subsequently internalization through flagellin in gut of the host (48–52). Since Gefitinib blocks EGFR phosphorylation, it is possible that Salmonella entry and uptake by host cells require EGFR activation (Figure 3G) (31, 48, 49, 53–55). Further downstream of the EGFR, one of the main important factor for survival of intra cellular bacteria, is mTOR. The role of Rapamycin in inhibiting the mTOR phosphorylation had been described previously by Ballou and Lin (56), and Thoreen et al. (57) (56, 58). We have also reported that Rapamycin inhibits phosphorylation of p-S6, which is the activation state of m-TOR and upregulated in presence of infection (Figure 3D). Consistently EGF, as indicated by our data, promotes intracellular replication of Salmonella within the macrophages. It might be possible that flagellin, together with EGF synergistically activate EGFR signaling to promote the uptake of Salmonella. Moreover, Gefitinib which blocks EGFR, for uptake of bacteria (10, 59). In addition, our proteomics analysis suggests the involvement of HIF-1α, further suggesting a possibility that EGFR-HIF-1α axis in intracellular uptake and survival of the Salmonella within the host. As Gefitinib and Rapamycin are known pharmacological inhibitors of EGFR and mTOR respectively, we hypothesized that this pathway could be modulated or beneficial to the Salmonella. This hypothesis is also supported by our in vitro experiments (western blot, CRISPR knock out experiment, RT-PCR).
Previous reports demonstrated that blocking of EGFR signaling suppresses mTOR pathway. In addition, Rapamycin treatment affects EGF/EGFR signaling and causes diverse physiological changes within the cell (48–50, 60). Several studies indicated that mTOR play a pivotal role in the replication of intracellular pathogens (37, 53). Our data suggests that mTOR is critical for S. typhi survival within the macrophages. Consistently, expression of both mTOR and p70-S6 kinase was significantly upregulated upon infection with Salmonella. It is well known that mTOR pathway play an important role in intra cellular pathogens survival (61). Interestingly, Gefitinib may also act by inducing autophagy in host cells as indicated by our LC3B expression study (Supplementary Figure 5A).
Our data indicates the EGFR-mTOR ultimately activate HIF-1a to further support the replication of the Salmonella. HIF-1α is essential transcription factor that induces hypoxia within the cells. Hypoxia or low oxygen concentration is an environmental stimulus that induces several physiological changes within the cells (62). Upon infection, oxygen can be destitute from tissues due to vascular damage or intensive metabolic activity induced by pathogen, which leads to a hypoxic environment within the cells (16). Hypoxia stabilizes HIF-1α to further promote hypoxia-induced survival of the bacteria. Acriflavin and Rapamycin has been shown to block the survival of intracellular pathogen such as Staphylococcus aureus, Escherichia coli, Streptococcus agalactiae, Pseudomonas aeruginosa, Bartonella henselae, Yersinia enterocolitica, and Chlamydophila pneumoniae (11, 21, 49, 62–65). Our results indicated the enhanced expression of HIF-1α during S. typhi infection at both mRNA and protein levels. Inhibition of EGFR using Gefitinib suppressed mTOR and HIF-1α as well as inhibited intracellular survival of S. typhi indicates that S. typhi utilizes mTOR-HIF-1α axis for its replication. Consistently, our data suggested that the intracellular survival of S. typhi was significantly reduced in HIF-1α-KO as compared to the WT macrophages (Figure 3I).
Our in vitro data indicated that EGFR pathway is crucial for the establishment of Salmonella infection. Consistently, Gefitinib treatment of S. Typhimurium-infected mice showed recovery associated with inhibition of HIF-1α, further emphasizing the critical role EGFR-HIF-1α axis regulating Salmonella infection in vivo. Gefitinib treatment induced proteomic and metabolomic reprogramming of Salmonella infected macrophages, indicating that Salmonella utilizes EGFR signaling to modulate host protein and metabolites to establish infection. Interestingly, our data demonstrated that S. typhi infection of THP-1 cells upregulated IL-1β secretion thereby directly regulating epithelial lining of the gut. MLN is one of the important secondary lymphoid organs in the context of the gut immunity that develop a successful immunological response against the pathogens that invade through oral route (66–68). Our immunophenotyping data suggested that Gefitinib treatment increases macrophage frequency while suppressing myeloid-derived suppressor cells (MDSCs) in both MLN and spleen, which corroborates with previous reports (69–72). These data further suggest a possibility that Salmonella enhance the frequency of suppressor MDSCs population. While Gefitinib treatment in Salmonella-infected mice enhanced pro-inflammatory cytokines like IFN-γ, TNF-α, IL-17, it suppressed IL-10 secretion indicating that inhibition of EGFR signaling triggers a strong inflammatory response in the gut, which is essential for successful immunity against Salmonella.
Our in vitro and in vivo data strongly suggests that HIF-1α plays a crucial role in regulating Salmonella infection. HIF-1α is an important transcription factor that is known to influence the metabolomic status of the cell along with tissue inflammation (73, 74). Our results suggested that Gefitinib, Rapamycin and Acriflavin induces global proteomic changes and also metabolomics reprogramming within the host by perturbing the balance of ATP turn over, glycolysis and Warburg effect. It has been previously reported that Salmonella infection creates Warburg like effect within the host cell thereby shifting the axis toward glycolysis. Interestingly, we found Gefitinib induced reprogramming of metabolism to be closely overlapping the proteo-metabolomics profile of the healthy, demonstrating further that Gefitinib mediated reprogramming is crucial for its host-directed antimicrobial activity. Using the compound library together with proteomics and metabolomics, we identified factors/pathways that are modulated by EGFR-HIF-1α pathways in Salmonella infection, and therefore hypothesize that blocking these factors/pathway during Salmonella infection may lead to provide new targets of HDT for eliminating intracellular pathogens.
Data Availability Statement
The mass spectrometry proteomic data presented in the study are publicly available. This data can be found here: http://www.ebi.ac.uk/pride/archive/projects/PXD024771.
Ethics Statement
The animal study was reviewed and approved by the institutional animal ethics committee—THSTI.
Author Contributions
AA has conceptualized, wrote the paper and supervised the study. SS designed, performed the experiments, collected, analyzed the data, and wrote the paper. RG: performed the proteomics and YK, SS, ZR has performed the serum metabolomics experiment and analysis. BK, TM: Proteomics analysis. AP has provided the Enzo library, MP has performed the experiments, ZR, RP performed the experiments analysed the data. DR, SS: FACS analysis. BK Bioinformatic analysis and RD helped in imaging and analysis. AJ: Advised in performed the experiments, critical inputs in the editing of the paper. All authors contributed to the article and approved the submitted version.
Funding
This work was supported by a core grant of the Translational Health Science and Technology Institute (THSTI/T001). SS supported by the Indian Council of Medical Research (ICMR) SRF fellowship (80/1004/2016-ECD-1).
Conflict of Interest
The authors declare that the research was conducted in the absence of any commercial or financial relationships that could be construed as a potential conflict of interest.
Acknowledgments
We thank CV Srikanth, RCB, Faridabad for providing the Xen 33 strain; Manas Tripathy, Raj Kumar for their help in providing the reagents and helping hands.
Supplementary Material
The Supplementary Material for this article can be found online at: https://www.frontiersin.org/articles/10.3389/fimmu.2021.648710/full#supplementary-material
Supplementary Figure 1 | Identification of Gefitinib as a potent drug against S. typhi. (A) Cytotoxicity assay of compounds. Left panel shows there was no cytotoxicity or direct killing of Salmonella, the right panel shows no cytotoxicity on THP-1 cells. (B) The bar graph represents % inhibition ± SEM of intracellular replication of S. typhi after the post-exposure of Enzo library compounds (1µM). (C) The number of compounds showing <50%, >50%, >80%, >90% inhibition of intracellular survival on dose dependent kinetics (1µM, 100nM, 10nM). (D) The number of compounds showing invasion inhibition in THP-1 cells from below 50% to above 50%, >80%, >90%. (E, F) Percentage Intra-cellular and invasion inhibition of 3 compounds (dose kinetics assay) in caco2 cells. Data represents mean ± SEM from three replicates and repeated three times each individual experiments.
Supplementary Figure 2 | Relative abundance of proteins upon S. typhi-infected macrophages and treatment with Gefitinib, Acriflavin or Rapamycin. (A) Depicts PCA distribution for individual groups. (B) For quantitative analysis, Total intensity count (TIC) is used for normalization (median) among groups. (C) Density plot shows the precursor % CV distribution for all groups. (D) Histogram of average log2 ratio shows the data distribution of all proteins. (E) Heat map indicating the relative expression of proteins in different groups. (F) Intra cellular survival inhibition of Salmonella was observed in THP-1 cells, in the presence of Rapamycin and Acriflavin. (G–P) Demonstrate different key protein modulations in infection and treatment conditions which are important in Glycolysis, TCA cycle, ATP synthesis, Carbon metabolism. (N) mTOR regulatory protein (LAMTOR5) highly upregulated in infection conditions. (O) Hypoxia-inducible factor -1α upregulated protein (HYOU1) was upregulated in infection whereas in treatment it was comparable as control. ****P < 0.0001 (One way ANOVA) (P) Macrophage inhibition factor (MIF) downregulated in treatment conditions. Data representative of triplicates and one technical experiments *P < 0.05, **P < 0.01, ***P < 0.001, ****P < 0.0001 (one way ANOVA).
Supplementary Figure 3 | In vivo effect of treatment on S. Typhimurium infection and disease progression in FVB mice. (A, B) Food and water uptake in different groups. Left panel a Graph show that food and panel b shows water uptake indicates an almost similar pattern in treatment groups as compared to the infection group (n=5 mice per group). Data are representative of mean ± SEM from five biological replicates.
Supplementary Figure 4 | Metabolomic reprogramming of metabolites from S. Typhimurium infected and treated serum samples. (A) Shows 3D distribution on PCA (left) and PLSDA (right) plot for individual groups (n=6). (B) Overview of pathways, (Dark Color circles shows as highly upregulated pathway, light Color circles shows less compare to dark circle) (C–L) Shows that modulation of different metabolites of Glycolysis, TCA cycle, Urea cycle, Gluconeogenesis pathways (n=6). Data represents six biological replicates and one technical experiment.
Supplementary Figure 5 | Gefitinib, Acriflavin decreases ATP synthesis and IL-1β production in BMDMs respectively. (A) Gefitinib plays an important role in autophagy. (B) Salmonella induces ATP synthesis in macrophages, which was drastically decreased in Gefitinib, Acriflavin, and Suramin treated conditions respectively. (C) S. typhi infection of THP-1 cells augments IL-1β secretion, data representative of triplicates ***P < 0.001, ****P < 0.0001 (one way ANOVA).
Supplementary Table 1 | Enzo compound library used for screening for intracellular survival and invasion inhibition of Salmonella in THP-1.
Supplementary Table 2 | Number of protein hits identified through proteomics based on the cut of > 1.5 fold with <0.05 p-value and subset of Proteins identified having distinct metabolic pathways, Shortlisted proteins with differential expression after normalization with the control sample.
References
1. Gibani MM, Britto C, Pollard AJ. Typhoid and paratyphoid fever: a call to action. Curr Opin Infect Dis (2018) 31(5):440–8. doi: 10.1097/QCO.0000000000000479
2. Wain J, Hendriksen RS, Mikoleit ML, Keddy KH, Ochiai R. Typhoid fever. Lancet (2015) 385(9973):1136–45. doi: 10.1016/S0140-6736(13)62708-7
3. Eng S-K, Pusparajah P, Ab Mutalib N-S, Ser H-L, Chan K-G, Lee L-H, et al. Salmonella: A review on pathogenesis, epidemiology and antibiotic resistance. Front Life Sci (2015) 8(3):284–93. doi: 10.1080/21553769.2015.1051243
4. Crump JA, Sjölund-Karlsson M, Gordon MA, Parry CM. Epidemiology, Clinical Presentation, Laboratory Diagnosis, Antimicrobial Resistance, and Antimicrobial Management of Invasive Salmonella Infections. Clin Microbiol Rev (2015) 28(4):901–37. doi: 10.1128/CMR.00002-15
5. Pham OH, McSorley SJ. Protective host immune responses to Salmonella infection. Future Microbiol (2015) 10(1):101–10. doi: 10.2217/fmb.14.98
6. Gogoi M, Shreenivas MM, Chakravortty D. Hoodwinking the Big-Eater to Prosper: The Salmonella-Macrophage Paradigm. J Innate Immun (2019) 11(3):289–99. doi: 10.1159/000490953
7. Crump JA, Luby SP, Mintz ED. The global burden of typhoid fever. Bull World Health Organ (2004) 82(5):346–53.
9. Meiring JE, Giubilini A, Savulescu J, Pitzer VE, Pollard AJ. Generating the Evidence for Typhoid Vaccine Introduction: Considerations for Global Disease Burden Estimates and Vaccine Testing Through Human Challenge. Clin Infect Dis (2019) 69(Suppl 5):S402–s407. doi: 10.1093/cid/ciz630
10. Stanley SA, Barczak AK, Silvis MR, Luo SS, Sogi K, Vokes M, et al. Identification of host-targeted small molecules that restrict intracellular Mycobacterium tuberculosis growth. PloS Pathog (2014) 10(2):e1003946. doi: 10.1371/journal.ppat.1003946
11. Czyz DM, Potluri LP, Jain-Gupta N, Riley SP, Martinez JJ, Steck TL, et al. Host-directed antimicrobial drugs with broad-spectrum efficacy against intracellular bacterial pathogens. mBio (2014) 5(4):e01534–14. doi: 10.1128/mBio.01534-14
12. Chiu HC, Kulp SK, Soni S, Wang D, Gunn JS, Schlesinger LS. Eradication of intracellular Salmonella enterica serovar Typhimurium with a small-molecule, host cell-directed agent. Antimicrob Agents Chemother (2009) 53(12):5236–44. doi: 10.1128/AAC.00555-09
13. Escoll P, Buchrieser C. Metabolic reprogramming of host cells upon bacterial infection: Why shift to a Warburg-like metabolism? FEBS J (2018) 285(12):2146–60. doi: 10.1111/febs.14446
14. Kelly B, O’Neill LA. Metabolic reprogramming in macrophages and dendritic cells in innate immunity. Cell Res (2015) 25(7):771–84. doi: 10.1038/cr.2015.68
15. Escoll P, Buchrieser C. Metabolic reprogramming: an innate cellular defence mechanism against intracellular bacteria? Curr Opin Immunol (2019) 60:117–23. doi: 10.1016/j.coi.2019.05.009
16. Devraj G, Beerlage C, Brüne B, Kempf VA. Hypoxia and HIF-1 activation in bacterial infections. Microbes Infect (2017) 19(3):144–56. doi: 10.1016/j.micinf.2016.11.003
17. Jennewein J, Matuszak J, Walter S, Felmy B, Gendera K, Schatz V. Low-oxygen tensions found in Salmonella-infected gut tissue boost Salmonella replication in macrophages by impairing antimicrobial activity and augmenting Salmonella virulence. Cell Microbiol (2015) 17(12):1833–47. doi: 10.1111/cmi.12476
18. Cardoso MS, Silva TM, Resende M, Appelberg R, Borges M. Lack of the Transcription Factor Hypoxia-Inducible Factor 1α (HIF-1α) in Macrophages Accelerates the Necrosis of Mycobacterium avium-Induced Granulomas. Infect Immun (2015) 83(9):3534–44. doi: 10.1128/IAI.00144-15
19. Palazon A, Goldrath AW, Nizet V, Johnson RS. HIF transcription factors, inflammation, and immunity. Immunity (2014) 41(4):518–28. doi: 10.1016/j.immuni.2014.09.008
20. Peyssonnaux C, Datta V, Cramer T, Doedens A, Theodorakis EA, Gallo RL. HIF-1alpha expression regulates the bactericidal capacity of phagocytes. J Clin Invest (2005) 115(7):1806–15. doi: 10.1172/JCI23865
21. Braverman J, Sogi KM, Benjamin D, Nomura DK, Stanley SAM, Kunder S, et al. HIF-1alpha Is an Essential Mediator of IFN-gamma-Dependent Immunity to Mycobacterium tuberculosis. J Immunol (2016) 197(4):1287–97. doi: 10.4049/jimmunol.1600266
22. Burns JS, Manda G. Metabolic Pathways of the Warburg Effect in Health and Disease: Perspectives of Choice, Chain or Chance. Int J Mol Sci (2017) 18(12):2755. doi: 10.3390/ijms18122755
23. Stecher B, Jung K. LACTATEing Salmonella: A Host-Derived Fermentation Product Fuels Pathogen Growth. Cell Host Microbe (2018) 23(1):3–4. doi: 10.1016/j.chom.2017.12.012
24. Malik S, Sadhu S, Elesela S, Pandey RP, Chawla AS, Sharma D, et al. Transcription factor Foxo1 is essential for IL-9 induction in T helper cells. Nat Commun (2017) 8(1):815. doi: 10.1038/s41467-017-00674-6
25. Lee Y, Awasthi A, Yosef N, Quintana FJ, Xiao S, Peters A, et al. Induction and molecular signature of pathogenic TH17 cells. Nat Immunol (2012) 13(10):991–9. doi: 10.1038/ni.2416
26. Piechocki MP, Dibbley SK, Lonardo F, Yoo GH. Gefitinib prevents cancer progression in mice expressing the activated rat HER2/neu. Int J Cancer (2008) 122(8):1722–9. doi: 10.1002/ijc.23231
27. Chen Y, Wang M, Zhong W, Zhao J. Pharmacokinetic and pharmacodynamic study of Gefitinib in a mouse model of non-small-cell lung carcinoma with brain metastasis. Lung Cancer (2013) 82(2):313–8. doi: 10.1016/j.lungcan.2013.08.013
28. Gillet LC, Navarro P, Tate S, Röst H, Selevsek N, Reiter L, et al. Targeted data extraction of the MS/MS spectra generated by data-independent acquisition: a new concept for consistent and accurate proteome analysis. Mol Cell Proteomics (2012) 11(6):O111.016717.
29. Zhou G, Soufan O, Ewald J, Hancock REW, Basu N, Xia J. NetworkAnalyst 3.0: a visual analytics platform for comprehensive gene expression profiling and meta-analysis. Nucleic Acids Res (2019) 47(W1):W234–41. doi: 10.1093/nar/gkz240
30. Huang da W, Sherman BT, Lempicki RA. Systematic and integrative analysis of large gene lists using DAVID bioinformatics resources. Nat Protoc (2009) 4(1):44–57. doi: 10.1038/nprot.2008.211
31. Pedersen MW, Pedersen N, Ottesen LH, Poulsen HS. Differential response to gefitinib of cells expressing normal EGFR and the mutant EGFRvIII. Br J Cancer (2005) 93(8):915–23. doi: 10.1038/sj.bjc.6602793
32. Lee SH, Koo KH, Park JW, Kim HJ, Ye SK, Park JB, et al. HIF-1 is induced via EGFR activation and mediates resistance to anoikis-like cell death under lipid rafts/caveolae-disrupting stress. Carcinogenesis (2009) 30(12):1997–2004. doi: 10.1093/carcin/bgp233
33. Xu L, Nilsson MB, Saintigny P, Cascone T, Herynk MH, Du Z. Epidermal growth factor receptor regulates MET levels and invasiveness through hypoxia-inducible factor-1alpha in non-small cell lung cancer cells. Oncogene (2010) 29(18):2616–27. doi: 10.1038/onc.2010.16
34. Fan QW, Cheng C, Knight ZA, Haas-Kogan D, Stokoe D, James CD, et al. EGFR signals to mTOR through PKC and independently of Akt in glioma. Sci Signal (2009) 2(55):ra4. doi: 10.1126/scisignal.2000014
35. Sooro MA, Zhang N, Zhang P. Targeting EGFR-mediated autophagy as a potential strategy for cancer therapy. Int J Cancer (2018) 143(9):2116–25. doi: 10.1002/ijc.31398
36. Wang Q, Wei F, Li C, Lv G, Wang G, Liu T, et al. Combination of mTOR and EGFR kinase inhibitors blocks mTORC1 and mTORC2 kinase activity and suppresses the progression of colorectal carcinoma. PloS One (2013) 8(8):e73175. doi: 10.1371/journal.pone.0073175
37. Canales J, Valenzuela M, Bravo J, Cerda-Opazo P, Jorquera C, Toledo H, et al. Helicobacter pylori Induced Phosphatidylinositol-3-OH Kinase/mTOR Activation Increases Hypoxia Inducible Factor-1alpha to Promote Loss of Cyclin D1 and G0/G1 Cell Cycle Arrest in Human Gastric Cells. Front Cell Infect Microbiol (2017) 7:92. doi: 10.3389/fcimb.2017.00092
38. Chen KS, Fustino NJ, Shukla AA, Stroup EK, Budhipramono A, Ateek C, et al. EGF Receptor and mTORC1 Are Novel Therapeutic Targets in Nonseminomatous Germ Cell Tumors. Mol Cancer Ther (2018) 17(5):1079–89. doi: 10.1158/1535-7163.MCT-17-0137
39. Damle SR, Martin RK, Cross JV, Conrad DH. Macrophage migration inhibitory factor deficiency enhances immune response to Nippostrongylus brasiliensis. Mucosal Immunol (2017) 10(1):205–14. doi: 10.1038/mi.2016.29
40. Scartozzi M, Bearzi I, Berardi R, Mandolesi A, Pierantoni C, Cascinu S. Epidermal growth factor receptor (EGFR) downstream signaling pathway in primary colorectal tumours and related metastatic sites: optimising EGFR-targeted treatment options. Br J Cancer (2007) 97(1):92–7. doi: 10.1038/sj.bjc.6603847
41. Barman M, Unold D, Shifley K, Amir E, Hung K, Bos N, et al. Enteric salmonellosis disrupts the microbial ecology of the murine gastrointestinal tract. Infect Immun (2008) 76(3):907–15. doi: 10.1128/IAI.01432-07
42. Mogasale V, Maskery B, Ochiai RL, Lee JS, Mogasale VV, Ramani E, et al. Burden of typhoid fever in low-income and middle-income countries: a systematic, literature-based update with risk-factor adjustment. Lancet Glob Health (2014) 2(10):e570–80. doi: 10.1016/S2214-109X(14)70301-8
43. Schor S, Einav S. Combating Intracellular Pathogens with Repurposed Host-Targeted Drugs. ACS Infect Dis (2018) 4(2):88–92. doi: 10.1021/acsinfecdis.7b00268
44. Zhang Q, Li R, Chen X, Lee SB, Pan J, Xiong D, et al. Effect of weekly or daily dosing regimen of Gefitinib in mouse models of lung cancer. Oncotarget (2017) 8(42):72447–56. doi: 10.18632/oncotarget.19785
45. Galán JE, Pace J, Hayman MJ. Involvement of the epidermal growth factor receptor in the invasion of cultured mammalian cells by Salmonella typhimurium. Nature (1992) 357(6379):588–9. doi: 10.1038/357588a0
46. Verma N, Rai A, Kaushik V. Identification of gefitinib off-targets using a structure-based systems biology approach; their validation with reverse docking and retrospective data mining. Sci Rep (2016) 6(1):33949. doi: 10.1038/srep33949
47. Brehmer D, Greff Z, Godl K, Blencke S, Kurtenbach A, Weber M, et al. Cellular Targets of Gefitinib. Cancer Res (2005) 65(2):379–82.
48. Covarrubias AJ, Aksoylar HI, Horng T. Control of macrophage metabolism and activation by mTOR and Akt signaling. Semin Immunol (2015) 27(4):286–96. doi: 10.1016/j.smim.2015.08.001
49. Land SC, Tee AR. Hypoxia-inducible factor 1alpha is regulated by the mammalian target of rapamycin (mTOR) via an mTOR signaling motif. J Biol Chem (2007) 282(28):20534–43. doi: 10.1074/jbc.M611782200
50. Roy S, Awasthi A. ATP Triggers Human Th9 Cell Differentiation via Nitric Oxide-Mediated mTOR-HIF1α Pathway. Front Immunol (2019) 10(1120). doi: 10.3389/fimmu.2019.01120
51. Mambu J, Virlogeux-Payant I, Holbert S, Grépinet O, Velge P, Wiedemann A. An Updated View on the Rck Invasin of Salmonella: Still Much to Discover. Front Cell Infect Microbiol (2017) 7:500–0. doi: 10.3389/fcimb.2017.00500
52. McNeil A, Dunstan SJ, Clark S, Strugnell RA. Salmonella typhimurium displays normal invasion of mice with defective epidermal growth factor receptors. Infect Immun (1995) 63(7):2770–2. doi: 10.1128/IAI.63.7.2770-2772.1995
53. Owen KA, Meyer CB, Bouton AH, Casanova JE. Activation of focal adhesion kinase by Salmonella suppresses autophagy via an Akt/mTOR signaling pathway and promotes bacterial survival in macrophages. PloS Pathog (2014) 10(6):e1004159. doi: 10.1371/journal.ppat.1004159
54. Zhang YG, Wu S, Xia Y, Sun J. Salmonella infection upregulates the leaky protein claudin-2 in intestinal epithelial cells. PloS One (2013) 8(3):e58606–6. doi: 10.1371/journal.pone.0058606
55. Wiedemann A, Mijouin L, Ayoub MA, Barilleau E, Canepa S, Teixeira-Gomes AP, et al. Identification of the epidermal growth factor receptor as the receptor for Salmonella Rck-dependent invasion. FASEB J (2016) 30(12):4180–91. doi: 10.1096/fj.201600701R
56. Ballou LM, Lin RZ. Rapamycin and mTOR kinase inhibitors. J Chem Biol (2008) 1(1-4):27–36. doi: 10.1007/s12154-008-0003-5
57. Thoreen CC, Kang SA, Chang JW, Liu Q, Zhang J, Gao Y, et al. An ATP-competitive mammalian target of rapamycin inhibitor reveals rapamycin-resistant functions of mTORC1 [published correction appears in J Biol Chem. 2020 Feb 28;295(9):2886]. J Biol Chem (2009) 284(12):8023–32. doi: 10.1074/jbc.M900301200
58. Li J, Kim SG, Blenis J. Rapamycin: one drug, many effects. Cell Metab (2014) 19(3):373–9. doi: 10.1016/j.cmet.2014.01.001
59. Sogi KM, Lien KA, Johnson JR, Krogan NJ, Stanley SA. The Tyrosine Kinase Inhibitor Gefitinib Restricts Mycobacterium tuberculosis Growth through Increased Lysosomal Biogenesis and Modulation of Cytokine Signaling. ACS Infect Dis (2017) 3(8):564–74. doi: 10.1021/acsinfecdis.7b00046
60. Kogut MH, Genovese KJ, He H, Arsenault RJ. AMPK and mTOR: sensors and regulators of immunometabolic changes during Salmonella infection in the chicken. Poult Sci (2016) 95(2):345–53. doi: 10.3382/ps/pev349
61. Weichhart T, Hengstschläger M, Linke M. Regulation of innate immune cell function by mTOR. Nat Rev Immunol (2015) 15(10):599–614. doi: 10.1038/nri3901
62. Beerlage C, Greb J, Kretschmer D, Assaggaf M, Trackman PC, Hansmann ML, et al. Hypoxia-inducible factor 1-regulated lysyl oxidase is involved in Staphylococcus aureus abscess formation. Infect Immun (2013) 81(7):2562–73. doi: 10.1128/IAI.00302-13
63. Shi L, Salamon H, Eugenin E. Infection with Mycobacterium tuberculosis induces the Warburg effect in mouse lungs. Sci Rep (2015) 5:18176. doi: 10.1038/srep18176
64. Lee K, Zhang H, Qian DZ, Rey S, Liu JO, Semenza GL. Acriflavine inhibits HIF-1 dimerization, tumor growth, and vascularization. Proc Natl Acad Sci U S A (2009) 106p(42):17910–5. doi: 10.1073/pnas.0909353106
65. Tee AR. The Target of Rapamycin and Mechanisms of Cell Growth. Int J Mol Sci (2018) 19(3):880. doi: 10.3390/ijms19030880
66. Martins RP, ollado-Romero M, Arce C, Lucena C, Carvajal A, Garrido JJ. Exploring the immune response of porcine mesenteric lymph nodes to Salmonella enterica serovar Typhimurium: an analysis of transcriptional changes, morphological alterations and pathogen burden. Comp Immunol Microbiol Infect Dis (2013) 36(2):149–60. doi: 10.1016/j.cimid.2012.11.003
67. Monack DM, Mueller A, Falkow S. Persistent bacterial infections: the interface of the pathogen and the host immune system. Nat Rev Microbiol (2004) 2(9):747–65. doi: 10.1038/nrmicro955
68. Voedisch S, Koenecke C, David S, Herbrand H, Förster R, Rhen M, et al. Mesenteric lymph nodes confine dendritic cell-mediated dissemination of Salmonella enterica serovar Typhimurium and limit systemic disease in mice. Infect Immun (2009) 77(8):3170–80. doi: 10.1128/IAI.00272-09
69. Dorhoi A, Glaría E, Garcia-Tellez T, Nieuwenhuizen NE, Zelinskyy G, Favier B. MDSCs in infectious diseases: regulation, roles, and readjustment. Cancer Immunol Immunother (2019) 68(4):673–85. doi: 10.1007/s00262-018-2277-y
70. Medina E, Hartl D. Myeloid-Derived Suppressor Cells in Infection: A General Overview. J Innate Immun (2018) 10(5-6):407–13. doi: 10.1159/000489830
71. Magcwebeba T, Dorhoi A, du Plessis N. The Emerging Role of Myeloid-Derived Suppressor Cells in Tuberculosis. Front Immunol (2019) 10:917–7. doi: 10.3389/fimmu.2019.01528
72. Budhwar S, Verma P, Verma R, Rai S, Singh K. The Yin and Yang of Myeloid Derived Suppressor Cells. Front Immunol (2018) 9:2776–6. doi: 10.3389/fimmu.2018.02776
73. Bailey PSJ, Nathan JA. Metabolic Regulation of Hypoxia-Inducible Transcription Factors: The Role of Small Molecule Metabolites and Iron. Biomedicines (2018) 6(2):60. doi: 10.3390/biomedicines6020060
Keywords: Salmonella, gefitinib, HIF-1α, mTOR, EGFR, acriflavin, host directed therapeutics, proteo-metabolomic changes
Citation: Sadhu S, Rizvi ZA, Pandey RP, Dalal R, Rathore DK, Kumar B, Pandey M, Kumar Y, Goel R, Maiti TK, Johri AK, Tiwari A, Pandey AK and Awasthi A (2021) Gefitinib Results in Robust Host-Directed Immunity Against Salmonella Infection Through Proteo-Metabolomic Reprogramming. Front. Immunol. 12:648710. doi: 10.3389/fimmu.2021.648710
Received: 01 January 2021; Accepted: 08 March 2021;
Published: 31 March 2021.
Edited by:
Maurizio Fraziano, University of Rome Tor Vergata, ItalyReviewed by:
Xiaoyun Liu, Peking University, ChinaJennifer Geddes-McAlister, University of Guelph, Canada
Copyright © 2021 Sadhu, Rizvi, Pandey, Dalal, Rathore, Kumar, Pandey, Kumar, Goel, Maiti, Johri, Tiwari, Pandey and Awasthi. This is an open-access article distributed under the terms of the Creative Commons Attribution License (CC BY). The use, distribution or reproduction in other forums is permitted, provided the original author(s) and the copyright owner(s) are credited and that the original publication in this journal is cited, in accordance with accepted academic practice. No use, distribution or reproduction is permitted which does not comply with these terms.
*Correspondence: Amit Awasthi, YWF3YXN0aGlAdGhzdGkucmVzLmlu
†Present address: Ashutosh Tiwari, Sanford Burnham Prebys Medical Discovery Institute, La Jolla, CA, United States