 Bing Yu1†
 Yan-ping Tang
 Xian-wen Guo
- 1Department of Gastroenterology, Second Affiliated Hospital of Guangxi Medical University, Nanning, China
- 2Department of Research, Guangxi Medical University Cancer Hospital, Nanning, China
- 3Department of Gastroenterology, Third Affiliated Hospital of Guangxi Medical University, Nanning, China
- 4Department of Gastroenterology, People’s Hospital of Guangxi Zhuang Autonomous Region, Nanning, China
Abnormal immune cell infiltration is associated with the pathogenesis of Crohn’s disease (CD). This study aimed to determine the diagnostic and predictive value of immune-related genes in CD. Seven Gene Expression Omnibus datasets that analyzed the gene expression in CD tissues were downloaded. Single-sample gene set enrichment analysis (ssGSEA) was used to estimate the infiltration of the immune cells in CD tissues. Immune-related genes were screened by overlapping the immune-related genes with differentially expressed genes (DEGs). The protein-protein interaction (PPI) network was used to identify key immune-related DEGs. Diagnostic value of CD and predictive value of anti-TNFα therapy were analyzed. Immunohistochemical (IHC) assay was used to verify gene expression in CD tissues. There were significant differences among CD tissues, paired CD tissues, and normal intestinal tissues regarding the infiltration of immune cells. AQP9, CD27, and HVCN1 were identified as the key genes of the three sub-clusters in the PPI network. AQP9, CD27, and HVCN1 had mild to moderate diagnostic value in CD, and the diagnostic value of AQP9 was better than that of CD27 and HVCN1. AQP9 expression was decreased in CD after patients underwent anti-TNFα therapy, but no obvious changes were observed in non-responders. AQP9 had a moderate predictive value in patients who had undergone treatment. IHC assay confirmed that the expression of AQP9, CD27, and HVCN1 in CD tissues was higher than that in normal intestinal tissues, and AQP9, CD27 was correlated with the activity of CD. Immune-related genes, AQP9, CD27, and HVCN1 may act as auxiliary diagnostic indicators for CD, and AQP9 could serve as a promising predictive indicator in patients who underwent anti-TNF therapy.
Introduction
Crohn’s disease (CD) is a major type of inflammatory bowel disease (IBD), affecting approximately 0.5% of the worldwide population, and the incidence rate is increasing in China (1, 2). CD is an immune-mediated disorder characterized by chronic inflammation in the gastrointestinal tract. The exact etiology of CD remains largely unknown, but genetic and environmental factors are believed to be the main contributors that trigger inflammatory processes in the intestinal mucosa (3, 4). To date, no curative medical approach is available for CD (5); therefore, exploring the role of immune cells and the related cytokines is crucial for the development of effective therapeutic strategies for patients with CD.
Previous studies have shown that abnormal changes in immune cells and their effective cytokines exaggerate immune responses in the intestinal mucosa of patients with CD. For instance, CD14+ macrophages participate in CD by inducing activation-induced cell death resistance in CD4+ T cells (6). CK2α contributes to the pathogenesis of CD by promoting CD4+ T cell proliferation and Th1 and Th17 response (7). Human leukocyte antigen class II molecules, IL-1, IL-6, and IL-8, are also overexpressed in the intestinal epithelial cells of patients with active CD (8). This evidence demonstrates that chronic inflammation is induced by immune cells in patients with CD.
With the advancement in genomic sequencing technology, an increasing number of microarray analyses of disease-related datasets have been conducted, and these datasets have become an ideal source to quantify immune cell infiltration in various diseases. Recently, Chen et al. (9) provided an overview of immune cell alterations in CD using Gene Expression Omnibus (GEO) datasets and found that CXCL8 and IL-1B have a good diagnostic value in CD. However, relevant cytokines still need to be elucidated. Therefore, in this study, we used single-sample gene set enrichment analysis (ssGSEA) aiming to estimate immune cell infiltration in CD, and assess the role of immune-related cytokines in CD, which will highlight the relationship between immune infiltration at the molecular level and provide potential therapeutic targets for patients with CD.
Materials and Methods
Microarrays Dataset Collection and Data Process
The microarray datasets that investigated the gene expression of CD tissues were downloaded from the GEO database, which included GSE95095 (24 CD tissues, 24 non-inflammatory tissues, and 12 normal intestinal tissues), GSE36807 (13 CD tissues and 13 normal intestinal tissues), GSE98820 (80 CD tissues that before and after adalimumab treatment), GSE112366 (362 CD tissues and 26 normal intestinal tissues), GSE16879 (73 CD tissues and 12 normal intestinal tissues), GSE10616 (32 CD tissues and 13 normal intestinal tissues), and GSE102133 (65 CD tissues and 12 normal intestinal tissues) datasets. These seven datasets comprised CD tissues, paired CD tissues, and normal intestinal tissues. The raw data were preprocessed via background adjustment, quantile normalization, final summarization, and log2 transformation, as previously described (9).
Immune Infiltration Analysis for the Microarrays Datasets
The ssGSEA score was used to determine the level of immune infiltration in each sample of datasets, which was calculated according to the expression levels of immune cell-specific marker genes (10). By defining immune cell-related gene sets, the enrichment score of the gene set represented the density of tumor-infiltrating immune cells. The marker genes for 28 types of immune cells were obtained from a previously published article (11), which included 28 common immune cells and 782 genes. The ssGSEA analysis was performed using the R language (version 3.6.1).
Identification of Immune-Related Differentially Expressed Genes (DEGs)
The probe in each dataset was firstly converted into gene symbol, when there were multiple probes mapped to the same gene symbol; we selected their mean value as the gene expression value. The DEGs between CD and paired CD tissues; or between CD and normal intestinal tissues were analyzed using the “limma package” in R language. Multiple testing corrections were performed using the Beniamini-Hochberg (HB) method. DEGs with a p-value less than 0.01 were considered significant. DEGs and DEGs overlapping with immune cell-specific marker genes were defined as immune-related DEGs, which as selected in the R language and visualized by Venn graph.
Gene Ontology and Protein-Protein Interaction (PPI) Network Analysis of Immune-Related DEGs
Functions of immune-related DEGs were analyzed using Gene Ontology (GO) analyses. GO analyses included biological process (BP), molecular function (MF), and cellular component (CC). Kyoto Encyclopedia of Genes and Genomes (KEGG) analysis was used to identify the significant pathways for gene enrichment. The “clusterProfiler” package (12) was used to conduct the GO analysis, and the p value < 0.05 was considered statistically significant enrichment. The PPI network for the immune-related DEGs was constructed based on the data from the STRING database. STRING database is an online tool for the analysis of protein and protein interactions, which can be used to obtain unique, wide-ranging experimental confirmed, predictive interaction information, and the combined score indicated the interaction between two proteins. In this study, only the interaction pairs with a PPI combined score > 0.7 were selected as significant. A plug-in of Cytoscape, Molecular Complex Detection (MCODE) was also applied to identify the sub-clusters of the PPI network. The core gene of each sub-cluster was selected based on the scores of the genes in the sub-clusters (MCODE score >3; the number of nodes >5).
Immunohistochemical (IHC) Assay
Formalin-fixed, paraffin-embedded tumor tissues were collected from 20 patients with CD diagnosed at the People’s Hospital of Guangxi Zhuang Autonomous Region from December 2019 to June 2020. This study was approved by the Ethics Committee of the People’s Hospital of Guangxi Zhuang Autonomous Region. Primary antibodies used were as follows: Polyclonal rabbit anti−AQP9 (cat. no. 862723; 1:100 dilution; Zen Bioscience); polyclonal rabbit anti−CD27 (cat. no. 383803; 1:100 dilution; Zen Bioscience); polyclonal rabbit anti−HVCN1 (cat. no. 14162-1-AP; 1:200 dilution; Proteintech). The IHC assay was conducted as previously reported (13). IHC results for AQP9, CD27, and HVCN1 were evaluated utilizing the intensity score, which was combined with the staining intensity and area. The intensity score ranged from 0 to 9, with 0 defining no expression and 9 defining high expression.
Statistical Analysis
Mann–Whitney U-test or Student’s t-test was used to compare continuous variables in clinical features between the two groups when appropriate. The ANOVA method was applied to compare the continuous variables among the three groups. Correlation between gene expression and the fraction of immune cells was analyzed using Pearson analysis. The diagnostic value of gene expression in patients with CD and the predictive value of the gene in patients with CD who underwent treatment was analyzed using receiver operating characteristic curves, with the area under the curve (AUC) used to estimate the diagnostic or predicted value. All statistical analyses were performed using R software (version 3.6.0) and SPSS version 19.0 software (SPSS, Inc., Chicago, IL, USA). A two-tailed p-value < 0.05 was considered statistically significant.
Results
The Landscape of Immune Infiltration in Crohn’s Disease
Using ssGSEA, we revealed the landscape of infiltration of 28 immune cell subpopulations in CD by analyzing the GSE95095 dataset. The fraction of immune cells varied distinctly among the three groups (Figure 1). Using the ANOVA method, we found that the fraction of 15/28 immune cells varied distinctly among these three kinds of tissues, and when comparing the CD tissues with non-inflammatory tissues, 22 out of 28 immune cells showed remarkable differences (Suplementary Figure S1). The fraction of immune cells was the highest in CD tissues compared with that in non-inflammatory tissues and normal intestinal tissues. Details of the immune cell fraction are presented in Table 1.
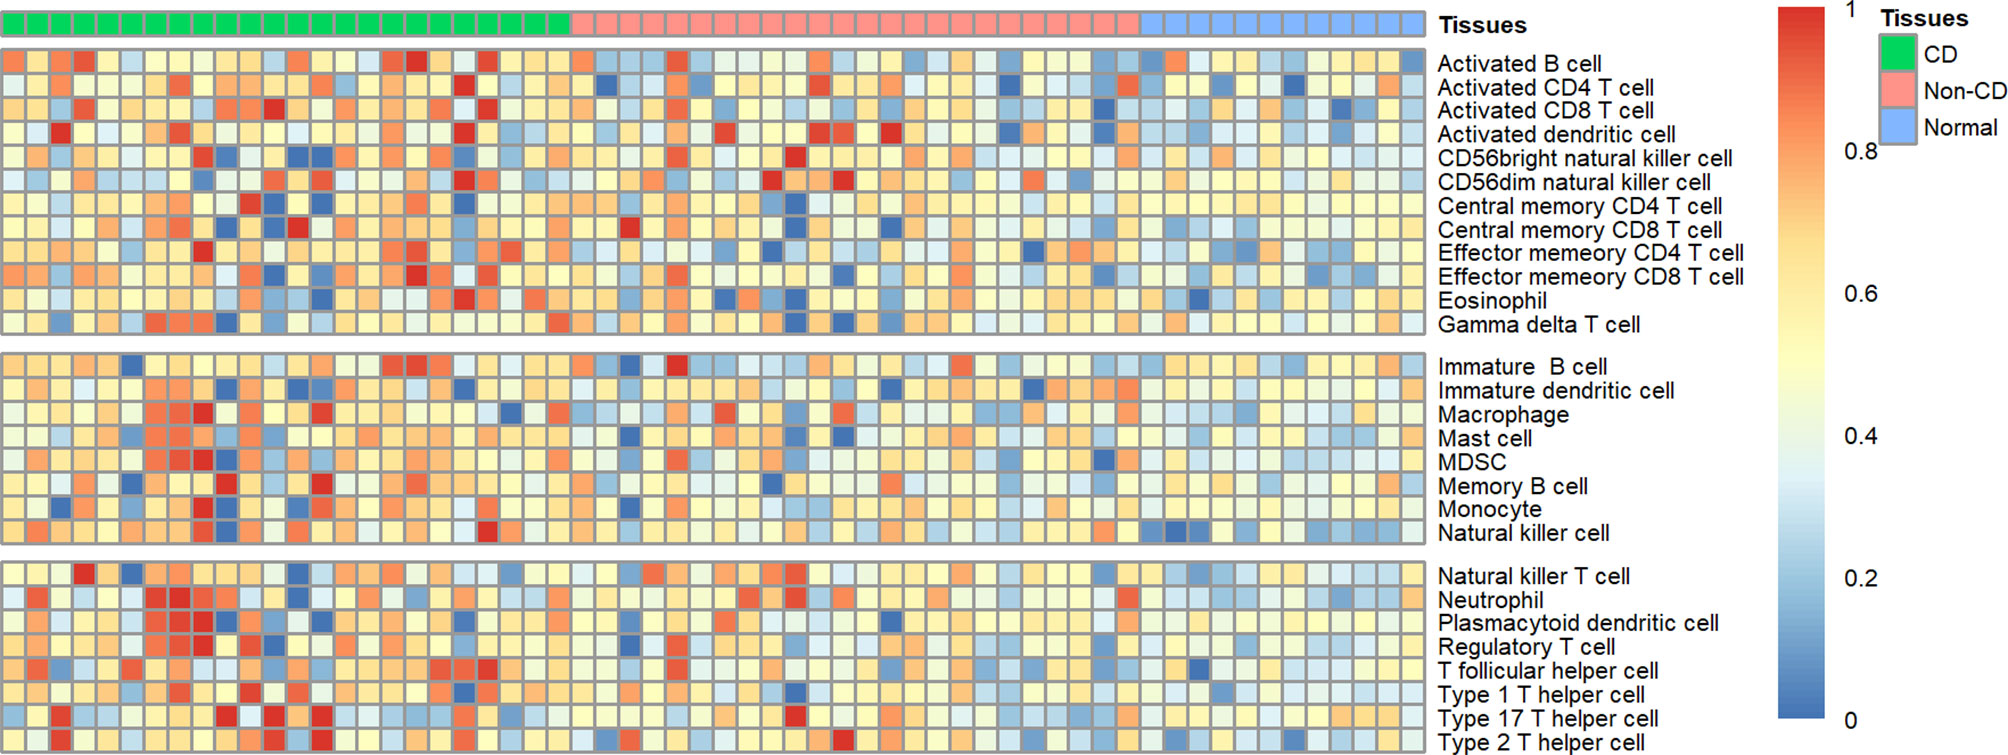
Figure 1 Heatmap of the landscape of 28 immune cell subpopulations infiltration in CD (n=60 tissues).
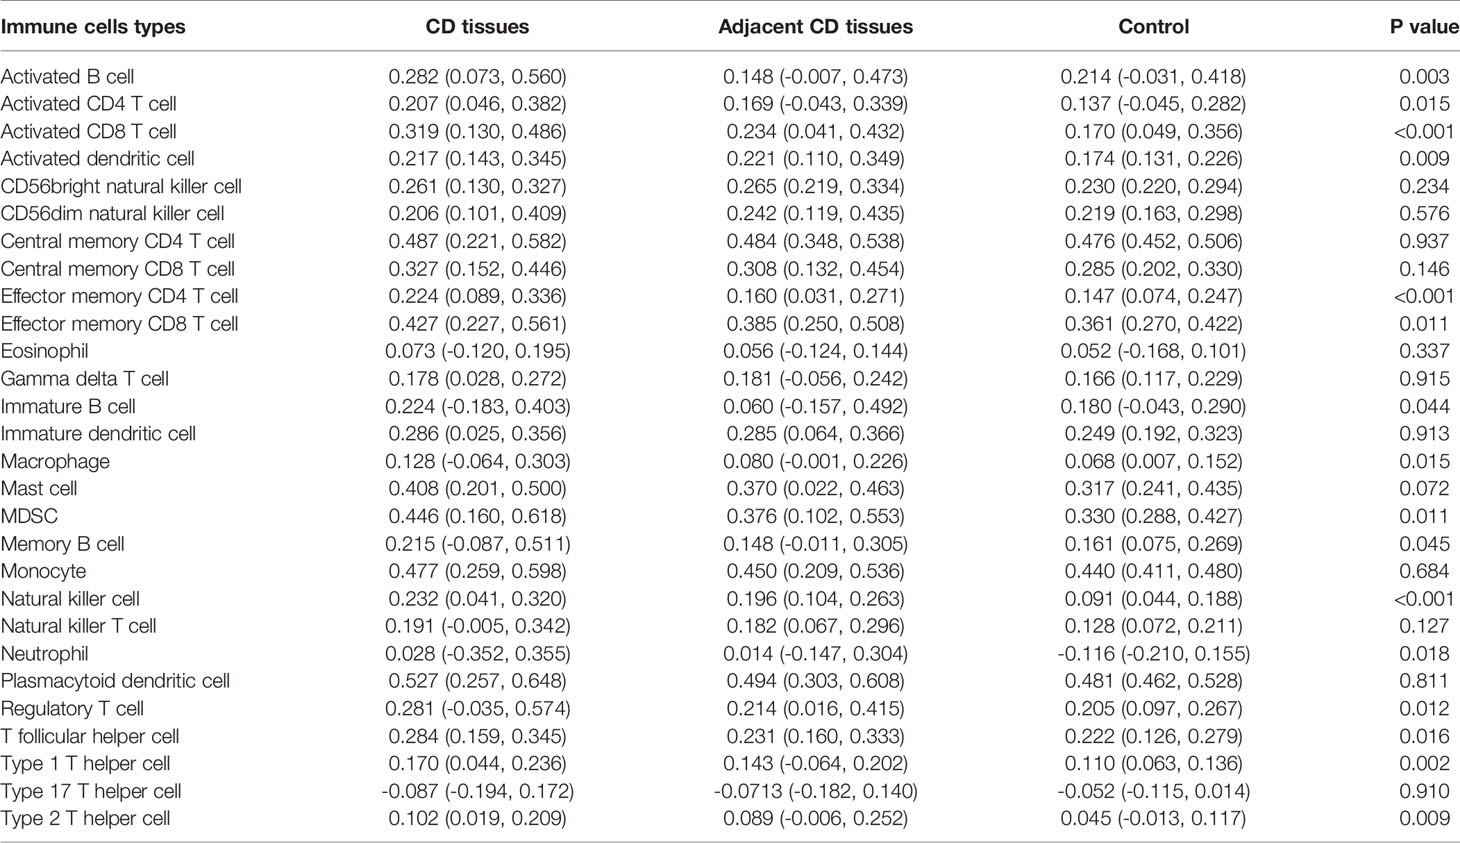
Table 1 Landscape of immune infiltration in Crohn’s disease.
Identification of Key Immune-Related Genes in CD Using the PPI Network
To identify key immune-related genes in CD, we screened DEGs between CD tissues and non-inflammatory tissues using the GSE95095 dataset. DEGs were defined as p-values less than 0.01 and 946 DEGs were identified. After overlapping DEGs and the immune-related genes, 117 immune-related DEGs were identified (Supplementary Table S1). By analyzing the GO functions of these immune-related DEGs, we observed that they were mainly involved in the cell activation and adhesion process, and the KEGG analysis revealed that cytokine receptor interaction pathways were the most enriched ones (Supplementary Figure S2). Using the PPI network, we constructed a network for the 117 immune-related DEGs, and three significant sub-clusters were identified, with each sub-cluster scoring 6.462, 4.154, and 4.133, respectively. AQP9, CD27, and HVCN1 were the key genes of the three sub-clusters, respectively (Figure 2).
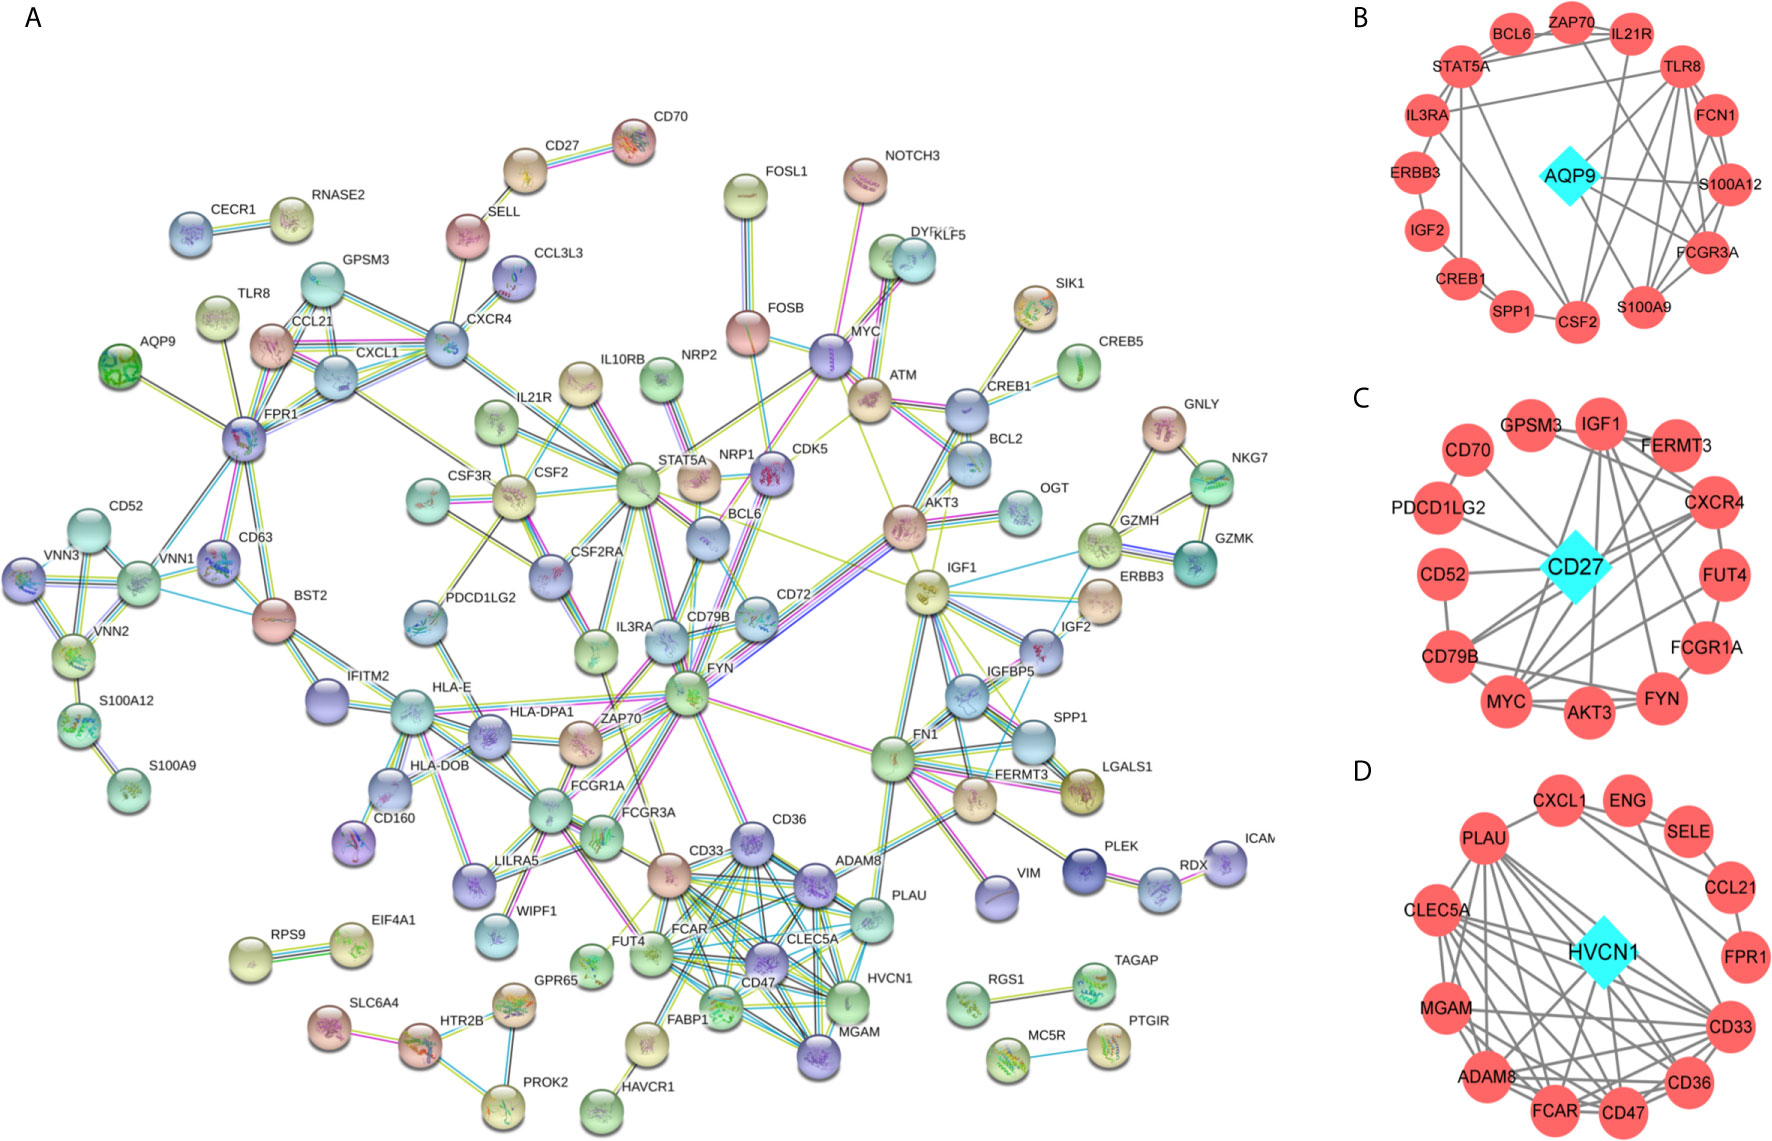
Figure 2 The protein-protein interaction (PPI) network for the DEGs. (A) PPI network for 166 immune-related DEGs, each round node represent a gene; (B–D) Sub-clusters of PPI network, the green diamond shape of node indicated the key gene of sub-cluster.
Correlation of AQP9, CD27, and HVCN1 With Immune Cells in CD
We noted that AQP9, CD27, and HVCN1 were the cell markers of gamma delta T cells, activated B cells, and immature B cells, respectively, and the numbers of these immune cells were all increased in CD tissues compared with those in non-inflammatory tissues (Figure S1). Therefore, we examined the correlation of AQP9, CD27, and HVCN1 with 28 immune cells in CD using the GSE95095 dataset. As shown in Table 2, AQP9 was significantly correlated with Activated CD4 T cell, Activated CD8 T cell, Activated dendritic cell, Macrophage, Regulatory T cell, Type 17 T helper cell, Type 2 T helper cell (p < 0.05); CD27 was remarkably correlated with Activated B cell, Central memory CD8 T cell, Effector memory CD4 T cell, Effector memory CD8 T cell, Natural killer cell, T follicular helper cell (p < 0.05); HVCN1 was greatly correlated with Activated B cell, Effector memory CD8 T cell, Immature B cell, Natural killer cell, Neutrophil, T follicular helper cell, Type 1 T helper cell (p < 0.05).
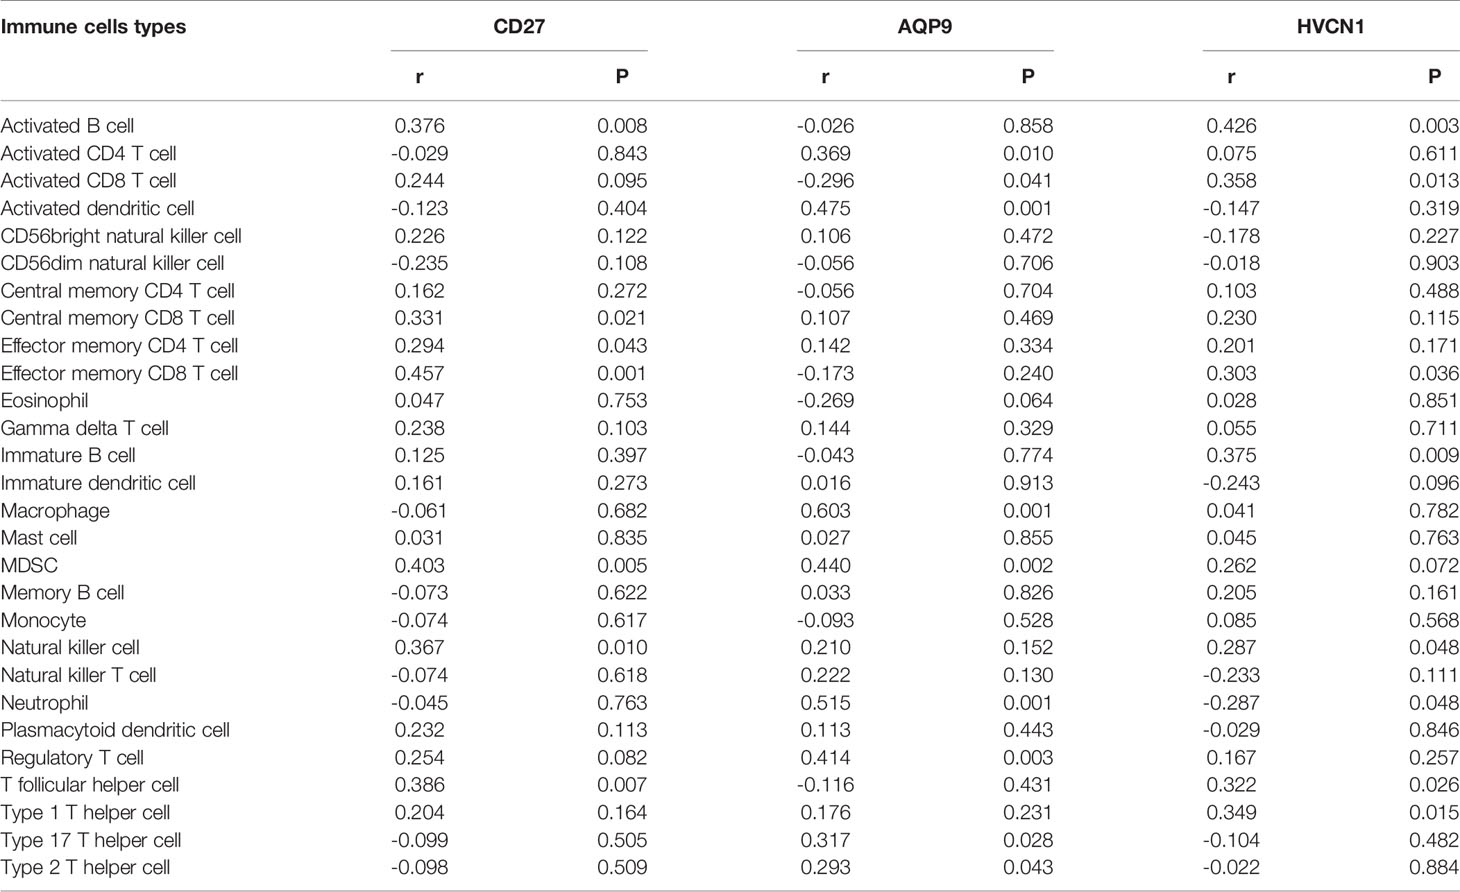
Table 2 Correlation of AQP9, CD27, HVCN1 with immune cells in CD.
Diagnostic Values of AQP9, CD27, and HVCN1 in CD
To determine the diagnostic value of AQP9, CD27, and HVCN1 in CD, the GSE95095 dataset was first used as the training dataset. The results showed that when non-inflammatory tissues were used as controls, the AUC values of AQP9, CD27, and HVCN1 in CD were 0629, 0.657, and 0.654, respectively. When normal intestinal tissues were used as controls, the AUC values of the above genes were 0.885, 0.802, and 0.847, respectively, indicating that these key genes from the PPI sub-clusters had a good performance in the diagnosis of CD, especially when using normal intestinal tissues as controls (Figures 3A, B).
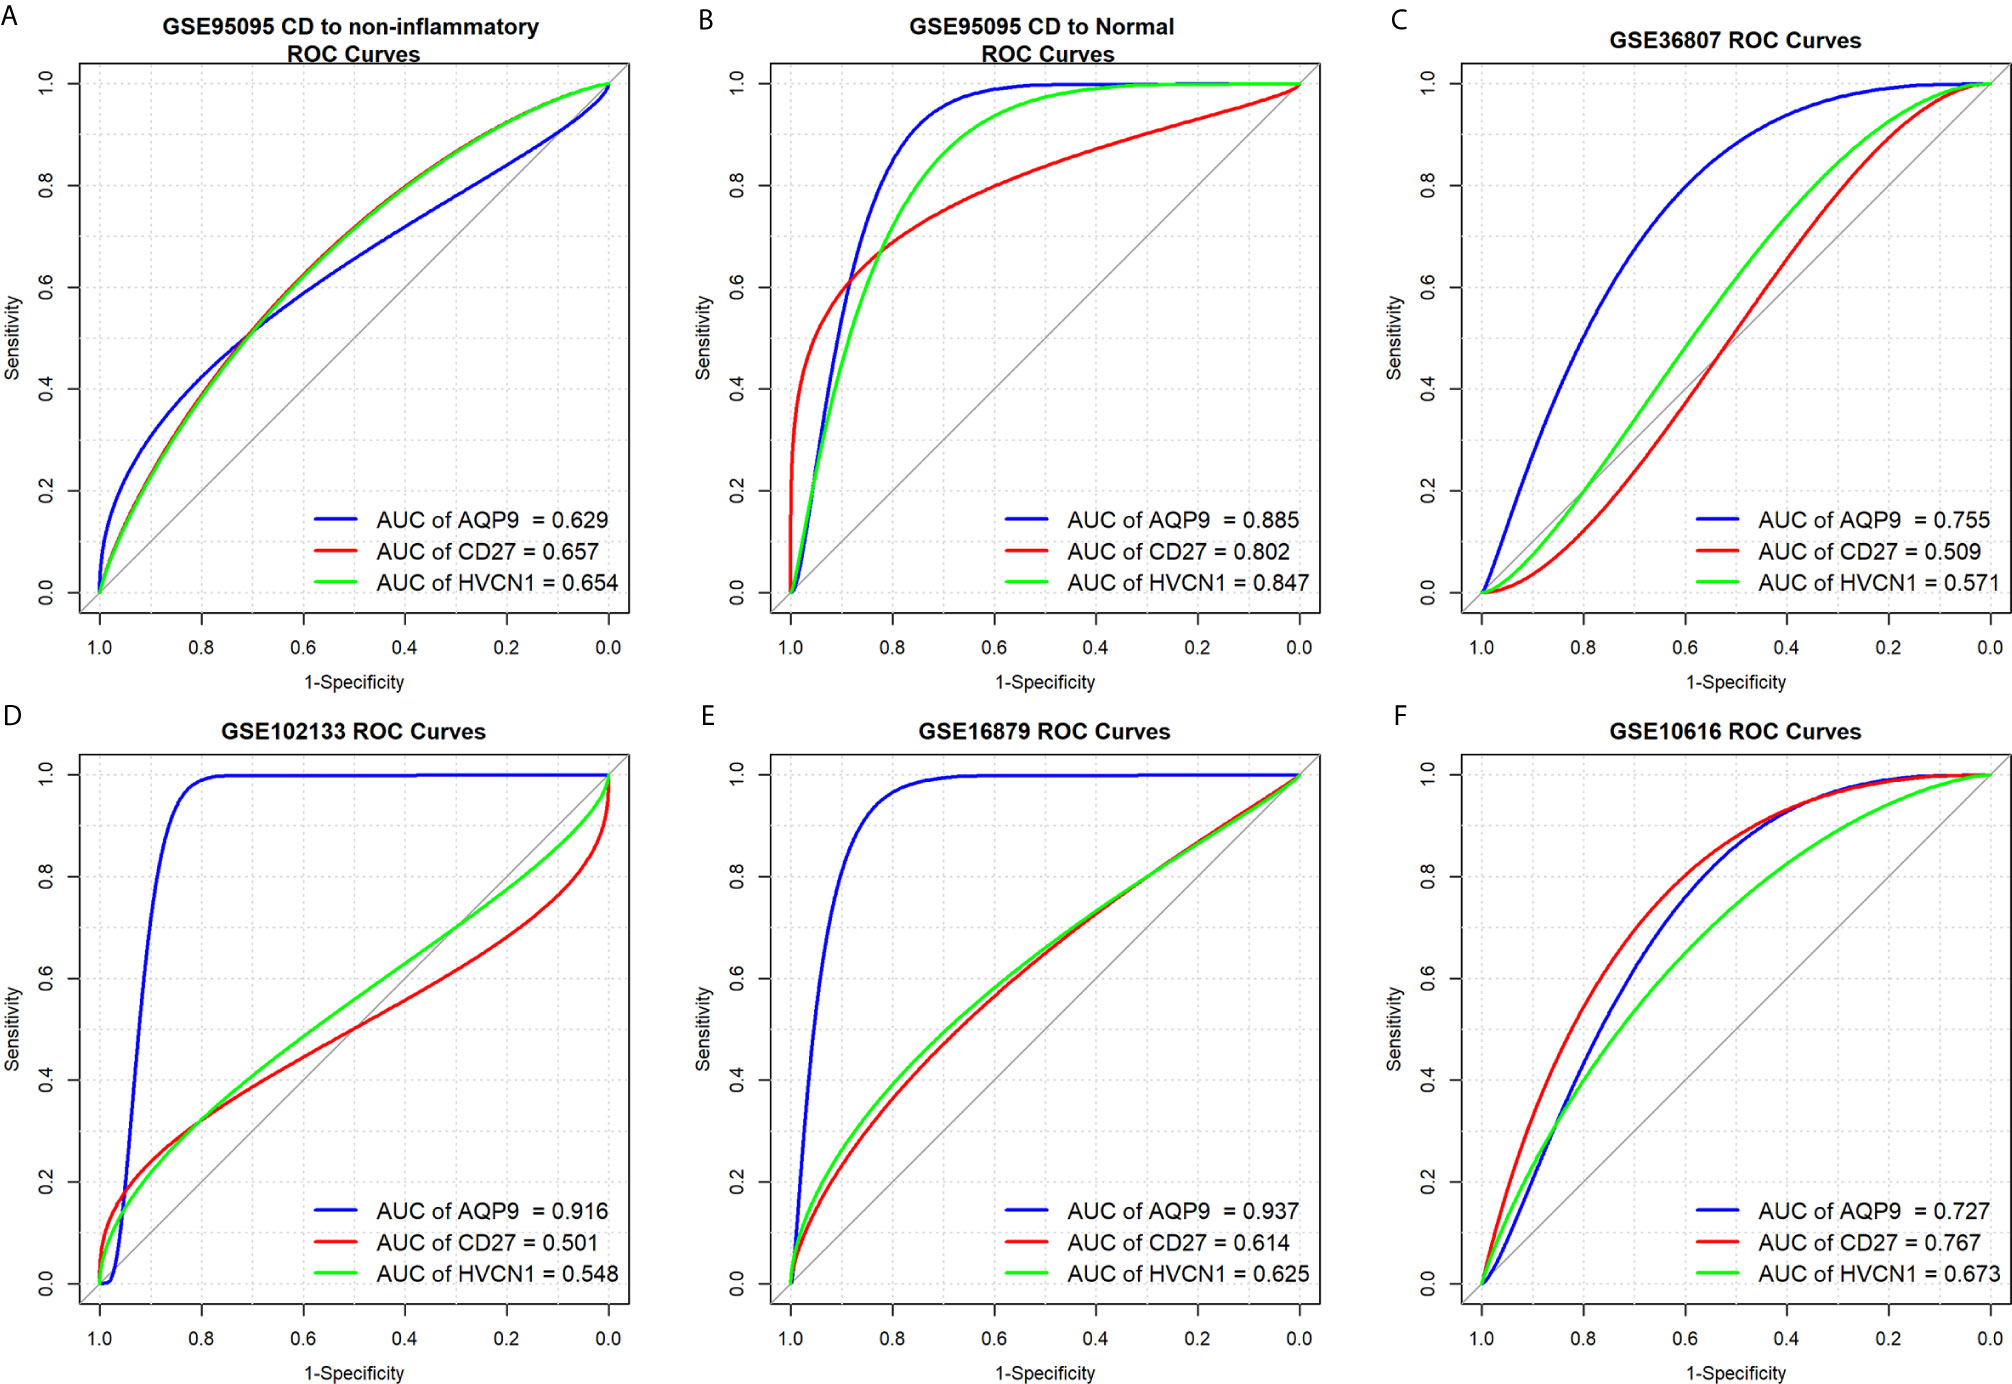
Figure 3 Diagnostic values of AQP9, CD27 and HVCN1 in CD. (A) Diagnostic value of AQP9, CD27, HVCN1 in CD using non-inflammatory tissues as controls (GSE95095 dataset); (B) Diagnostic value of AQP9, CD27, HVCN1 in CD using normal intestinal tissues as controls (GSE95095 dataset); (C) Diagnostic value of AQP9, CD27, HVCN1 in CD (GSE36807 dataset); (D) Diagnostic value of AQP9, CD27, HVCN1 in CD (GSE102133 dataset); (E) Diagnostic value of AQP9, CD27, HVCN1 in CD (GSE16879 dataset); (F) Diagnostic value of AQP9, CD27, HVCN1 in CD (GSE10616 dataset).
Next, four datasets (GSE36807, GSE12366, GSE10616, and GSE102133) were employed to verify the results. The diagnostic value of the three genes was similar to the results from the GSE95095 dataset, and the diagnostic value for AQP9 was better than that of CD27, and HVCN1; with the AUC value raised to 0.916 in the GSE1112366 dataset, and to 0.937 in the GSE16879 dataset (Figures 3C–F). These results indicated that AQP9 had a better diagnostic performance than CD27 and HVCN1 in CD.
Predictive Values of AQP9, CD27, and HVCN1 in the Treatment of CD
Three datasets (GSE16879, GSE98820, and GSE112366) provided the data for patients with CD who had undergone anti-TNFα therapy. Specifically, the GSE16879 dataset provided the data before and after the first infliximab treatment, and the response or no response data to the treatment; GSE98820 dataset provided the data for adalimumab treatment; GSE112366 dataset provided the data for ustekinumab treatment. As shown in GSE98820 and GSE112366 datasets, all patients had responded to anti-TNFα therapy. The results showed that only the expression of AQP9 was decreased after treatment with CD in the three datasets (Figures 4A–C). In particular, the expression of AQP9 did not significantly change in non-responders (p = 0.072; Figure 4D).
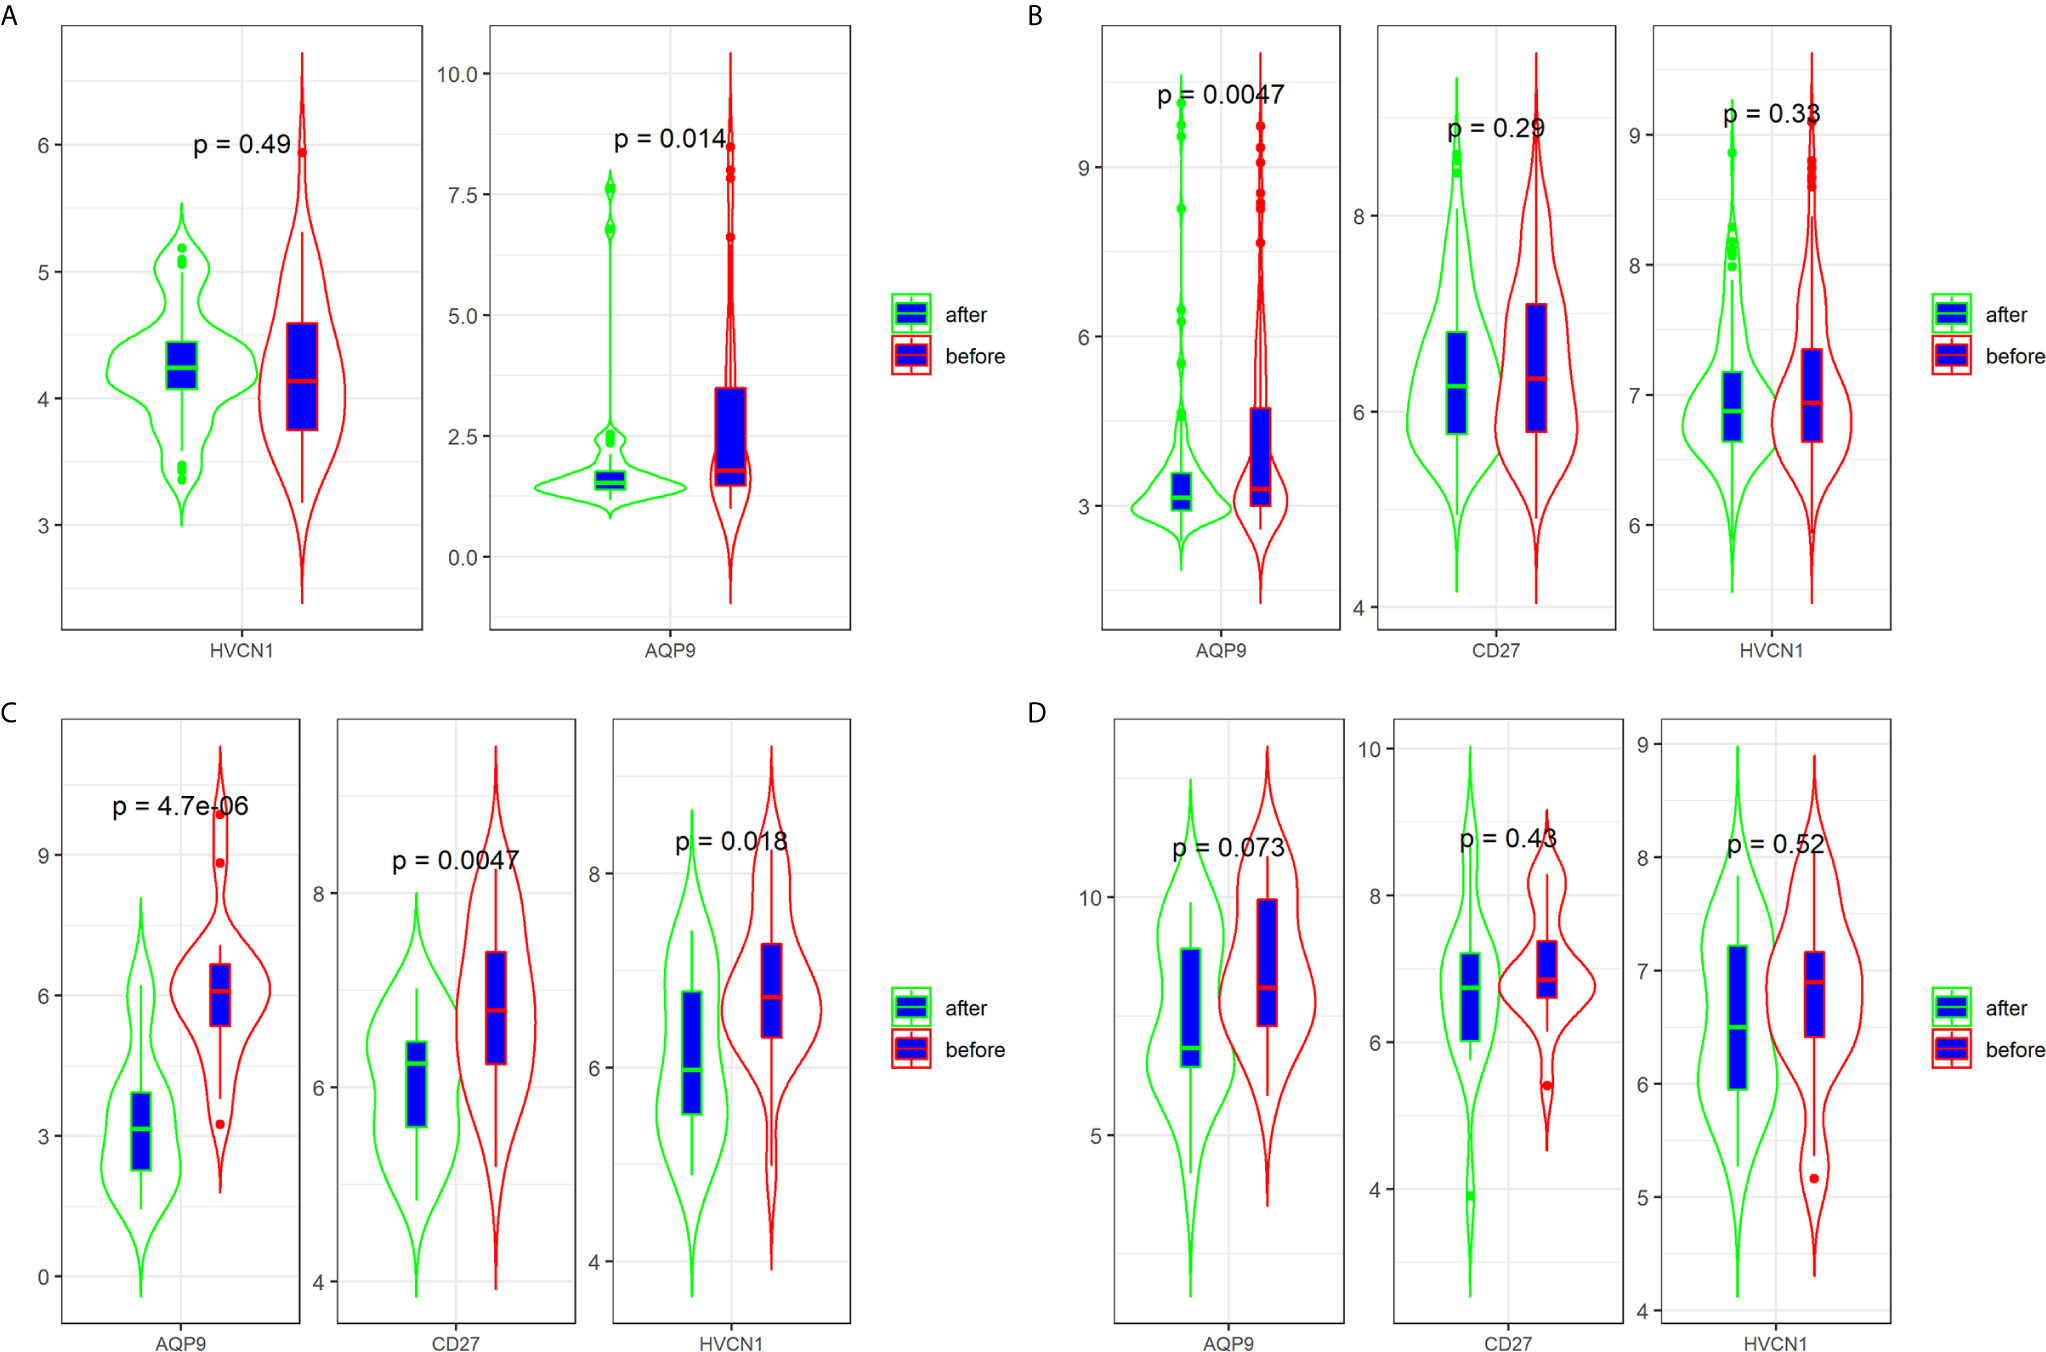
Figure 4 Expression of AQP9, CD27 and HVCN1 in CD tissues that underwent anti-TNFα therapy (A) Expression of AQP9, CD27 and HVCN1 in GSE98820 (this dataset do not has CD27 gene); (B) Expression of AQP9, CD27 and HVCN1 in GSE112366; (C) Expression of AQP9, CD27 and HVCN1 in GSE16879 (only selected responders); (D) Expression of AQP9, CD27 and HVCN1 in GSE16879 (only selected non-responders).
Next, we determined the predictive value of AQP9, CD27, and HVCN1 in the treatment of CD, as shown in Figure 5; AQP9 had a moderate predictive value in patients who had undergone treatment (AUC of AQP9: 0.603–0.885), while the predictive value of CD27 and HVCN1 was mild (AUC of CD27: 0.531–0.754; AUC of HVCN1: 0.537–0.702). Taken together, these results indicated that AQP9 was a promising marker for monitoring and predicting the treatment effect in CD.
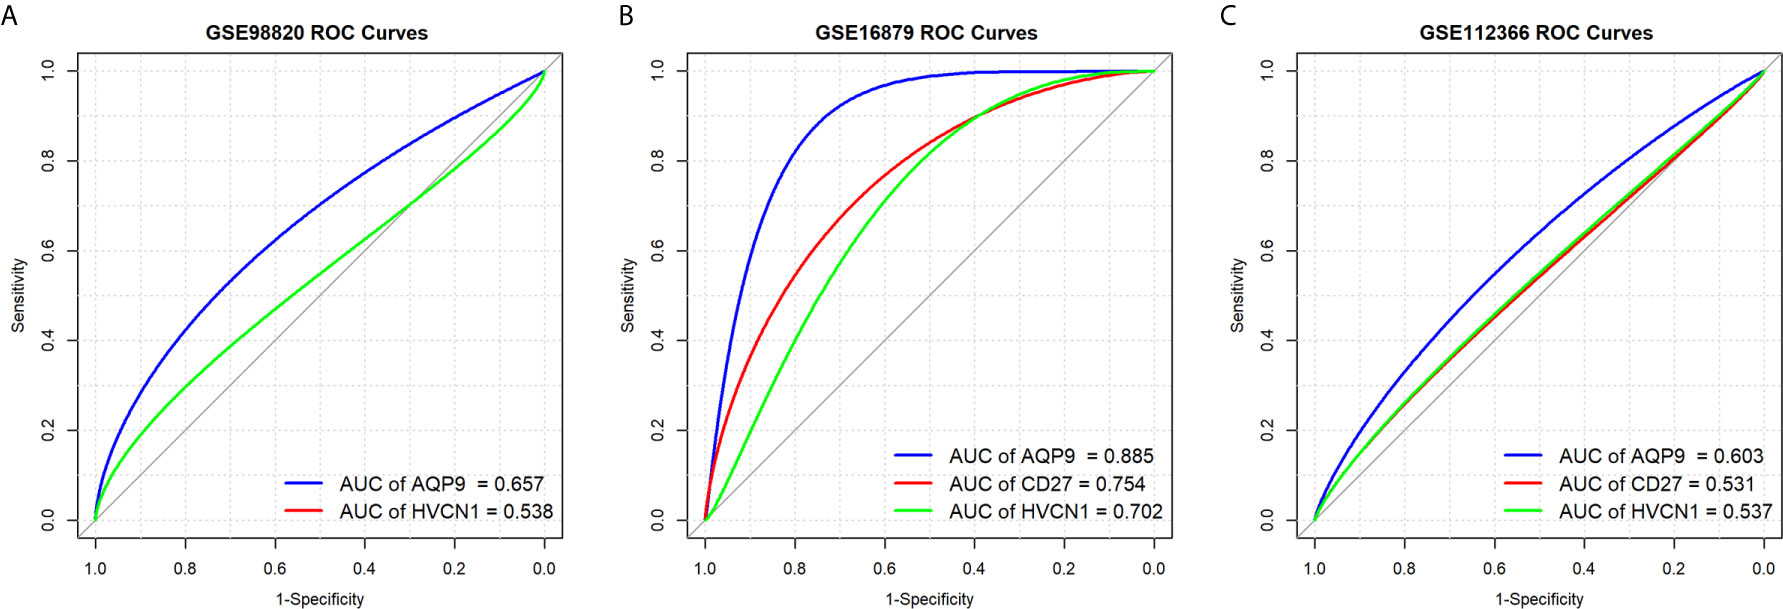
Figure 5 Predictive values of AQP9, CD27 and HVCN1 in the treatment of CD. (A) Predictive value of AQP9 and HVCN1 in the treatment of CD (GSE98820); (B) Predictive value of AQP9, CD27 and HVCN1 in the treatment of CD (GSE16879); (C) Predictive value of AQP9, CD27 and HVCN1 in the treatment of CD (GSE112366).
Expression of AQP9, CD27, and HVCN1 in CD Tissues
The demographic and endoscopic data was listed in the Table 3 and Figure 6A, which the CD was at the activated stage, with the Crohn’s Disease Activity Index (CDAI) ranged from 9 to 16 scores. Using CD tissues from our hospital, we detected the expression of AQP9, CD27, and HVCN1 via IHC (Figures 6B, C). The results revealed that the expression of AQP9, CD27, and HVCN1 was considerably increased in CD tissues compared with the corresponding normal intestinal tissues (p < 0.05), which was consistent with the results of the GSE95095 dataset. We also assessed the association of these genes with the clinical features of patients with CD. However, none of the genes was associated with the patient’s age, gender, and smoking status (p > 0.05; Figure 7A). The correlation analysis revealed that there were significant correlations between the CDAI with AQP9 and CD27, respectively, but not with HVCN1, suggesting AQP9 and CD27 were also associated with the activity of CD (Figure 7B). Taken together, our results suggested that AQP9, CD27, and HVCN1, were involved in the pathogenesis of CD.
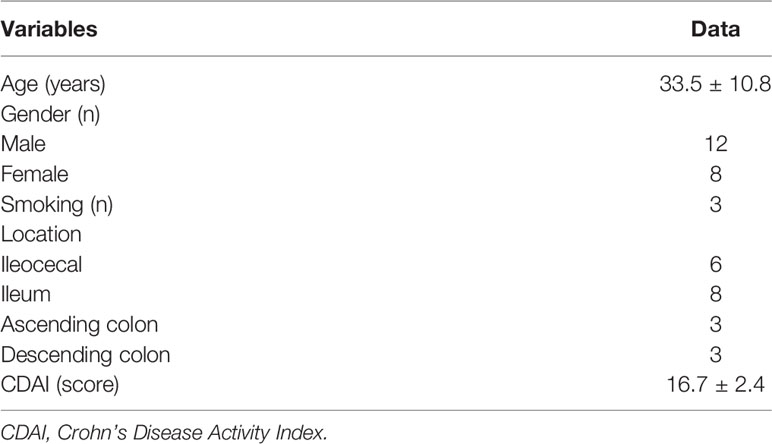
Table 3 Demographic data of CD patients.
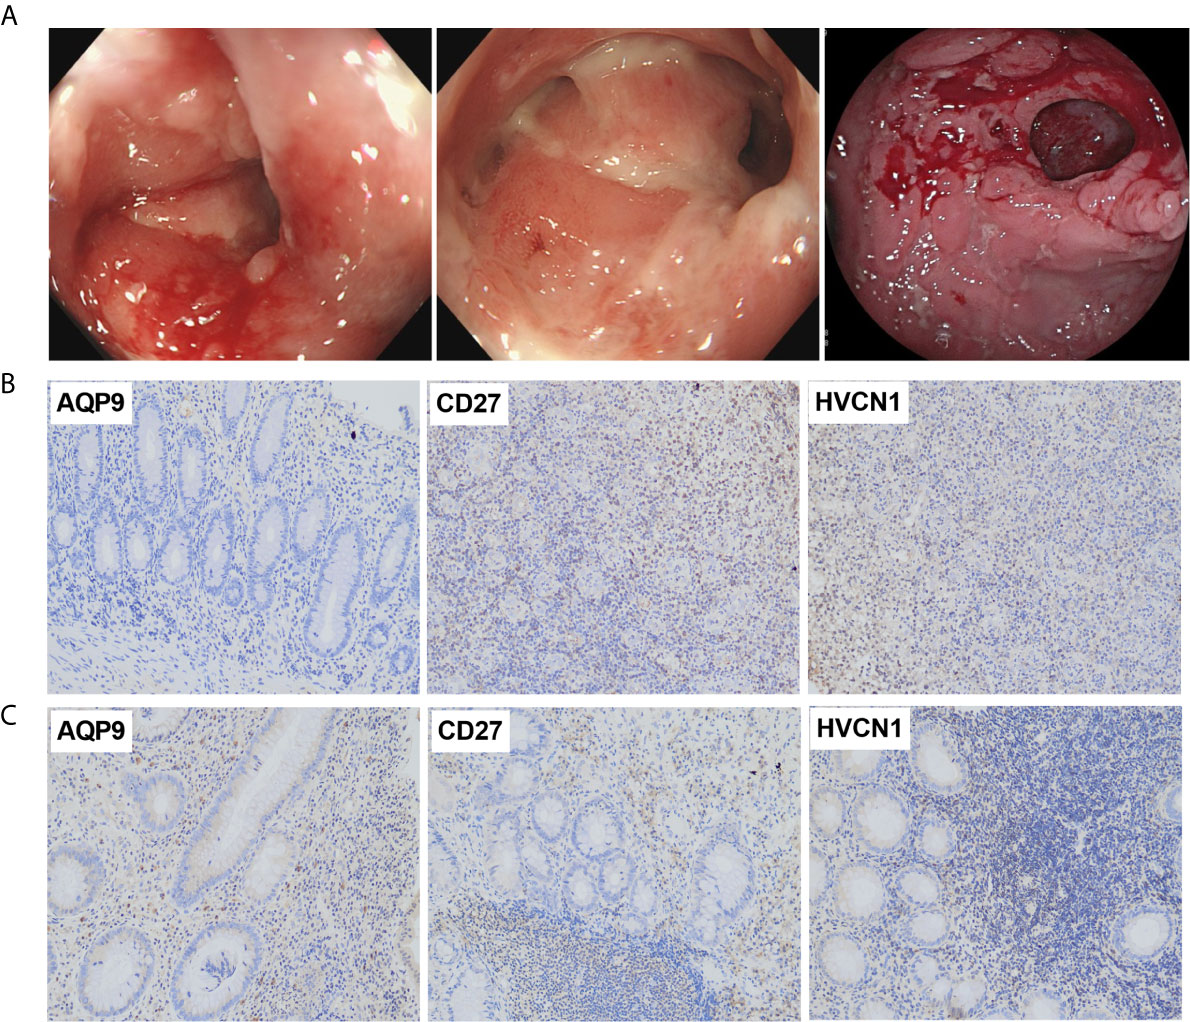
Figure 6 (A) Typical endoscopic images of CD: left, ileum in remission; middle, ileocecal valve; right, colon with ulcer; (B) Expression of AQP9, CD27 and HVCN1 in adjacent normal intestinal tissues, fewer immunostaining can be seen in the mucosa (Magnification ×200); (C) Expression of AQP9, CD27 and HVCN1 in CD tissues, more immunostaining can be seen in the mucosa (Magnification ×200).
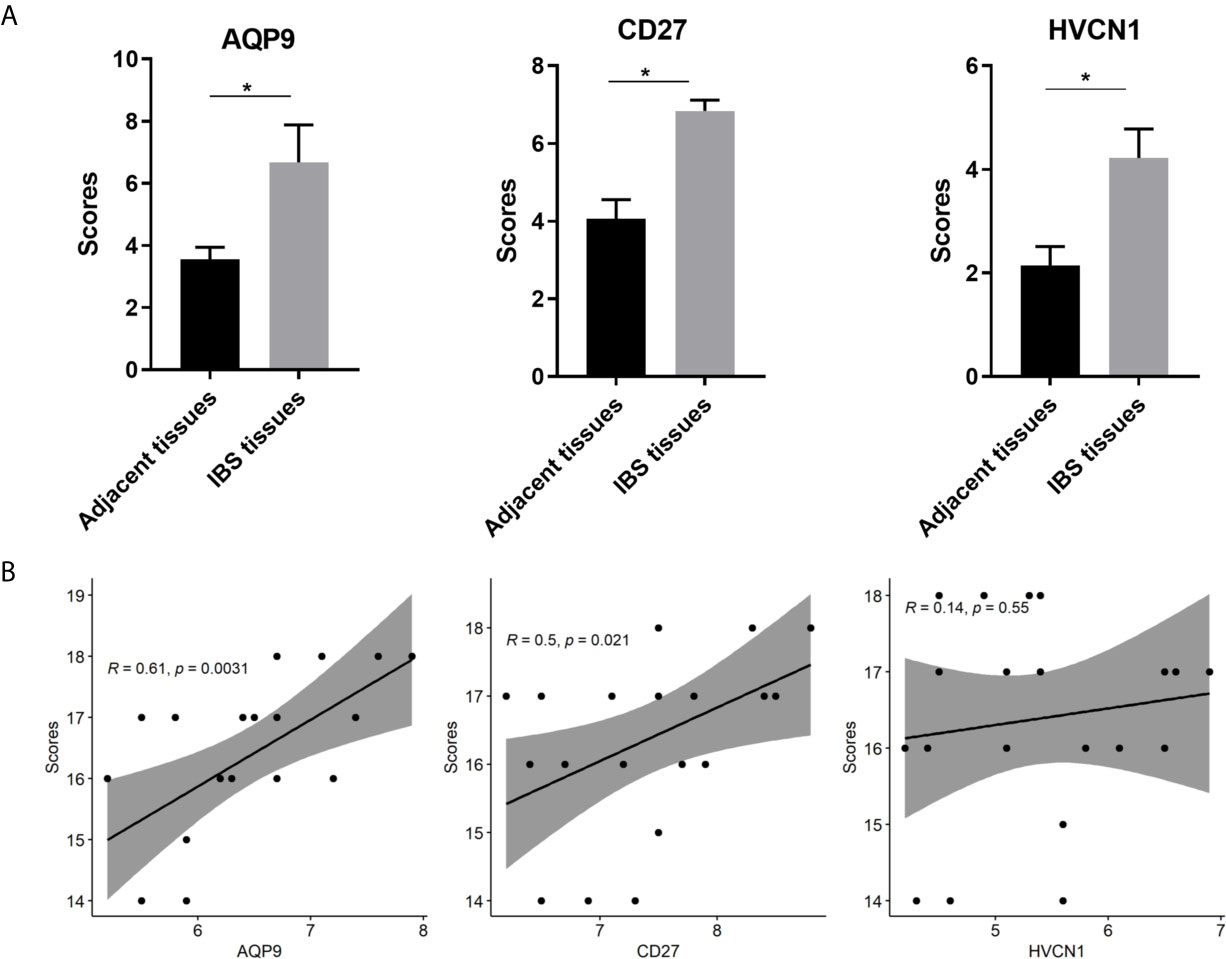
Figure 7 (A) Comparison of IHC intensity score between adjacent normal intestinal tissues and CD tissues regarding the AQP9, CD27 and HVCN1; (B) Correlation analysis between the CDAI scores and the expression of AQP9, CD27 and HVCN1 in CD tissues. IHC, Immunohistochemical; CDAI, Crohn’s Disease Activity Index, *indicated p-value < 0.05.
Discussion
Evidences have confirmed that CD is a chronic inflammatory intestinal disease, which is caused by an unrestrainable immune response against luminal bacterial antigens. The role of inflammatory cells infiltrating in maintaining an active stage is well established and most of the therapeutic strategies are aiming to block the cascade of inflammatory reaction and release of pro-inflammatory cytokines (14, 15). In the present study, by analyzing the data for CD, non-inflammatory tissues, and normal intestinal tissues using ssGSEA, we described the landscape of immune infiltration in CD and found that the fraction of 16 immune cells was significantly different among these three kinds of tissues. In addition, we found more immune cells that were significantly different between CD tissues and non-inflammatory tissues, and most of the immune cells showed higher infiltration in CD tissues than in non-inflammatory tissues. These results were consistent with previous studies (9), which further confirmed the important role of abnormal immune cells in the pathogenesis and progression of CD.
The abnormal immune system is a critical contributor to the pathogenesis and progression of CD (16). During the last decades, many studies have confirmed that CD tissues often present high immune infiltration, and immune cells and immune-related genes are attractive targets for modulating CD progression (17). Importantly, innate and adaptive immune cell infiltration is closely associated with patient response to treatments and clinical outcomes. Therefore, this evidence indicates that the application of immune-based features in CD is a reasonable approach to estimate the pathogenesis and clinical outcome (18). By analyzing the transcriptome data of CD using ssGSEA (19), xCell (20) or CIBERSORTx (9), researchers could provide insights into the regulatory network between CD and immune cells, which could deepen our knowledge on the association of CD with its immune environment.
Generally, immune cells perform their role by secreting immune-related cytokines. We screened the potential immune-related genes by overlapping the immune cell markers and DEGs and using a PPI network to identify the key immune-related genes. The PPI network and the sub-cluster analysis method have been widely applied to identify key genes in the pathogenesis of diseases (21, 22). Using the same method, we firstly established a PPI for the immune-related genes in CD, and then screened the key genes from the sub-cluster of PPI. The results showed that AQP9, CD27, and HVCN1 ranked the highest score in each sub-cluster, and the correlation analysis demonstrated that these three genes were significantly correlated with several immune cells. It is noteworthy that AQP9, CD27, and HVCN1 are associated with CD, as shown in previous studies. For example, AQP9 in the peripheral blood could discriminate patients with CD from patients with chronic inflammation and healthy controls (23). In rat myocardial infarction model, the mRNA and protein expression levels of AQP9 was significantly increased, and silencing AQP9 gene can inhibit the activation of ERK1/2 signaling pathway, attenuate the inflammatory response in rats with myocardial infarction, inhibit apoptosis of myocardial cells, and improve cardiac function (24). In addition, AQP9 was showed to play a role in regulating tissue-specific physiological properties in tight junctions in ulcerative colitis (25). Regarding the CD27 in CD, reduced CD27- IgD- B cells in the blood and raised CD27- IgD- B cells was found in the gut-associated lymphoid tissue in IBD (26), study also observed that patients with CD were characterized by a reduced proportion of B cells of the memory CD27+ phenotype compared to the non-IBD controls (27). In term of HVCN1, expression of HVCN1 was found to significantly positively correlate with the clinical activity of CD (28). Moreover, in cystic fibrosis patients who underwent ivacaftor therapy, the HVCN1 mRNA expression was significantly higher than baseline at 1-3 months and decreased after 6 months of treatment (29). The similar results were found in cystic fibrosis patients who underwent antibiotic therapy (30). All the above evidences demonstrated that the three genes play critical roles in the pathogenesis of inflammatory diseases or CD. Therefore, we select these three genes in the following analysis.
Since AQP9, CD27, and HVCN1 are immune-related genes overexpressed in CD tissues, we assessed the diagnostic value of these three genes. As expected, AQP9, CD27, and HVCN1 had a mild to moderate diagnostic value in CD, especially when using normal intestinal tissues as controls, and the diagnostic value of AQP9 was much better than that of CD27 and HVCN1. Although the diagnostic value of CD27 has been reported in multiple myeloma (31), its diagnostic value in CD has not been described previously. It should be noted that Chen et al. (9) showed that CXCL8, encoding IL-1B, together with immune cells has a good diagnostic value in CD. Therefore, our results provided other candidate diagnostic indicators for diagnosis.
Regarding the treatment of CD, infliximab, adalimumab, and ustekinumab are the crucial agents of anti-TNFα therapy, which have shown high efficacy in many patients with CD (32, 33). However, early identification of non-responders to anti-TNFα therapy remains a challenge in the clinical setting. Currently, some indicators or methods have been reported to predict the response of patients with CD who underwent anti-TNFα therapy, such as serum oncostatin M (34), small bowel ultrasound (35), and SMAD7 (36). However, more indicators still need to be explored. In this study, we examined the predictive value of AQP9, CD27, and HVCN1 in patients who underwent anti-TNFα therapy. Our results indicated that only AQP9 had a good predictive value in those responders. More importantly, the expression of AQP9 did not significantly decrease in non-responders, suggesting a higher specificity of AQP9. To date, although some inflammatory and immune biomarkers are used to diagnose the CD, considering the difficulty of diagnosis CD in the clinical setting, this study provided other alternatives to the diagnosis of CD, and these biomarkers also help to assess the anti-TNFα therapy on CD patients. In addition, our results imply that the expression of AQP9 and CD27, was significantly correlated to the activity of CD, and AQP9 could be served as a valuable indicator to monitor the effect of anti-TNFα treatment.
Although the present study employed many GEO datasets with a larger number of tissues to explore the immune cells and immune-related genes in CD and identified three genes, with promising diagnostic and predictive values in patients with CD, some limitations remain to be addressed. First, the fraction of immune cells in CD tissues was analyzed using ssGSEA; therefore, the results need to be verified using tissue-based flow cytometry. Second, we applied IHC to validate the expression of AQP9, CD27, and HVCN1 in CD tissues; however, due to lack of samples after anti-TNFα therapy, the predictive ability of these genes still needs to be validated in future studies. Third, due to the lack of data, including disease phenotype and disease activity status, the associations between immune cells and related genes, and disease severity, need to be further estimated.
Conclusions
The present study provided insight into the landscape of immune cells underlying CD and identified AQP9, CD27, and HVCN1 as auxiliary diagnostic indicators for CD. We also identified AQP9 as a promising predictive indicator in patients who underwent anti-TNF therapy. However, future studies with larger samples and clinical information using flow cytometry analyses are warranted to validate these findings.
Data Availability Statement
The raw data supporting the conclusions of this article will be made available by the authors, without undue reservation.
Ethics Statement
The studies involving human participants were reviewed and approved by People’s Hospital of Guangxi Zhuang Autonomous Region. The patients/participants provided their written informed consent to participate in this study.
Author Contributions
Study concept and design: BY, X-wG, and B-lH. Collection and assembly of data: Y-xY, Z-gP, and Y-pT. Data analysis and interpretation: BY, Y-xY, Z-gP, and Y-pT. Immunohistochemical assay: BY, K-lW, and X-wG. Manuscript revised: B-lH, K-ZL, and BY. Manuscript writing and review: All authors. All authors contributed to the article and approved the submitted version.
Funding
This study was partially supported by research funding from Cultivation project of NSFC (no. GJPY2019005) and the National Natural Science Foundation of Guangxi (no. 2020GXNSFAA297116).
Conflict of Interest
The authors declare that the research was conducted in the absence of any commercial or financial relationships that could be construed as a potential conflict of interest.
Supplementary Material
The Supplementary Material for this article can be found online at: https://www.frontiersin.org/articles/10.3389/fimmu.2021.643036/full#supplementary-material
References
1. Kaplan GG. The global burden of IBD: from 2015 to 2025. Nat Rev Gastroenterol Hepatol (2015) 12:720–7. doi: 10.1038/nrgastro.2015.150
2. Yu Q, Mao R, Lian L, Ng SC, Zhang S, Chen Z, et al. Surgical management of inflammatory bowel disease in China: a systematic review of two decades. Intest Res (2016) 4:322–32. doi: 10.5217/ir.2016.14.4.322
3. Malesza IJ, Malesza M, Krela-Kazmierczak I, Zielinska A, Souto EB, Dobrowolska A, et al. Primary Humoral Immune Deficiencies: Overlooked Mimickers of Chronic Immune-Mediated Gastrointestinal Diseases in Adults. Int J Mol Sci (2020) 15:5223. doi: 10.3390/ijms21155223
4. Annese V. Genetics and epigenetics of IBD. Pharmacol Res (2020) 159:104892. doi: 10.1016/j.phrs.2020.104892
5. Kim MJ, Choe YH. Change in the treatment strategy for pediatric Crohn’s disease. Korean J Pediatr (2010) 9:830–3. doi: 10.3345/kjp.2010.53.9.830
6. Liu H, Liang Z, Wang F, Zheng X, Zeng Z, He X, et al. Intestinal CD14+ macrophages protect CD4+ T cells from activation-induced cell death via exosomal membrane TNF in Crohn’s disease. J Crohns Colitis (2020) 11:1619–31. doi: 10.1093/ecco-jcc/jjaa083
7. Yang W, Gibson SA, Yan Z, Wei H, Tao J, Sha B, et al. Protein kinase 2 (CK2) controls CD4(+) T cell effector function in the pathogenesis of colitis. Mucosal Immunol (2020) 5:788–98. doi: 10.1038/s41385-020-0258-x
8. Malik TA. Inflammatory Bowel Disease: Historical Perspective, Epidemiology, and Risk Factors. Surg Clin North Am (2015) 6:1105–22. doi: 10.1016/j.suc.2015.07.006
9. Chen H, Chen C, Yuan X, Xu W, Yang MQ, Li Q, et al. Identification of Immune Cell Landscape and Construction of a Novel Diagnostic Nomogram for Crohn’s Disease. Front Genet (2020) 11:423. doi: 10.3389/fgene.2020.00423
10. Subramanian A, Tamayo P, Mootha VK, Mukherjee S, Ebert BL, Gillette MA, et al. Gene set enrichment analysis: a knowledge-based approach for interpreting genome-wide expression profiles. Proc Natl Acad Sci USA (2005) 43:15545–50. doi: 10.1073/pnas.0506580102
11. Bindea G, Mlecnik B, Tosolini M, Kirilovsky A, Waldner M, Obenauf AC, et al. Spatiotemporal dynamics of intratumoral immune cells reveal the immune landscape in human cancer. Immunity (2013) 4:782–95. doi: 10.1016/j.immuni.2013.10.003
12. Yu G, Wang LG, Han Y, He QY. clusterProfiler: an R package for comparing biological themes among gene clusters. OMICS (2012) 5:284–7. doi: 10.1089/omi.2011.0118
13. Xue Y, Tong L, LiuAnwei Liu F, Liu A, Zeng S, Xiong Q, et al. Tumorinfiltrating M2 macrophages driven by specific genomic alterations are associated with prognosis in bladder cancer. Oncol Rep (2019) 2:581–94. doi: 10.3892/or.2019.7196
14. Petagna L, Antonelli A, Ganini C, Bellato V, Campanelli M, Divizia A, et al. Pathophysiology of Crohn’s disease inflammation and recurrence. Biol Direct (2020) 1:23. doi: 10.1186/s13062-020-00280-5
15. Shivaji UN, Evans M, Critchlow T, Gui X, Smith SCL, Pinkney T, et al. Chronic inflammation and other changes are significant components of clinically fibrotic strictures in Crohn’s disease: a histological study of resected strictures clinically characterized as noninflamed. Eur J Gastroenterol Hepatol (2020) 11:1432–9. doi: 10.1097/MEG.0000000000001796
16. Di Jiang C, Raine T. IBD considerations in spondyloarthritis. Ther Adv Musculoskelet Dis (2020) 12:1759720X20939410. doi: 10.1177/1759720X20939410
17. Malik T, Mannon P. Inflammatory bowel diseases: emerging therapies and promising molecular targets. Front Biosci (Schol Ed) (2012) 4:1172–89. doi: 10.2741/s324
18. Giuffrida P, Di Sabatino A. Targeting T cells in inflammatory bowel disease. Pharmacol Res (2020) 159:105040. doi: 10.1016/j.phrs.2020.105040
19. Liu Y, Zhou S, Hu J, Xu W, Liu D, Liao J, et al. Characterization of aberrant pathways activation and immune microenviroment of BK virus associated nephropathy. Aging (Albany NY) (2020) 12:14434–51. doi: 10.18632/aging.103486
20. Zhang J, Wei X, Tang Z, Miao B, Luo Y, Hu X, et al. Elucidating the molecular pathways and immune system transcriptome during ischemia-reperfusion injury in renal transplantation. Int Immunopharmacol (2020) 81:106246. doi: 10.1016/j.intimp.2020.106246
21. Cheng C, Hua J, Tan J, Qian W, Zhang L, Hou X. Identification of differentially expressed genes, associated functional terms pathways, and candidate diagnostic biomarkers in inflammatory bowel diseases by bioinformatics analysis. Exp Ther Med (2019) 1:278–88. doi: 10.3892/etm.2019.7541
22. Bo L, Fu H, Yang J. Comprehensive analysis of gene expression profiles provides insight into the pathogenesis of Crohn’s disease. Mol Med Rep (2018) 3:2643–50. doi: 10.3892/mmr.2018.9267
23. Mesko B, Poliska S, Szegedi A, Szekanecz Z, Palatka K, Papp M, et al. Peripheral blood gene expression patterns discriminate among chronic inflammatory diseases and healthy controls and identify novel targets. BMC Med Genomics (2010) 3:15. doi: 10.1186/1755-8794-3-15
24. Huang X, Yu X, Li H, Han L, Yang X. Regulation mechanism of aquaporin 9 gene on inflammatory response and cardiac function in rats with myocardial infarction through extracellular signal-regulated kinase1/2 pathway. Heart Vessels (2019) 12:2041–51. doi: 10.1007/s00380-019-01452-8
25. Taman H, Fenton CG, Hensel IV, Anderssen E, Florholmen J, Paulssen RH. Transcriptomic Landscape of Treatment-Naive Ulcerative Colitis. J Crohns Colitis (2018) 3:327–36. doi: 10.1093/ecco-jcc/jjx139
26. Pararasa C, Zhang N, Tull TJ, Chong MHA, Siu JHY, Guesdon W, et al. Reduced CD27(-)IgD(-) B Cells in Blood and Raised CD27(-)IgD(-) B Cells in Gut-Associated Lymphoid Tissue in Inflammatory Bowel Disease. Front Immunol (2019) 10:361. doi: 10.3389/fimmu.2019.00361
27. Rabe H, Malmquist M, Barkman C, Ostman S, Gjertsson I, Saalman R, et al. Distinct patterns of naive, activated and memory T and B cells in blood of patients with ulcerative colitis or Crohn’s disease. Clin Exp Immunol (2019) 1:111–29. doi: 10.1111/cei.13294
28. Haglund S, Almer S, Peterson C, Soderman J. Gene expression and thiopurine metabolite profiling in inflammatory bowel disease - novel clues to drug targets and disease mechanisms? PLoS One (2013) 2:e56989. doi: 10.1371/journal.pone.0056989
29. Guerra L, D’Oria S, Favia M, Castellani S, Santostasi T, Polizzi AM, et al. CFTR-dependent chloride efflux in cystic fibrosis mononuclear cells is increased by ivacaftor therapy. Pediatr Pulmonol (2017) 7:900–8. doi: 10.1002/ppul.23712
30. Conese M, Castellani S, Lepore S, Palumbo O, Manca A, Santostasi T, et al. Evaluation of genome-wide expression profiles of blood and sputum neutrophils in cystic fibrosis patients before and after antibiotic therapy. PLoS One (2014) 8:e104080. doi: 10.1371/journal.pone.0104080
31. Chu B, Bao L, Wang Y, Lu M, Shi L, Gao S, et al. CD27 antigen negative expression indicates poor prognosis in newly diagnosed multiple myeloma. Clin Immunol (2020) 213:108363. doi: 10.1016/j.clim.2020.108363
32. Hodgson R, Walton M, Biswas M, Mebrahtu T, Woolacott N. Ustekinumab for Treating Moderately to Severely Active Crohn’s Disease after Prior Therapy: An Evidence Review Group Perspective of a NICE Single Technology Appraisal. Pharmacoeconomics (2018) 4:387–98. doi: 10.1007/s40273-017-0593-2
33. Qasem A, Naser AE, Naser SA. The alternate effects of anti-TNFalpha therapeutics and their role in mycobacterial granulomatous infection in Crohn’s disease. Expert Rev Anti Infect Ther (2017) 7:637–43. doi: 10.1080/14787210.2017.1328276
34. Bertani L, Fornai M, Fornili M, Antonioli L, Benvenuti L, Tapete G, et al. Serum oncostatin M at baseline predicts mucosal healing in Crohn’s disease patients treated with infliximab. Aliment Pharmacol Ther (2020) 2:284–91. doi: 10.1111/apt.15870
35. Dolinger MT, Choi JJ, Phan BL, Rosenberg HK, Rowland J, Dubinsky MC. Use of Small Bowel Ultrasound to Predict Response to Infliximab Induction in Pediatric Crohn’s Disease. J Clin Gastroenterol (2021) 5:429–32. doi: 10.1097/MCG.0000000000001367
Keywords: Crohn’s disease, immune-related genes, gene set enrichment analysis, protein-protein interaction, differentially expressed genes
Citation: Yu B, Yin Y-x, Tang Y-p, Wei K-l, Pan Z-g, Li K-Z, Guo X-w and Hu B-l (2021) Diagnostic and Predictive Value of Immune-Related Genes in Crohn’s Disease. Front. Immunol. 12:643036. doi: 10.3389/fimmu.2021.643036
Received: 29 December 2020; Accepted: 30 March 2021;
Published: 16 April 2021.
Edited by:
Maria Gazouli, National and Kapodistrian University of Athens, GreeceReviewed by:
Giorgos Bamias, National and Kapodistrian University of Athens, GreeceKostas Katsanos, University Hospital of Ioannina, Greece
Copyright © 2021 Yu, Yin, Tang, Wei, Pan, Li, Guo and Hu. This is an open-access article distributed under the terms of the Creative Commons Attribution License (CC BY). The use, distribution or reproduction in other forums is permitted, provided the original author(s) and the copyright owner(s) are credited and that the original publication in this journal is cited, in accordance with accepted academic practice. No use, distribution or reproduction is permitted which does not comply with these terms.
*Correspondence: Xian-wen Guo, 398919829@qq.com; Bang-li Hu, hubangli@gxmu.edu.cn
†These authors have contributed equally to this work