
94% of researchers rate our articles as excellent or good
Learn more about the work of our research integrity team to safeguard the quality of each article we publish.
Find out more
ORIGINAL RESEARCH article
Front. Immunol., 23 March 2021
Sec. Immunological Tolerance and Regulation
Volume 12 - 2021 | https://doi.org/10.3389/fimmu.2021.642678
This article is part of the Research TopicCharacterization, Functions, and Roles of Antigen-Specific Regulatory T Cells in Health and DiseaseView all 18 articles
 Dorota Iwaszkiewicz-Grzes1†
 Magdalena Piotrowska1†
 Mateusz Gliwinski1
 Zuzanna Urban-Wójciuk2
 Piotr Trzonkowski1*
Background: Human regulatory T cells (Tregs) are the fundamental component of the immune system imposing immune tolerance via control of effector T cells (Teffs). Ongoing attempts to improve Tregs function have led to the creation of a protocol that produces antigen-specific Tregs, when polyclonal Tregs are stimulated with monocytes loaded with antigens specific for type 1 diabetes. Nevertheless, the efficiency of the suppression exerted by the produced Tregs depended on the antigen with the best results when insulin β chain peptide 9-23 was used. Here, we examined epigenetic modifications, which could influence these functional differences.
Methods: The analysis was pefromed in the sorted specific (SPEC, proliferating) and unspecific (UNSPEC, non-proliferating) subsets of Tregs and Teffs generated by the stimulation with monocytes loaded with either whole insulin (INS) or insulin β chain peptide 9-23 (B:9-23) or polyclonal cells stimulated with anti-CD3/anti-CD28 beads (POLY). A relative expression of crucial Tregs genes was determined by qRT-PCR. The Treg-specific demethylated region (TSDR) in FoxP3 gene methylation levels were assessed by Quantitative Methylation Specific PCR (qMSP). ELISA was used to measure genomic DNA methylation and histone H3 post-translational modifications (PTMs).
Results: Tregs SPECB:9-23 was the only subset expressing all assessed genes necessary for regulatory function with the highest level of expression among all analyzed conditions. The methylation of global DNA as well as TSDR were significantly lower in Tregs SPECB:9-23 than in Tregs SPECINS. When compared to Teffs, Tregs were characterized by a relatively lower level of PTMs but it varied in respective Tregs/Teffs pairs. Importantly, whenever the difference in PTM within Tregs/Teffs pair was significant, it was always low in one subset from the pair and high in the other. It was always low in Tregs SPECINS and high in Teffs SPECINS, while it was high in Tregs UNSPECINS and low in Teffs UNSPECINS. There were no differences in Tregs/Teffs SPECB:9-23 pair and the level of modifications was low in Tregs UNSPECB:9-23 and high in Teffs UNSPECB:9-23. The regions of PTMs in which differences were significant overlapped only partially between particular Tregs/Teffs pairs.
Conclusions: Whole insulin and insulin β chain peptide 9-23 affected epigenetic changes in CD4+ T cells differently, when presented by monocytes. The peptide preferably favored specific Tregs, while whole insulin activated both Tregs and Teffs.
T regulatory cells (Tregs) constitute a subset of CD4+ T lymphocytes which is pivotal in immune tolerance due to their ability to suppress effector cells. There are two main subpopulations of Tregs: natural (nTregs or tTregs) which develop in the thymus during thymopoesis and peripheral (pTregs) which differentiate from naïve CD4+T cells in the periphery during TCR stimulation in the presence of cytokines (e.g. IL-2, TGF-β). Natural T regulatory cells (CD4+CD25highCD127-FoxP3+; Tregs) are mainly predisposed to exert suppressive functions over effectors, which is highlighted by stable genomic architecture in this subset of Tregs. Transcriptional factor FoxP3 (forkhead box P3) is a master regulator of Tregs. Its expression in Tregs is kept stable via Treg-specific demethylated region (TSDR) in the promoter of FoxP3 gene. The sustained expression of FoxP3, possible due to demethylated TSDR, allows the expression of a wide range of other genes encoding such as: Eos, GITR, CTLA4, and simultaneously suppresses activation of: IL-2, IL-4 and INF-γ (1–4). Other important function-associated genes in Tregs are: IL2RA (CD25), CTLA4 (CD152), TNFRSF18 (GITR), IKZF2 (Helios), IKZF4 (Eos) and Tet2 (5–8).
Tregs ability to prevent excessive immune response has been tested in many clinical trials. In human autoimmune diseases or transplantation, a broken tolerance can be restrained by administration of Tregs. In our hands, the therapy with expanded Tregs was successfully administered in type 1 diabetes or graft versus host disease (GvHD) after bone marrow transplantation (9–11). Until now, mainly polyclonal Tregs have been used in clinical therapies due to the problem in technical expansion of antigen-specific cells (12, 13). Only recently, we have developed a technique, which allows for efficient production of bulk quantities of antigen-specific Tregs, which seems to be a promising tool for autoimmune therapies (14). Our method is based on antigen-loaded monocytes which preferentially activate Tregs specific to presented antigen. Because our work is mainly focused on type 1 diabetes, we used either whole insulin or insulin β chain peptide 9-23 as antigens. Surprisingly, we have found that Tregs generated with β chain peptide 9-23 were significantly more suppressive than those generated with the whole insulin.
Looking for the reasons of such a difference, we examined epigenetic features, presented at Figure 1, of both: Tregs (CD4+CD25high/+CD127-) and T effector cells (CD4+CD25low/-CD127+; Teffs) generated with monocytes loaded with either whole insulin or insulin β chain peptide 9-23 sorted as antigen-specific (index SPEC) cells. We have also looked at Tregs and Teffs unspecific to the antigens (index UNSPEC) as well as those expanded with anti-CD3/anti-CD28 beads used currently as the polyclonal (index POLY, 1:1 ratio bead:cell) in the treatment of type 1 diabetes. Taking into account already known TSDR-mediated regulation of FoxP3 gene, we assumed that other epigenetic changes could be also very important in the activity of the manufactured cells and therefore we investigated global genomic DNA methylation, methylation in specific TSDR region of FoxP3 gene and histone H3 post-translational modifications (PTMs). In addition, we assessed in all subsets the expression of genes crucial in the activity of Tregs, such as: FoxP3, CTLA-4, IKZF2, IKZF4, IL2RA, TNFRSF18, Tet2, Runx1 and HMOX1. Indeed, we found significant differences between the subsets, which could impact the activity of the cells.
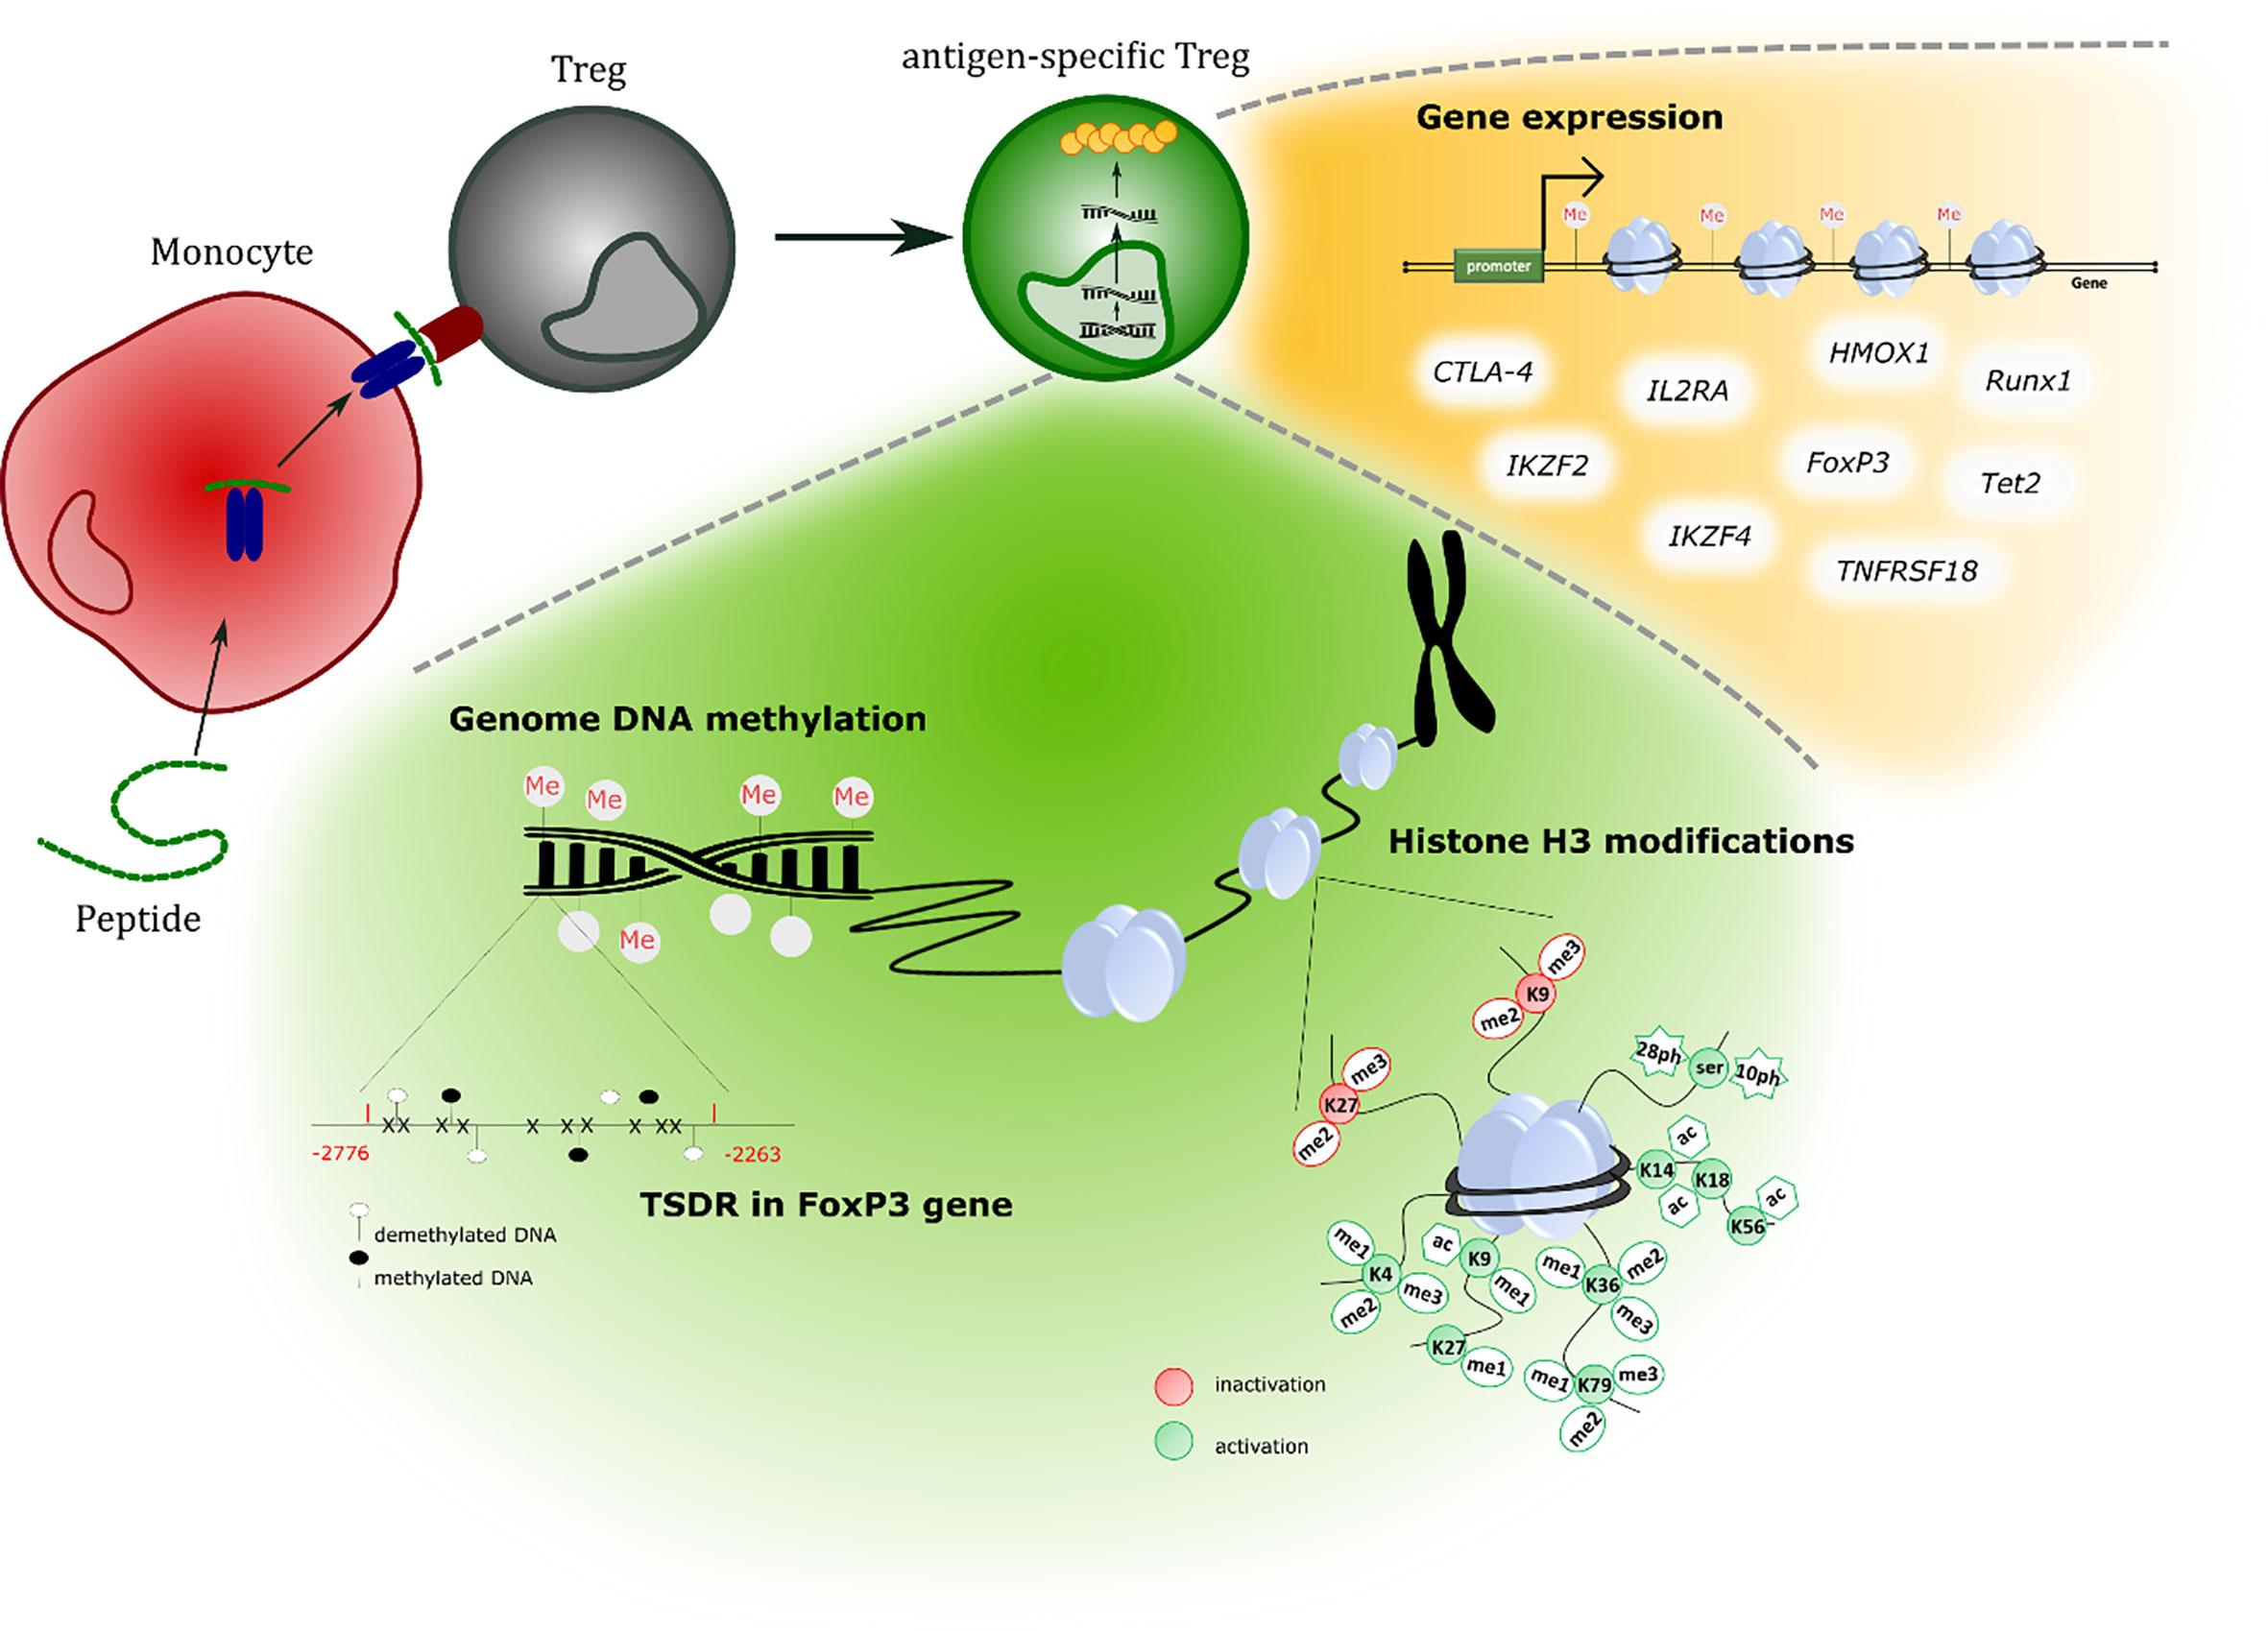
Figure 1 An overview of tests performed to study epigenetic features of generated cells.
Buffy coats, with unknown HLA, were obtained from the Regional Centre for Blood Donation and Treatment in Gdańsk from volunteers donating blood. All tests were conducted on male volunteers aged 18-65.
Detailed procedure for cells preparation was described by Iwaszkiewicz-Grzes D. et al. previously (14). General procedure is presented at the workflow in Figures 2 and S1.
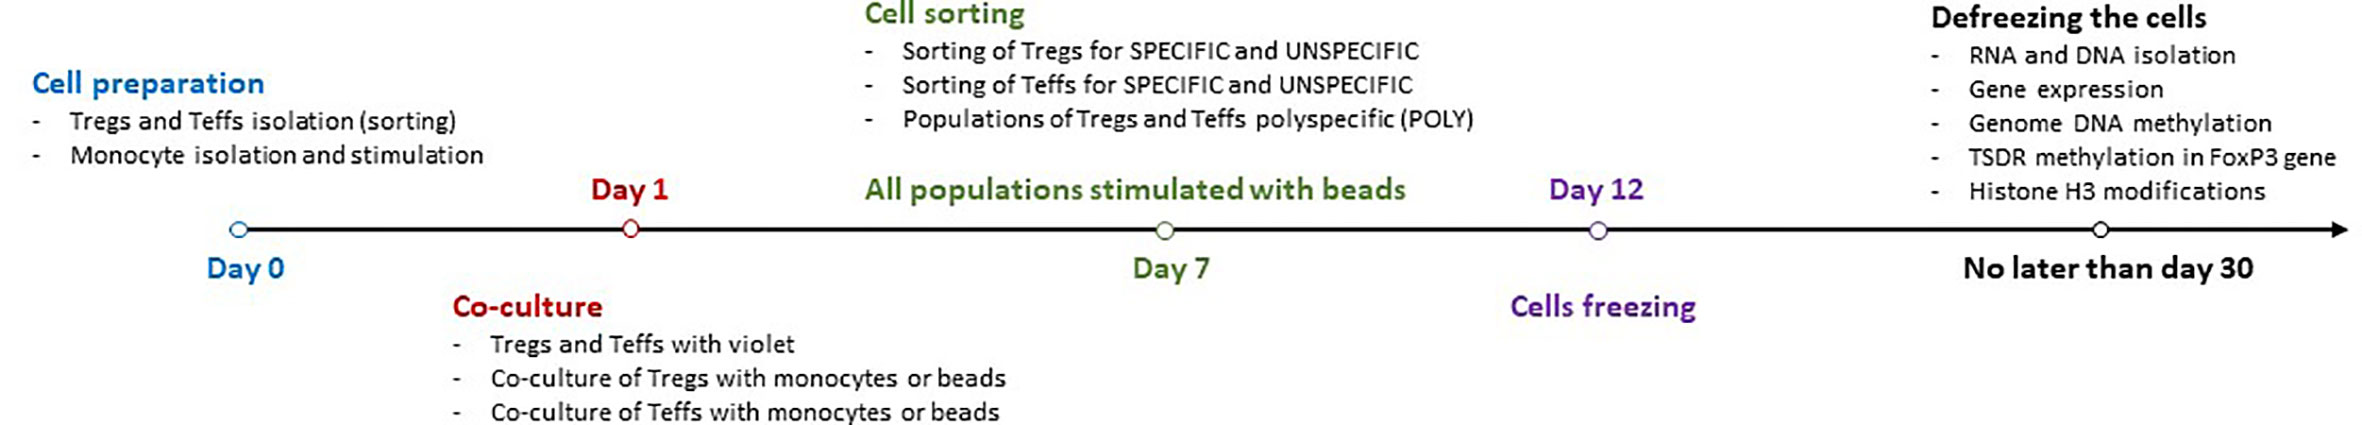
Figure 2 The scheme of obtaining cells and their further use.
Tregs and Teffs were freshly isolated from buffy coats obtained from anonymous healthy volunteer blood donors according to previously described protocol (15). Briefly, peripheral blood mononuclear cells (PBMCs) were isolated from buffy coats by gradient centrifugation using Ficoll-Paque Plus. Collected PBMCs were counted and separated into two tubes, first tube for isolation of CD4+ cells using negative immunomagnetic selection method (StemCell EasySep™ Human CD4 Negative Selection Kit, StemCell Technologies, Canada) and second tube for isolation of CD14+ cells using positive immunomagnetic selection method (StemCell EasySep™ Human CD14 Positive Selection Kit, StemCell Technologies, Canada).
CD4+ T cells were transferred into cell culture flask in X-VIVO culture medium with addition of penicillin/streptomycin and remained to the next day under standard conditions (37°C, 5% CO2, 95% O2). At the same time, CD14+ monocytes (Mo) were isolated according to the manufacturer’s instructions. Next, CD14+ cells were suspended in X-VIVO culture medium (Lonza), spread out into plates and stimulated for 24h with tested antigens: whole insulin (index INS, 350µg/well/ml (16), Actrapid® Penfill®, Novo Nordisk A/S) and insulin β chain peptide (index B:9-23, 25μg/well/ml; Lipopharm; Gdansk, Poland) under standard conditions (37°C, 5% CO2, 95% O2).
After 24h CD4+ T cells were stained with monoclonal antibodies (mAbs): CD3, CD4, CD25 and CD127, and sorted with FACS AriaII sorter (BD Biosciences, USA) into Tregs (CD3+CD4+CD25high/+CD127−/lowlin−doublet-) and Teffs (CD3+CD4+CD25low/-CD127+lin−doublet-).
Next, Tregs and Teffs were stained with violet (Cell Trace Violet Cell Proliferation Kit, Life Technologies, 1μM; 15min, 37°C) (17). At the same time, previously prepared monocytes were collected and irradiated.
We prepared the following conditions: Tregs/Mo stimulated with INS or B:9-23, Tregs/beads (ExpAct Treg Beads conjugated to CD28, Anti-Biotin, and CD3-Biotin monoclonal antibodies; MACS®GMP; in 1:1 ratio (bead:cell)), Teffs/Mo stimulated with INS or B:9-23 and Teffs/beads in X-VIVO culture medium with addition of IL2 (100 IU/ml), heat-inactivated human serum (10%) and penicillin/streptomycin. Cultures containing monocytes were additionally stimulated with anti-CD28 and anti-CD154 antibodies at a final concentration of 5μg/ml/well each (BD Pharmingen™ Purified NA/LE Mouse Anti-Human CD154/CD28). After 6 days of expansion cells were collected and sorted based on violet fluorescence (Figure S1) (17). Cells responding to the antigen presented by the monocytes were identified as antigen-specific (index SPEC), non-proliferating cells were identified as unspecific (index UNSPEC). During whole procedure cells were stimulated only once with monocytes. Cells stimulated with beads were treated as polyclonal (specific against many antigens, index POLY).
Obtained cells were expanded with beads (no longer than 5 days) in order to obtain enough cells for all tests, at least 1 million cells per condition (Tregs: POLY, SPEC, UNSPEC; Teffs: POLY, SPEC, UNSPEC) for cells stimulated with whole insulin and insulin β chain peptide 9-23 and stored in -70°C maximum 1 month.
Total RNA was isolated using AllPrep® DNA/RNA Mini Kit (Qiagen, USA) following the manufacturer’s instruction. Assessment of RNA concentration and purity was measured via spectrophotometer (Epoch, BioTek). Obtained RNA was stored in -70°C until use.
500ng total RNA was reverse transcribed into cDNA using High Capacity cDNA Reverse Transcription Kit (ThermoFisher Scientific) under standard conditions: step 1 - 25°C/10 min; step 2 - 37°C/120 min; step 3 - 85°C/5 min; step 4 - 4°C/∞ min. The expression of target genes, characteristic for Tregs: FoxP3, IKZF2, IKZF4, IL2RA, TNFRSF18, Tet2, Runx1 and HMOX1 was detected using FastStart Essential DNA Probes Master (Roche, Switzerland) on LightCycler®96 (Roche, Switzerland) in accordance to the manufacturer’s protocols in prepared cell populations (Tregs: POLY, SPEC, UNSPEC; Teffs: POLY, SPEC, UNSPEC). The primer sequences (Sigma-Aldrich) and used probes (Universal ProbeLibrary Set, Human with Probes; Roche, Switzerland) were designed using Assay Design Center Software (Roche) and are listed in Table 1. GAPDH was used as the housekeeping gene and the normalized expression ratio of the target genes in prepared cell populations was calculated using the 2-ΔΔCt (Livak method) (18). All reactions were carried out in triplicate from three independent experiments.
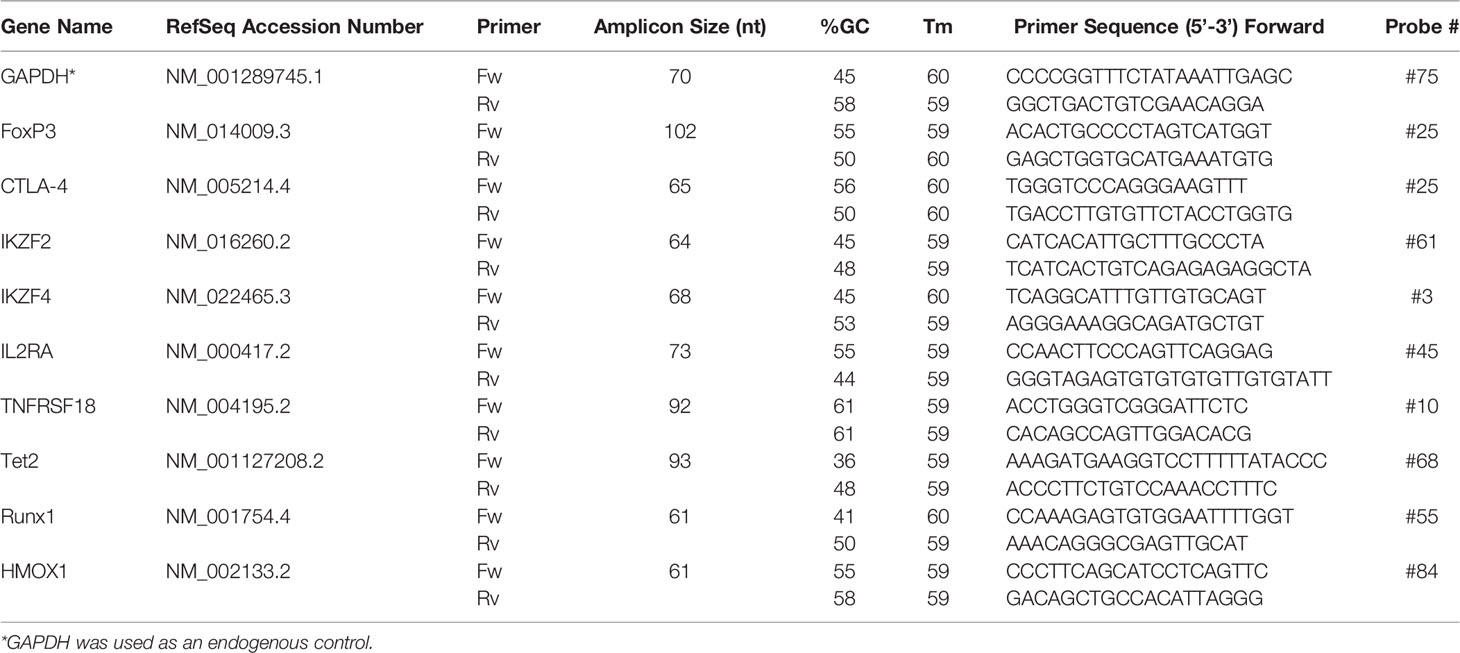
Table 1 Sequences of primers used for real-time PCR.
DNA was isolated using AllPrep® DNA/RNA Mini Kit (Qiagen, Germany) following the manufacturer’s instruction from following cells: Tregs: POLY, SPEC, UNSPEC; Teffs: POLY, SPEC, UNSPEC for cells stimulated with whole insulin and insulin β chain peptide 9-23. Assessment of DNA concentration and purity was measured via spectrophotometer (Epoch, BioTek). Obtained DNA was stored in -20°C until use.
Quantification of genomic DNA methylation was performed using Methylated DNA Quantification Kit (Colorimetric) (Abcam, UK). 100 ng/µl of DNA was used per reaction (well) under manufacturer’s instruction. Absorbance was read at 450 nm via Epoch (BioTek) spectrophotometer with Gene5 software. Obtained absorbance was used to calculate percentage of genomic DNA methylation in each cell population. The total/global amount of methylated DNA was calculated by generation of a standard curve. Next, the slope (OD/ng) of the standard curve was determined using linear regression and then the analysis of absolute/total quantification of 5-mC in total DNA was determined.
Cells stimulated with beads, whole insulin or insulin β chain peptide 9-23 (Tregs: POLY, SPEC, UNSPEC; Teffs: POLY, SPEC, UNSPEC) were pelleted and histones isolated with Histone Extraction Kit (Abcam, UK) according to the manufacturer’s instructions. Two Assay Control Proteins were prepared with the final concentrations of 5ng/µl and 25ng/µl. 150ng of histone extract per well for each modification were used in triplicate. Assessment of histone concentration and quality were measured via spectrophotometer Epoch (BioTek). 21 histone H3 modifications, which include the most important and the most well characterized patterns, were measured using Histone H3 Modification Multiplex Assay Kit (Colorimetric, Abcam) and are listed in Table 2. Obtained absorbance was used to calculate % of individual histone H3 modifications.
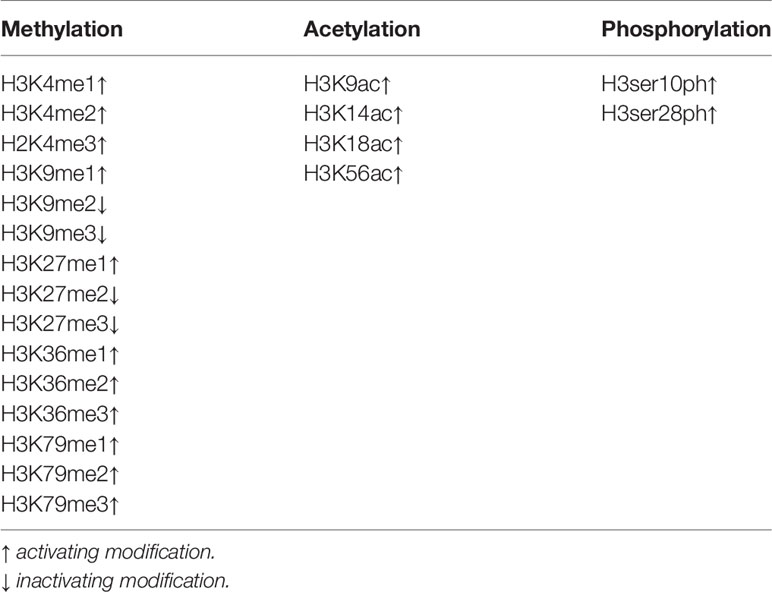
Table 2 Histone H3 modifications.
Quantitative methylation-specific polymerase chain reaction with methylated (M) and unmethylated (U) primers was used for detection of methylation of the TSDR region in FoxP3 gene. Briefly, genomic DNA was extracted from maximum 1 million of cells using AllPrep® DNA/RNA Mini Kit (Qiagen, Germany) and submitted to bisulfite conversion using the EpiTect® Bisulfite Kit (Qiagen, Germany) under manufacturer’s instruction. First, DNA bisulfite conversion was performed in which unmethylated cytosine residues are deaminated to uracil and methylated cytosine (5-mC) residues remain intact. 500 ng of isolated DNA per reaction were used. Bisulfite reaction was performed in the thermocycler with the following parameters: 95°C for 5 min, 60°C for 25 min, 95°C for 5 min, 60°C for 85 min, 95°C for 5 min and 60°C for 175 min. After conversion, DNA was subjected to quantitative methylation-specific PCR procedure using TB Green Premix Ex Taq II (Takara, Japan) on LightCycler®96 (Roche, Switzerland) in accordance with the manufacturer’s protocols. EpiTect® PCR Control DNA Set (Qiagen, Germany) was used as positive and negative controls. Unconverted DNA was considered as a negative control. Methylated and unmethylated primers for FoxP3 gene intron 1 were designed using MethPrimer 2.0 Software by Zafari et al. and are listed in Table 3 (19, 20). Real-time PCR was performed in a final reaction volume of 20 μl using the Roche Life Science LightCycler® 96 including 5 pmol of each forward and reverse methylated/demethylated primer and 50–100 ng of bisulfite-treated genomic DNA. PCR consisted of an initial denaturation at 95°C for 30 s, 40 cycles of denaturation at 95°C for 5 s, followed by 60°C for 30 s, 1 cycle of melting at 95°C for 5 s, followed by 60°C for 1 min, 1 cycle of cooling at 50°C for 30 s. The level of methylation was also verified by electrophoresis on a 2% agarose gel using 100 bp DNA Ladder (Invitrogen, USA) as a marker.
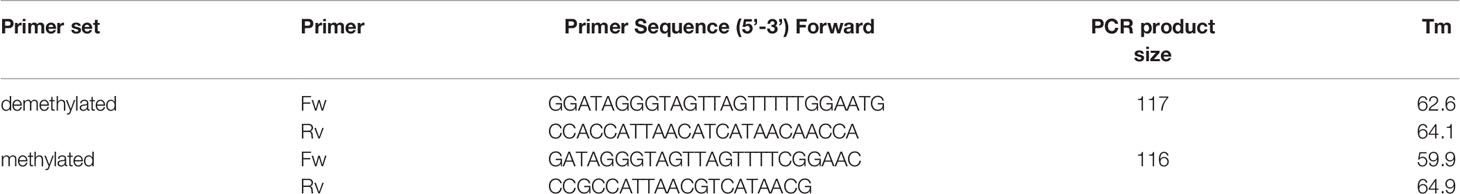
Table 3 Primers for TSDR analysis (19).
The Statistica 13.0 software was used to perform all statistical analysis. Significance was calculated using the t- test. Significant results are marked with * (p<0.05), ** (p<0.01) or *** (p<0.001).
In the current study we selected several genes known to be involved in the function of Tregs and investigated their expression in particular subsets of cells. We compared polyclonal Tregs, which are a cellular medicinal product used in the treatment of type 1 diabetes, with Tregs specific and unspecific against whole insulin (index INS) or insulin β chain peptide 9-23 (index B:9-23). Polyclonal Tregs were treated as a reference for other cells. To obtain fully valuable results, we also performed the same tests for effector T cells: polyclonal, specific and unspecific against presented antigen. The obtained results are presented in Figure 3, and the p values of statistical significance in Table S1.
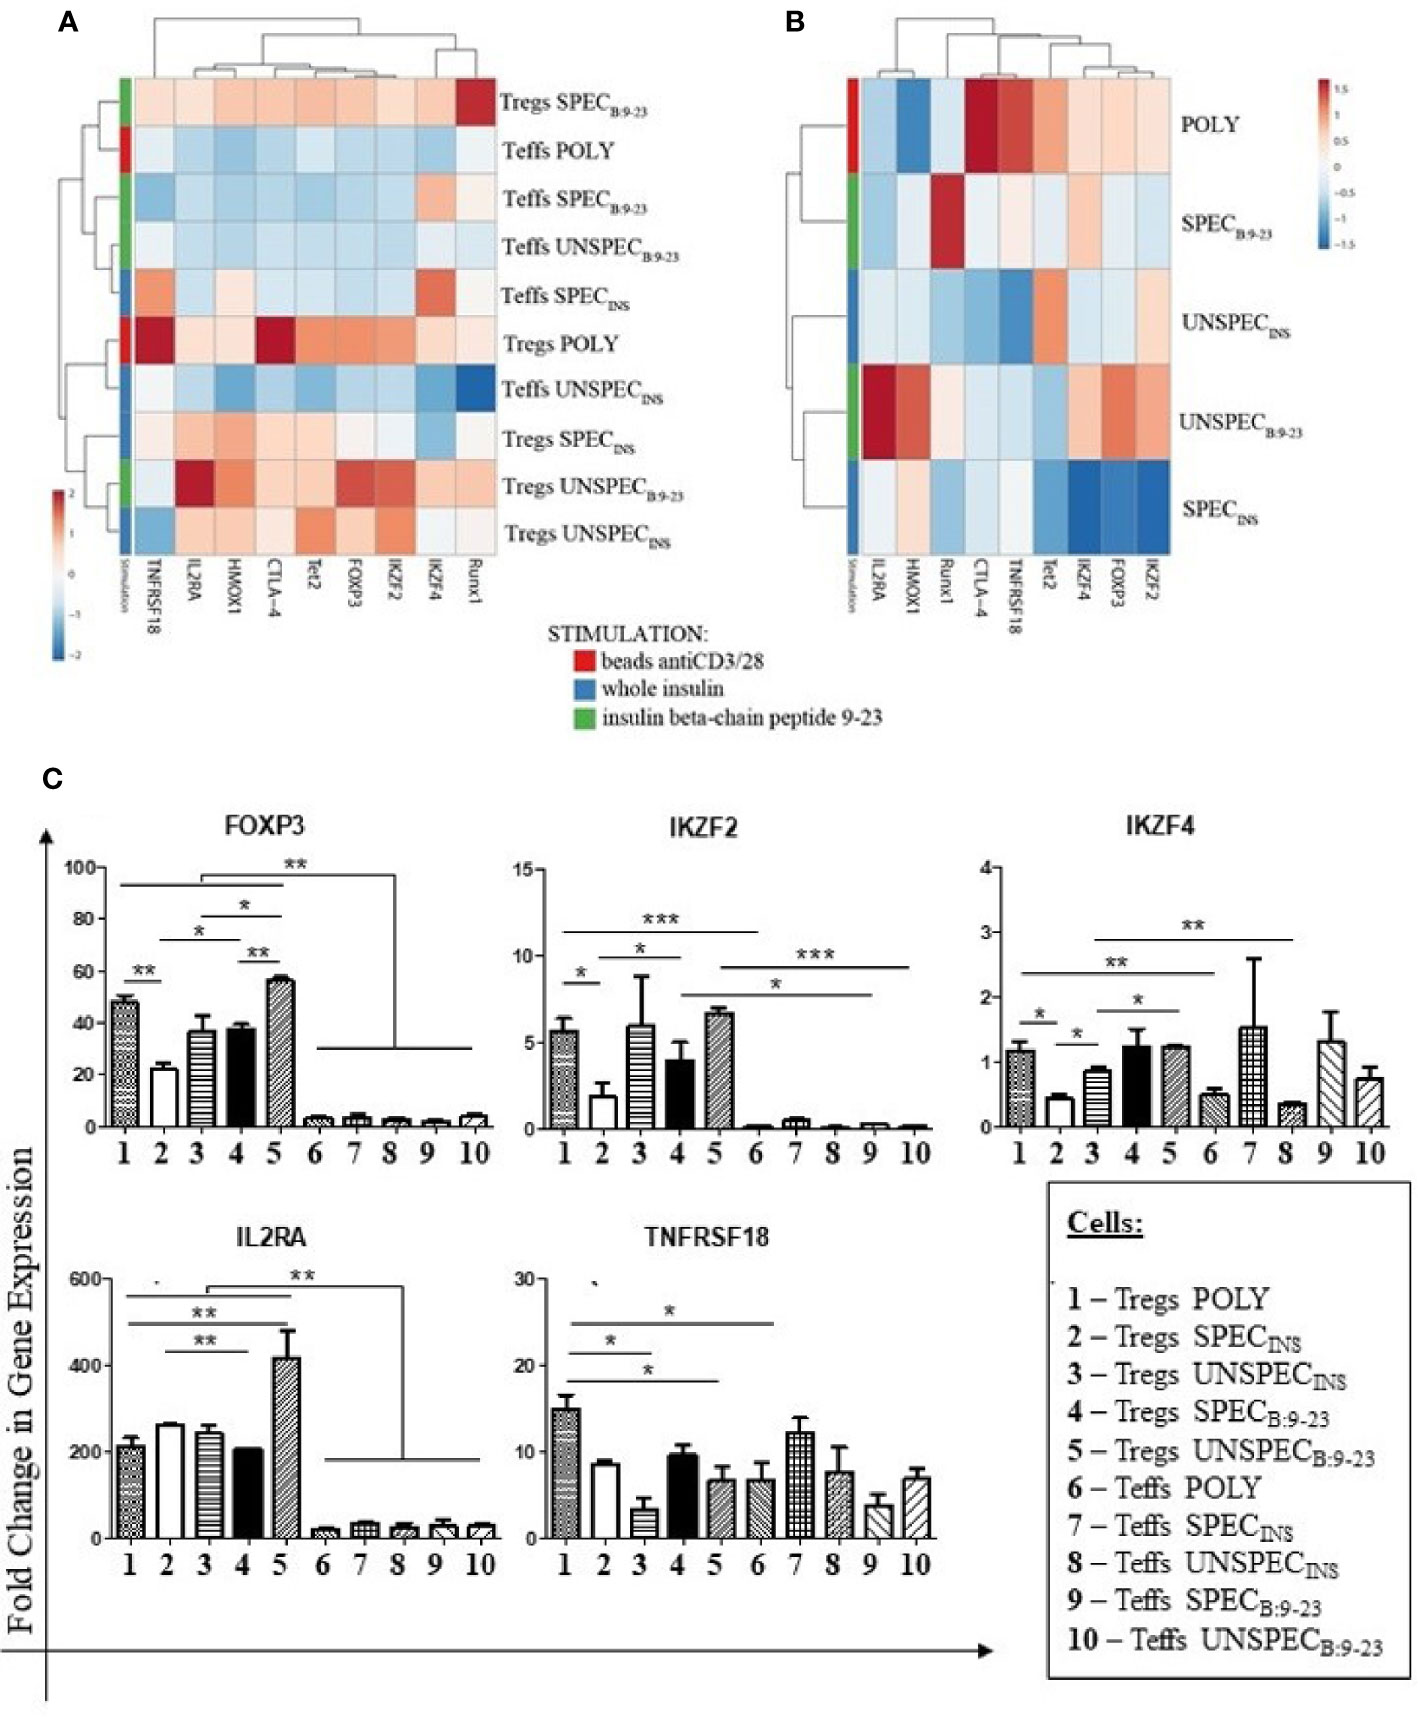
Figure 3 Fold Change in Gene Expression in Tregs and Teffs. (A): Clustering and heat maps analysis of gene expression in Tregs: POLY, SPEC, UNSPEC and Teffs: POLY, SPEC, UNSPEC. (B) Clustering and heat maps analysis of gene expression only in Tregs. (C) Graphs presenting changes in cells populations. Only the expressions in which statistical significance occurred are presented. The cells were stimulated with beads anti-CD3/anti-CD28 (index POLY) or monocytes loaded with whole insulin (index INS) or insulin β chain peptide 9-23 (index B:9-23). The cells responding to antigen have an index SPEC, cells not recognizing the antigen have an index UNSPEC. All stimulations were performed in triplicates (three tests for whole insulin and three tests for insulin β chain peptide 9-23). The results are presented as mean+/- SD. Significance was calculated using the t- test, significant results are marked with * (p<0.05), ** (p<0.01) or *** (p<0.001). Heat maps were prepared using ClustVis tool based on correlation distance and average linkage between clusters (21).
Figure 3A shows gene expression in all populations in a form of a heatmap. With the exception of the IKZF4 gene, Tregs showed higher expression of the studied genes than Teffs. Teffs SPECINS were the only ones among the effectors which showed low but noticeable expression of IKZF4, TNFRSF18 and HMOX1 genes. Among Tregs subsets (Figure 3B), Tregs SPECB:9-23 and Tregs POLY were of special interest as they expressed all analyzed genes. Tregs SPECB:9-23 showed the highest levels of expression of RUNX1 and IKZF4 genes but the expression of other genes was moderate. On the other hand, Tregs SPECINS were the cells with the lowest expression of IKZF2, FoxP3, IKZF4, Tet2 and RUNX1 genes. Tregs UNSPECINS also showed low expression of the majority of genes, especially IL2RA, HMOX1 and FoxP3, when compared to Tregs SPECB:9-23.
We could observe statistically significant differences between particular subsets in the expression of five genes: FoxP3, IKZF2, IKZF4, IL2RA and TNFRSF18 which are presented separately in Figure 3C. Values of statistical significance for gene expression are presented in Table S1.
Based on a colorimetric assay for quantification of global DNA methylation by measuring levels of 5-methylocytosine (5-mC) we observed statistically significant differences between cells (Figure 4). Tregs SPECINS and Tregs UNSPECB:9-23 had the highest level of methylation. Tregs SPECB:9-23 were much less affected. Their methylation differed significantly from Tregs UNSPECB:9-23 (t-test; p <0.0001), Tregs SPECINS (t-test; p <0.0001) and Teffs SPECB:9-23 (t-test; p <0.0001). Tregs SPECB:9-23 were also significantly different from antigen-specific Teffs stimulated with the same antigen (Teffs SPECB:9-23; t-test; p<0.0001). We did not observe significant differences between Tregs POLY and other cells.
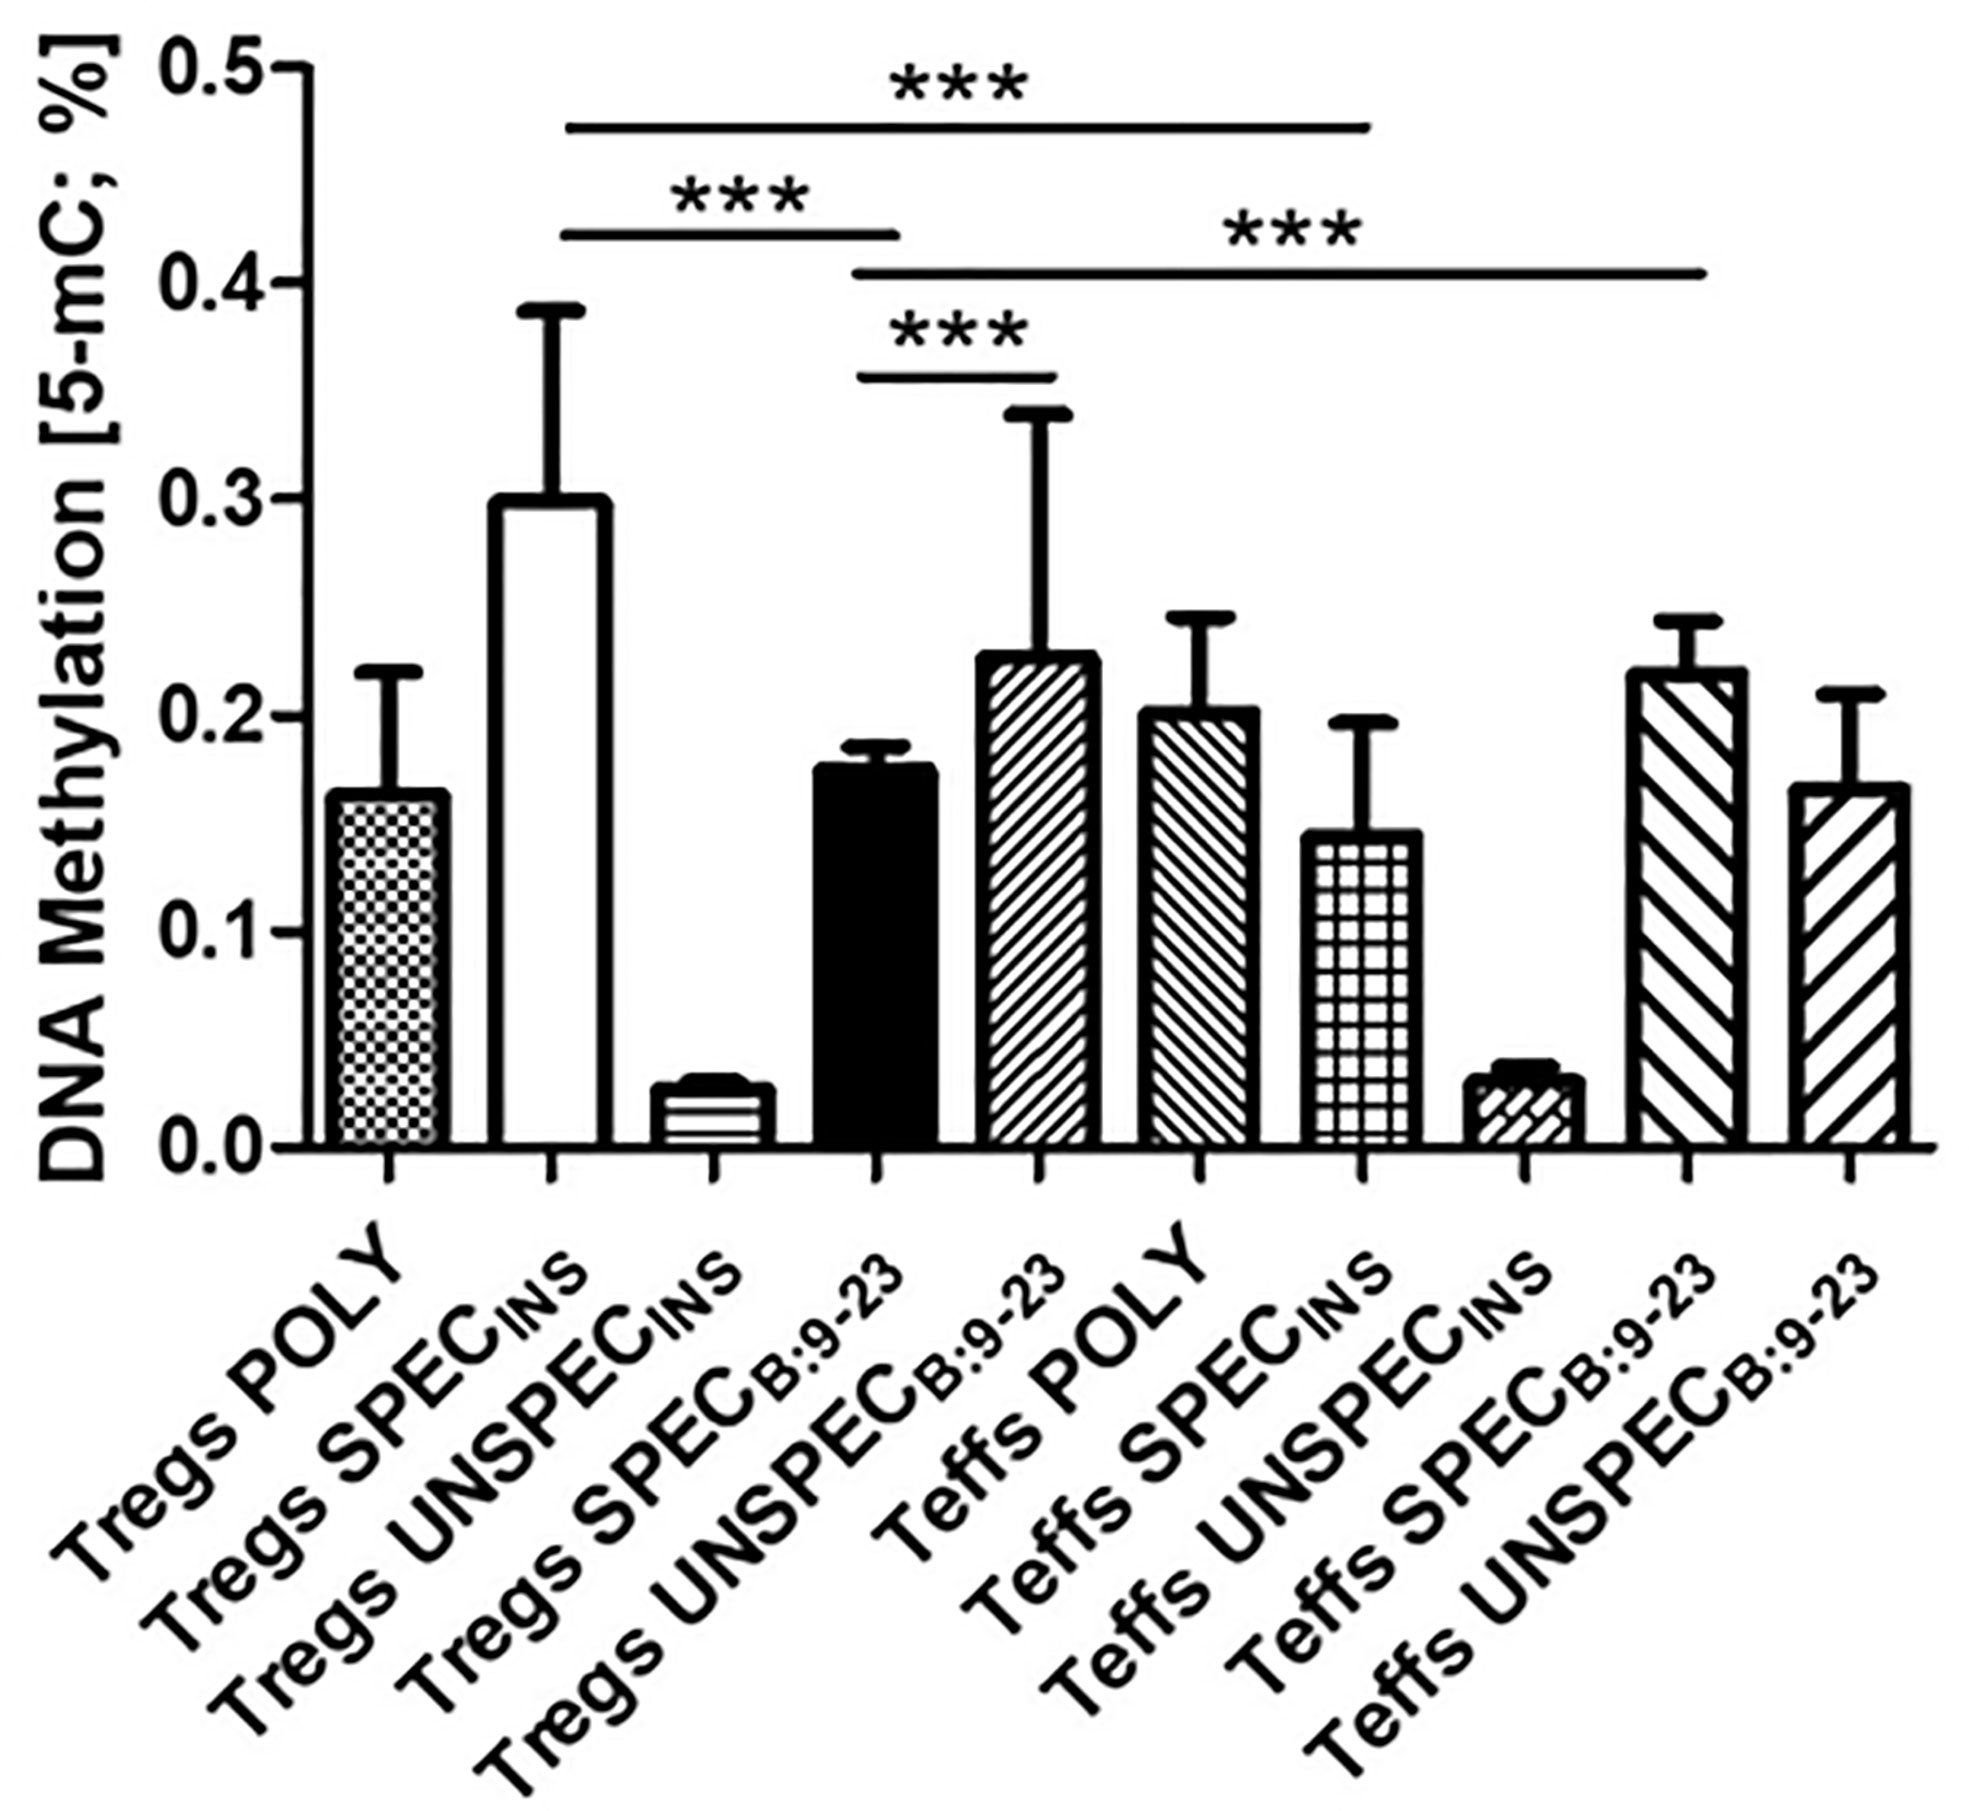
Figure 4 Global DNA methylation in Tregs and Teffs. Comparison of 5-methylocytosine (5-mC) production in Tregs: POLY, SPEC, UNSPEC and Teffs: POLY, SPEC, UNSPEC. During the tests cells were stimulated with beads anti-CD3/ant-CD28 (index POLY) or monocytes loaded with whole insulin (index INS) or insulin β chain peptide 9-23 (index B:9-23). Cells responding to antigen have an index SPEC, cells not recognizing the antigen have an index UNSPEC. All analyzes were performed for six tests (three tests for whole insulin and three tests for insulin β chain peptide 9-23) in triplicate. The results are presented as mean+/- SD. Significance was calculated using the t- test, significant results are marked with * (p<0.05), ** (p<0.01) or ***(p<0.001).
We next used quantitative methylation-specific polymerase chain reaction with methylated and unmethylated primers for detection of methylation in TSDR region of FoxP3 gene. TSDR in all Tregs showed a level of demethylation over 75%, which was significantly more demethylated than TSDR of Teffs (t-test; p<0.0001) (Figure 5A). These results were also confirmed by agarose gel electrophoresis (Figure 5B). Tregs SPECINS showed the lowest level of demethylation (75%) among Tregs subsets. It was significantly less compared to Tregs UNSPECINS (t-test; p=0.0020) and Tregs SPECB:9-23 (t-test; p=0.0065). Tregs POLY, whose demethylation was ≈80%, were significantly less demethylated than each of the three subsets of Tregs: Tregs SPECB:9-23 (t-test; p=0.0229), Tregs UNSPECB:9-23 (t-test; p=0.0433) and Tregs UNSPECINS (t-test; p=0.0451). All these three remaining Treg subsets showed demethylation over 90%.
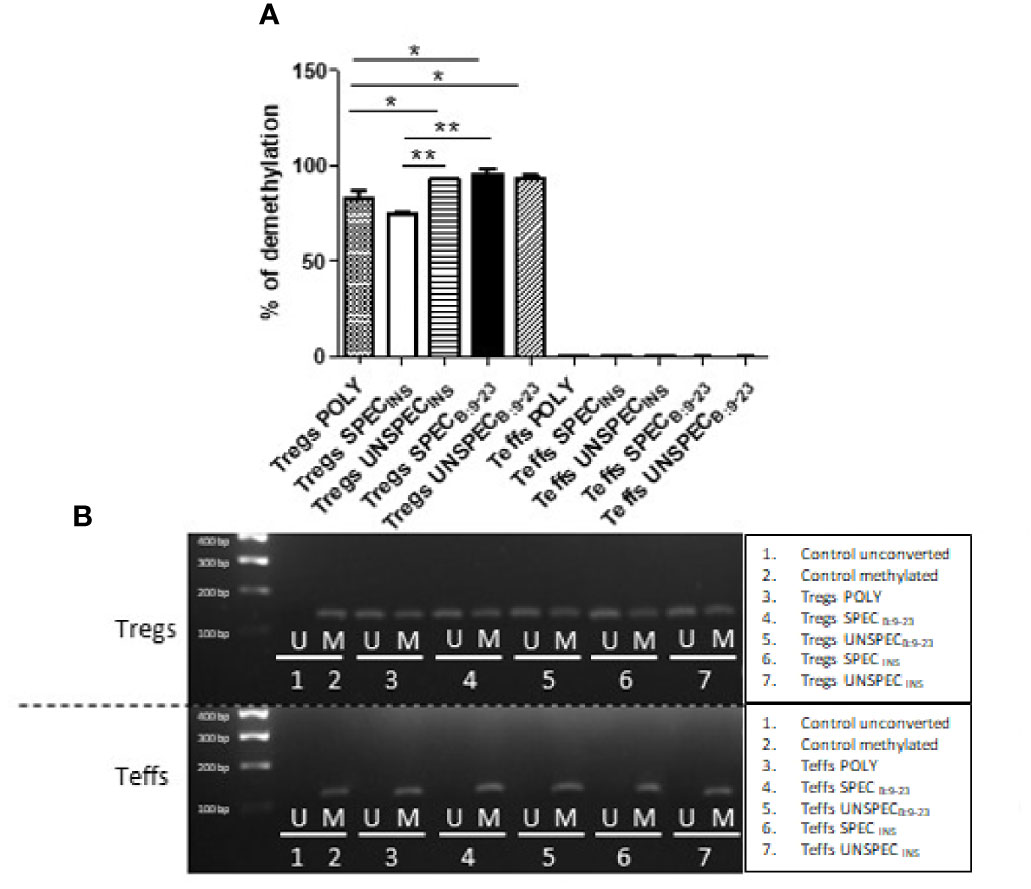
Figure 5 FoxP3 demethylation in TSDR region in Tregs and Teffs. (A) Comparison of percentage of demethylation in Treg-specific demethylated region (TSDR) in Tregs: POLY, SPEC, UNSPEC and Teffs: POLY, SPEC, UNSPEC. (B) Representative results showing FoxP3 demethylation in all cell cultures was detected by agarose gel electrophoresis [reaction with methylated (M) and unmethylated (U) primer]. During the tests cells were stimulated with anti-CD3/anti-CD28 beads (index POLY) or monocytes loaded with whole insulin (index INS) or insulin β chain peptide 9-23 (index B:9-23). Cells responding to the antigen have an index SPEC, cells not recognizing presented antigen have an index UNSPEC. All analyzes were performed for six tests (three tests for whole insulin and three tests for insulin β chain peptide 9-23) in triplicate. The results are presented as mean+/- SD. Significance was calculated using the t- test, significant results are marked with *(p<0.05), **(p<0.01) or ***(p<0.001).
The total concentration of histone H3 protein and individual modifications in ng was calculated and compared at heat-maps (Figure S2). Then, based on Total H3, the percentage of different cell modifications was determined (Figure 6). We analyzed gene activating modifications (↑) such as methylation: H3K4me(1-3), H3K9me1, H3K27me1, H3K36me(1-3), H3K79me(1-3); acetylation: H3K9ac, H3K14ac, H3K18ac, H3K56ac; phosphorylation: H3ser28P, H3ser10P and gene inactivating modifications (↓) such as methylation: H3K9me2, H3K9me3, H3K27me2, H3K27me3 (Table 2). All cultures were performed in triplicates.
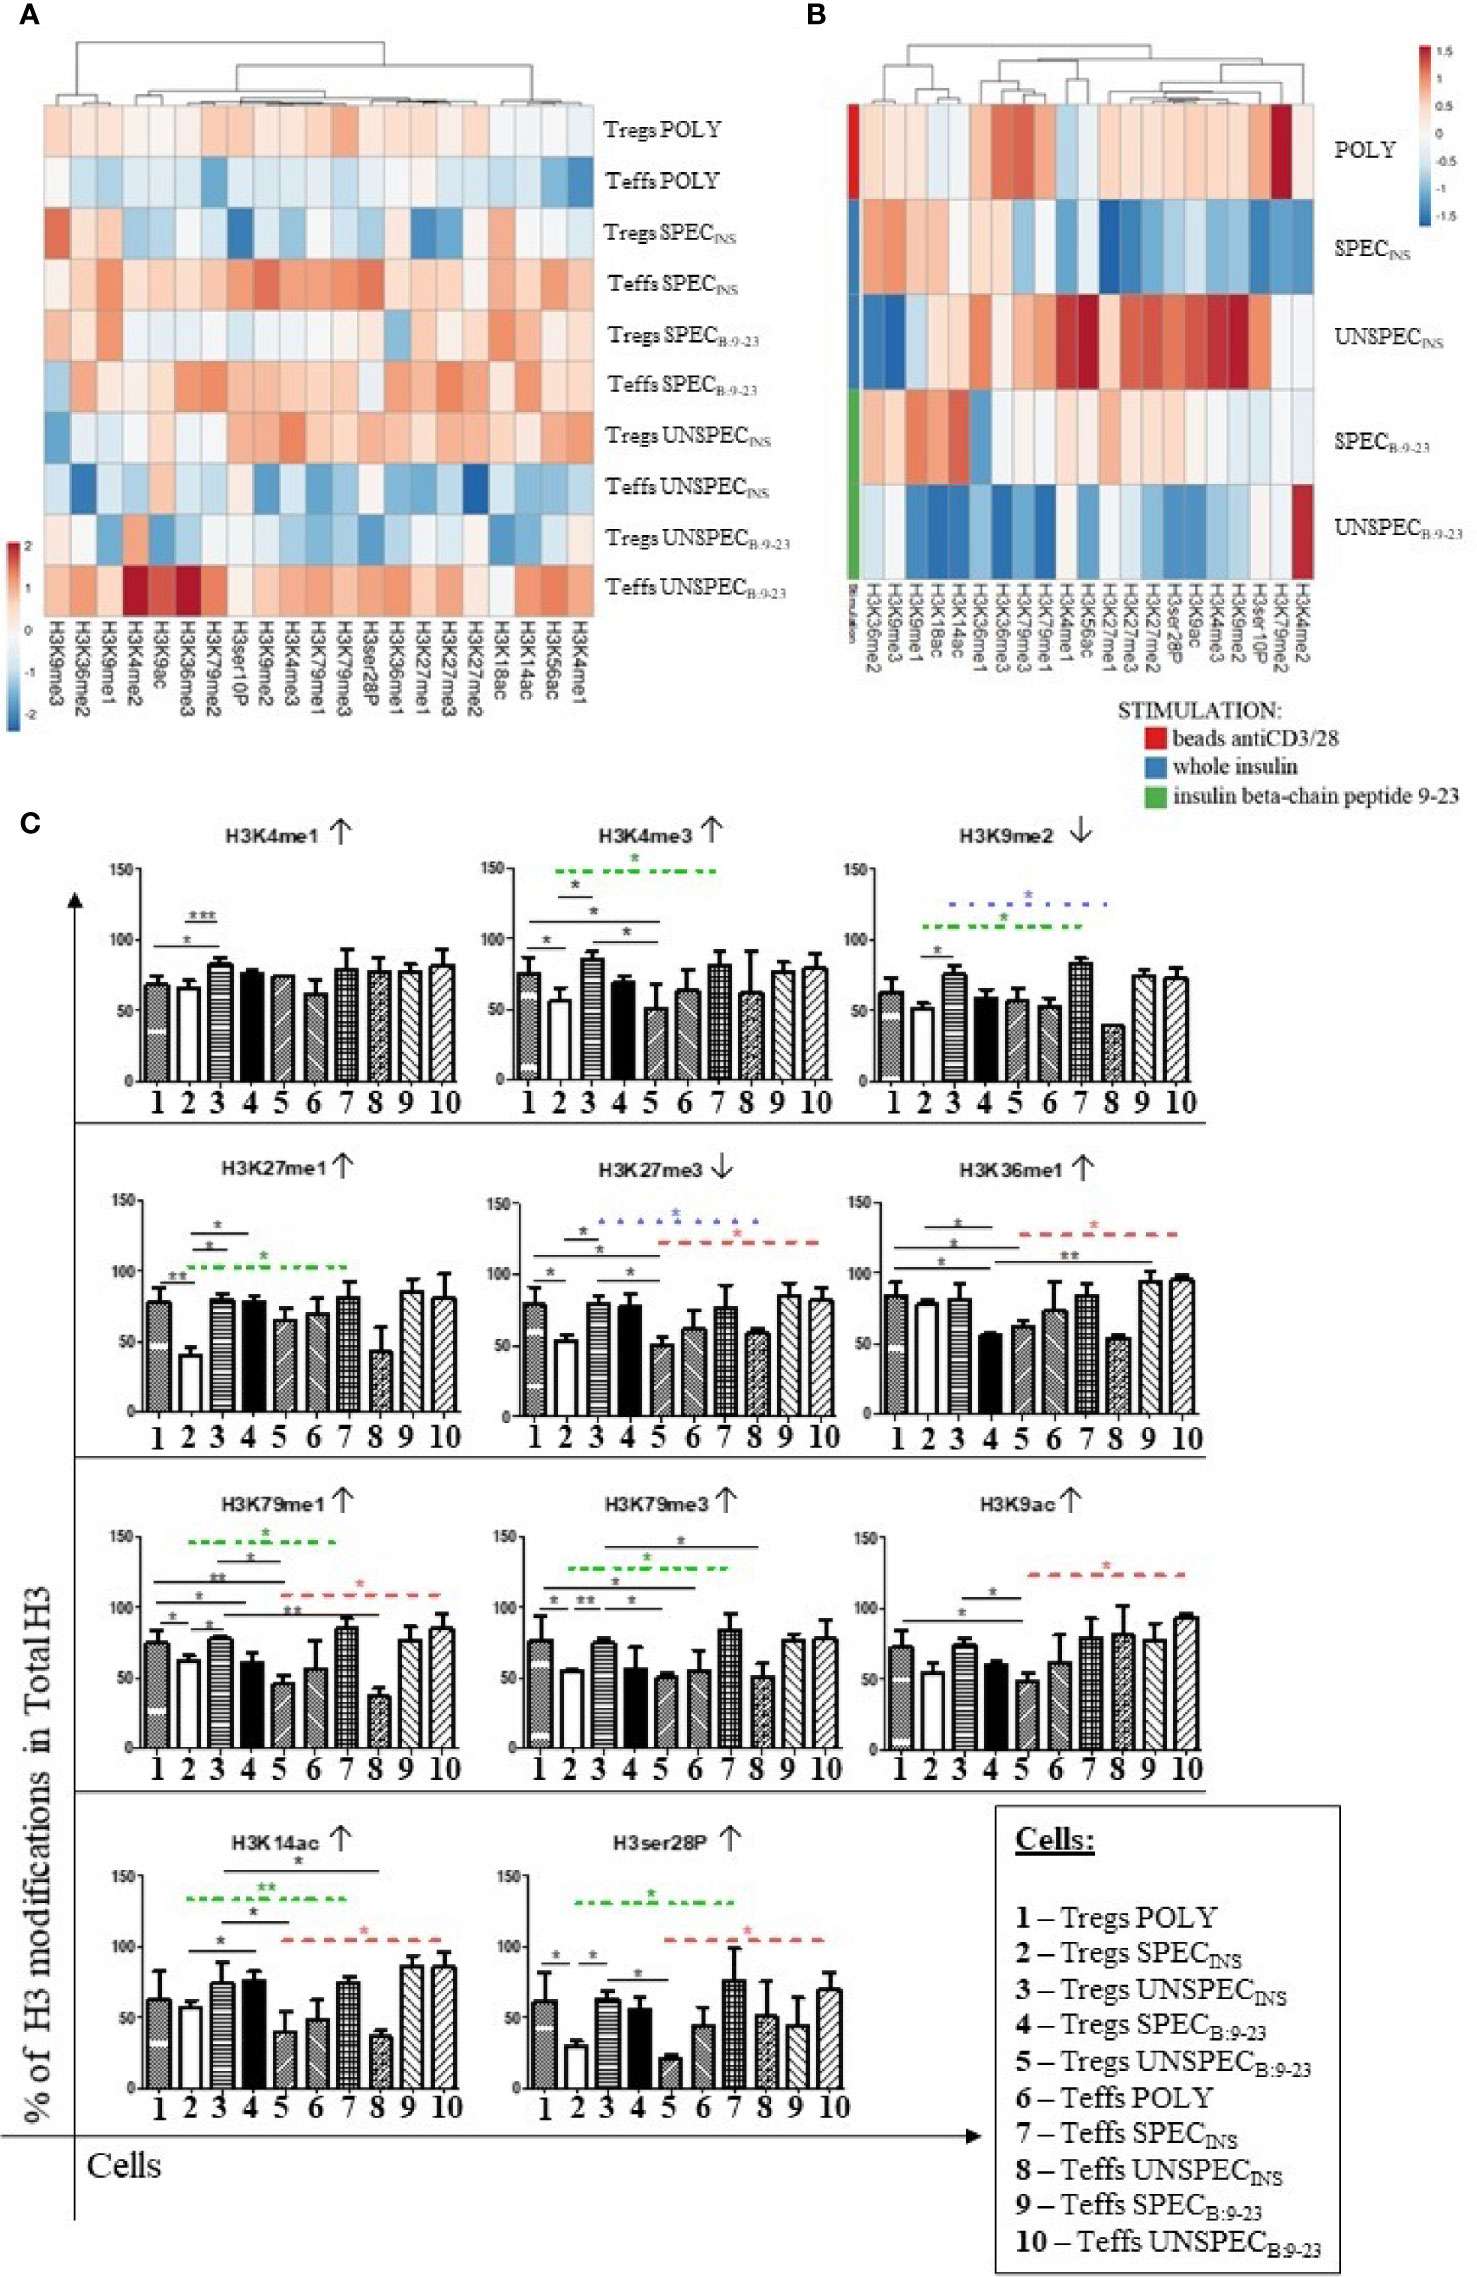
Figure 6 Percentage of histone H3 modification in total H3 in Tregs and Teffs. (A) Comparison of percentage of modifications in Tregs: POLY, SPEC, UNSPEC and Teffs: POLY, SPEC, UNSPEC. (B) Comparison of modifications only in Tregs. Cells were stimulated with anti-CD3/anti-CD28 beads (index POLY) or monocytes loaded with whole insulin (INS) or insulin β chain peptide 9-23 (B:9-23). (C) Graphs presenting changes in cells populations. Only modifications in which statistical significance occurs are presented. Cells responding to the antigen have an index SPEC, cells not recognizing the antigen have an index UNSPEC. All analyzes were performed for six tests (three tests for whole insulin and three tests for insulin β chain peptide 9-23) in triplicate. The results are presented as mean+/- SD. Significance was calculated using the t- test, significant results are marked with * (p<0.05), ** (p<0.01) or *** (p<0.001). Heat maps were prepared using ClustVis tool based on correlation distance and average linkage between clusters (21). ↑ - activating modification; ↓ - inactivating modification; ···· difference between specific Tregs and Teffs stimulated with insulin; ···· difference between unspecific Tregs and Teffs stimulated with insulin; ···· difference between unspecific Tregs and Teffs stimulated with peptide 9-23.
The comparison of the precentage of histone H3 modifications in total H3 between Tregs and Teffs (Figure 6A) confirmed that the populations of Tregs showed opposite pattern of modifications than Teffs. Teffs, mainly Teffs SPECB:9-23, Teffs SPECINS and Teffs UNSPECB:9-23, were characterized by a relatively high level of modifications.
While studying the differences between differently stimulated Tregs (Figure 6B), Tregs POLY exhibited the highest level of histone modification, when compared to monocyte stimulated cells. When comparing antigen-specific subsets, we could observe that Tregs SPECINS showed a lower level of modification than Tregs SPECB:9-23, excluding H3K18ac, H3K9me1, H3K9me3 and H3K36me2.
Interestingly, when compared to Teffs, Tregs were characterized by a relatively lower level of PTMs but it varied in respective Tregs/Teffs pairs (Figure 6C, Table 4). Importantly, whenever the difference in PTMs within Tregs/Teffs pair was significant, it was always low in one subset from the pair and always high in the other. The level of modifications in Tregs SPECINS was significantly lower than that in Teffs SPECINS in 7 out of 11 regions, in which any significant differences occurred (H3K4me3, H3K9me2, H3K27me1, H3K79me1, H3K79me3, H3K14ac and, H3ser28P). At the same time, there was no single modification, which level was different between Tregs SPECB:9-23 and Teffs SPECB:9-23 (Figure 6C). Tregs UNSPECINS showed a significantly higher degree of modifications than Teffs UNSPECINS in 5 out of 11 regions, in which any significant differences occurred (H3K9me2, H3K27me3, H3K79me1, H3K79me3 and, H3K14ac) (Figure 6C). The level of modifications in Tregs UNSPECB:9-23 was significantly lower than that in Teffs UNSPECB:9-23 in 6 out of 11 regions, in which any significant differences occurred (H3K27me3, H3K36me1, H3K79me1, H3K9ac, H3K14ac and, H3ser28P). Interstingly, H3K79me1 was the only one modified region, in which the significant differences were found between all three respective Tregs/Teffs pairs.
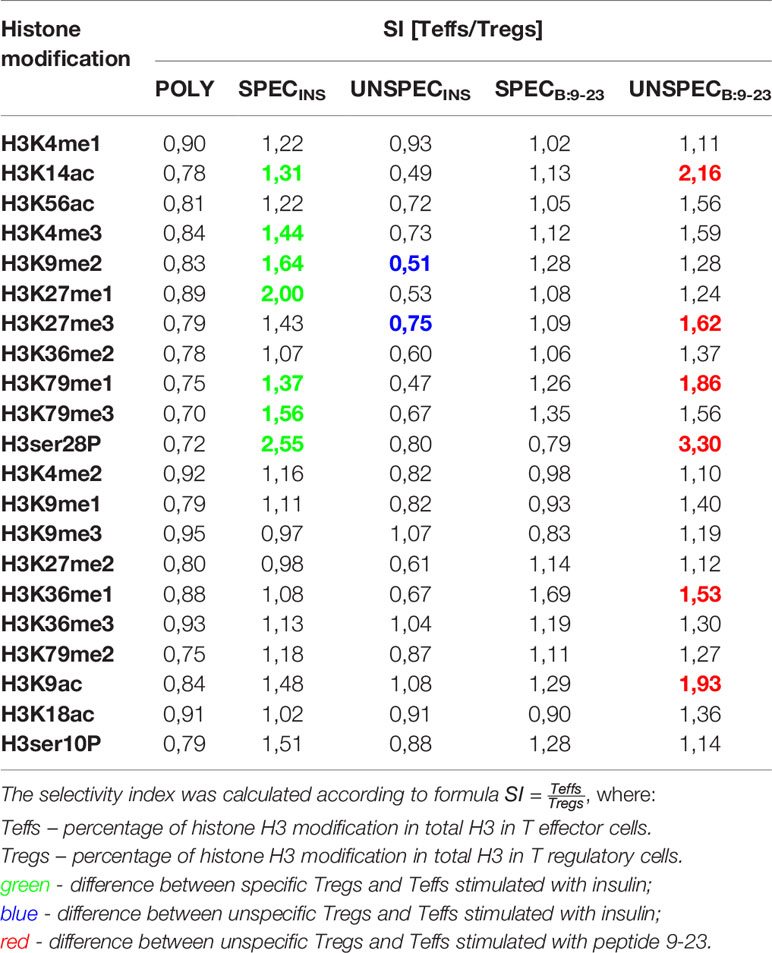
Table 4 Selectivity index (SI) for histone modifications.
Modifications with significant differences are shown in Figure 6C and p values in Table S2. Modifications without correlations are presented in supplementary materials at Figure S3.
In this study we aimed to examine the epigenetic background of the difference in the activity between Tregs expanded with monocytes loaded with different peptides, such as whole insulin or insulin β chain peptide 9-23. We have found different pattern of histone PTMs and different level of DNA methylation as well as different expression of genes crucial for Tregs development and suppressive function between the subsets expanded with these different antigens.
Until now, polyclonal T regulatory cells have been used in many clinical trials as a potent medicinal product that downregulates immune response during autoimmune diseases (9). Polyclonal cells, obtained by anti-CD3 and anti-CD28 stimulation, exert positive effect on patients with type 1 diabetes and significantly reduce the inflammatory response (16). One attempt to improve this therapy is to use specific Tregs directed toward disease-causing antigens. Such Tregs should traffic only into the inflamed tissue and suppress autoreactive lymphocytes in situ by response against specific antigens. Such an antigen-specific preparation may improve effectiveness of the currently administered treatment with polyclonal Tregs, reduce the required dose and limit adverse effects related to the interaction of Tregs with distant unrelated tissues. In our previous study, we proved that Tregs responding to a particular antigen showed higher potency to suppress Teffs than polyclonal cells. Antigen-specific Tregs retained a higher level of FoxP3high expression and also maintained suppressive phenotype, which makes them more potent to surpass the excessive immune response during autoimmunity (14). Interestingly, Tregs specific to insulin β chain peptide 9-23 were more suppressive than those generated with whole insulin. We found that antigen-specific Teffs could be generated with monocytes loaded with antigens, too. These results are important as they confirmed our in vivo data from type 1 diabetes in which we found that the disease-specific antigens can induce both specific Tregs and Teffs and the balance between these two subsets might be associated with the course of the disease (22). Importantly, current report confirms in vitro that the whole insulin is a poor stimulator of Tregs and the efficient induction of tolerance should be performed with other peptides, like β chain peptide 9-23.
It is highly interesting which epigenetic changes are exerted by the particular stimuli. It is widely known that the sustained suppressive phenotype of Tregs requires progressive demethylation in Tregs-specific signature genes (23). The majority of the studies focus on FoxP3 gene and its regulation, because FoxP3 is a master regulator that provides Tregs function and ensures phenotype maintenance. However, recent data shows that FoxP3 expression alone is unable to preserve Tregs function without acquisition of Treg-specific epigenome. It is well-established that Tregs deprived of CNS2 or Tregs with high TSDR methylation lack FoxP3 expression and suppressive function and could even acquire abilities to produce pro-inflammatory cytokines (24, 25). TSDR demethylation within the first intron of FoxP3 gene locus is specific for Tregs, while in Teffs this region is highly methylated. The analysis of methylation status is reliable and correlates with the generation of stable Tregs (26, 27). The state of demethylation is needed for binding with other transcription factors such as: CREB, NFAT, RUNX to enable FoxP3 expression (28). The research conducted by Miyao et al. (29) has revealed that TSDR demethylation acts as epigenetic memory that provides linage stability, even in the environment that contributes to FoxP3 downregulation and thus indicate that stable CNS2 ensures Tregs persistence. In a similar study on effectiveness of antigen-specific Tregs obtained after stimulation with APCs, scientists confirmed that antigen-specific Tregs possessed a comparable average demethylation level (range 70,1-95.2%) to polyclonal cells, while specific and polyclonal Teffs had less than 0,2% of demethylation (30). For these reasons, the measurement of TSDR demethylation was applied as a useful quality control tool in the manufacturing of expanded polyclonal Tregs product (15, 31). In our research, all Tregs showed demethylation over 75% and Teffs were almost 100% methylated, which indicates that during cell culture all Tregs remained stable. Worth emphasizing are Tregs SPECB:9-23, whose demethylation was significantly higher than Tregs SPECINS and POLY, which confirms their usefulness as a drug candidate superb to polyclonal Tregs.
The process of genomic DNA methylation is rapid and flexible during T cell activation and differentiation (32). 5’-methylcytosine (5-mC) depletion is a hallmark of active transcription and it is involved in determination of lymphocyte function (33). In our study we examined total percentage of DNA methylation in T lymphocytes and we saw various pattern of methylation in particular subsets. Nevertheless, Tregs SPECB:9-23 were significantly less methylated than Tregs SPECINS. We performed correlation analysis between global DNA methylation and TSDR methylation, and we did not observe any statistical significance. However, we can notice a trend toward increased DNA methylation and diminished TSDR demethylation in Tregs SPECINS, and low global methylation and substantial TSDR demethylation in Tregs UNSPECINS. Moreover, higher % of total DNA methylation does not affect TSDR demethylation in Tregs UNSPEC9-23.
Histone PTMs play a major role in chromatin remodeling, due to changes in electrostatic charge of histone protein tails, and creation of docking sites for proteins containing bromodomains or chromodomains that recognize acetylated or methylated lysine, respectively (34). The term “histone code” is used to describe the influence of histone modifications on gene expression and indicates that histone machinery decides which part of gene is transcribed (35). Genome-wide studies have revealed that different regions have distinct histone-modifications patterns, enabling expression of specific class of genes. A large number of studies contributed to understanding the functions of individual histone modifications. And thus, acetylation of lysine residues, is believed to be enriched in highly active promoters and increase transcription. Lysine: 4, 36, 79 mono-, di-, tri-methylation and 9, 27 mono-methylation is associated with active genetic status. Conversely, lysine: 9, 27 di- and tri-methylation is a repressive mark, resulting in gene inactivation. In turn, H3ser10P is responsible for gene activation and, like H3ser28P, for chromosome condensation during mitosis (36, 37). Histone modifications can alter as a result of activation process in CD4+ cells. Lamere SA. et al. (38) have revealed, that upon CD4+ activation, the dynamics of H3K4 methylation in promoter varies, and matches the RNA expression. Many differences in histone H3 methylation have been observed in gene promotors between Tregs and Teffs (39). In our study we decided to measure 21 histone H3 modifications, which consisted of lysine: 4, 9, 27, 36, 79 methylation, serine: 10, 28 phosphorylation and lysine: 9, 14, 18, 56 acetylation. We conclude that the type of stimulation (whole insulin or insulin β chain peptide 9-23) has an impact on PTMs.
The process of histone alteration is dynamic upon environmental conditions and is believed to be an indicator of gene activation status (40). The study of Th1 and Th2 differences in histone modifications in crucial gene signatures confirms the presence of active marks in given cell population with repressive histone marks in opposing cell line (41, 42). Moreover, substantial differences were not found between Tregs and conventional T cells based on H3K4me4 and H3K27me3 modifications (39). In our study we also did not see many differences between polyclonal Tregs and Teffs, except H3K79me3, with a predominance in Tregs (Figure 6A). However, upon antigen stimulation we observed changes in histone H3 modifications. In general, permissive H3 modifications (H3K4me1, H3K4me3) are abundant in indispensable regions such as: FoxP3 promoter and intronic enhancer elements, and are connected with active promoters of up-regulated genes (IL2RA, CTLA4, TNFRSF18, FOLR4) (28, 43). All the above allow to maintain stable FoxP3 expression and cell lineage commitment. In our study, Tregs SPECINS were the least modified of H3K4me1/3, but high amount of such modifications was seen in all Tregs subsets, with the predominance of Tregs UNSPECINS (Figure 6A). Another important modification regarding Tregs is H3 acetylation by histone acetyltransferases (HATs) CBP and p300. It allows proper development and maintenance of the suppressive function of Tregs. Upon activation HATs mediate acetylation of Tregs-related genes permitting their stable function. Disruption of p300 causes Tregs instability and promotes autoimmunity (44). Our research has revealed, that Tregs SPEC9-23 were more enriched in lysine 9,14,18,56 acetylation compared to Tregs SPECINS (Figure 6B). Regarding H3K27 methylation, the EZH2 methyltransferase contributes to cell stability and normal function.
It might be connected with the closed chromatin state in genes that are down-regulated by FoxP3 (45–47). Moreover, EZH2 disruption leads to Tregs impairment and strengthens the anti-tumor immunity (48), which indicates the prominent role of H3K27me3 in Tregs. Here, we saw that Tregs SPEC9-23 and Tregs UNSPECINS have higher % of H3K27me3 modification than Tregs UNSPEC9-23 and Tregs SPECINS (Figure 6A).
Interestingly, we found a characteristic pattern related to the kind of stimulation in particular Treg/Teff pairs. Namely, a low level of PTMs in one subset from the pair was always associated with high level of PTMs in the other. This trend was found in the cells specific to insulin where low level of PTMs in Tregs SPECINS was associated with high level of PTMs in Teffs SPECINS and high level of PTMs in Tregs UNSPECINS was associated with low level of PTMs in Teffs UNSPECINS. According to global DNA methylation there is an interdependence between low methylation level and high abundance of histone modifications in Tregs UNSPECINS and Tregs SPEC9-23, and decreased H3 modifications in Treg SPECINS and Tregs UNSPEC9-23 in relation to higher percentage of DNA methylation. But this trend did not occur in Teffs subset. There was no difference in Tregs/Teffs SPECB:9-23 pair and the low level of modifications in Tregs UNSPEC B:9-23 was associated with the high one in Teffs UNSPEC B:9-23. The PTMs in which the differences were significant overlapped only partially between particular Tregs/Teffs pairs, which suggests that the stimulation with different peptides differently influenced PTMs. Nevertheless, mainly activating PTMs, such as H3K18ac, H3K9me1 and, H3K36me2 were modified in Tregs SPECB:9-23 and Tregs SPECINS and additionally H3K14ac and H3K27me1 were modified only in Tregs SPECB:9-23. It is also important to note that selectivity index (SI) is almost always below 1 for POLY and UNSPECINS Teffs/Tregs pairs (Tregs more modified than Teffs) and above 1 in other pairs (Tregs less modified than Teffs) (Table 4).
Gene expression analysis confirmed that antigen stimulation did not deprive Tregs of the expression of crucial genes. All Tregs subsets had high expression of genes (FoxP3, IKZF4, IKZF2, CTLA4, IL2RA) needed for their function and phenotype maintenance. Tregs SPECB:9-23 were characterized by the highest expression but there was not much difference between Tregs POLY and Tregs SPECB:9-23. On the other hand, the analysis has revealed diminished gene expression in Tregs SPECINS. It is known, that TNFRSF18 (GITR) and IKZF4 (Eos) are constitutively expressed by FoxP3+ cells and their expression in FoxP3- cells increases during activation (49, 50). In our study, we noticed that Teffs SPECINS and SPECB:9-23 had high or moderate expression of GITR and Eos, respectively, which confirms a state of activation upon antigen stimulation in these cells. Despite the high level of FoxP3 mRNA expression, we did not see a correlation between high percentage of FoxP3high cells, presented by Iwaszkiewicz-Grzes et al. (14), and mRNA level of FoxP3. Accordingly, other study also confirmed a modest relationship between protein levels and mRNA FoxP3 expression, indicating a presence of other mechanisms involved in FoxP3 expression (51). Bjur et al. (52) discovered that mRNA levels may not correlate with corresponding proteins due to post-transcriptional modifications. They noticed that, upon cell activation, changes in translational activity of specific mRNAs occur. Moreover, a recent study suggested that FoxP3 protein is subject to PTMs, which can alter its function, or even its stability (53).
Besides Foxp3 analysis, on the seventh day in our previous study (14), we performed phenotype test of: IKZF2, CD25 and CTLA-4, and observed high expression of each of them. The data on Helios and IL2RA are already published (14). Our current study has shown high percentage of relative gene expression of CTLA4 in Tregs compared to Teffs. Nevertheless, Teffs cells had detectable CTLA4 mRNA. At the protein level on day 7 after cell stimulation, Tregs and Teffs CTLA-4 expression on the cell surface was around 95% and 85% respectively. It is confirmed that CTLA-4 is continuously expressed on Tregs and occurs in T effector cells after activation, with maximum peak in proliferating, dividing cells (54). The discrepancies between low mRNA level at day 12 in Teffs and surface protein abundance can be explained by the CD4 activation model. Following TCR stimulation CTLA4 mRNA is detected after 1 h with its peak around 24-36 h, and depends on mRNA half-life which is within the range from 4,6 h to 8,9 h, according to cell stimulation (55). Furthermore, Chan V. et al. conducted a study on CD4+ cells and observed an increase of mRNA CTLA4 after 1 h after stimulation, maintained until 18 hours (56). Worth emphasizing is that CTLA-4 surface expression is modulated by many factors including TCR stimulation strength and depends on other mechanisms like CTLA-4 internalization and recycling (57).
Collectively, our results clearly demonstrate that stimulation with antigen-loaded monocytes presenting whole insulin or insulin β chain peptide 9-23 exerts epigenetic changes in Tregs. The type of stimulation determines the level of alterations in global DNA methylation pattern, and specific methylation of TSDR region as well as histone H3 PTMs. Insulin β chain peptide 9-23 promotes mainly Treg-oriented changes, while the phenotype after whole insulin stimulation was less clear. Hence, the pattern of the epigenetic changes may help finding the peptides that shape exclusively Tregs-mediated suppressive response or Teffs-mediated inflammatory response in future cellular drugs. Our observations indicate that antigen-specific Tregs during cell culture remained stable and comprise all Tregs-related features. It strengthens our confidence that our protocol allowing to obtain antigen-specific Tregs is a promising strategy of cell therapy, e.g. in type 1 diabetes.
The datasets presented in this study can be found in online repositories. The names of the repository/repositories and accession number(s) can be found below: Zenodo and 4442316 doi: 10.5281/zenodo.4442316.
Ethical review and approval was not required for the study on human participants in accordance with the local legislation and institutional requirements. Written informed consent for participation was not required for this study in accordance with the national legislation and the institutional requirements.
Conceptualization, DI-G, MG and PT. Methodology, DI-G, MP, MG, ZU-W and PT. Software, DI-G. Validation, DI-G and MP. Formal analysis, DI-G, MP and MG. Investigation, DIG and PT. Writing—original draft preparation, DI-G, MP and MG. Writing—review and editing, PT. Visualization, DI-G. Supervision. PT. Project administration, DI-G and PT. Funding acquisition, DI-G and PT. All authors contributed to the article and approved the submitted version.
This research was funded by National Centre for Research and Development (Poland), grant number LIDER/160/L-6/14/NCBR/2015 and STRATEGMED1/233368/1/NCBR/2014. ZUW was supported by “International Centre for Cancer Vaccine Science” project carried out within the International Research Agendas Programme of the Foundation for Polish Science co-financed by the European Union under the European Regional Development Fund.
The authors declare that the research was conducted in the absence of any commercial or financial relationships that could be construed as a potential conflict of interest.
The Supplementary Material for this article can be found online at: https://www.frontiersin.org/articles/10.3389/fimmu.2021.642678/full#supplementary-material
1. Iizuka-Koga M, Nakatsukasa H, Ito M, Akanuma T, Lu Q, Yoshimura A. Induction and maintenance of regulatory T cells by transcription factors and epigenetic modifications. J Autoimmun (2017) 83:113–21. doi: 10.1016/j.jaut.2017.07.002
2. Zhao H, Liao X, Kang Y. Tregs: Where we are and what comes next? Front Immunol (2017) 8:1578. doi: 10.3389/fimmu.2017.01578
3. Wing JB, Sakaguchi S. Treg Cells. Encyclopedia Immunobiol (2011) 136:1–10. doi: 10.1016/B978-0-12-374279-7.08006-1
4. Sakaguchi S, Yamaguchi T, Nomura T, Ono M. Regulatory T Cells and Immune Tolerance. Cell (2008) 133(5):775–87. doi: 10.1016/j.cell.2008.05.009
5. Chinen T, Kannan AK, Levine AG, Fan X, Klein U, Zheng Y, et al. An essential role for the IL-2 receptor in T reg cell function. Nat Immunol (2016) 17(11):1322–33. doi: 10.1038/ni.3540
6. Grzanka J, Leveson-Gower D, Golab K, Wang XJ, Marek-Trzonkowska N, Krzystyniak A, et al. FoxP3, Helios, and SATB1: Roles and relationships in regulatory T cells. Int Immunopharmacol (2013) 16(3):343–7. doi: 10.1016/j.intimp.2013.02.004
7. Sharma MD, Huang L, Choi JH, Lee EJ, Wilson JM, Lemos H, et al. An Inherently Bifunctional Subset of Foxp3+ T Helper Cells Is Controlled by the Transcription Factor Eos. Immunity (2013) 38(5):998–1012. doi: 10.1016/j.immuni.2013.01.013
8. Liao G, Nayak S, Regueiro JR, Berger SB, Detre C, Romero X, et al. GITR engagement preferentially enhances proliferation of functionally competent CD4+CD25+FoxP3+ regulatory T cells. Int Immunol (2010) 22:259–70. doi: 10.1093/intimm/dxq001
9. Gliwiński M, Iwaszkiewicz-Grześ D, Trzonkowski P. Cell-Based Therapies with T Regulatory Cells. BioDrugs (2017) 31(4):335–47. doi: 10.1007/s40259-017-0228-3
10. Marek-Trzonkowska N, Myśliwec M, Siebert J, Trzonkowski P. Clinical application of regulatory T cells in type 1 diabetes. Pediatr Diabetes (2013) 14(5):322–32. doi: 10.1111/pedi.12029
11. Trzonkowski P, Dukat-Mazurek A, Bieniaszewska M, Marek-Trzonkowska N, Dobyszuk A, Juåcińska J, et al. Treatment of graft-versus-host disease with naturally occurring T regulatory cells. BioDrugs (2013) 27(6):605–14. doi: 10.1007/s40259-013-0050-5
12. Ryba-Stanisławowska M, Sakowska J, Zieliński M, Ławrynowicz U, Trzonkowski P. Regulatory T cells: the future of autoimmune disease treatment. Expert Rev Clin Immunol (2019) 15(7):777–89. doi: 10.1080/1744666X.2019.1620602
13. Perdigoto AL, Chatenoud L, Bluestone JA, Herold KC. Inducing and Administering Tregs to Treat Human Disease. Front Immunol (2016) 6:654. doi: 10.3389/fimmu.2015.00654
14. Iwaszkiewicz-Grzes D, Gliwinski M, Eugster A, Piotrowska M, Dahl A, Marek-Trzonkowska N, et al. Antigen-reactive regulatory T cells can be expanded in vitro with monocytes and anti-CD28 and anti-CD154 antibodies. Cytotherapy (2020) 22(11):629–41. doi: 10.1016/j.jcyt.2020.07.001
15. Trzonkowski P, Szaryńska M, Myśliwska J, Myśliwski A. Ex vivo expansion of CD4+CD25+ T regulatory cells for immunosuppressive therapy. Cytom Part A (2009) 75(3):175–88. doi: 10.1002/cyto.a.20659
16. Marek-Trzonkowska N, Myśliwiec M, Iwaszkiewicz-Grześ D, Gliwiński M, Derkowska I, Zalińska M, et al. Factors affecting long-term efficacy of T regulatory cell-based therapy in type 1 diabetes. J Transl Med (2016) 14(1):332. doi: 10.1186/s12967-016-1090-7
17. Brinke AT, Marek-Trzonkowska N, Mansilla MJ, Turksma AW, Piekarska K, Iwaszkiewicz-Grzes D, et al. Monitoring T-cell responses in translational studies: Optimization of dye-based proliferation assay for evaluation of antigen-specific responses. Front Immunol (2017) 8:1870. doi: 10.3389/fimmu.2017.01870
18. Livak KJ, Schmittgen TD. Analysis of relative gene expression data using real-time quantitative PCR and the 2-ΔΔCT method. Methods (2001) 25(4):402–8. doi: 10.1006/meth.2001.1262
19. Zafari P, Yari K, Mostafaei S, Iranshahi N, Assar S, Fekri A, et al. Analysis of Helios gene expression and Foxp3 TSDR methylation in the newly diagnosed Rheumatoid Arthritis patients. Immunol Invest (2018) 47(6):632–42. doi: 10.1080/08820139.2018.1480029
20. Li LC, Dahiya R. MethPrimer: Designing primers for methylation PCRs. Bioinformatics (2002) 18(11):1427–31. doi: 10.1093/bioinformatics/18.11.1427
21. Metsalu T, Vilo J. ClustVis: A web tool for visualizing clustering of multivariate data using Principal Component Analysis and heatmap. Nucleic Acids Res (2015) 43(W1):W566–70. doi: 10.1093/nar/gkv468
22. Gliwiński M, Iwaszkiewicz-Grześ D, Wołoszyn-Durkiewicz A, Tarnowska M, Zalińska M, Hennig M, et al. Proinsulin-specific T regulatory cells may control immune responses in type 1 diabetes: Implications for adoptive therapy. BMJ Open Diabetes Res Care (2020) 8(1):1–11. doi: 10.1136/bmjdrc-2019-000873
23. Vanhanen R, Leskinen K, Mattila IP, Saavalainen P, Arstila TP. Epigenetic and transcriptional analysis supports human regulatory T cell commitment at the CD4+CD8+ thymocyte stage. Cell Immunol (2020) 347:104026. doi: 10.1016/j.cellimm.2019.104026
24. Wing JB, Tanaka A, Sakaguchi S. Human FOXP3 + Regulatory T Cell Heterogeneity and Function in Autoimmunity and Cancer. Immunity (2019) 50(2):302–16. doi: 10.1016/j.immuni.2019.01.020
25. Zheng Y, Josefowicz S, Chaudhry A, Peng XP, Forbush K, Rudensky AY. Role of conserved non-coding DNA elements in the Foxp3 gene in regulatory T-cell fate. Nature (2010) 463(7282):808–12. doi: 10.1038/nature08750
26. Floess S, Freyer J, Siewert C, Baron U, Olek S, Polansky J, et al. Epigenetic control of the foxp3 locus in regulatory T cells. PloS Biol (2007) 5(2):38. doi: 10.1371/journal.pbio.0050038
27. Baron U, Türbachova I, Hellwag A, Eckhardt F, Berlin K, Hoffmuller U, et al. DNA methylation analysis as a tool for cell typing. Epigenetics (2006) 1(1):55–60. doi: 10.4161/epi.1.1.2643
28. Lee W, Lee GR. Transcriptional regulation and development of regulatory T cells. Exp Mol Med (2018) 50(3):456. doi: 10.1038/emm.2017.313
29. Miyao T, Floess S, Setoguchi R, Luche H, Fehling HJ, Waldmann H, et al. Plasticity of Foxp3 + T Cells Reflects Promiscuous Foxp3 Expression in Conventional T Cells but Not Reprogramming of Regulatory T Cells. Immunity (2012) 36(2):262–75. doi: 10.1016/j.immuni.2011.12.012
30. Cheraï M, Hamel Y, Baillou C, Touil S, Guillot-Delost M, Charlotte F, et al. Generation of human alloantigen-specific regulatory t cells under good manufacturing practice-compliant conditions for cell therapy. Cell Transplant (2015) 24(12):2527–40. doi: 10.3727/096368914X683566
31. Rossetti M, Spreafico R, Saidin S, Chua C, Moshref M, Leong JY, et al. Ex Vivo–Expanded but Not In Vitro–Induced Human Regulatory T Cells Are Candidates for Cell Therapy in Autoimmune Diseases Thanks to Stable Demethylation of the FOXP3 Regulatory T Cell–Specific Demethylat1ed Region. J Immunol (2015) 194(1):113–24. doi: 10.4049/jimmunol.1401145
32. Li Y, Chen G, Ma L, Ohms SJ, Sun C, Shannon MF, et al. Plasticity of DNA methylation in mouse T cell activation and differentiation. BMC Mol Biol (2012) 13:16. doi: 10.1186/1471-2199-13-16
33. Vincenzetti L, Leoni C, Chirichella M, Kwee I, Monticelli S. The contribution of active and passive mechanisms of 5mC and 5hmC removal in human T lymphocytes is differentiation- and activation-dependent. Eur J Immunol (2019). doi: 10.1002/eji.201847967
34. Lopez-Pastrana J, Shao Y, Chernaya V, Wang H, Yang XF. Epigenetic enzymes are the therapeutic targets for CD4+CD25+/highFoxp3+ regulatory T cells. Transl Res (2015) 49(4):611–25. doi: 10.1016/j.trsl.2014.08.001
35. Janssen KA, Sidoli S, Garcia BA. Recent Achievements in Characterizing the Histone Code and Approaches to Integrating Epigenomics and Systems Biology. Methods Enzymology (2017) 586:359–78. doi: 10.1016/bs.mie.2016.10.021
36. Lawrence M, Daujat S, Schneider R. Lateral Thinking: How Histone Modifications Regulate Gene Expression. Trends Genet (2016) 32(1):42–56. doi: 10.1016/j.tig.2015.10.007
38. LaMere SA, Thompson RC, Komori HK, Mark A, Salomon DR. Promoter H3K4 methylation dynamically reinforces activation-induced pathways in human CD4 T cells. Genes Immun (2016) 17(5):283–97. doi: 10.1038/gene.2016.19
39. Tian Y, Jia Z, Wang J, Huang Z, Tang J, Zheng Y, et al. Global mapping of H3K4me1 and H3K4me3 reveals the chromatin state-based cell type-specific gene regulation in human treg cells. PloS One (2011) 6(11):e27770. doi: 10.1371/journal.pone.0027770
40. Morikawa H, Sakaguchi S. Genetic and epigenetic basis of Treg cell development and function: From a FoxP3-centered view to an epigenome-defined view of natural Treg cells. Immunol Rev (2014) 259(1):192–205. doi: 10.1111/imr.12174
41. Hatton RD, Harrington LE, Luther RJ, Wakefield T, Janowski KM, Oliver JR, et al. A Distal Conserved Sequence Element Controls Ifng Gene Expression by T Cells and NK Cells. Immunity (2006) 25(5):717–29. doi: 10.1016/j.immuni.2006.09.007
42. Ansel KM, Djuretic I, Tanasa B, Rao A. Regulation of Th2 differentiation and Il4 locus accessibility. Annu Rev Immunol (2006) 24:607–56. doi: 10.1146/annurev.immunol.23.021704.115821
43. Morikawa H, Ohkura N, Vandenbon A, Itoh M, Nagao-Sato S, Kawaji H, et al. Differential roles of epigenetic changes and Foxp3 expression in regulatory T cell-specific transcriptional regulation. Proc Natl Acad Sci USA (2014) 111(14):5289–94. doi: 10.1073/pnas.1312717110
44. Wang Z, Yin H, Lau CS, Lu Q. Histone posttranslational modifications of CD4+ T cell in autoimmune diseases. Int J Mol Sci (2016) 17(10):1547. doi: 10.3390/ijms17101547
45. LaMere SA, Thompson RC, Meng X, Komori HK, Mark A, Salomon DR. H3K27 Methylation Dynamics during CD4 T Cell Activation: Regulation of JAK/STAT and IL12RB2 Expression by JMJD3. J Immunol (2017) 199(9):3158–75. doi: 10.4049/jimmunol.1700475
46. Yang XP, Jiang K, Hirahara K, Vahedi G, Afzali B, Sciume G, et al. EZH2 is crucial for both differentiation of regulatory T cells and T effector cell expansion. Sci Rep (2015) 5:10643. doi: 10.1038/srep10643
47. DuPage M, Chopra G, Quiros J, Rosenthal WL, Morar MM, Holohan D, et al. The chromatin-modifying enzyme Ezh2 is critical for the maintenance of regulatory T cell identity after activation. Immunity (2015) 42(2):227–38. doi: 10.1016/j.immuni.2015.01.007
48. Wang D, Quiros J, Mahuron K, Pai CC, Ranzani V, Young A, et al. Targeting EZH2 Reprograms Intratumoral Regulatory T Cells to Enhance Cancer Immunity. Cell Rep (2018) 23(11):3262–74. doi: 10.1016/j.celrep.2018.05.050
49. Ephrem A, Epstein AL, Stephens GL, Thornton AM, Glass D, Shevach EM. Modulation of Treg cells/T effector function by GITR signaling is context-dependent. Eur J Immunol (2013) 43(9):2421–9. doi: 10.1002/eji.201343451
50. Rieder SA, Metidji A, Glass DD, Thornton AM, Ikeda T, Morgan BA, et al. Eos Is Redundant for Regulatory T Cell Function but Plays an Important Role in IL-2 and Th17 Production by CD4 + Conventional T Cells. J Immunol (2015) 195(2):553–63. doi: 10.4049/jimmunol.1500627
51. Ferraro A, D’Alise AM, Raj T, Asinovski N, Phillips R, Ergun A, et al. Interindividual variation in human T regulatory cells. Proc Natl Acad Sci USA (2014) 111(12):E1111–20. doi: 10.1073/pnas.1401343111
52. Bjur E, Larsson O, Yurchenko E, Zheng L, Gandin V, Topisirovic I, et al. Distinct Translational Control in CD4+ T Cell Subsets. PloS Genet (2013) 9(5):e1003494. doi: 10.1371/journal.pgen.1003494
53. Deng G, Song X, Fujimoto S, Piccirillo CA, Nagai Y, Greene MI. Foxp3 post-translational modifications and treg suppressive activity. Front Immunol (2019) 10:2486. doi: 10.3389/fimmu.2019.02486
54. Jain N, Nguyen H, Chambers C, Kang J. Dual function of CTLA-4 in regulatory T cells and conventional T cells to prevent multiorgan autoimmunity. Proc Natl Acad Sci USA (2010) 107(4):1524–8. doi: 10.1073/pnas.0910341107
55. Teft WA, Kirchhof MG, Madrenas J. A MOLECULAR PERSPECTIVE OF CTLA-4 FUNCTION. Annu Rev Immunol (2006) 24:65–97. doi: 10.1146/annurev.immunol.24.021605.090535
56. Chan DV, Gibson HM, Aufiero BM, Wilson AJ, Hafner MS, Mi QS, et al. Differential CTLA-4 expression in human CD4+ versus CD8 + T cells is associated with increased NFAT1 and inhibition of CD4+ proliferation. Genes Immun (2014) 15(1):25–32. doi: 10.1038/gene.2013.57
Keywords: TSDR, antigen-specific, DNA methylation, histone H3, gene expression, epigenetics
Citation: Iwaszkiewicz-Grzes D, Piotrowska M, Gliwinski M, Urban-Wójciuk Z and Trzonkowski P (2021) Antigenic Challenge Influences Epigenetic Changes in Antigen-Specific T Regulatory Cells. Front. Immunol. 12:642678. doi: 10.3389/fimmu.2021.642678
Received: 16 December 2020; Accepted: 03 March 2021;
Published: 23 March 2021.
Edited by:
Nirupama Darshan Verma, University of New South Wales, AustraliaReviewed by:
Lianjun Zhang, Suzhou Institute of Systems Medicine (ISM), ChinaCopyright © 2021 Iwaszkiewicz-Grzes, Piotrowska, Gliwinski, Urban-Wójciuk and Trzonkowski. This is an open-access article distributed under the terms of the Creative Commons Attribution License (CC BY). The use, distribution or reproduction in other forums is permitted, provided the original author(s) and the copyright owner(s) are credited and that the original publication in this journal is cited, in accordance with accepted academic practice. No use, distribution or reproduction is permitted which does not comply with these terms.
*Correspondence: Piotr Trzonkowski, cHRyem9uQGd1bWVkLmVkdS5wbA==
†These authors have contributed equally to this work
Disclaimer: All claims expressed in this article are solely those of the authors and do not necessarily represent those of their affiliated organizations, or those of the publisher, the editors and the reviewers. Any product that may be evaluated in this article or claim that may be made by its manufacturer is not guaranteed or endorsed by the publisher.
Research integrity at Frontiers
Learn more about the work of our research integrity team to safeguard the quality of each article we publish.