 Cui Zhou
 Ling-Ling Chen2
 Rui-Qi Lu
 Wei-Wei Ma
95% of researchers rate our articles as excellent or good
Learn more about the work of our research integrity team to safeguard the quality of each article we publish.
Find out more
ORIGINAL RESEARCH article
Front. Immunol. , 10 June 2021
Sec. Immunological Tolerance and Regulation
Volume 12 - 2021 | https://doi.org/10.3389/fimmu.2021.631494
This article is part of the Research Topic Allergen Immunotherapy for Airborne and Food Allergens: Efficacy and Immunological Mechanisms View all 5 articles
This research aimed to investigate the allergic reaction of C3H/HeJ mice after sensitization with ovalbumin (OVA) without any adjuvant and to analyze the association between intestinal microbiota and allergy-related immune cells in mesenteric lymph nodes (MLN). The allergic responses of C3H/HeJ mice orally sensitized with OVA were evaluated, and immune cell subsets in spleen and MLN and cytokines were also detected. The intestinal bacterial community structure was analyzed, followed by Spearman correlation analysis between changed gut microbiota species and allergic parameters. Sensitization induced a noticeable allergic response to the gavage of OVA without adjuvant. Increased levels of Th2, IL-4, CD103+CD86+ DC, and MHCII+CD86+ DC and decreased levels of Th1, Treg, IFN-γ, TGF-β1, and CD11C+CD103+ DC were observed in allergic mice. Furthermore, families of Lachnospiraceae, Clostridiaceae_1, Ruminococcaceae, and peprostreptococcaceae, all of which belonging to the order Clostridiales, were positively related to Treg and CD11C+CD103+ DC, while they were negatively related to an allergic reaction, levels of Th2, CD103+CD86+ DC, and MHCII+CD86+ DC in MLN. The family of norank_o_Mollicutes_RF39 belonging to the order Mollicutes_RF39 was similarly correlated with allergic reaction and immune cells in MLN of mice. To sum up, allergic reactions and intestinal flora disturbances could be induced by OVA oral administration alone. The orders of Clostridiales and Mollicutes_RF39 in intestinal flora are positively correlated with levels of Treg and CD11C+CD103+ DC in MLN of mice.
It is undisputed that food allergy (FA) has become one of the most important public health problems due to its remarkably increased prevalence worldwide in recent years (1). In the USA, the reported prevalence of food allergies was 7.6% in children (2) and 10.8% in adults (3). Although the prevalence of FA is not accurately known in China, the latest epidemiological survey in Wenzhou, China, reported a prevalence rate of 12.86% in preschool children (4).
As antigen-presenting cells (APCs), dendritic cells (DCs) in local immune tissue [peyer’s patch, mesenteric lymph node (MLN) and so on] (5) and peripheral immune organs (e.g., spleen) (6) play pivotal roles in the induction of tolerance and food allergy (7). It has been demonstrated that CD103+ DCs in MLN can promote the development of T regulatory cells (Tregs) (5), which can suppress Th2 response, thus, preventing FA and maintaining tolerance (8, 9). Therefore, the association among DCs, Tregs, and Th2 will influence the dynamic balance between T-helper type 1 (Th1) and Th2 cells in food allergic conditions.
Genetic variation, thought to be a vital factor inducing food allergy for many years (10, 11), could not, however, explain the dramatic increase in its prevalence (12–15). Therefore, researchers have proposed the hypothesis that interaction between the environment and the immune system may have contributed to allergic diseases because of changes in sanitary conditions, dietary habits, and surroundings (16), which are often accompanied by alteration in the symbiotic microbiota (11). The focus of research about food allergy has thus shifted toward commensal microbiota in recent years (16, 17).
The intestinal microbiota is found to be a key environmental factor in promoting oral tolerance (18, 19). Germ-free (GF) mice are more likely to produce T-helper type 2 (Th2) cells and IgE responses to dietary allergen than specific pathogen-free (SPF) mice (20), while the colonization of microbial population suppresses Th2 response and prevents mice from FA (21). The abundance of several bacterial families, including the Lachnospiraceae, Lactobacillaceae, Rikenellaceae, and Porphyromonadaceae, changed after ovalbumin (OVA) oral sensitization in food-allergy-susceptible mice (Il4raF709 mice), while this change was not observed in sensitized WT mice (22). Different from the results of previous studies, a comparison of the microbiota composition of OVA allergic mice and non-responders found significantly higher abundances of sequence belonging to Synthrophaceae and Ruminococcaceae in non-responders (23).
The relationship between intestinal microbiota and food allergy strongly supported the critical role microbiota plays in the process of food allergy; however, the role of intestinal microbiota dysbiosis in food allergy and the mechanism of their interaction (24) need to be demonstrated. In the present study, we employed the C3H/HeJ mice and used OVA oral sensitization based on our previous protocol (25) to build a food allergy model. The high throughput sequencing of 16S rRNA was used to analyze differences in intestinal microbiota between allergic and negative control mice. And then the correlation of the changed intestinal bacterial flora and allergy-related immune cells in mesenteric lymph nodes (MLN) was also assessed. We found OVA sensitization without using an adjuvant induced allergic reactions and alteration of intestinal microbiota. The abundance of orders Clostridiales and Mollicutes_RF39 were positively correlated to Tregs and dendritic cells (DCs) subgroup CD11C+CD103+ DCs in MLN of mice.
All of the animal experiments in this research were performed according to the guidelines of the Institutional Animal Care and Use Committee. The animal experimental protocols were approved by the Experimental Animal Ethics Committee of the Capital Medical University with a license (AEEI-2018-128). In total, 24 specific pathogen-free (SPF) C3H/HeJ mice (female, 6 weeks old) with a body weight of 14.7–15.8 g were purchased from Vital River Laboratories (VRLs, Beijing, China) and bred and maintained in pathogen-free facilities in Capital Medical University. The mice were housed under conditions of 23°C/40–70% relative humidity and a 12h light/dark cycle with free access to a commercially available rodent diet and distilled water. Then the mice were randomly and evenly divided into two groups (OVA treated and Control group) with 12 mice per group and received different treatment after 1 week of acclimation. Four mice of the same group were set in one regular mouse cage.
The experiment protocol is displayed in Figure 1. On days 0, 7, 14, 21, and 28 of the experiment, 200 uL pure saline or 200 uL saline containing 1mg OVA were gavaged to two groups of mice respectively for sensitization. On day 42, the challenge was achieved by intragastric administration of 1mL pure saline or 1 mL saline containing 5 mg OVA to mice in the two groups respectively. Blood samples were collected from the angular vein of each mouse 30 min after a challenge on day 42. Then the serum was collected, divided into four parts and stored in -80°C for batch-estimation of IgE, IgG1, IgG2a, and cytokines including Interferon-γ (IFN-γ), Interleukin-10 (IL-10), Interleukin-4 (IL-4), Transforming growth factor-β (TGF-β), and Mouse mast cell protease-1 (mMCP-1).
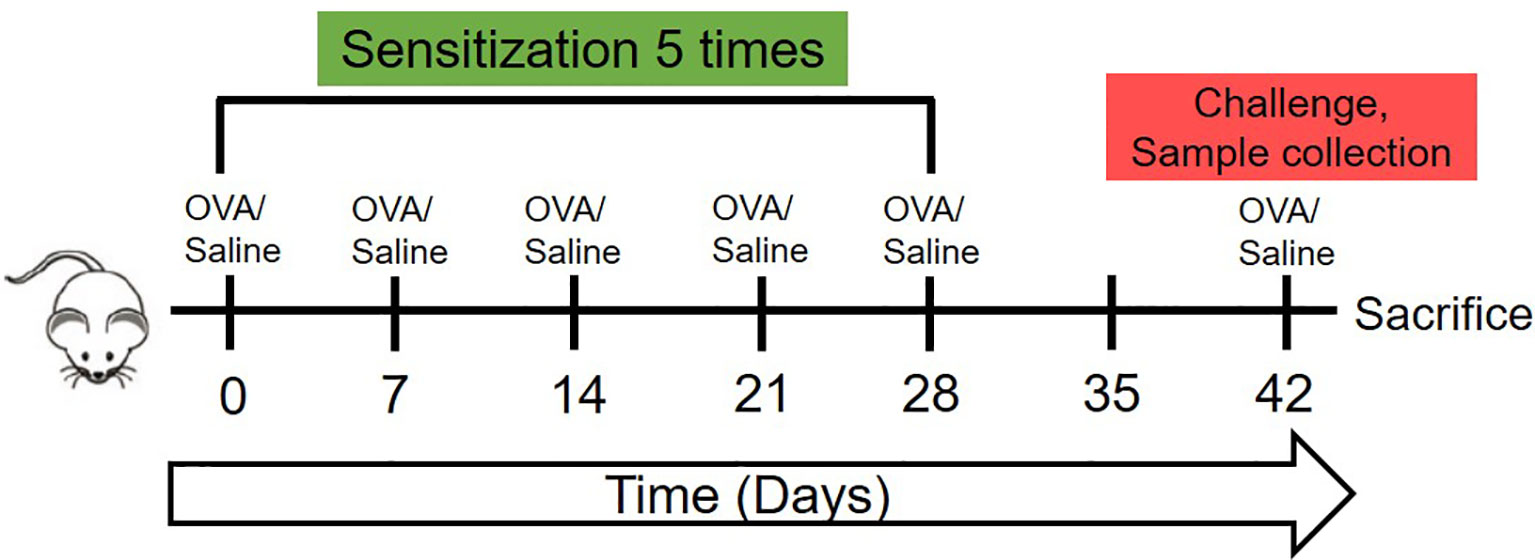
Figure 1 The schematic of the animal experiment of this research. The 7-week-old female C3H/HeJ mice were sensitized once weekly in the first 28 days with 1mg OVA dissolved in 200 ul saline or 200 ul saline by oral gavage. Then, on day 42, were orally challenged with 5mg OVA dissolved in 1 ml saline or 1 ml saline, followed by sera collection, temperature detection and sacrifice.
Besides, to estimate body temperature, the rectal temperature of each mouse was detected with a WI88375 probe (Beijing Science and Technology, Beijing) and recorded 10 min prior to the challenge and at 10 min intervals (for up to 50 min) after the challenge to assess their allergic reactions. Meanwhile, the symptoms of clinical anaphylaxis were monitored according to previous research (5): 0, no clinical symptom; 1, repetitive ear/mouth scratching and ear canal digging with hind legs; 2, decreased activity, self-isolation, and puffiness around eyes or mouth; 3, periods of motionless for more than 1 min, lying prone on the stomach, and decreased activity with an increased respiratory rate; 4, no response to whisker stimuli and reduced or no response to prodding; and 5, tremor, convulsion, and death. Then peritoneal lavage was performed with saline in each mouse and the saline was collected for detection of protein using a BCA kit (enhanced) purchased from Beyotime Biotechnology (Kit No. P0010S, Shanghai, China).
The levels of OVA-specific IgE (sIgE), total IgG1, and IgG2a in serum of each mouse were tested using ELISA kits from Beijing Mecen Unicreate Bio-tech Co., LTD according to the protocols provided by the manufacturer. The concentration of IFN-γ, IL-10, IL-4, TGF-β, and mMcp-1 in the sera were measured using a multi-cytokine U-PLEX designed kit (Lot No. K152XWK-1 for TGF-β and K15069L-1 for others, Meso Scale Diagnoistics, LLC., Rockville, USA) according to the instruction of the manufacturer. The U-PLEX kit was designed to provide ultimate flexibility for the detection of several cytokines in only 25 ul sera through MSD electrochemiluminescence detection technology using SULFO-TAGTM markers. Sensitivity levels of the kits were 0.1 μg/mL for IgE, 1.0 μg/mL for IgG1, 0.1 μg/mL for IgG2a, 0.16 pg/mL for IFN-γ, 3.8 pg/mL for IL-10, 0.56 pg/mL for IL-4, 37 pg/mL for TGF-β, and 1.4 pg/mL for mMcp-1.
The isolation of splenocytes and mesenteric lymph node (MLN) cells was performed as previously described (25). Then, the cells were divided into tubes with 5106 cells per tube. The FITC conjugated rat anti-mouse CD69, Brilliant Violet 421™ conjugated Armenian Hamster anti-mouse CD183 (CXCR3), and PE-conjugated rat anti-mouse IL-33Rα (ST2) monoclonal antibodies (mAb) were used to stain Th1 and Th2 cells. FITC conjugated rat anti-mouse CD4, PE-conjugated rat anti-mouse CD25, and APC-conjugated rat anti-mouse Foxp3 monoclonal antibodies (mAb) were used to stain Treg cells (Tregs). FITC-conjugated rat anti-mouse CD11C, PE-conjugated Armenian Hamster anti-mouse CD103, APC-conjugated rat anti-mouse CD80, PE/Cy7-conjugated rat anti-mouse CD86, and PerCP/Cyanine5.5-conjugated rat anti-mouse MHC class II (MHCII) mAbs were used to stain dendritic cells (DCs). The anti-mouse CD4, CD69, CD11C, and CD80 mAbs were purchased from Tonbo Bioscience (San Diego, CA, USA). The anti-mouse CD25 and Foxp3 mAbs were purchased from eBioscience (Waltham, MA USA). Additionally, the other mAbs were bought from BioLegend Inc (San Diego, CA, USA). The detailed staining steps were performed based on the previous description (26). Briefly, single-cell suspensions (5106 cells) were blocked with PBS containing 5% fetal calf serum (FCS) and 1% BSA, following with incubation of 30 min with either mAb. For detection of Foxp3, cells were permeabilized and incubated with anti-Foxp3 according to the manufacturer’s protocol (eBioscience). Finally, the stained cells were analyzed using a flow cytometer (NovoCyte, ACEA, Hangzhou, China). For each sample, more than 10000 events were required.
To analyze the composition of intestinal microbiota, fecal samples of every mouse were collected on the 42nd day. To avoid contamination, two feces of each mouse were collected in an EP tube during defecation. Microbial community genomic DNA was extracted from 0.2–0.3g of feces using the E.Z.N.A.® soil DNA Kit (Omega Biotek. Norcross, GA, U.S.) according to the manufacturer’s instructions. The DNA extract was checked on 1% agarose gel, and DNA concentration and purity were determined with NanoDrop 2000 UV-vis spectrophotometer (Thermo Scientific, Wilmington, USA). The hypervariable region V3-V4 of the bacterial 16S rRNA genes were amplified with primer pairs 338F (5’-ACTCCTACGGGAGGCAGCAG-3’) and 806R(5’-GGACTACHVGGGTWTCTAAT-3’) by an ABI GeneAmp® 9700 PCR thermocycler (ABI, CA, USA), with an eight-base sequence barcode unique to each sample at the 5′ end of 338F and 806R, respectively. The PCR amplification of 16S rRNA gene was performed as follows: initial denaturation at 95°C for 3 min, followed by 27 cycles of denaturing at 95°C for 30 s, annealing at 55°C for 30 s and extension at 72°C for 45 s, and single extension at 72°C for 10 min, ending at 10°C. The PCR mixtures contain 4 μL of 5 × TransStart FastPfu buffer, 2 μL of 2.5 mM dNTPs, 0.8 μL of forward primer (5 μM), 0.8 μL of reverse primer (5 μM), 0.4 μL of TransStart FastPfu DNA Polymerase, 10 ng of template DNA, and finally up to 20 μL of ddH2O. The PCR product was extracted from 2% agarose gel and purified using the AxyPrep DNA Gel Extraction Kit (Axygen Biosciences, Union City, CA, USA) according to manufacturer’s instructions and quantified using QuantiFluor™ -ST (Promega, USA).
Purified amplicons were pooled in equimolar and paired-end sequenced (2 ×300) on an Illumina MiSeq PE300 platform (Illumina, San Diego, USA) according to the standard protocols by Majorbio Bio-Pharm Technology Co. Ltd. (Shanghai, China). The raw reads were deposited into the NCBI Sequence Read Archive (SRA) database (Accession Number: PRJNA658922).
The raw 16S rRNA gene sequencing reads were demultiplexed, quality-filtered by Trimmomatic, and merged by FLASH with the following criteria: (i) the 300 bp reads were truncated at any site receiving an average quality score of <20 over a 50 bp sliding window, and the truncated reads shorter than 50 bp were discarded; (ii) exact barcode matching, 2 nucleotide mismatch in primer matching, and reads containing ambiguous characters were removed; and (iii) only overlapping sequences longer than 10 bp were assembled according to their overlapped sequence. Reads that could not be assembled were discarded. Then the number of obtained sequences was normalized by randomly subsampling each sample to the lowest level of sequences among samples.
Operational taxonomic units (OTUs) with 97% similarity cutoff (27) were clustered using UPARSE (version 7.1, http://drive5.com/uparse/), and chimeric sequences were identified and removed using UCHIME. The taxonomy of each OTU representative sequence was analyzed by RDP Classifier (http://rdp.cme.msu.edu/) against the 16S rRNA database (Silva SSU132) with a confidence threshold of 0.7.
The community richness, diversity, and evenness of species were assessed through several α-diversity indices, including Coverage, Ace, Chao, Shannon, Simpson, Phylogenetic diversity (PD), Shannoneven, and Sampsoneven, which were calculated using a mothur (version v.1.30.1) program basing on OTUs with 97% similarity. Wilcoxon rank-sum test was used to compare their diversity. The R package and Abund_jaccard distance metrix were used to perform Hierarchical clustering analysis on the OUT level. And the abund_jaccard distance metrix was also used to carry out Principal Component Analysis (PCA) and Principal coordinates analysis (PCoA) on the OUT level. Visualization of interactions among bacterial taxa in different samples was conducted using the R package. ANOSIM was performed to compare the microbiota composition between samples (28). Apart from the analysis above, Linear discriminant analysis (LDA) coupled with effect size measurements (LEfSe) analysis was conducted to search for statistically different bacteria species between two groups. Thus the different taxa from the phylum to the genus level were analyzed and visualized by taxonomic charts using the LEfSe tool (http://huttenhower.sph.harvard.edu/galaxy/root) since the analysis of the large number of OTUs detected in this study would be computationally too complex (29, 30).
All of the data were analyzed using SPSS 23.0 software and expressed as mean ± SD. GraphPad Prism V.5.0 (San Diego, CA, USA) was employed for graph preparation. The statistical analysis was performed using two-tailed Student’s test with the exception of 16S rRNA sequencing data, which were analyzed using a Wilcoxon rank-sum test. Spearman correlation analysis was performed for determining the correlation coefficient between distinguished intestinal flora and other allergy-related indicators. The p value of less than or equal to 0.05 was considered statistically significant. *p ≤0.05, **p ≤0.01, ***p ≤0.001.
It has been verified in a previous experiment that the C3H/HeJ mouse did not show any specific immune responses to the commercially standard feeding. Thus, the concentrations of sIgE, IgG1, and IgG2a in the sera of mice were measured and the ratio of IgG1/IgG2a was calculated to estimate their allergic reaction to OVA through oral administration. As shown in Figures 2A, B, mice produced significantly higher levels of IgE in response to OVA oral treatment than did mice in Control group (p ≤0.05). And the ratios of IgG1/IgG2a in OVA treated mice were also significantly higher than those in Control mice (p ≤0.05). This suggested that the mice developed humoral immune responses to oral OVA sensitization.
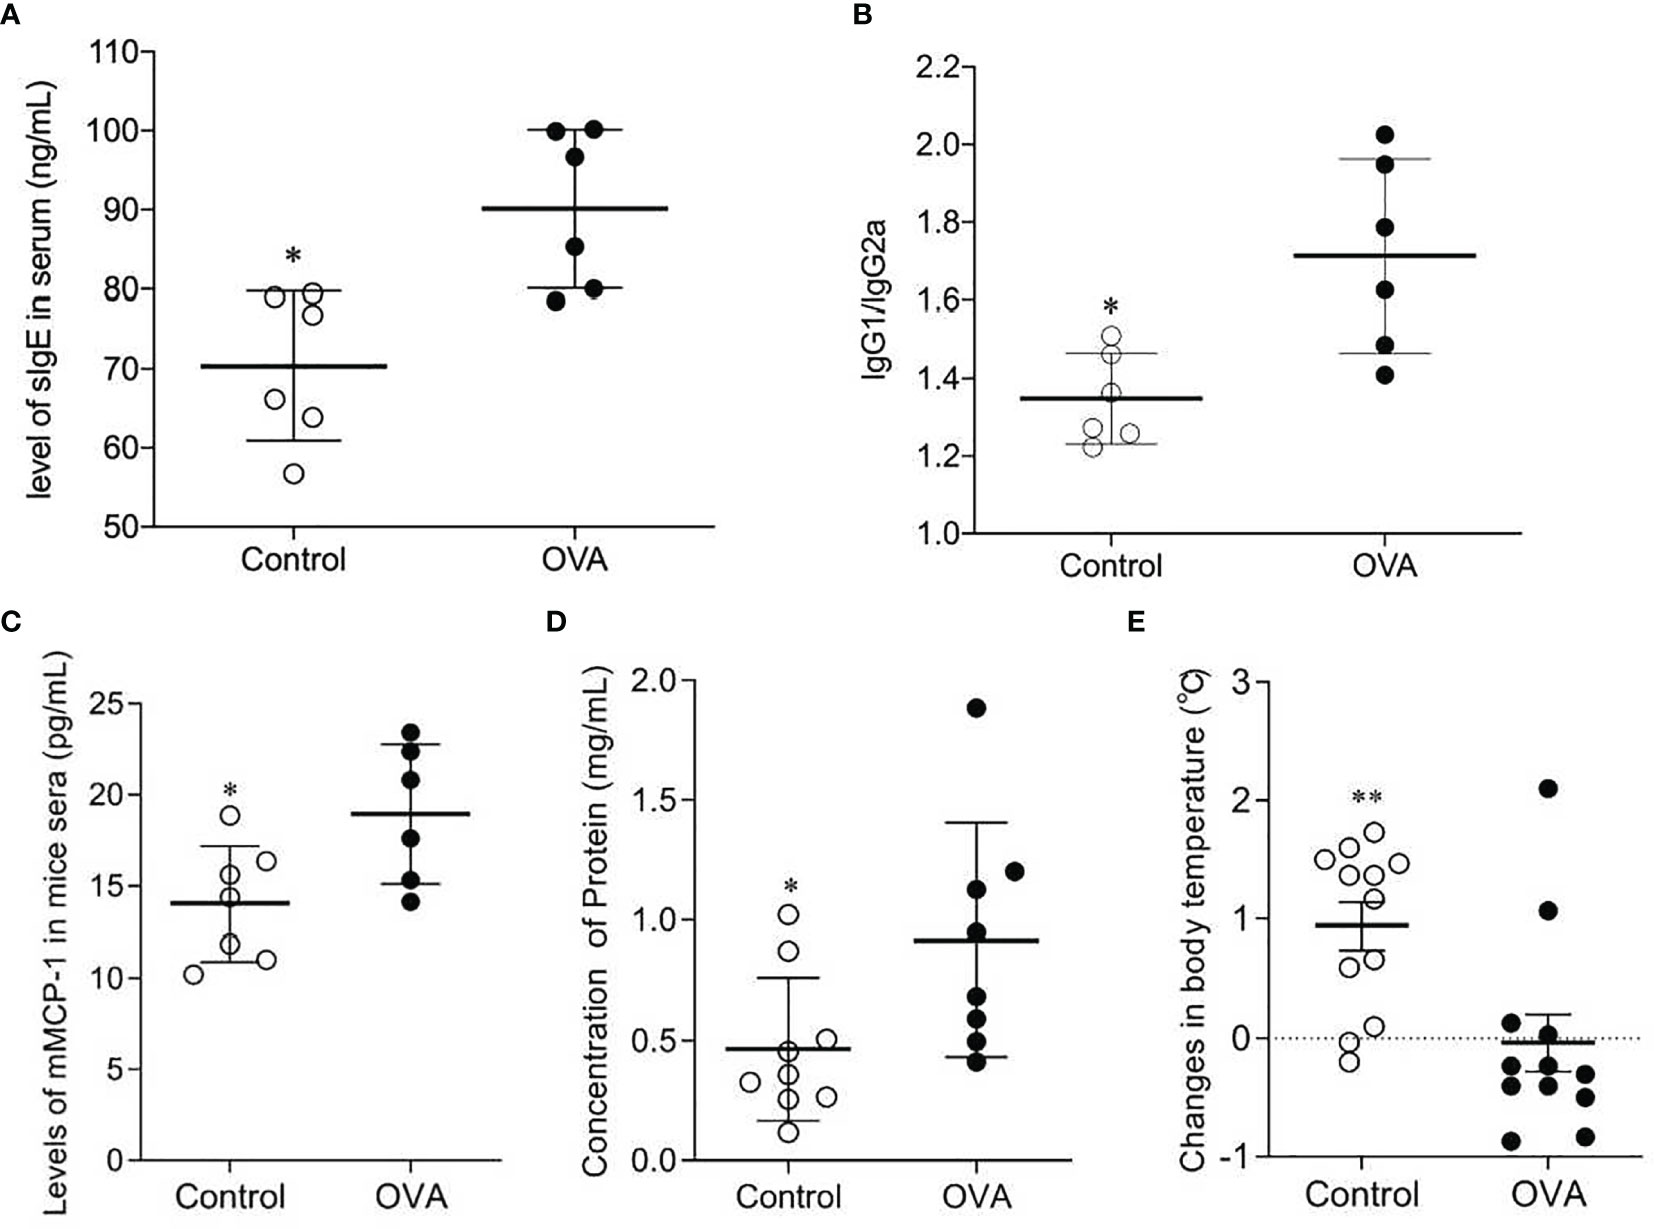
Figure 2 Concentrations of sIgE (A) and ratios of IgG1/IgG2a (B) in sera of OVA-treated (OVA) and saline-treated (Control) mice; Scatter plot of mMCP-1 level of mice serum (C), protein concentration of peritoneal lavage fluid (D) and drop of temperature (E) in Control and OVA treated mice. The sera and peritoneal lavage fluid collection were conducted after the challenge, and protocols were described in Methods. The changes in body temperature were calculated by subtracting the rectal temperature (°C) of mice at 10 minutes before the challenge from the rectal temperature (°C) of mice at 50 minutes after the challenge. One plot denotes one sample, and the bar in the graph denotes Mean and SD. n=6-12/group. *p ≤ 0.05 vs OVA-treated group. Statistical analyses were performed with a two-tailed Student’s test. **p ≤ 0.01 vs OVA-treated group.
To further verify the mice’s allergic reactions to OVA, concentrations of mMCP-1 in serum, levels of protein in peritoneal lavage fluid, drop in mice body temperature, and clinical anaphylaxis were measured. As shown in Figure 2, the sera of OVA-treated mice contained higher levels of mMCP-1, which is primarily released from mast cell degranulation, than those of Control mice (p ≤0.05, Figure 2C). The concentrations of protein in peritoneal lavage fluid of OVA treated hosts were remarkably higher than those in Control hosts (p ≤0.05, Figure 2D). In addition, the drop in body temperature in OVA-treated mice was also greater than that in Control mice (p ≤0.005, Figure 2E). Although there was no significant difference in anaphylaxis score between the two groups, OVA-treated mice showed higher scores when comparing with Control mice (Figure S1). These results suggested that the OVA-treated mice performed more severe mast cell degranulation, greater vascular permeability and more powerful allergic manifestation.
To determine whether the activation of Th1, Th2, and Treg cells underlies the observed allergic manifestations, levels of Th1, Th2, and Foxp3+ Treg cells in the spleen and MLN were detected. As shown in Figure 3, oral administration of OVA increased the proportion of effector Th2 cells in the spleen and MLN compared to saline treatment (p ≤0.05, Figures 3A, D). In contrast, the splenic and MLN levels of Th1 and Foxp3+ Treg cells in saline-treated hosts were significantly higher than those in OVA treated hosts (p ≤0.05, Figures 3A–C, E).
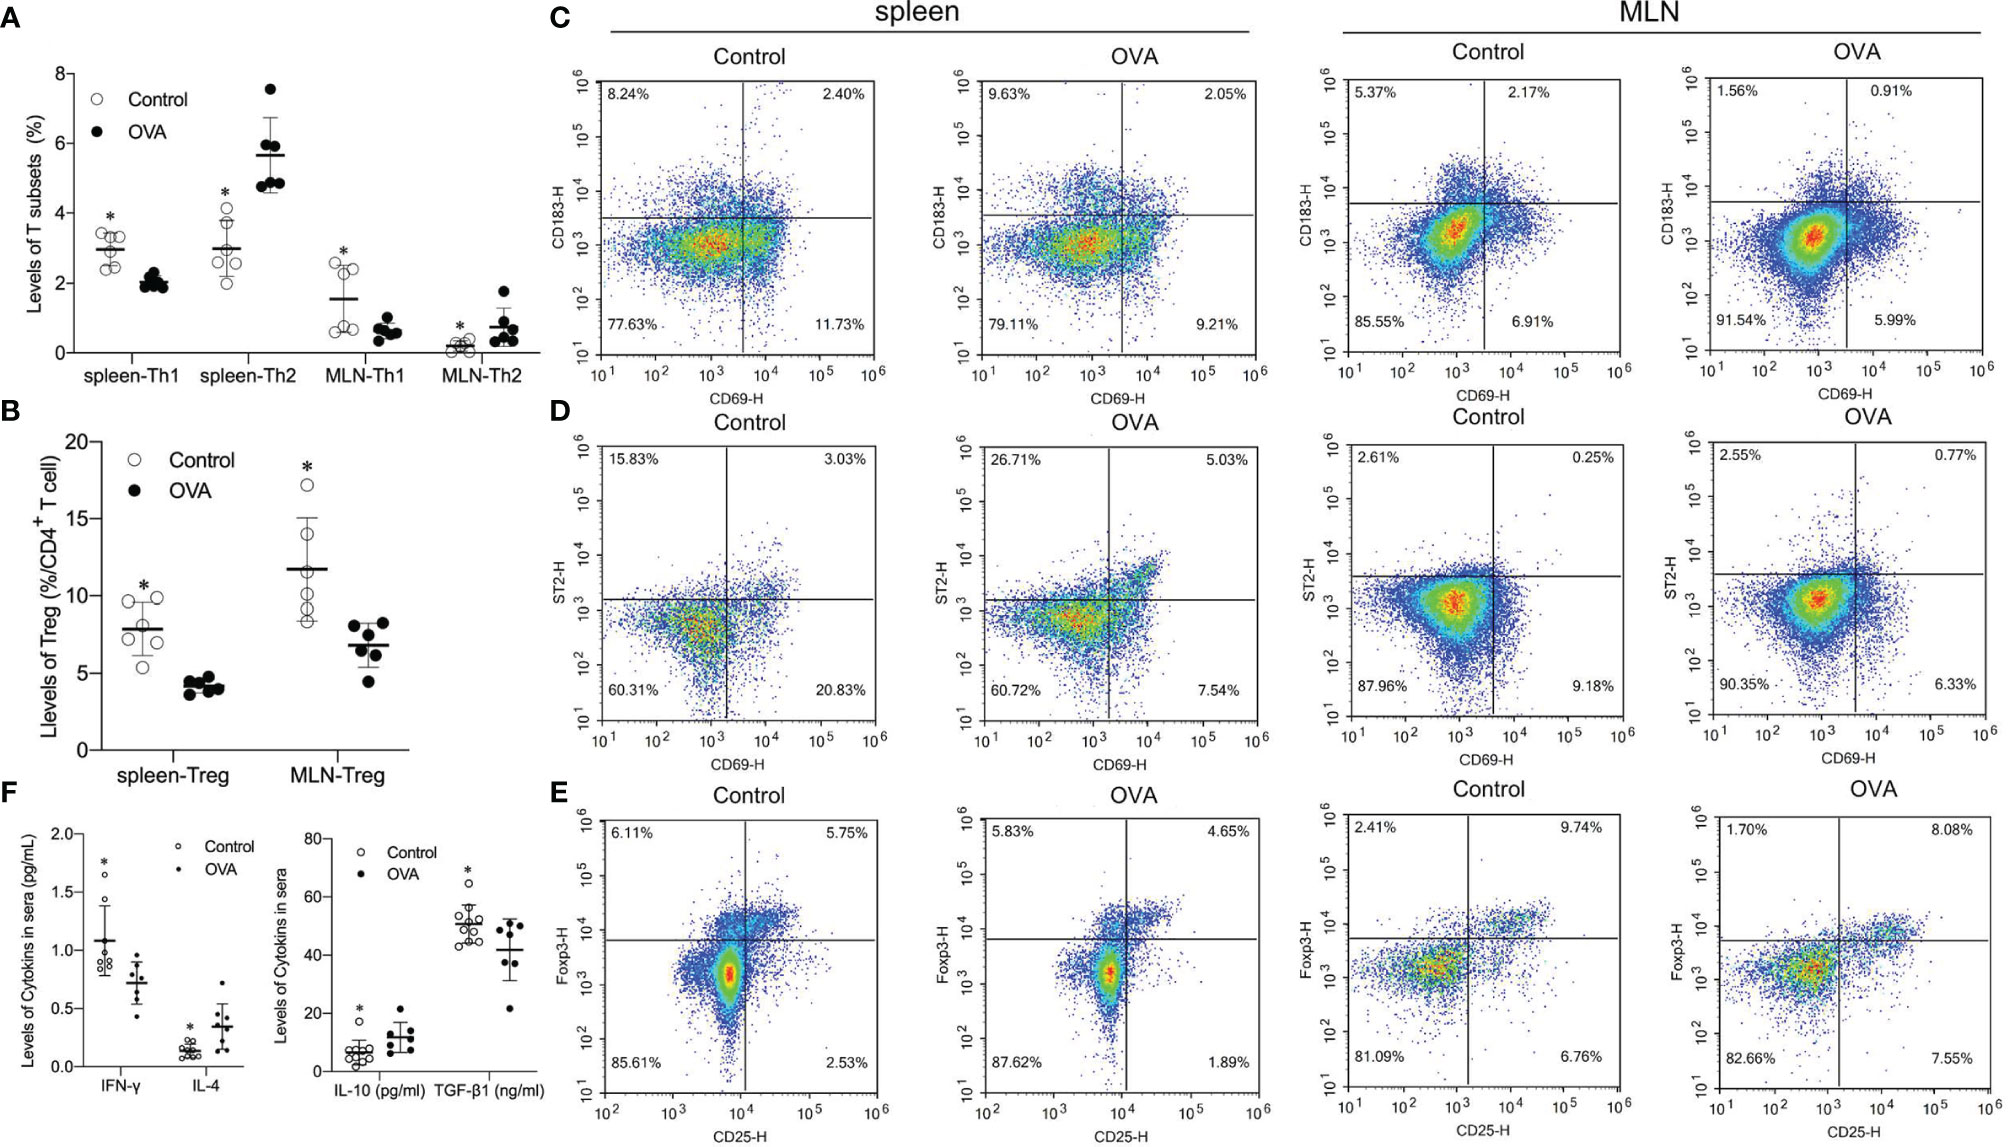
Figure 3 Splenic and MLN levels of Th1, Th2, Foxp3+ T regulatory (Treg) populations and concentrations of related cytokines in two groups. The bar in the graph denotes Mean and SD. n=6-12/group. *p ≤0.05 vs OVA-treated group; Statistical analyses were performed with two-tailed Student’s test. (A) Percentage of T subsets (Th1, Th2) in spleen and MLN. (B) Percentage of Treg in CD4+ T cell in spleen and MLN. (C–E) Representative images showing Th1, Th2 and Foxp3+ Treg levels in speen and MLN. (F) Level of cytokines (INF-γ, IL-4, IL-10 and TGF-β1) in sera of animals.
Different effector cells usually secrete different cytokines, which usually play different roles in the differentiation of cells. Thus concentrations of INF-γ, IL-4, IL-10, and TGF-β1 in the serum of mice were determined. Levels of INF-γ and TGF-β1, which are primarily related to differentiation and development of Th1 and Treg respectively, were significantly higher in the serum of Control mice than in OVA treated mice (p ≤0.05, Figure 3F). Levels of Th2 related cytokines IL-4 and IL-10 in sera collected from challenged OVA-treated mice were significantly higher than those from Control hosts (p ≤0.05, Figures 3F, G). These data suggested that the distinct allergic manifestations in OVA treated mice might be due to decreased levels of Th1 and Treg populations and increased proportions of Th2 subsets in the spleen and MLN.
During the development of food allergy, the activation of CD4+ T cells is usually affected by antigen present cells (APCs) (31). As an important APC, mature CD11+ DC in MLN plays a critical role in the activation and differentiation of Th1 and Th2 subsets through co-stimulation signal produced by CD80 or CD86 expressing on DCs (32). Furthermore, the levels of CD11+CD103+ DC, MHCII+CD80+ DC, MHCII+CD86+ DC, CD103+CD80+ DC, and CD103+CD86+ DC in the MLN and spleen of different treated mice were determined using flow cytometer. As shown in Figure 4, proportions of CD11+ DC in the MLN of saline-treated mice were significantly higher than those in OVA-treated mice (p ≤0.05, Figures 4A, B). In contrast, levels of MHCII+CD86+ DC and CD103+CD86+ DC were significantly lower in MLN of Control hosts than that in OVA treated hosts (p ≤0.05, Figures 4A, D, F). In addition, the levels of MHCII+CD80+ DC, and CD103+CD80+ DC did not show a remarkable difference between the two groups (p ≥0.05, Figures 4A, C, E). Although the levels of CD11C+ DC decreased in the MLN of allergic mice, proportions of MHCII+CD86+ DC and CD103+CD86+ DC, but not MHCII+CD80+ DC and CD103+CD80+ DC, increased during allergic reactions. In the spleen, most of the DC subsets did not show a noticeable difference between the two groups with the exception of CD11+CD103+ DC as shown in Figure S2.

Figure 4 Levels of CD11+CD103+ DC, MHCII+CD80+ DC, MHCII+CD86+ DC, CD103+CD80+ DC, and CD103+CD86+ DC populations in the MLN of different treated mice. The bars in dot plot (A) indicate the percentages of five DCs populations with Mean + SD (n=6/group). The graph (B–F) appeals to the flow cytometry density maps of five DCs subsets in MLN of mice. *p ≤0.05 vs OVA-treated group; Statistical analyses were performed with two-tailed Student’s test.
A total of 899552 usable sequence reads with a mean length of 416.73 ± 3.80 bp were obtained from 24 fecal samples, accounting for 79.28% of raw sequences according to demultiplexing and quality-filtering. Then, after subsampling each sample to an equal depth (21344 sequences per sample) and clustering, 694 operational taxonomic units (OTUs) at 97% identity were obtained, with OTUs ranging from 228 to 449 per sample. Coverage indices of all samples were more than 99%, indicating a sufficient sequencing depth in the two groups. The rarefaction analysis of species richness and Shannon indices based on OTUs level indicated that the data volume covered all species contained in fecal sample communities (Figure S3).
Analysis of alpha indices shown in Table 1 compared the richness, diversity, and evenness of intestinal microbiota community in the two groups. The Chao and Ace estimators were significantly lower in OVA-allergic mice than in Control mice (p ≤0.0005), indicating that the microbial abundance in the stool of OVA-allergic mice was considerably lower. In addition, the Shannon, Simpson, and Phylogenetic diversity showed that the alpha-diversity was significantly lower in OVA-allergic hosts than in Control hosts (p ≤0.005). Furthermore, the extremely significant lower value of the Shannoneven and Simpsoneven indices (p ≤0.0005) in OVA-allergic mice demonstrated the considerably lower community evenness in feces of allergic mice. These results suggested that the richness, diversity, and evenness of the intestinal microbial community were all down regulated by OVA oral administration in mice.
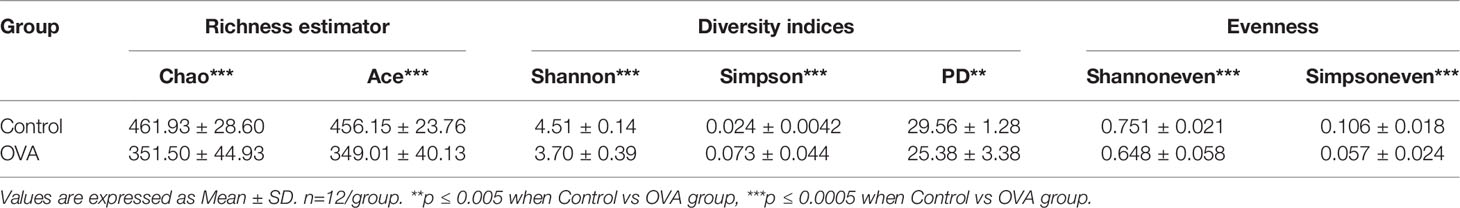
Table 1 Comparison of α-indices of gut microbiota species in two groups.
The average hierarchical clustering analysis of β-diversity was conducted through abund_jaccard distances calculation to indicate the similarities among the fecal samples. As shown in Figure 5A, the samples from different treated mice can be clearly clustered into separate groups, although each group can be further divided into subgroups. Principle component analysis (PCA) revealed that the OVA treatment caused significant structural changes of fecal microbiota in mice (R =0.4443, p =0.001), as shown in plots (Figure 5B), and the PC1 and PC2 explained the 17.11% and 11.67% of variance respectively. Similarly, the principal coordinate analysis (PCoA) plots as shown in Figures 5C, D indicated that 50.33%, 15.72%, and 3.65% of the variation could be explained by PC1, PC2, and PC3 respectively with noticeable significance (R =0.9081, p =0.001). Both PCA and PCoA plots demonstrated that most samples from Control hosts had negative PC1 value while most samples from allergic animals had positive value. These results suggested significant different fecal microbiota community structures between the two treated groups.
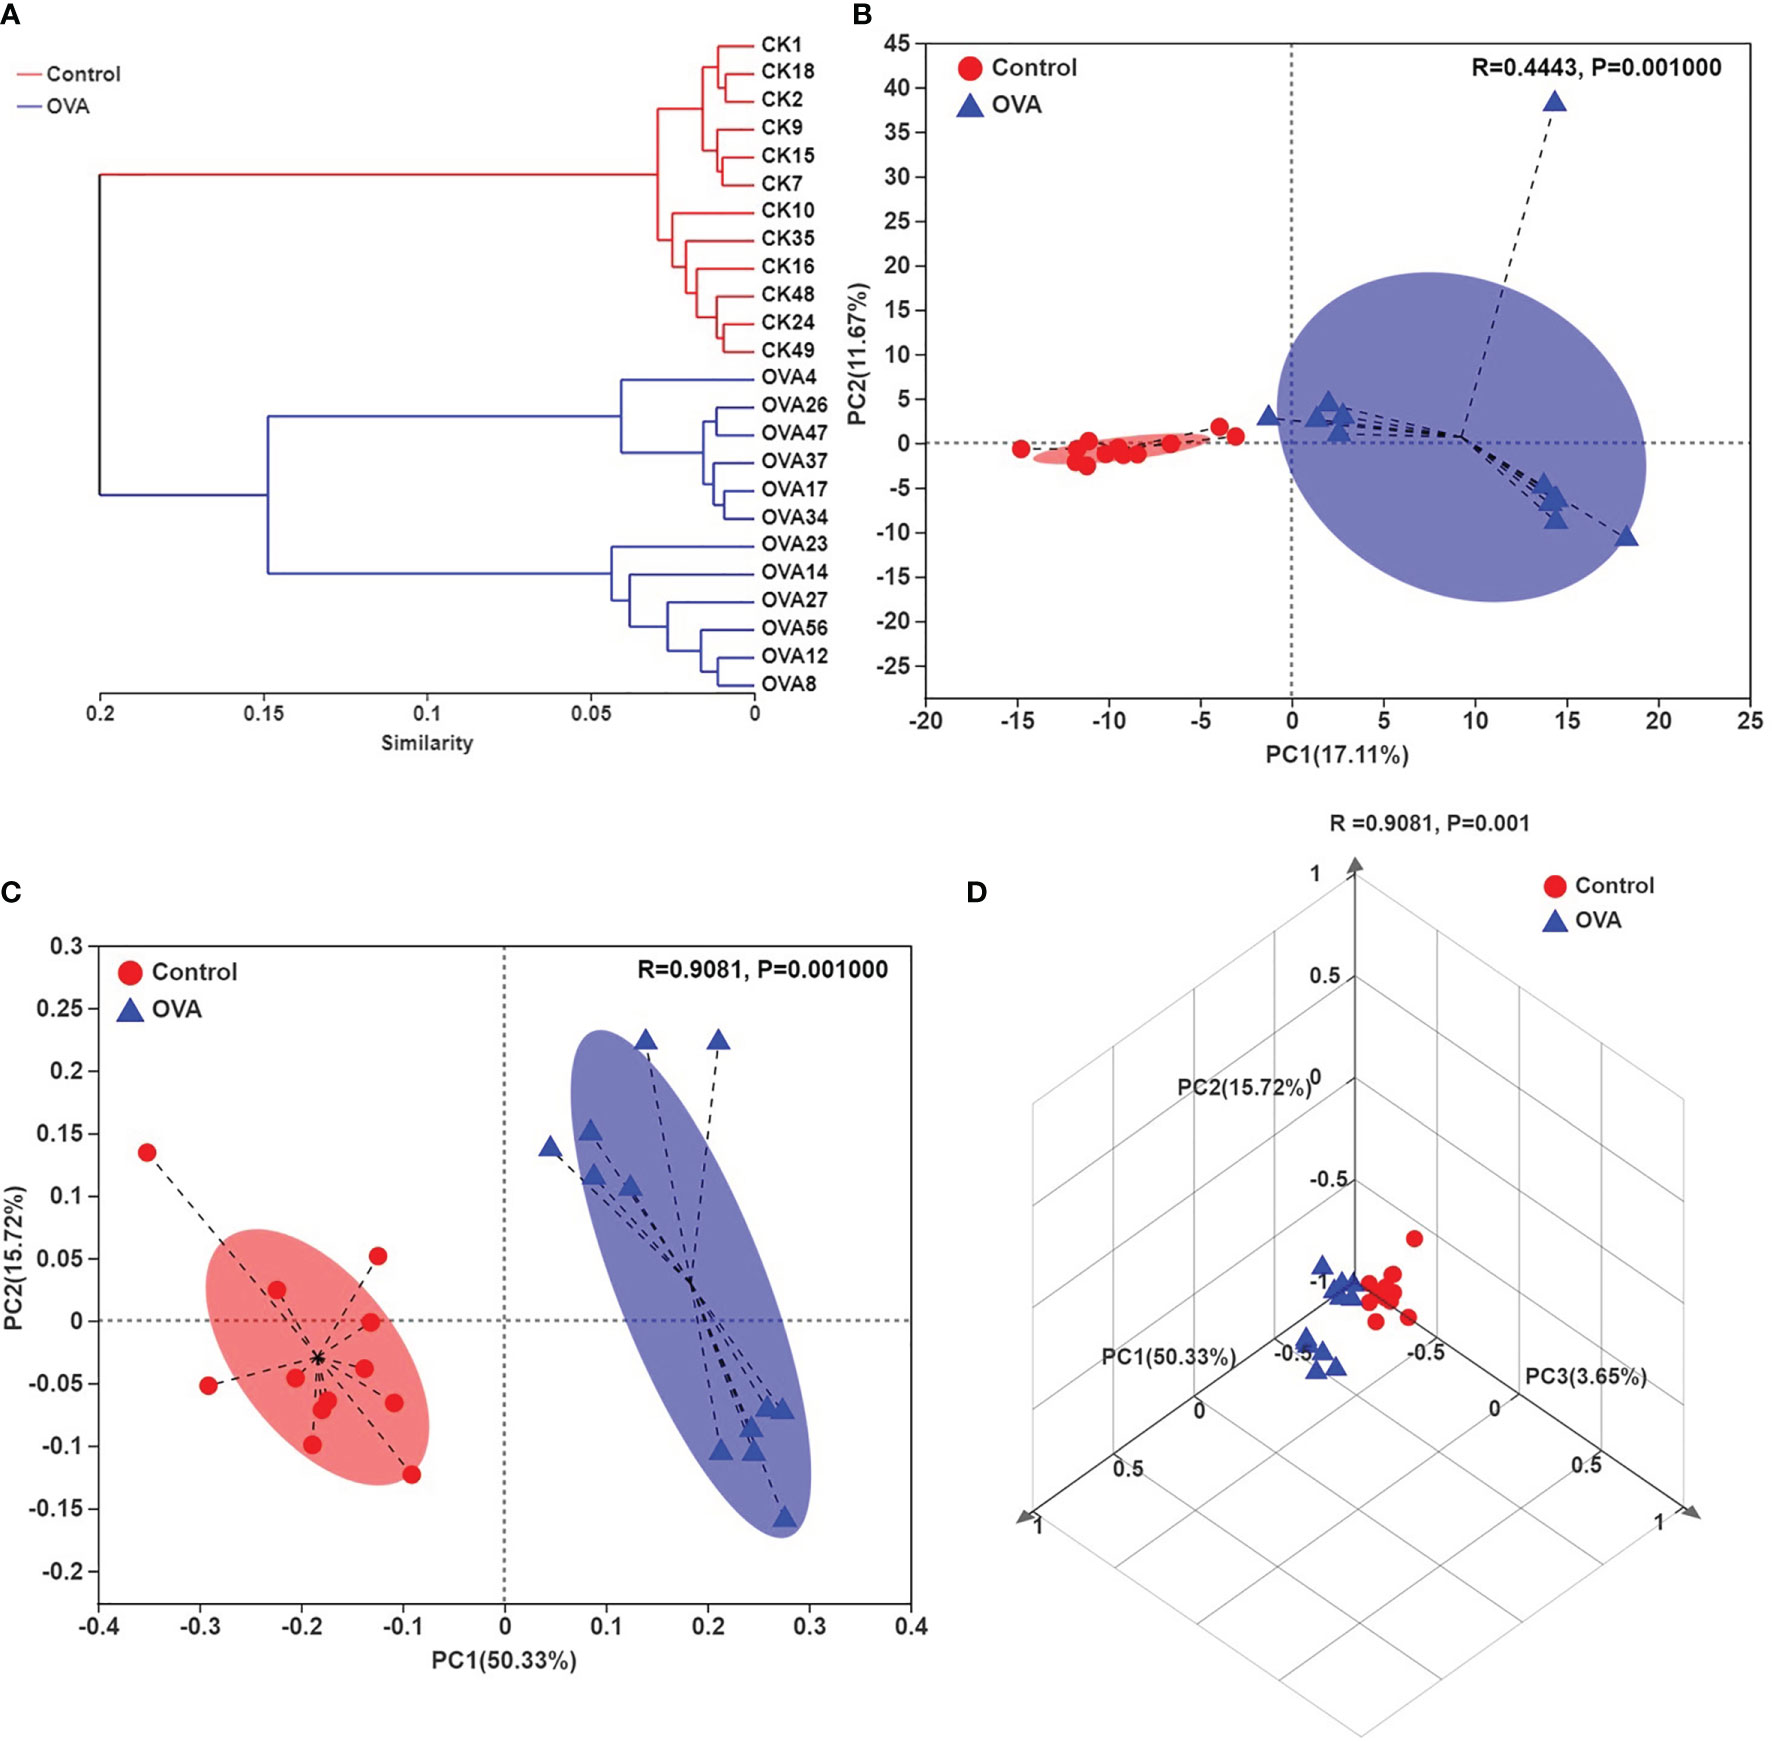
Figure 5 Hierarchical clustering tree on OUT level (A), Principle component analysis (PCA) plots (B), and principal coordinate analysis (PCoA) plots (C, D) on OUT level of all samples. (C, D) indicate the two- and three-dimensional PCoA plots.
Comparison of taxonomic composition in feces of different treated mice was conducted due to the distinguished difference in PCA and PCoA plots. The bar charts in Figure 6 showed the distribution of taxonomic composition in each sample from two groups at the phylum and genus levels. There were four major phyla, including Firmicutes, Bacteroidetes, Proteobacteria, and Actinobacteria in all of the samples, as shown in Figures 6A, B. Among all the genera, a total of 29 genera were dominant, accounting for more 0.5% in all of the fecal samples, as shown in Figures 6C, D.
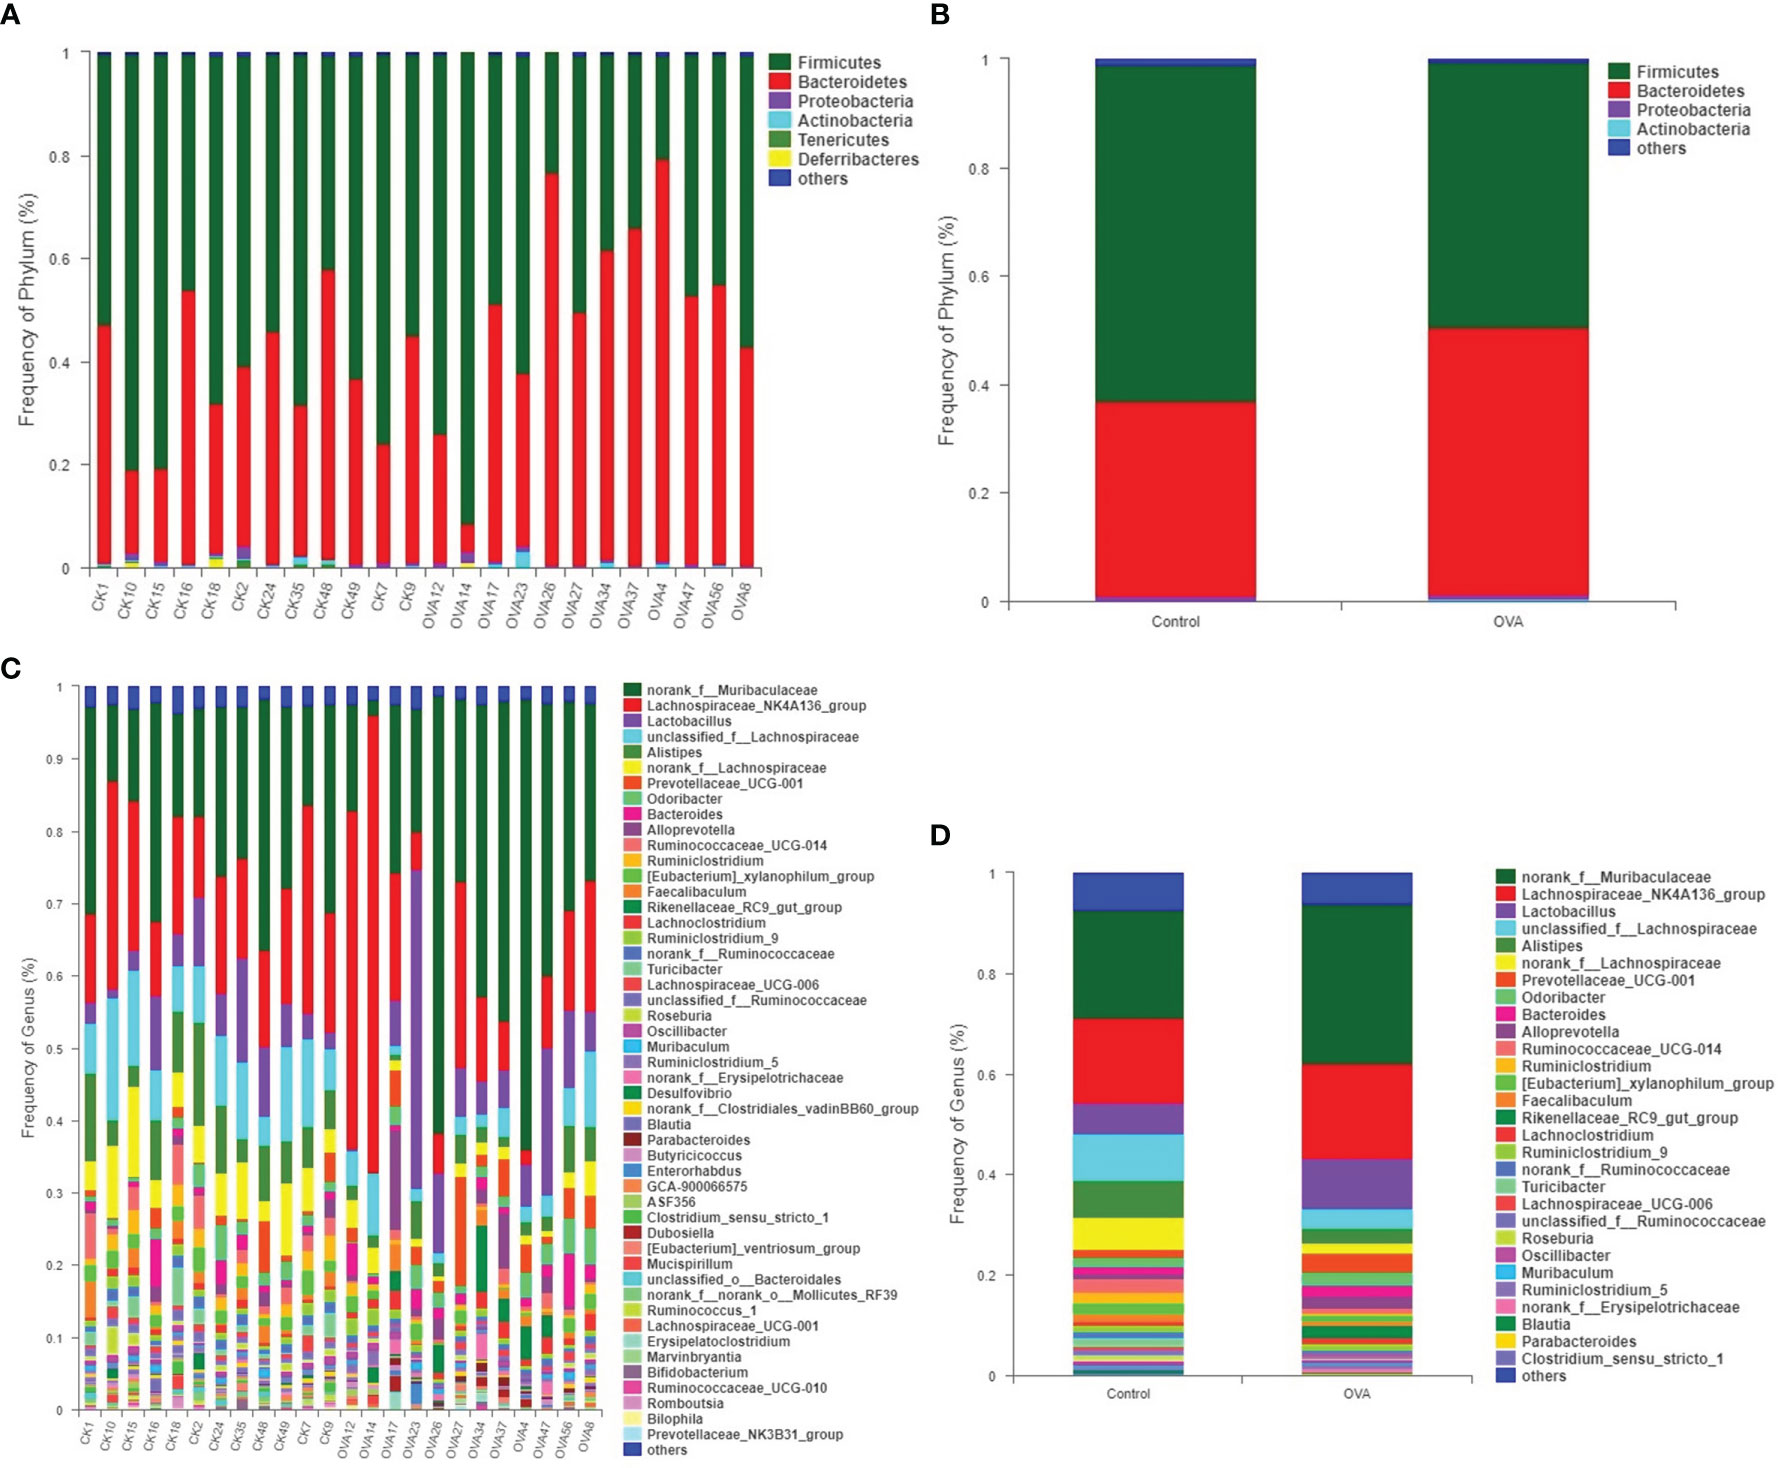
Figure 6 Distribution of fecal bacterial communities at the phyluam and genus levels for all mice. (A, B) show the phylum level; (C, D) show the genus level. (A, C) represent the intestinal flora composition of each sample, while (B, D) represent that of different groups.
To further analyze the change of microbiota community in the intestinal tract of allergic mice, the significant differences in the relative abundance of fecal bacteria at different taxonomic levels were identified and presented in Tables S1–S5. Compared with those of the Control group, the relative proportions of phyla, including Tenericutes, Deferribacteres, and Patescibacteria, were significantly decreased in allergic mice (p ≤0.05, Table S1). And although the percentages of Firmicutes and Bacteroidetes did not show a significant difference between the two groups, the ratio of Firmicutes/Bacteroidetes decreased remarkably in allergic mice as shown in Table S1 (p ≤0.05).
The different relative proportions of families and genera were presented in Tables S4, S5, and Figure 7. As shown in Figure 7, among the families with a relative abundance of more than 0.1%, 10 families were significantly different between mice in two groups. In comparison with the Control hosts, the relative abundances of Ruminococcaceae, Clostridiaceae_1, Deferribacteraceae, norank_o:Mollicutes_RF39, unclassified_o:Bacteroidales, Peptostreptococcaceae, and Saccharimonadaceae decreased significantly (p ≤0.05), while the proportions of Prevotellaceae, Tannerellaceae, and Burkholderiaceae increased significantly in the allergic hosts (p ≤0.05). At the genus level, 51 significantly different microbiota populations were identified between the two groups, as shown in Table S5. Among predominant genera accounting for more than 1% relative abundance in Control group, 9 genera, unclassified_f:Lachnospiraceae, Alistipes, norank_f:Lachnospiraceae, Ruminococcaceae_UCG-014, Ruminiclostridium, [Eubacterium]_xylanophilum_group, Turicibacter, norank_f:Ruminococcaceae, and Roseburia showed a significant decrease in allergic samples when compared with Control samples, while the other 2 genera of Prevotellaceae_UCG-001 and Rikenellaceae_RC9_gut_group showed an increase (p ≤0.05, Figure 7B). Changes in the relative abundance of the other 17 less predominant genera, which account for 0.1% to 1% of fecal microbiota of mice, were also shown in Figure 7C. The different minor bacterial families and genera (relative frequency less than 0.1%) were not displayed in Figure 7 due to the very low abundance levels of these bacteria which can’t explain biological significance strongly, and are presented in Tables S4 and S5.
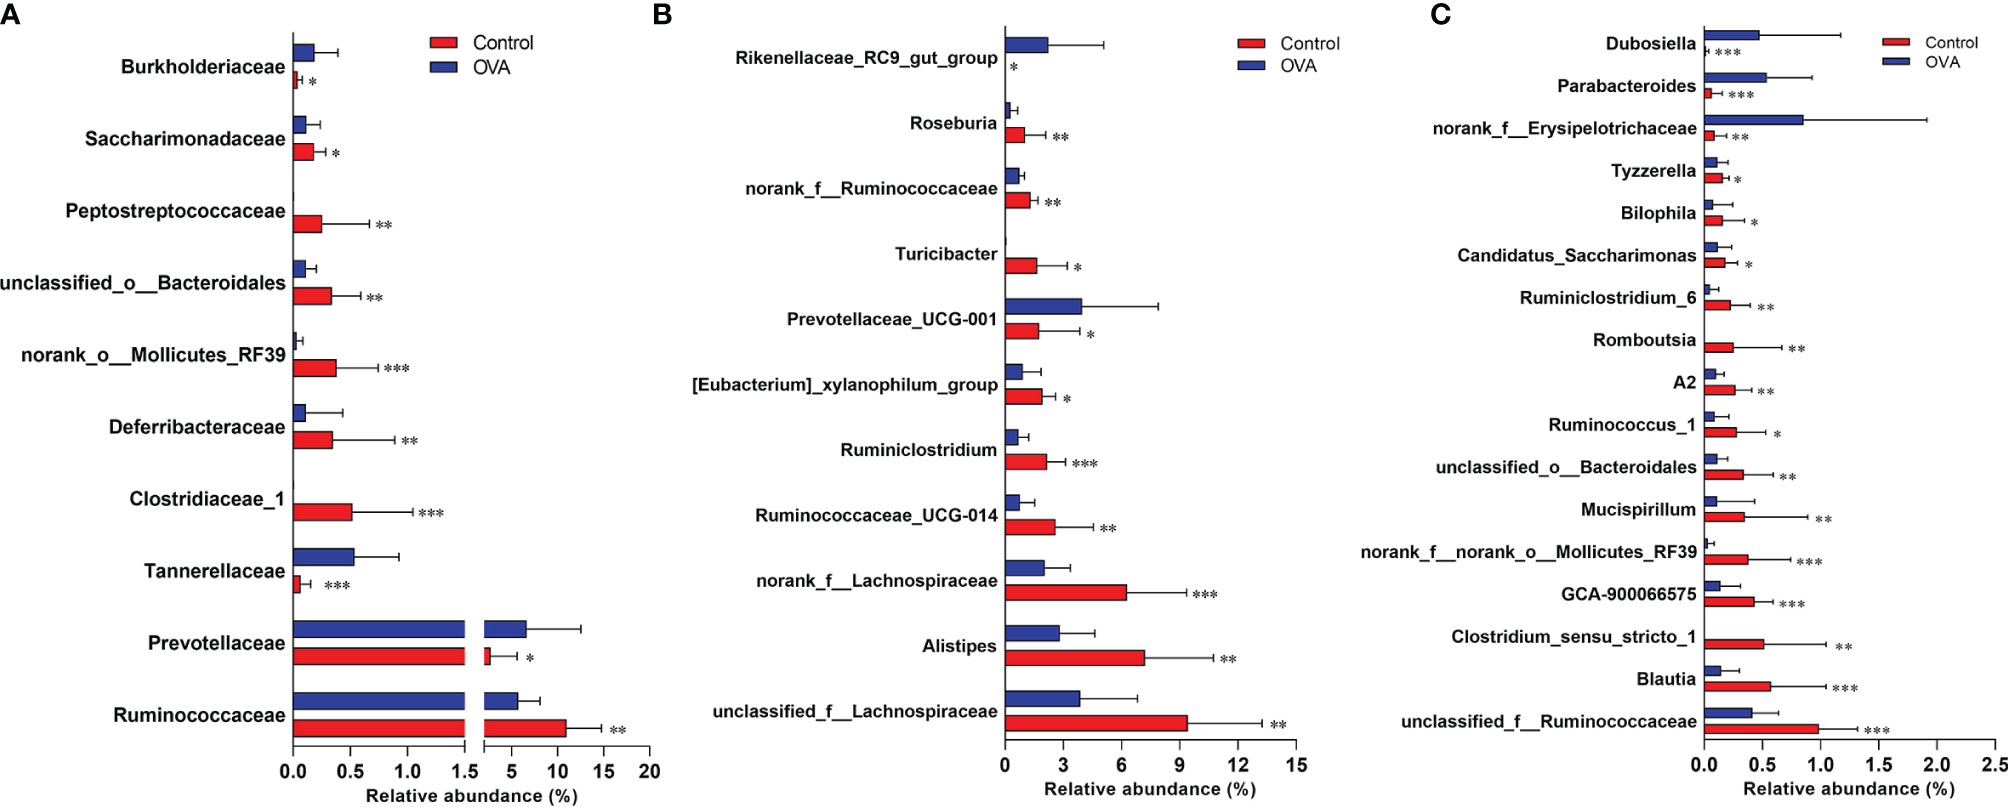
Figure 7 Comparisons of relative abundance of main bacterial populations at the family (A) and genus (B, C) levels. The bar charts indicate the percentages of bacteria with Mean + SD (n=12/group). *p ≤ 0.05; **p ≤ 0.01 and ***p ≤ 0.001 vs OVA-treated group; Statistical analyses were performed with Wilcoxon rank-sum test.
To investigate the relationship of altered gut microbiota structure and food allergy, a Spearman correlation coefficient analysis between the relative abundance of noticeably changed genera and the subgroups of DCs, T cells in MLN, allergy-related cytokines, and symptoms was conducted based on the identification of statistically different bacteria species between two groups.
Enriched species playing important roles in the differences between two groups were shown in cladograms, and LDA scores of three or more were confirmed by the LEfSe tool. According to Figures 8A, B, 18 genera of bacteria were significantly enriched in Control group (p ≤0.05). In OVA allergic group, six microbes on genus level were remarkably enriched, among which five genera were detected at a significant level (p ≤0.05) with the exception of Lachnoclostridium (p =0.053).
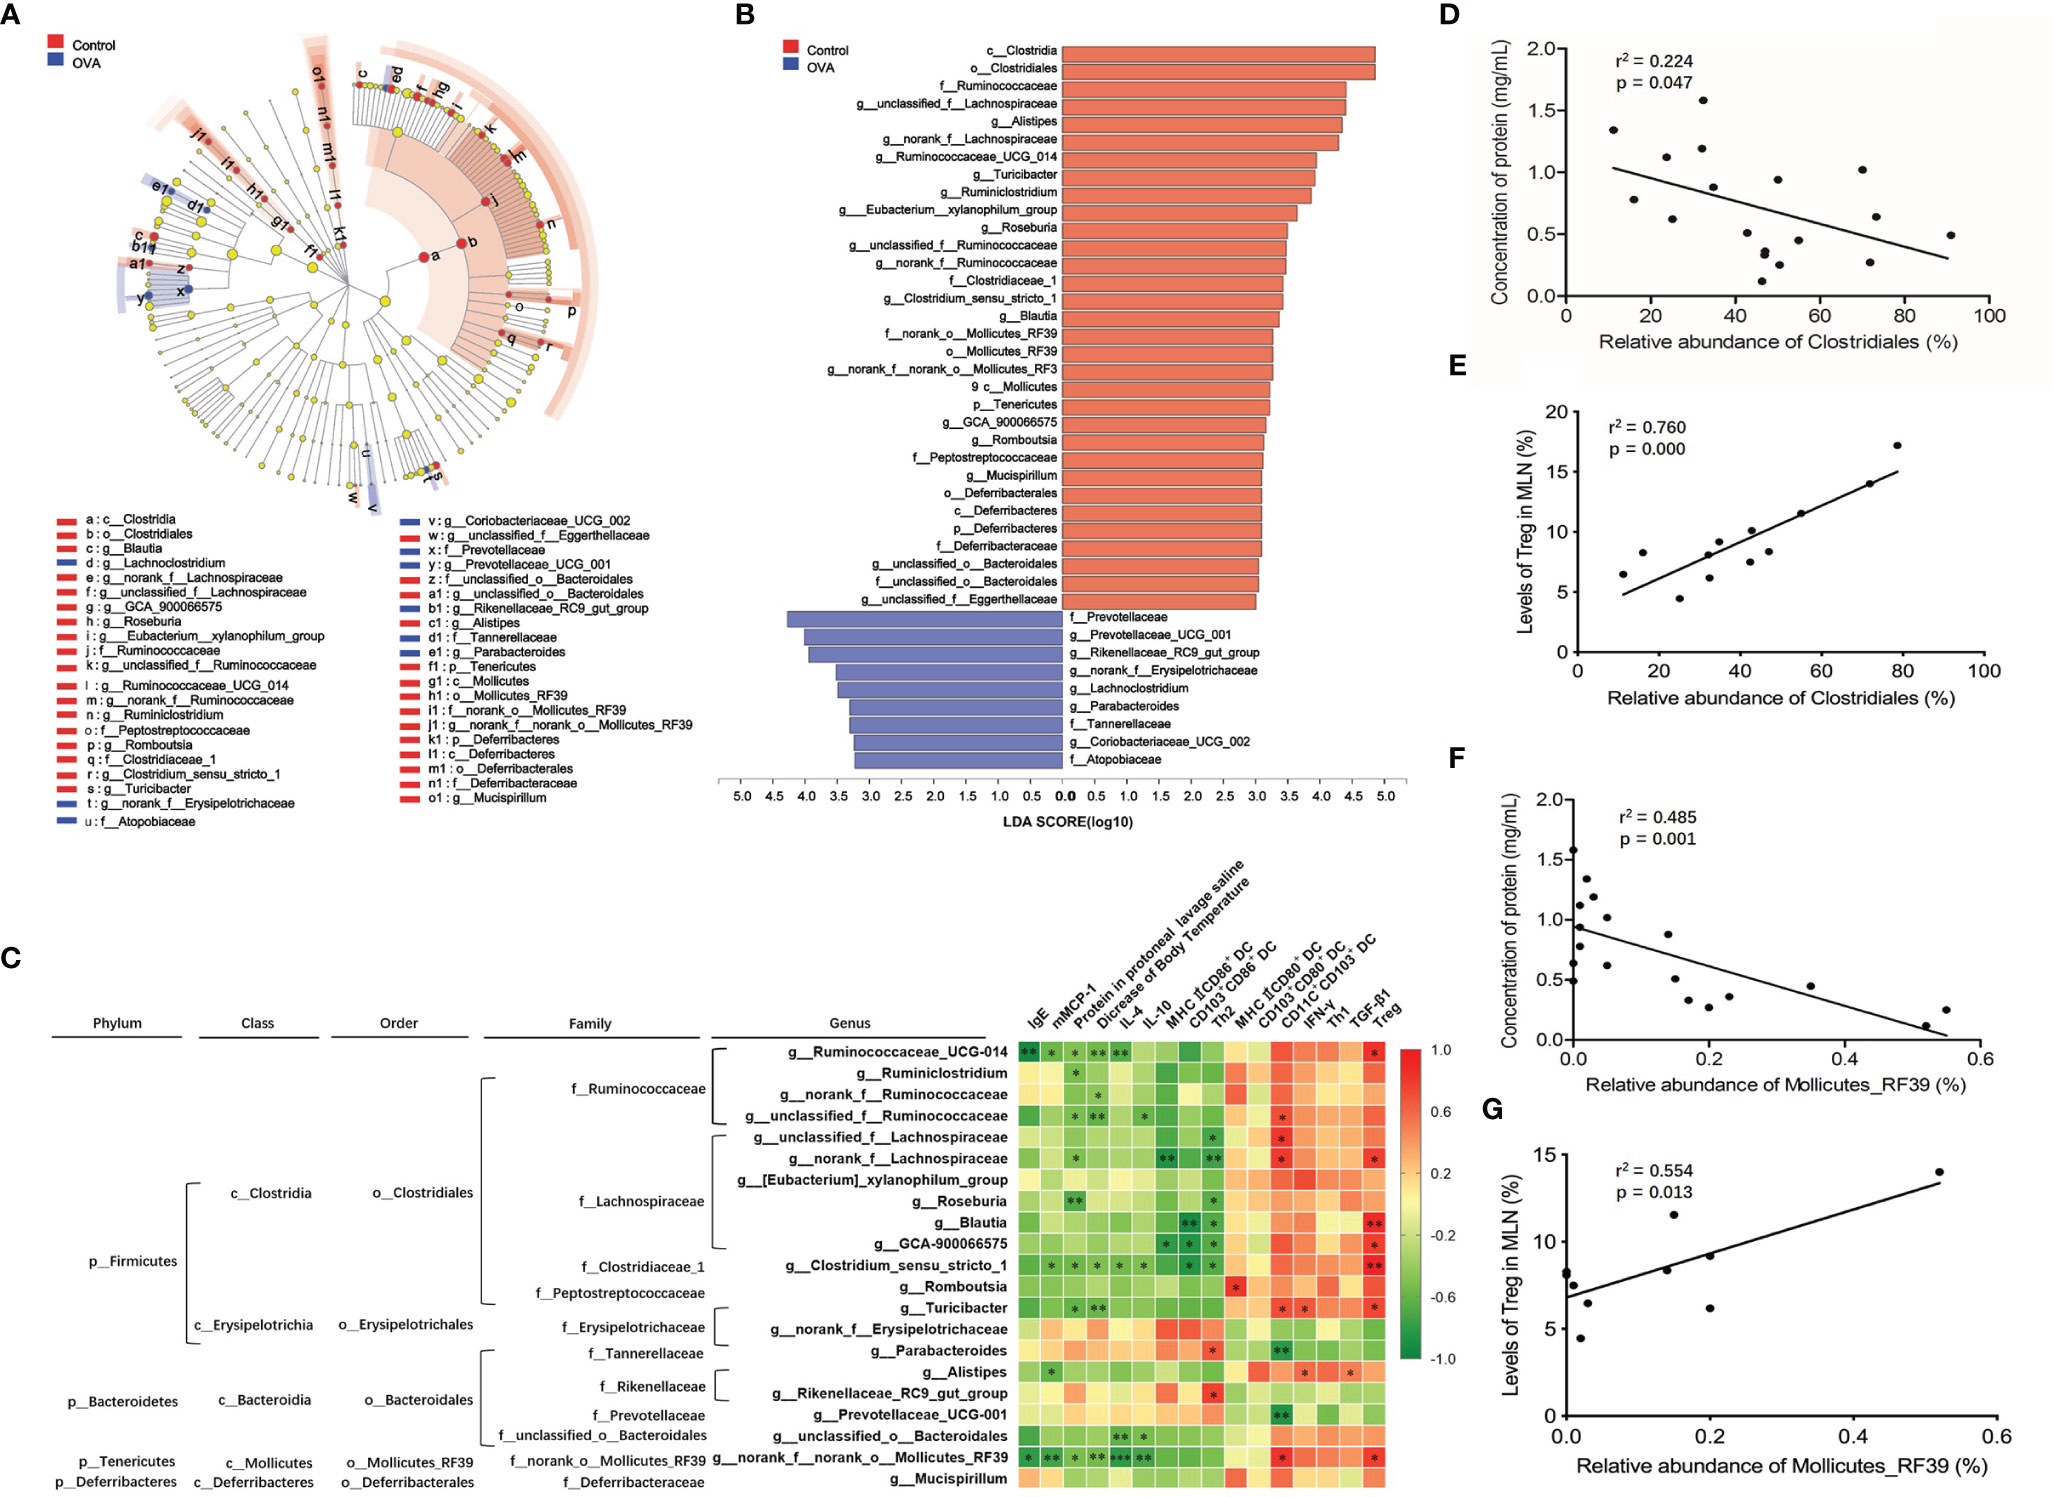
Figure 8 Identification of intestinal microbiota accounting for allergy and their correlation with allergic parameters in MLN. (A) Cladogram showing the phylogenetic distribution of the bacterial lineages associated with allergy from the two groups. Different-colored regions represent different constitutes. Circles indicate phylogenetic levels from phylum to genus. The diameter of each circle is proportional to the abundance of the group. (B) Indicator bacteria with LDA scores of 3 or greater in bacterial communities associated with allergy from two groups. (C) Heat map showing the Spearman correlation coefficient between identified significantly different species from phylum to genus level and the allergic indexes in MLN. (D, E) Spearman correlation of the order Clostridiales in intestinal microbiota with protein concentration in peritoneal lavage saline and Treg in MLN. (F, G) Spearman correlation of the order Mollicutes_RF39 in intestinal microbiota with protein concentration in peritoneal lavage saline and Treg in MLN. *, ** and *** refer to significant Spearman correlation (p ≤ 0.05, p ≤ 0.01, p ≤ 0.001).
Among all of the identified significantly changed 23 genera, unclassified_f:Eggerthellaceae and Coriobacteriaceae_UCG-002 accounted for less than 0.01% relative abundance. Therefore, the Spearman correlation coefficients of the remaining 21 genera and allergy-related parameters (IgE, mMCP-1, protein in the protoneal lavage saline, decrease in body temperature, IL-4, IL-10, IFN-γ, and TGF-β) of the cell subsets in MLN, referring to MHCII+CD86+ DC, CD103+CD86+ DC, Th2, MHCII+CD80+ DC, CD103+CD80+ DC, CD11C+CD103+ DC, Th1, and Treg, were analyzed, and the results were displayed in a heat map as shown in Figure 8C. Among all of the identified species, an abundance of genera Ruminococcaceae_UCG-014, Ruminiclostridium, norank_f_Ruminococcaceae, and unclassified_f_Ruminococcaceae, included in family Ruminococcaceae, were significantly positively correlated with Treg or CD11C+CD103+ DC in MLN and negatively correlated with protein in protoneal lavage saline and a decrease in body temperature, IgE, mMCP-1, IL-4, and IL-10 in serum. In family Lachnospiraceae, genera unclassified_f:Lachnospiraceae, norank_f_Lachnospiraceae, Roseburia, Blautia, and GCA-900066575 were negatively related to protein in protoneal lavage saline, MHCII+CD86+ DC, CD103+CD86+ DC, and Th2 levels in MLN and positively related to Treg levels in MLN. The genus Clostridium_sensu_stricto_1 belonging to family Clostridiaceae_1 performed similar spearman correlation, negatively relating to protein in protoneal lavage saline, a decrease in body temperature, mMCP-1, IL-4, and IL-10 in serum, CD103+CD86+ DC and Th2 in MLN, and positively relating to Treg level in MLN. The abundance of genus Romboutsia belonging to the family Peptostreptococcaceae was positively correlated with levels of MHCII+CD80+ DC in MLN. An abundance of genus Parabacteroides belonging to family Tannerellaceae and genus Rikenellaceae_RC9_gut_group belonging to family Rikenellaceae was noticeably positively correlated to a proportion of Th2 in MLN. The level of genus norank_f_norank_o_Mollicutes_RF39 in family norank_o_Mollicutes_RF39 was negatively related to levels of IgE, mMCP-1, IL-4, and IL-10 in sera, protein in protoneal lavage saline, and a decrease in body temperature, while it was positively related to CD11C+CD103+ DC and Treg levels in MLN.
Besides, Figure 8C also displayed species from phylum to order containing statistically changed genera that were identified in OVA treated mice. Most of the genera positively relating to levels of Treg or MHCII+CD80+ DC or CD11C+CD103+ DC, while showing a negative correlation to Th2, Th2-related cytokines, MHCII+CD86+ DC, and CD103+CD86+ DC in MLN, belonged to orders Clostridiales and Mollicutes_RF39, classes Clostridia and Mollicutes, and phylum Firmicutes and Tenericutes. On the other hand, genera positively relating to Th2 subsets in MLN were included in order Bacteroidales, class Bacteroidia, and phylum Bacteroidetes. These results demonstrated that the gut microbiota community, especially families Ruminococcaceae, Lachnospiraceae, Clostridiaceae_1, and norank_o_Mollicutes_RF39 play a critical role during the inhibition of food allergy, while the species belonging to families Rikenellaceae and Tannerellaceae prompted the development of food allergy. Furthermore, we also identified that orders of Clostridiales and Mollicutes_RF39 were negatively related to protein concentration in protoneal lavage saline (r2 = 0.224, p =0.047; r2 = 0.485, p =0.001) and positively related to Treg in MLN (r2 = 0.760, p =0.0002; r2 = 0.554, p =0.0135) of mice, as shown in Figures 8D–G.
Although allergic responses between human and mice are substantially different (33, 34), mice models are commonly used to investigate the mechanism of allergic reactions (35, 36). The C3H/HeJ mice are a typical strain used in food allergy for their high susceptibility and remarkable hypersensitization reactions to food allergen (37, 38).
In this study, C3H/HeJ mice showed extensive reactions, such as increased IgE, IgG1, and mMCP-1, and Th2-associated cytokine levels, decreased Treg populations in immune tissues, as well as decreased body temperature after OVA treatment without adjuvant. In previous researches, similarly, the C3H/HeJ strain mice also displayed obvious humoral immune reactions, cellular immune responses, and systemic allergy symptoms to ovomucoid (OM) (39), peanut (40–42), and fish allergens (43) by oral administration combined with cholera toxin (CT). The route and mechanism of CT influencing the intestine might be the same as those by which some bacteria act on the intestinal barrier, although the CT is not involved in the pathogenesis of food allergy itself (44, 45). In addition to demonstrating that C3H/HeJ mice were sensitized successfully, it is worth noting that the mice herein also showed an altered intestinal microbiota after oral administration of OVA without using any adjuvant, suggesting that the OVA allergy might lead to changed intestinal flora. The disturbed intestinal flora described in previous researches, in turn, is considered one reason for food allergy since the use of CT corresponded to changes in intestinal microbiota (20, 46). Therefore, these studies suggest that gut flora and food allergy probably interact with each other rather than flora dysbiosis causing food allergy.
As the most potent antigen-presenting cells, the DCs, especially the CD11C+CD103+ DCs has been found to play a crucial role in the activation or regulation of T cells through inducing Foxp3+ Treg cells in the spleen and MLN (44, 47). According to the research of Fu et al., the maturation of CD11C+CD103+ DC induced regulatory T cells differentiation for the suppression of Th2-biased response (39). Thus, besides investigating the allergy-associated response, levels of CD11C+CD103+ DC as well as DC expressing mutation markers, including CD80, CD86, and MHCII in MLN, were also determined using flow cytometer in the current study. The decreased levels of CD11C+CD103+ DC and Tregs in the allergic group were consistent with those found in other studies (48), indicating that the CD11C+CD103+ DC may drive the differentiation of Tregs. Populations of CD103+CD86+ DC and MHCII+CD86+ DC increased in OVA allergic mice, while those of CD103+CD80+ DC and MHCII+CD80+ DC did not display a significant difference between the two groups. These results suggested an important role of CD86 expressing on DC in inducing food allergy. The study conducted by other researchers also reported similar results, showing that CD86 is an important factor in the induction of peanut allergy and the interaction between CD80 expression on DCs and CTLA-4 expression on T cells are both crucial for the induction of tolerance (49).
It is certain that the growing evidence points to an important role of the commensal microbiota in food allergy (24). We conducted a comparative structural analysis of intestinal microbiota from control and OVA-allergic mice. The major intestinal microbial community is composed of Firmicutes, Bacteroidetes, Proteobacteria, and Actinobacteria, which is consistent with the reported results of studies in mice (50) and human (51). The proportion of Deferribacteres was decreased in OVA-allergic mice compared with control hosts, which were dominated by Deferribacteraceae, which had decreased in OVA-treated mice. A previous report indicated that the level of Deferribacteres increased after oral treatment of beneficial probiotics in OVA-induced allergic mice (52). Deferribacteres in intestinal flora plays a role in the iron metabolism and iron balance of the gastrointestinal tract (53). It was inferred that food allergy is related to iron metabolism in the intestine. The richness of phylum Tenericutes also declined in allergic mice due to the decrease of bacterial family norank_o_Mollicutes_RF39. This is consistent with the result reported by Ogita T et al. (54), indicating an increased level of Tenericutes in combination with the reduction in the OVA allergic response. Studies have found that the phylum Tenericutes can digest fibers in the intestinal tract (55) and is conducive to maintaining the integrity of intestinal mucosa (56). So this result suggested that Tenericutes may associate with the protection of intestinal mucosa. Besides, similar to the results revealed in human research (57), the ratio of Firmicutes/Bacteroidetes also decreased in allergic mice, and this was attributed to the decreased proportion of Firmicutes and elevated richness of Bacteroidetes in OVA allergic hosts. However, there were also studies obtaining conflicting results with present research. Liu et al. reported increased richness of phylum Deferribacteres and ratio of Firmicutes/Bacteroidetes in mice with food allergy (50). We speculate this difference may be due to their use of adjuvants in OVA sensitization.
On the family level, we observed more than 10 altered intestinal flora in allergic animals. Belonging to Clostridiales, genera of Ruminococcaceae, unclassified_o:Clostridiales, and Clostridiaceae_1 displayed a remarkable decrease in OVA allergic mice, and this is similar to previous research in human and mice (58–60). As a dominant bacterial community, Ruminococcaceae can decompose dietary fiber to produce short-chain fatty acids (SCFA) in the intestinal tract of mammals to protect intestinal mucosa (24, 61, 62). Studies indicated that Clostridiales plays an important role in intestinal homeostasis and in promoting Treg cell proliferation in intestinal immune tissues (63, 64). Thus, we infer that OVA sensitization downregulated the richness of order Clostridiales and destroyed its protection on intestinal mucosa while reduced the proliferation of Treg cells. Belonging to Bacteroidetes, the family Tannerellaceae showed an increased richness in allergic mice. This was consistent with results from a study in patients with Cohn’s disease (65) while its exact mechanism of influence on food allergy is unclear and needs to be investigated.
In recent years, it has been indicated that intestinal microbiota plays important role in immune homeostasis and the prevention of FA (22, 46, 64). The bacteriotherapy of FA has thus become a concern for many researchers. Esber and colleagues demonstrated the potentially beneficial role of three probiotic strains in cow’s milk allergy with regard to tolerance acquisition (66). Microbes from the Clostridia class and two other commensal species were enriched in healthy twins without FA (67). Abdel-Gadir and colleagues found that therapy with commensals including Clostridiales species suppressed FA in mice by inducing Treg cells expressing the transcription factor ROR-γt in a MyD88-dependent manner (68). In the present study, we confirmed the different crucial bacteria species between two groups using the LEfSe tool, on the basis of which the correlation of identified intestinal microbiota with levels of DC and T sub-populations in MLN were then analyzed. Most of the genera that were positively correlated with Treg and CD103+CD80+ DC (although without significance) belonged to Mollicutes_RF39 and Clostridiales, which has been proved beneficial to intestinal immune balance through inducing Treg proliferation (64), protecting intestinal barrier function (69) and producing SCFA (5). In addition to previous research, considering the essential role played by intestinal DC subsets in the inhibition or prevention of food allergy (44) and the significant correlation with Mollicutes_RF39 and Clostridiales, we may infer that OVA sensitization decreased the intestinal richness of Mollicutes_RF39 and Clostridiales, which may induce Treg proliferation through CD103+CD80+ DC subsets in MLN. So Mollicutes_RF39 and Clostridiales may be candidates in bacteriotherapy for FA in the future. This study may provide a reference for treating or preventing food allergy effectively by probiotic therapy. However, there are several limitations to this study. Firstly, although all of the mice were purchased from the same laboratory at the same time, the microbiota composites analysis should be conducted before OVA sensitization in order to demonstrate that the microbiota composites were altered by OVA treatment. Secondly, although OVA-specific Tregs has been demonstrated to suppress allergic reaction in previous research (70), they should be separated and used to treat OVA-sensitized mice to explore the exact mechanisms of OVA-induced food allergy without adjuvants in the present study.
In conclusion, sensitization of C3H/HeJ mice using OVA without any adjuvant can induce remarkable allergic responses and noteworthy alteration of intestinal microbiota, demonstrating that allergen sensitization might cause disturbance of intestinal flora, which further confirms the relationship between food allergens, intestinal flora, and genetic susceptibility in the establishment of food allergy. This study also assessed the correlation between DC subsets, T subpopulation in MLN, and altered intestinal bacteria, which supplies novel possible evidence about the mechanism of Mollicutes_RF39 and Clostridiales in promoting Treg proliferation. However, further studies using fecal microbiota transplantation (FMT) are needed to uncover the exact mechanism to provide persuasive evidence for the employment of Mollicutes_RF39 and Clostridiales as anti-allergy probiotics.
The datasets presented in this study can be found in online repositories. The names of the repository/repositories and accession number(s) can be found below: https://www.ncbi.nlm.nih.gov/, PRJNA658922.
The animal study was reviewed and approved by Experimental Animal Ethics Committee of the Capital Medical University.
CZ, W-WM, and RX conceived and designed the study. CZ carried out major experiments and collected data. CZ, L-LC, and R-QL performed the statistical analyses. CZ wrote the manuscript. W-WM and RX supervised the study. All authors contributed to the article and approved the submitted version.
This work was supported by the Scientific Research Common Program of the Beijing Municipal Commission of Education (KM202010025002) and The National Natural Science Foundation of China (81502810).
The authors declare that the research was conducted in the absence of any commercial or financial relationships that could be construed as a potential conflict of interest.
In this research, the 16S rRNA sequencing data were analyzed on the free online platform of Majorbio Cloud Platform (www.majorbio.com).
The Supplementary Material for this article can be found online at: https://www.frontiersin.org/articles/10.3389/fimmu.2021.631494/full#supplementary-material
Supplementary Figure 1 | Anaphylaxis score of animals in two groups. N=12.
Supplementary Figure 2 | Levels of CD11+CD103+ DC, MHCII+CD80+ DC, MHCII+CD86+ DC, CD103+CD80+ DC and CD103+CD86+ DC populations in the spleen of different treated mice. The bars in dot plot (A) indicate the percentages of five DCs populations with Mean + SD (n=6/group). The graph (B–F) appeal the representative flow cytometry density images of five DCs subsets in spleen of mice. *, p ≤0.05 vs OVA-treated group; Statistical analyses were performed with two-tailed Student’s test.
Supplementary Figure 3 | The Shannon indices based on OTUs level (A) and rarefaction analysis (B) of sequences in fecal samples.
1. Orsini Delgado ML, Rizzo GP, Fossati CA, Pasquevich KA, Cassataro J, Smaldini PL, et al. Sublingual Omp16-Driven Redirection of the Allergic Intestinal Response in a Pre-Clinical Model of Food Allergy. Clin Exp Allergy (2020) 50(8):954–63. doi: 10.1111/cea.13676
2. Gupta RS, Warren CM, Smith BM, Blumenstock JA, Jiang J, Davis MM, et al. The Public Health Impact of Parent-Reported Childhood Food Allergies in the United States. Pediatrics (2018) 142(6):e20181235. doi: 10.1542/peds.2018-1235
3. Gupta RS, Warren CM, Smith BM, Jiang J, Blumenstock JA, Davis MM, et al. Prevalence and Severity of Food Allergies Among Us Adults. JAMA Netw Open (2019) 2(1):e185630. doi: 10.1001/jamanetworkopen.2018.5630
4. Dai H, Wang F, Wang L, Wan J, Xiang Q, Zhang H, et al. An Epidemiological Investigation of Food Allergy Among Children Aged 3 to 6 in an Urban Area of Wenzhou, China. BMC Pediatr (2020) 20(1):220. doi: 10.1186/s12887-020-02115-8
5. Tan J, McKenzie C, Vuillermin PJ, Goverse G, Vinuesa CG, Mebius RE, et al. Dietary Fiber and Bacterial Scfa Enhance Oral Tolerance and Protect Against Food Allergy Through Diverse Cellular Pathways. Cell Rep (2016) 15(12):2809–24. doi: 10.1016/j.celrep.2016.05.047
6. Chambers SJ, Bertelli E, Winterbone MS, Regoli M, Man AL, Nicoletti C. Adoptive Transfer of Dendritic Cells From Allergic Mice Induces Specific Immunoglobulin E Antibody in Naïve Recipients in Absence of Antigen Challenge Without Altering the T Helper 1/T Helper 2 Balance. Immunology (2004) 112(1):72–9. doi: 10.1111/j.1365-2567.2004.01846.x
7. Liu EG, Yin X, Swaminathan A, Eisenbarth SC. Antigen-Presenting Cells in Food Tolerance and Allergy. Front Immunol (2021) 11:616020. doi: 10.3389/fimmu.2020.616020
8. Satitsuksanoa P, Jansen K, Głobińska A, van de Veen W, Akdis M. Regulatory Immune Mechanisms in Tolerance to Food Allergy. Front Immunol (2018) 9:2939. doi: 10.3389/fimmu.2018.02939
9. Bertolini TB, Biswas M, Terhorst C, Daniell H, Herzog RW, Piñeros AR. Role of Orally Induced Regulatory T Cells in Immunotherapy and Tolerance. Cell Immunol (2021) 359:104251. doi: 10.1016/j.cellimm.2020.104251
10. Carter CA, Frischmeyer-Guerrerio PA. The Genetics of Food Allergy. Curr Allergy Asthma Rep (2018) 18(1):2. doi: 10.1007/s11882-018-0756-z
11. Feehley T, Stefka AT, Cao S, Nagler CR. Microbial Regulation of Allergic Responses to Food. Semin Immunopathol (2012) 34(5):671–88. doi: 10.1007/s00281-012-0337-5
12. Hong X, Tsai HJ, Wang X. Genetics of Food Allergy. Curr Opin Pediatr (2009) 21(6):770–6. doi: 10.1097/MOP.0b013e32833252dc
13. Vercelli D. Genetic Polymorphism in Allergy and Asthma. Curr Opin Immunol (2003) 15(6):609–13. doi: 10.1016/j.coi.2003.09.005
14. Vercelli D. Advances in Asthma and Allergy Genetics in 2007. J Allergy Clin Immunol (2008) 122(2):267–71. doi: 10.1016/j.jaci.2008.06.008
15. Vercelli D. Genetics, Epigenetics, and the Environment: Switching, Buffering, Releasing. J Allergy Clin Immunol (2004) 113(3):381–7. doi: 10.1016/j.jaci.2004.01.752
16. Honda K, Littman DR. The Microbiota in Adaptive Immune Homeostasis and Disease. Nature (2016) 535(7610):75–84. doi: 10.1038/nature18848
17. Sicherer SH. Epidemiology of Food Allergy. J Allergy Clin Immunol (2011) 127(3):594–602. doi: 10.1016/j.jaci.2010.11.044
18. Round JL, Mazmanian SK. The Gut Microbiota Shapes Intestinal Immune Responses During Health and Disease. Nat Rev Immunol (2009) 9(5):313–23. doi: 10.1038/nri2515
19. von Mutius E, Vercelli D. Farm Living: Effects on Childhood Asthma and Allergy. Nat Rev Immunol (2010) 10(12):861–8. doi: 10.1038/nri2871
20. Rodriguez B, Prioult G, Bibiloni R, Nicolis I, Mercenier A, Butel MJ, et al. Germ-Free Status and Altered Caecal Subdominant Microbiota Are Associated With a High Susceptibility to Cow’s Milk Allergy in Mice. FEMS Microbiol Ecol (2011) 76(1):133–44. doi: 10.1111/j.1574-6941.2010.01035.x
21. Cahenzli J, Köller Y, Wyss M, Geuking MB, McCoy KD. Intestinal Microbial Diversity During Early-Life Colonization Shapes Long-Term IgE Levels. Cell Host Microbe (2013) 14(5):559–70. doi: 10.1016/j.chom.2013.10.004
22. Noval Rivas M, Burton OT, Wise P, Zhang YQ, Hobson SA, Garcia Lloret M, et al. A Microbiota Signature Associated With Experimental Food Allergy Promotes Allergic Sensitization and Anaphylaxis. J Allergy Clin Immunol (2013) 131(1):201–12. doi: 10.1016/j.jaci.2012.10.026
23. Diesner SC, Bergmayr C, Pfitzner B, Assmann V, Krishnamurthy D, Starkl P, et al. A Distinct Microbiota Composition Is Associated With Protection From Food Allergy in an Oral Mouse Immunization Model. Clin Immunol (2016) 173:10–8. doi: 10.1016/j.clim.2016.10.009
24. Bunyavanich S, Berin MC. Food Allergy and the Microbiome: Current Understandings and Future Directions. J Allergy Clin Immunol (2019) 144(6):1468–77. doi: 10.1016/j.jaci.2019.10.019
25. Zhou C, Ludmila T, Sun N, Wang C, Pu Q, Huang K, et al. BALB/C Mice can be Used to Evaluate Allergenicity of Different Food Protein Extracts. Food Agric Immunol (2016) 27(5):589–603. doi: 10.1080/09540105.2015.1129600
26. van Esch BC, Schouten B, de Kivit S, Hofman GA, Knippels LM, Willemsen LE, et al. Oral Tolerance Induction by Partially Hydrolyzed Whey Protein in Mice Is Associated With Enhanced Numbers of Foxp3+ Regulatory T-Cells in the Mesenteric Lymph Nodes. Pediatr Allergy Immunol (2011) 22(8):820–6. doi: 10.1111/j.1399-3038.2011.01205.x
27. Liu F, Wang X, Shi H, Wang Y, Xue C, Tang QJ. Polymannuronic Acid Ameliorated Obesity and Inflammation Associated With a High-Fat and High-Sucrose Diet by Modulating the Gut Microbiome in a Murine Model. Br J Nutr (2017) 117(9):1332–42. doi: 10.1017/S0007114517000964
28. Warton DI, Wright ST, Wang Y. Distance-Based Multivariate Analyses Confound Location and Dispersion Effects. Methods Ecol Evol (2012) 3:89–101. doi: 10.1111/j.2041-210X.2011.00127.x
29. Segata N, Izard J, Waldron L, Gevers D, Miropolsky L, Garrett WS, et al. Metagenomic Biomarker Discovery and Explanation. Genome Biol (2011) 12(6):R60. doi: 10.1186/gb-2011-12-6-r60
30. Huhe, Chen X, Hou F, Wu Y, Cheng Y. Bacterial and Fungal Community Structures in Loess Plateau Grasslands With Different Grazing Intensities. Front Microbiol (2017) 8:606. doi: 10.3389/fmicb.2017.00606
31. Sauer S, Bruno L, Hertweck A, Finlay D, Leleu M, Spivakov M, et al. T Cell Receptor Signaling Controls Foxp3 Expression Via PI3K, Akt, and mTOR. Proc Natl Acad Sci U S A (2008) 105(22):7797–802. doi: 10.1073/pnas.0800928105
32. Fu L, Song J, Wang C, Fu S, Wang Y. Bifidobacterium Infantis Potentially Alleviates Shrimp Tropomyosin-Induced Allergy by Tolerogenic Dendritic Cell-Dependent Induction of Regulatory T Cells and Alterations in Gut Microbiota. Front Immunol (2017) 8:1536. doi: 10.3389/fimmu.2017.01536
33. Graham MT, Nadeau KC. Lessons Learned From Mice and Man: Mimicking Human Allergy Through Mouse Models. Clin Immunol (2014) 155(1):1–16. doi: 10.1016/j.clim.2014.08.002
34. Oyoshi MK, Oettgen HC, Chatila TA, Geha RS, Bryce PJ. Food Allergy: Insights Into Etiology, Prevention, and Treatment Provided by Murine Models. J Allergy Clin Immunol (2014) 133(2):309–17. doi: 10.1016/j.jaci.2013.12.1045
35. Li J, Wang Y, Tang L, de Villiers WJ, Cohen D, Woodward J, et al. Dietary Medium-Chain Triglycerides Promote Oral Allergic Sensitization and Orally Induced Anaphylaxis to Peanut Protein in Mice. J Allergy Clin Immunol (2013) 131(2):442–50. doi: 10.1016/j.jaci.2012.10.011
36. Khodoun MV, Tomar S, Tocker JE, Wang YH, Finkelman FD. Prevention of Food Allergy Development and Suppression of Established Food Allergy by Neutralization of Thymic Stromal Lymphopoietin, IL-25, and IL-33. J Allergy Clin Immunol (2018) 141(1):171–9.e1. doi: 10.1016/j.jaci.2017.02.046
37. Van Gramberg JL, de Veer MJ, O’Hehir RE, Meeusen EN, Bischof RJ. Use of Animal Models to Investigate Major Allergens Associated With Food Allergy. J Allergy (Cairo) (2013) 2013:635695. doi: 10.1155/2013/635695
38. Morafo V, Srivastava K, Huang CK, Kleiner G, Lee SY, Sampson HA, et al. Genetic Susceptibility to Food Allergy Is Linked to Differential TH2-TH1 Responses in C3H/HeJ and BALB/c Mice. J Allergy Clin Immunol (2003) 111(5):1122–8. doi: 10.1067/mai.2003.1463
39. Kim BG, Kim JN, Jang AS, Shin M. Combined Effects of Lactobacillus Rhamnosus and Egg Oral Immunotherapy in a Mouse Model of Egg Allergy. Allergy Asthma Immunol Res (2020) 12(4):701–11. doi: 10.4168/aair.2020.12.4.701
40. Mai J, Liang B, Xiong Z, Ai X, Gao F, Long Y, et al. Oral Administration of Recombinant Bacillus Subtilis Spores Expressing Helicobacter Pylori Neutrophil-Activating Protein Suppresses Peanut Allergy Via Up-Regulation of Tregs. Clin Exp Allergy (2019) 49(12):1605–14. doi: 10.1111/cea.13489
41. Orgel K, Kulis M. A Mouse Model of Peanut Allergy Induced by Sensitization Through the Gastrointestinal Tract. Methods Mol Biol (2018) 1799:39–47. doi: 10.1007/978-1-4939-7896-0_4
42. Bansode RR, Randolph PD, Plundrich NJ, Lila MA, Williams LL. Peanut Protein-Polyphenol Aggregate Complexation Suppresses Allergic Sensitization to Peanut by Reducing Peanut-Specific IgE in C3H/HeJ Mice. Food Chem (2019) 299:125025. doi: 10.1016/j.foodchem.2019.125025
43. Freidl R, Gstoettner A, Baranyi U, Swoboda I, Stolz F, Focke-Tejkl M, et al. Blocking Antibodies Induced by Immunization With a Hypoallergenic Parvalbumin Mutant Reduce Allergic Symptoms in a Mouse Model of Fish Allergy. J Allergy Clin Immunol (2017 2017) 139(6):1897–905.e1. doi: 10.1016/j.jaci.2016.10.018
44. Smit JJ, Bol-Schoenmakers M, Hassing I, Fiechter D, Boon L, Bleumink R, et al. The Role of Intestinal Dendritic Cells Subsets in the Establishment of Food Allergy. Clin Exp Allergy (2011) 41(6):890–8. doi: 10.1111/j.1365-2222.2011.03738.x
45. Sun S, Jiang S, Wang J, Chen C, Han S, Che H. Cholera Toxin Induces Food Allergy Through Th2 Cell Differentiation Which Is Unaffected by Jagged2. Life Sci (2020) 263:118514. doi: 10.1016/j.lfs.2020.118514
46. Stefka AT, Feehley T, Tripathi P, Qiu J, McCoy K, Mazmanian SK, et al. Commensal Bacteria Protect Against Food Allergen Sensitization. Proc Natl Acad Sci U S A (2014) 111(36):13145–50. doi: 10.1073/pnas.1412008111
47. Coombes JL, Siddiqui KR, Arancibia-Cárcamo CV, Hall J, Sun CM, Belkaid Y, et al. A Functionally Specialized Population of Mucosal CD103+ DCs Induces Foxp3+ Regulatory T Cells Via a TGF-Beta and Retinoic Acid-Dependent Mechanism. J Exp Med (2007) 204(8):1757–64. doi: 10.1084/jem.20070590
48. Yamamoto T, Matsunami E, Komori K, Hayashi S, Kadowaki M. The Isoflavone Puerarin Induces Foxp3+ Regulatory T Cells by Augmenting Retinoic Acid Production, Thereby Inducing Mucosal Immune Tolerance in a Murine Food Allergy Model. Biochem Biophys Res Commun (2019) 516(3):626–31. doi: 10.1016/j.bbrc.2019.06.051
49. van Wijk F, Nierkens S, de Jong W, Wehrens EJ, Boon L, van Kooten P, et al. The CD28/CTLA-4-B7 Signaling Pathway Is Involved in Both Allergic Sensitization and Tolerance Induction to Orally Administered Peanut Proteins. J Immunol (2007) 178(11):6894–900. doi: 10.4049/jimmunol.178.11.6894
50. Liu S, Yang B, Yang P, Liu Z. Herbal Formula-3 Ameliorates OVA-Induced Food Allergy in Mice may Via Modulating the Gut Microbiota. Am J Transl Res (2019) 11(9):5812–23.
51. Vatanen T, Kostic AD, d’Hennezel E, Siljander H, Franzosa EA, Yassour M, et al. Variation in Microbiome LPS Immunogenicity Contributes to Autoimmunity in Humans. Cell (2016) 165(4):842–53. doi: 10.1016/j.cell.2016.04.007
52. Ma J, Zhang J, Li Q, Shi Z, Wu H, Zhang H, et al. Oral Administration of a Mixture of Probiotics Protects Against Food Allergy Via Induction of CD103+ Dendritic Cells and Modulates the Intestinal Microbiota. J Funct Foods (2019) 55:65–75. doi: 10.1016/j.jff.2019.02.010
53. Li Y, Luan Y, Yue X, Xiang F, Mao D, Cao Y, et al. Effects Of Codonopis Bulleynana Forest Ex Diels on Deferribacteres in Constipation Predominant Intestine Tumor: Differential Analysis. Saudi J Biol Sci (2019) 26(2):395–401. doi: 10.1016/j.sjbs.2018.11.008
54. Ogita T, Yamamoto Y, Mikami A, Shigemori S, Sato T, Shimosato T. Oral Administration of Flavonifractor Plautii Strongly Suppresses Th2 Immune Responses in Mice. Front Immunol (2020) 11:379. doi: 10.3389/fimmu.2020.00379
55. Niu Q, Li P, Hao S, Zhang Y, Kim SW, Li H, et al. Dynamic Distribution of the Gut Microbiota and the Relationship With Apparent Crude Fiber Digestibility and Growth Stages in Pigs. Sci Rep (2015) 5:9938. doi: 10.1038/srep09938
56. Nagalingam NA, Kao JY, Young VB. Microbial Ecology of the Murine Gut Associated With the Development of Dextran Sodium Sulfate-Induced Colitis. Inflamm Bowel Dis (2011) 17(4):917–26. doi: 10.1002/ibd.21462
57. Hua X, Goedert JJ, Pu A, Yu G, Shi J. Allergy Associations With the Adult Fecal Microbiota: Analysis of the American Gut Project. EBioMedicine (2015) 3:172–9. doi: 10.1016/j.ebiom.2015.11.038
58. Ni WW, Zhang QM, Zhang X, Li Y, Yu SS, Wu HY, et al. Modulation Effect of Lactobacillus Acidophilus KLDS 1.0738 on Gut Microbiota and TLR4 Expression in β-Lactoglobulin-Induced Allergic Mice Model. Allergol Immunopathol (Madr) (2020) 48(2):149–57. doi: 10.1016/j.aller.2019.06.002
59. Simonyte Sjödin K, Vidman L, Rydén P, West CE. Emerging Evidence of the Role of Gut Microbiota in the Development of Allergic Diseases. Curr Opin Allergy Clin Immunol (2016) 16(4):390–5. doi: 10.1097/ACI.0000000000000277
60. West CE, Rydén P, Lundin D, Engstrand L, Tulic MK, Prescott SL. Gut Microbiome and Innate Immune Response Patterns in IgE-Associated Eczema. Clin Exp Allergy (2015) 45(9):1419–29. doi: 10.1111/cea.12566
61. Meehan CJ, Beiko RG. A Phylogenomic View of Ecologicalspecialization in the Lachnospiraceae, a Family of Digestivetract-Associated Bacteria. Genome Biol Evol (2014) 6(3):703–13. doi: 10.1093/gbe/evu050
62. Esquivel-Elizondo S, Ilhan ZE, Garcia-Peña EI, Krajmalnik-Brown R. Insights Into Butyrate Production in a Controlled Fermentation System Via Gene Predictions. mSystems (2017 2017) 2(4):e00051–17. doi: 10.1128/mSystems.00051-17
63. Stephen-Victor E, Chatila TA. Regulation of Oral Immune Tolerance by the Microbiome in Food Allergy. Curr Opin Immunol (2019) 60:141–7. doi: 10.1016/j.coi.2019.06.001
64. Atarashi K, Tanoue T, Oshima K, Suda W, Nagano Y, Nishikawa H, et al. Treg Induction by a Rationally Selected Mixture of Clostridia Strains From the Human Microbiota. Nature (2013) 500(7461):232–6. doi: 10.1038/nature12331
65. Hernández M, de Frutos M, Rodríguez-Lázaro D, López-Urrutia L, Quijada NM, Eiros JM. Fecal Microbiota of Toxigenic Clostridioides Difficile-Associated Diarrhea. Front Microbiol (2019) 9:3331. doi: 10.3389/fmicb.2018.03331
66. Esber N, Mauras A, Delannoy J, Labellie C, Mayeur C, Caillaud MA, et al. Three Candidate Probiotic Strains Impact Gut Microbiota and Induce Anergy in Mice With Cow’s Milk Allergy. Appl Environ Microbiol (2020) 86(21):e01203–20. doi: 10.1128/AEM.01203-20
67. Berin MC. Dysbiosis in Food Allergy and Implications for Microbial Therapeutics. J Clin Invest (2021) 131(2):e144994. doi: 10.1172/JCI144994
68. Abdel-Gadir A, Stephen-Victor E, Gerber GK, Noval Rivas M, Wang S, Harb H, et al. Microbiota Therapy Acts Via a Regulatory T Cell MyD88/RORγt Pathway to Suppress Food Allergy. Nat Med (2019) 25(7):1164–74. doi: 10.1038/s41591-019-0461-z
69. Hagihara M, Kuroki Y, Ariyoshi T, Higashi S, Fukuda K, Yamashita R, et al. Clostridium Butyricum Modulates the Microbiome to Protect Intestinal Barrier Function in Mice With Antibiotic-Induced Dysbiosis. iScience (2020) 23(1):100772. doi: 10.1016/j.isci.2019.100772
Keywords: OVA sensitization, 16S rRNA, intestinal microbiota, dendritic cells, regulation T cells, Clostridiales, Mollicutes_RF39
Citation: Zhou C, Chen L-L, Lu R-Q, Ma W-W and Xiao R (2021) Alteration of Intestinal Microbiota Composition in Oral Sensitized C3H/HeJ Mice Is Associated With Changes in Dendritic Cells and T Cells in Mesenteric Lymph Nodes. Front. Immunol. 12:631494. doi: 10.3389/fimmu.2021.631494
Received: 20 November 2020; Accepted: 12 April 2021;
Published: 10 June 2021.
Edited by:
Umit Murat Sahiner, Hacettepe University, TurkeyReviewed by:
Gunnur Deniz, Istanbul University, TurkeyCopyright © 2021 Zhou, Chen, Lu, Ma and Xiao. This is an open-access article distributed under the terms of the Creative Commons Attribution License (CC BY). The use, distribution or reproduction in other forums is permitted, provided the original author(s) and the copyright owner(s) are credited and that the original publication in this journal is cited, in accordance with accepted academic practice. No use, distribution or reproduction is permitted which does not comply with these terms.
*Correspondence: Wei-Wei Ma, d2Vpd2VpbWFAY2NtdS5lZHUuY24=; Rong Xiao, eGlhb3IyMkBjY211LmVkdS5jbg==
Disclaimer: All claims expressed in this article are solely those of the authors and do not necessarily represent those of their affiliated organizations, or those of the publisher, the editors and the reviewers. Any product that may be evaluated in this article or claim that may be made by its manufacturer is not guaranteed or endorsed by the publisher.
Research integrity at Frontiers
Learn more about the work of our research integrity team to safeguard the quality of each article we publish.