 Zsuzsanna Ortutay1*
 Anna Grönholm1
 Melina Laitinen1
 Melinda Keresztes-Andrei2
 Ismail Hermelo3
 Marko Pesu1,4
- 1Immunoregulation, Faculty of Medicine and Health Technology, Tampere University, Tampere, Finland
- 2Faculty of Information Technology and Bionics, Pázmány Péter Catholic University, Budapest, Hungary
- 3Computational Biology, Faculty of Medicine and Health Technology, Tampere University, Tampere, Finland
- 4Fimlab Laboratories, Tampere, Finland
The proprotein convertase enzyme FURIN promotes the proteolytic maturation of pro-proteins and thereby it serves as an important factor for maintaining cellular homeostasis. In T cells, FURIN is critical for maintaining the T regulatory cell dependent peripheral immune tolerance and intact T helper cell polarization. The enzymatic activity of FURIN is directly associated with its expression levels, but genetic determinants for cell-type specific Furin gene regulation have remained elusive. By exploring the histone acetyltransferase p300 binding patterns in T helper cells, a putative regulatory region at ca. 20kB upstream of Furin gene was identified. When this region was deleted with CRISPR/Cas9 the production of Furin mRNA was significantly reduced in activated mouse T cells. Genome-wide RNA profiling by sequencing revealed that the novel Furin regulator region also impacted the expression of several genes that have previously been associated with the Th1 type hall mark cytokine IFNγ regulation or function. Finally, Furin genetic regulatory region was found to specifically promote the secretion of IFNγ by activated T cells. In sum, our data unravels the presence of Furin expression regulatory region in T cells that has characteristics of a super-enhancer for Th1 cell fate.
Introduction
The enzymes of the proprotein convertase subtilisin/kexin (PCSK) family are characterized by their common domain structure and unique cleavage target sequence (R/K)X(R/K) where X represents a 0, 2, 4, or 6 amino acid long spacer (1). PCSKs control the bodily homeostasis by regulating the bioavailability of several hormones, growth factors, other enzymes, and adhesion molecules. Proprotein convertases are also important factors in infections as they proteolytically modify various pathogenic structures, such as viral proteins, for example in HIV and SARS-Cov-2, or bacterial toxins (2). Although PCSKs show partly overlapping target specificity in vitro, their expression pattern and subcellular localization are divergent, and studies with knock-out animals and human mutations have unequivocally revealed distinct physiological roles for each convertase (3, 4).
The PCSK prototype enzyme, FURIN, is ubiquitously expressed and critical for embryonic development (5). In T cells, Furin (Fur) gene is upregulated by T cell receptor engagement and IL-12 cytokine and its expression is essential for maintaining intact peripheral immune tolerance, normal T helper cell polarization and activation (6–9). Furin is also upregulated via Toll like receptor signaling in myeloid cells wherein it exerts an anti-inflammatory function (10). Changes in Furin expression level are associated with a wide variety of pathological processes ranging from tumor development and progression (11), infectious diseases (12, 13) to autoimmune disorders such as rheumatoid arthritis (14) or Sjögren's syndrome (15).
The gene encoding FURIN is located on chromosome 15 in human and chromosome seven in mouse. Furin mRNAs arise from three different promoters, P1, P1A, and P1B leading to transcripts, which vary in 5′ untranslated region but translate into identical protein products (16). P1A and P1B promoters resemble those of housekeeping genes while the P1 promoter is inducible by cytokines [e.g., IL-12, TGFβ-1 (7, 17)] or by other external factors [e.g., thyroid hormone, hypoxia (18, 19)] that activate transcription factors including C/EBP-β, GATA-1, Smads, STAT-4 or HIF-1 (16, 19–21).
Super-enhancers or stretch enhancers (SE) are clusters of putative enhancers, binding transcriptional coactivators on an average 10-fold higher density than typical enhancers (TE) (22–24). They can be identified using the Rank Ordering of Super-enhancer (ROSE) algorithm on the basis of active enhancer marks such as histone three acetylation on lysine 27 residue (H3K27ac), mediator complex subunit 1 (MED1), and binding of lineage-specific or master transcription factors (23, 24), exceeding H3K27 acetylation level being highly efficient in super-enhancer demarcation (22, 25). Super-enhancers are cell type-specific, associating with key genes that control cell state thereby maintaining cell identity and determining cell fate (22). Trait-associated single nucleotide polymorphisms (SNPs) are consequently often enriched at super-enhancer sites of disease-relevant cells in specific diseases [e.g., in the brain for Alzheimer's disease (26)] and cancer cells often acquire super-enhancers at key oncogenes during tumor pathogenesis (22). Super-enhancers are considered as promising targets for therapeutic purposes (27).
Genetic variations linked with inflammatory conditions, such as rheumatoid arthritis or type 1 diabetes, were enriched in the T-cell super-enhancer regions (28), which underscores their clinical importance. In T cells, Furin expression is induced upon TCR/cytokine-mediated activation (7, 9) and in response to Toxoplasma gondii infection (8). However, the genetic regulatory mechanisms for Furin expression and their role in adaptive immunity have remained elusive. A recent study found exceedingly high histone acetyltransferase p300 binding in close genomic proximity to Furin gene in mouse Th1 cells (29), suggesting the presence of a super-enhancer in this cell type. In this study, we have used CRISPR/Cas9 genome-editing technology to functionally characterize this putative super-enhancer region in T cell activation and cytokine production.
Materials and Methods
Cell Culture and Activation
Murine thymoma cell line EL-4 was purchased from Sigma (St. Louis, MO, USA) and maintained in growth medium: RPMI-1640 (Sigma, St. Louis, MO, USA) supplemented with 10% FBS (Gibco, ThermoFisher Scientific, Waltham, MA, USA), 2 mM L-glutamine (Lonza, Basel, Switzerland), 100 U/ml penicillin (Lonza), 100 U/ml streptomycin (Lonza), 1 mM sodium pyruvate (Lonza), 4.5 g/l glucose (Lonza), 0.05 mM 2-mercaptoethanol (Sigma).
Cell clones created from EL-4 cell line were maintained in the same growth medium. Prior activation, cells were first starved in 1% FBS containing culture medium for 1 h then left unstimulated or stimulated with 10 ng/ml PMA (Sigma) and 100 ng/ml ionomycin (Sigma) for the time period mentioned. For evaluating the cytokine production from cell culture supernatants with ELISA, cells were washed once with PBS and resuspended in serum-free X-Vivo medium (Lonza) and activated as above. Thereafter cells were pelleted, and supernatants were collected and frozen until cytokine measurements with ELISA.
sgRNAs, Plasmids, and Cloning
For designing single guide RNA (sgRNA) sequences, 150 bp sequences both up- and downstream the highest p300 binding peaks (according to GEO datasets GSM994508, GSM994516, GSM1480824) in the mouse Furin genomic region (chr7: 87,533,000-87,570,000 mm9) were inputed to an on-line CRISPR design tool1. The generated sgRNA sequences were ranked according to predicted cleavage success efficiency. Chosen gRNA sequences were further analyzed using CHOPCHOP2 (30). Three sgRNAs were chosen both upstream (L) and downstream (R) of the p300 binding sites either in the Furin promoter region (PRO) or ca. 20kb upstream Furin transcription starting site (putative super-enhancer site, SE) taking into account the predicted cleavage efficiency as well as possible off-target sequences. Table 1 summarizes the target sequences of chosen sgRNAs.
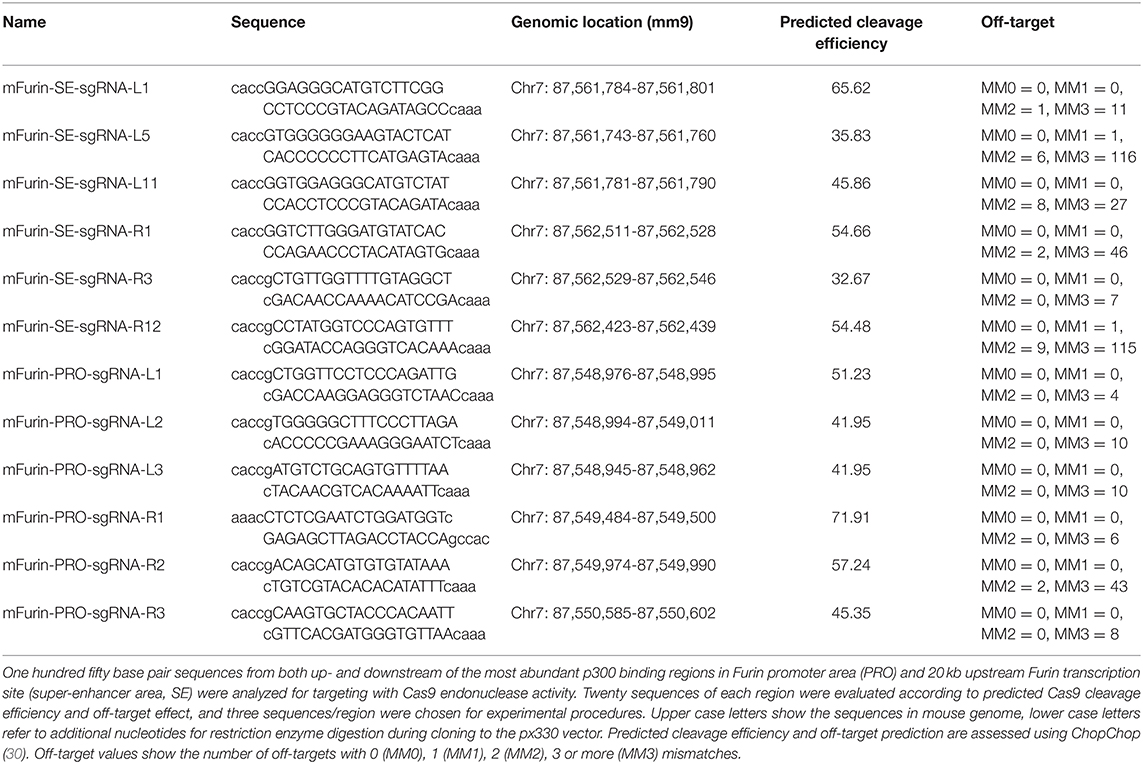
Table 1. Summary of sgRNA target sites for p300 binding area deletion.
sgRNA sequences were cloned one by one into Cas9 expression plasmid px330 (a kind gift from Dr. Rafael Casellas, senior investigator at NIAMS, National Institutes of Health, MD, USA) following previously published protocol (31) to generate the px330-mFurin-SE-R/L and px330-mFurin-PRO-R/L constructs (Figure 2A shows the schematic representation of the genome editing strategy). Functionality and efficiency of these constructs were tested with T7 assay in NIH 3T3 (ATCC) cells. Briefly, genomic DNA was isolated using DNeasy kit (Qiagen, Hilden, Germany) from cells transfected with each construct individually by using TurboFect reagent (ThermoFisher Scientific, Waltham, MA, USA) according to the manufacturer's protocol. Targeted genomic area was amplified with PCR using DreamTaq DNA polymerase (ThermoFisher Scientific) and primer pairs upstream and downstream of the targeted deletion (for SE: SE-L-For: 5′-TGGTTTTCTGCCTTTGAAATGT-3′ and SE-R-Rev: 5′-CTGGGACTTCACACTCTGCT-3′; for PRO: PRO-L-For: 5′-GGGCTCAAATCCTTGCGGTA-3′ and PRO-R-Rev: 5′-CAGCTGAGCTTCCTGGACC-3′). PCR products were annealed in a reaction containing 1x NEBuffer 2 (New England Biolabs, MA, USA) and run on 10% polyacrylamide gels.
Generation of EL-4 Cell Clones With Targeted Deletion of Putative Super-Enhancer (SE) or Promoter (PRO) Region
Stable EL-4 cell clones with deleted SE and PRO regions were generated according to a previously published protocol (32). Briefly, 24 h before transfection, EL-4 cells were adjusted to a concentration of 0.5 × 10⁶ cells/ml in complete growing medium. A total of 6 × 10⁶ cells were transfected with the mixture of 6 μg px330-mFurin-sgRNA-R and 6 μg px330-mFurin-sgRNA-L (for PRO or SE deletion) or as control 12 μg px330 vector (“empty”) constructs together with 0.6 μg pMax-GFP plasmid by using the Amaxa SF Cell Line 4D-NucleofectorTM X Kit L (Lonza). Various different pairings of sgRNA R and L constructs were used: two different pairs of PRO deleting constructs (px330-PROR1 + px330-PROL3 and px330-PROR1 + px330-PROL5) or three for the SE constructs (px330-SEL1 + px330-SER1, px330-SEL1 + px330-SER12, and px330-SEL5 + px330-SER12). The transfected cells were resuspended in complete growth medium in a concentration of 0.5 × 10⁶ cells /ml.
Seventy two hours after the transfection GFP+ cells were sorted by using FACS Aria Fusion (BD, Franklin Lakes, NJ, USA) and seeded individually (1 cell/well) into 96 well-plates (Nunc, Roskilde, Denmark). Cell clones were expanded and screened for deletion of the targeted genomic areas by PCR. For this purpose, whole genomic DNA was isolated from the cell clones using QuickExtract DNA Extraction Solution (Epicentre Biotechnologies, Madison, WI, USA) according to the manufacturer's protocol, and deletion efficiency was investigated using PCR. PCR products were run on 2% agarose gels and EL-4 cell clones showing a clear deletion at the targeted region were retained for further experiments. In case of SE region, successful deletion produced a 360 bp product instead of the 1,108 bp wild type band while PRO region deletion led to a 320 bp product and the undeleted region was 843 bp long.
qRT-PCR Analysis of Furin mRNA Expression
A total of 4 × 10⁶ cells of three individual SE or PRO deleted and “empty” px330-transfected EL-4 clones were either left unstimulated or stimulated with PMA/ionomycin for 6 h. Thereafter cells were collected, washed once in PBS and RNA was extracted using RNeasy kit (Qiagen) according to the manufacturer's protocol. RNA from each cell clone was reverse transcribed using iScript Select cDNA Synthesis Kit (Bio-Rad, Hercules, CA, USA). Gene expression was investigated with real-time quantitative PCR using the CFX96 Real-Time PCR Detection System (Bio-Rad). Primer sequences used for Furin: F: 5′-TGAGCCATTCGTATGGCTACG-3′, R: 5′-GGACACAGCTTTTCTGGTGCA-3′ and for the housekeeping gene RPS18: F: 5′-GTGATCCCTGAGAAGTTCCAG-3′, R: 5′-TCGATGTCTGCTTTCCTCAAC-3′. Relative Furin mRNA expression was calculated according to the 2-ddCt method, statistical analysis was performed with the GraphPad Prism software applying unpaired two-tailed Student's t-tests, p < 0.05 was considered a statistically significant difference.
Cell Growth and Viability Assays
Three individual SE or PRO deleted, or “empty” EL-4 cell clones were seeded into complete growth medium at a concentration of 3 × 10⁵ cells/ml, and the numbers of alive and dead cells were determined by staining with 0.4% Trypan Blue solution (Sigma). Additionally, cytotoxicity was investigated using the Cytotoxicity Detection LDH Kit (Roche, Basel, Switzerland) according to the manufacturer's instructions. Briefly, samples were taken from each growing cell clones daily, and split to two. Half of the samples were supplemented with 1% Triton X-100 (Sigma). One hour later supernatants were collected from Triton X-100 treated and untreated cells, and the absorbance at 490 nm (reference absorbance 680 nm) was measured. The lactate dehydrogenase activity (which is proportional to the absorbance of its colorimetric product) of the Triton X-100 treated cells was considered as 100% and the activity measured from the medium without any cells as 0%.
RNA Sequencing and Data Analysis
Three independent SE or “empty” EL-4 cell clones were left unstimulated or stimulated with PMA/ionomycin for 6 h as described above. Total RNA was isolated using RNeasy kit (Qiagen) according to the manufacturer's protocol. RNA library (with RiboZero kit for rRNA removal) construction and RNA sequencing services (using Illumina PE150 platform) were provided by Novogene (Beijing, China). The quality of the sequenced reads was assessed using the FastQC software. Reads were aligned to the mouse genome (mm10/ GRCm38.p5) with the STAR aligner (33), and genes without transcripts in any of the conditions (“empty” or SE, unstimulated or stimulated) were filtered out of the analysis. Statistical analysis of differential gene expression was assessed by DESeq2 algorithms (34) using DESeq2 normalization based on the median ratios (35) and apeglm shrinkage (36). Experimental design for different comparisons included the genotype (SE vs. “empty”) and the status (stimulated or unstimulated) of the cells. We considered genes as differentially expressed when the Benjamini–Hochberg adjusted p-value [false discovery rate (FDR)] was <0.05. Clustered heatmap was generated by using the pheatmap package (Version 1.0.12.) (37) in the R software. For gene set enrichment analyses, genes were ordered on the basis of fold change values (log2FC) and gene set enrichment was analyzed using WebGestalt3 (38).
Cytokine Measurements
Cytokine (IL-2, IL-4, IL-17A, TNFα, TGFβ, IFNγ) productions of three individual SE or “empty” EL-4 cell clones were assessed from PMA/ionomycin-stimulated and unstimulated cells with commercial ELISA kits (eBioscience, San Diego, CA, USA) following the protocol provided by the manufacturer. Optical densities were analyzed with the drc package (39) in R, statistical differences between sample groups were examined by comparing the log(conc) values using unpaired two-tailed Student t-tests, p < 0.05 was considered as statistically significant difference.
Results
p300 Binding Is Pronounced at 20 kb Upstream of Furin Gene in CD4+ T Helper Cells
p300 is a histone acetyltransferase responsible for acetylating the chromatin at histone H3K27 thus activating the gene expression machinery (40). Vahedi et al. (29) sought for the key genomic regulators of CD4+ T helper cell fate by identifying putative super-enhancer (SE) regions with exceptionally high p300 loading in mouse Th1, Th2, and Th17 cells. By ranking the genomic regions according to the magnitude of p300 load they identified an area at ca. 20kb upstream of the transcription starting site of Furin gene that is highly occupied by p300 in Th1 type cells. This region ranked as one of the genomic sites with the most abundant p300 binding (together with Bach2, Rgs1, Il2r, IFNγ, Il7r, Tbx21, Stat5 and others) and it was thus defined as a putative super-enhancer for Th1 cell fate. The evaluation of the genomic location of the p300 binding sites in different T helper cell subtypes at chr7: 87,500,000-87,600,00 of the mouse genome demonstrated the highest amount of p300 binding at putative SE site in Th1 type cells while the other investigated T cell types showed a lower amount of p300 binding (Figure 1A). In addition to the aforementioned putative super-enhancer region, high p300 binding was observed adjacent to promoter regions (PRO) of Furin gene in all Th subtypes. Upstream of the PRO and downstream of the SE region, two other genomic area showed enriched p300 binding in Th1 and Th2 but not in Th17 cells, whereas p300 binding was low or missing at the surrounding genomic locations.
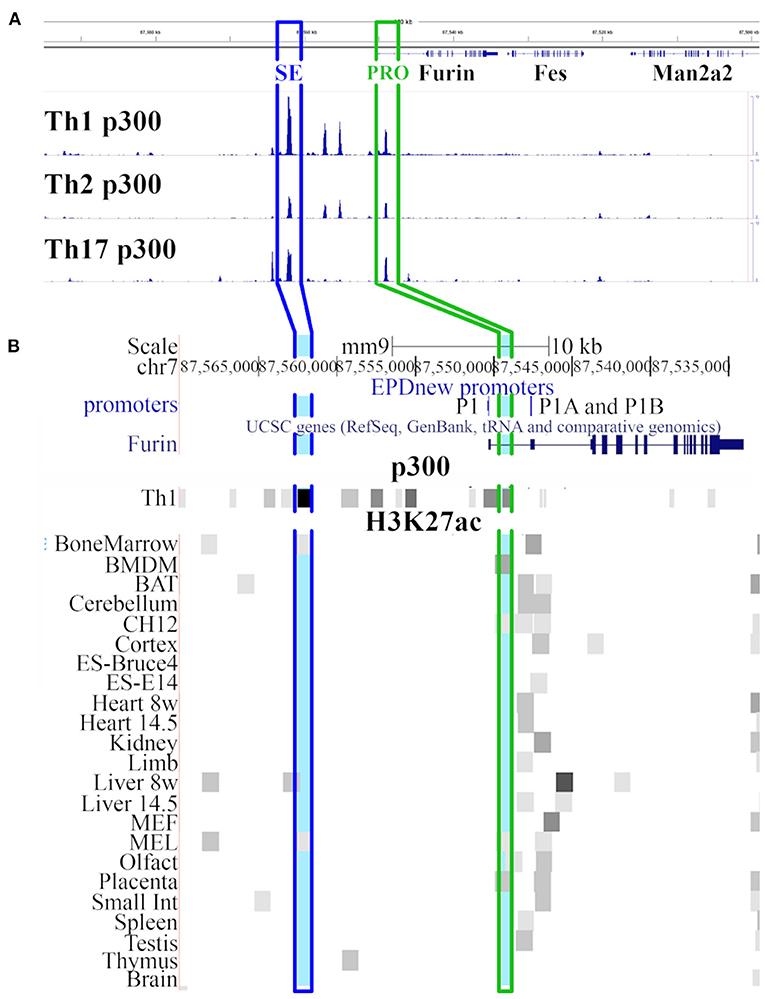
Figure 1. Genomic view of Furin region. (A) UCSC genome browser (41) view of region chr7: 87,500,000-87,600,000 in mouse genome (mm9 assembly) with p300 Chip-Seq data tracks from the GEO database [GSM994508 (Th1 p300), GSM994516 (Th2 p300), GSM1480824 (Th17 p300) datasets]. The heights of the p300 peaks on the Th1 p300, Th2 p300 and Th17 p300 tracks are relative to the amount of p300 bound to the chromatin. (B) Closer look on Furin gene region (modified UCSC view of region chr7: 87,533,000-87,570,000). The view shows tracks for promoters (EPD viewer hub), Furin gene (Refseq), p300 abundance in Th1 cells (GEO dataset GSM994508), and H3K27ac marks (ENCODE LICR data) in various tissues and cell types. Light blue marks show the genomic region with the most abundant p300 binding 20kb upstream the Furin transcription starting site (SE in blue frame) and within the promoter region (PRO in green frame). SE: putative super-enhancer site, PRO: Furin promoter site.
Figure 1B shows the Furin region in the mouse genome (chr7:87,533,000-87,570,000; mm9 genome assembly). The two aforementioned genomic areas (SE and PRO) that showed high p300 binding in all type of T helper cells are highlighted in blue (SE) and green (PRO) color (Figures 1A,B). To further evaluate the role of p300 binding at the putative Furin super-enhancer site we studied the H3K27ac histone marks in several tissues from openly available data of the mouse ENCODE project (42). In tissue and cell line samples analyzed in the frame of the ENCODE project, the genomic region at the promoter area of Furin gene showed typically H3K27ac enrichment near Furin's constitutively active promoters P1A and P1B (16). Moreover, in bone marrow-derived macrophages (BMDM), erythroleukemia cell lines (CH12 and Mel), olfactory bulbs (olfact) and placenta, the H3K27ac peak at the promoter region overlapped with the p300 binding peak occurring in Th cell subgroups although this p300 peak does not overlap with any of the known Furin promoters but localizes between the P1 and P1A promoters. However, a H3K27ac enrichment at the putative Furin super-enhancer region could only be seen in bone marrow, liver and Mel samples suggesting that this genomic area is active, and in an open state only in restricted cell and tissue types.
The Putative Super-Enhancer Regulates Furin mRNA Expression in Activated T Cells
To investigate how the identified p300 enrichment regions PRO and SE regulate Furin mRNA expression in T cells, we deleted these genomic areas with high p300 load in all investigated Th subtypes by employing CRISPR/Cas9 technology. To this end we cloned sgRNA sequences targeting the genomic DNA upstream (L) or downstream (R) of either the SE or the PRO area to the Cas9 expression vector px330. EL-4 mouse thymoma cell line was then transfected with pairs of either PRO or SE deleting constructs using various px330-L and px330-R combinations (Figure 2A). Transient transfection of EL-4 cells for the targeted deletions resulted in a relatively low deletion efficiency (data not shown). To overcome this challenge, we generated several stable EL-4 cell lines with deleted PRO or SE region following the guidelines provided by Bauer et al. (32). In parallel, EL-4 cells were transfected with px330 vectors without a specific sgRNA sequence to generate control cell lines (“empty”) for further experiments. The cell lines were then screened for the deletion of the PRO and SE regions and EL-4 clones with complete deletion of the targeted area (Figure 2B) were retained for further investigation.
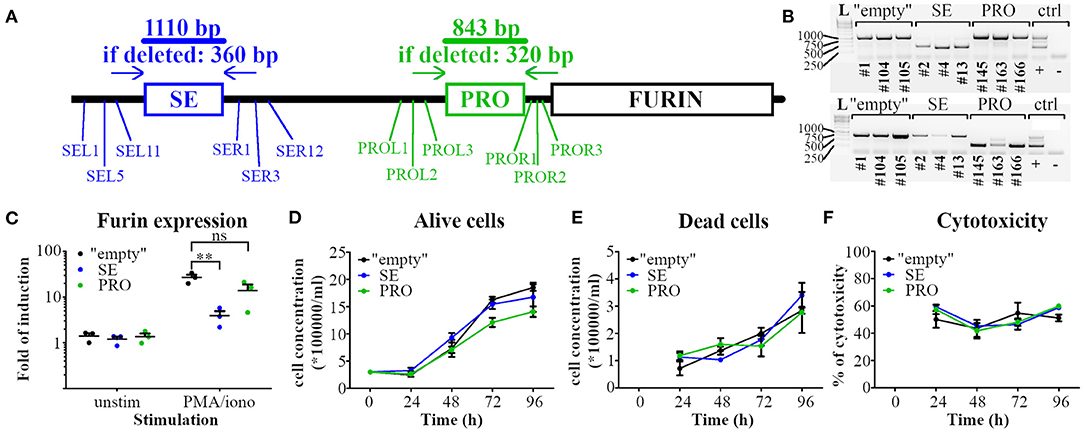
Figure 2. Deletion of p300 binding enrichment site upstream of Furin gene impairs the activation-induced Furin expression in T cells. (A) Schematic representation of the deletion strategy of the high p300-binding areas at the putative super-enhancer (SE) and the promoter region (PRO) of the Furin gene (FURIN). gRNAs targeting the upstream (L) and downstream (R) sequence of the p300 binding areas were designed, cloned to Cas9 expression vectors and transfected in pairs (SEL and SER or PROL and PROR) into EL-4 mouse thymoma cells. (B) Deletion efficiency in EL-4 cell clones was assessed with PCR using primer pairs outside of the targeted deletion area. Three independent EL-4 cell clones with full deletion of SE (above) or PRO (below) region or transfected without gRNA (“empty”) were kept for further investigations. A cell clone with heterozygous PRO region deletion was used for PCR control (control lane +). L = 1kb DNA ladder. (C) “Empty,” SE area deleted (SE) and PRO region deleted (PRO) EL-4 clones were left unstimulated or stimulated with PMA and ionomycin for 6 h and Furin mRNA expression was examined with qRT PCR. Normalized Furin expressions were compared using Student's t-tests (**p < 0.01). (D–F) Viability and proliferation of EL-4 cell clones. “Empty,” SE, and PRO clones were cultured under identical conditions, and the number of alive (D) and dead (E) cells was determined manually for 96 h. Additionally, samples from each EL-4 clone culture were taken daily and cytotoxicity was determined using LDH assay (F). Data are shown as means ± SEM (n = 3/genotype). (D–F) The experiment was repeated three times with similar results).
First, we evaluated the impact of deletion of the SE or PRO area on the expression of Furin mRNA in resting or stimulated EL-4 clones with qRT PCR. Since this cell line shows low levels of CD3 T cell receptor on the cell surface [(43) and data not shown], we used PMA/ionomycin stimuli to bypass the T cell membrane receptor complex (44). As reported previously for primary T cells (7), T cell activation induced Furin mRNA expression in all three types of EL-4 cell clones (Figure 2C). Furin expression in unstimulated “empty,” PRO and SE EL-4 clones was similar, but when activated, the SE clones expressed significantly less Furin mRNA when compared to “empty” clones (Figure 2C). In contrast, the activated PRO T cell clones expressed comparable levels of Furin mRNA to the “empty” cells, which suggests that SE, but not PRO, p300 binding region is critical for normal activation-induced Furin expression in T cells.
By processing e.g. cell growth factors, FURIN is known to influence the proliferation and viability of several cell types (45–47). To evaluate if deleting the high p300-binding areas affects the cell proliferation or survival, we quantified alive (Figure 2D) and dead cells (Figure 2E) in EL-4 cell clone cultures by Trypan blue dye exclusion assay. Additionally, we investigated the cytotoxicity of the cells using the lactate dehydrogenase (LDH) leakage assay (Figure 2F). The proliferation and viability of SE and PRO clones were found to be similar to the “empty” EL-4 cell clones.
The Deletion of the Super-Enhancer Area Does Not Affect the Splicing of Furin mRNA
To further evaluate how the SE region impacts Furin mRNA expression, we compared the RNA transcription profiles of resting and activated SE-deleted and “empty” EL-4 T cell clones using RNA sequencing (RNAseq). Read alignment to the entire Furin region led to similar results as observed with qRT PCR: in steady state, both wild type “empty” and SE-deleted EL-4 clones expressed Furin at comparable levels. Upon PMA/ionomycin stimulation for 6 h, a 20-times increase in the number of aligned reads was observed in the “empty” clones while Furin expression was upregulated ca. three-fold in the SE EL-4 clones (Figure 3A).
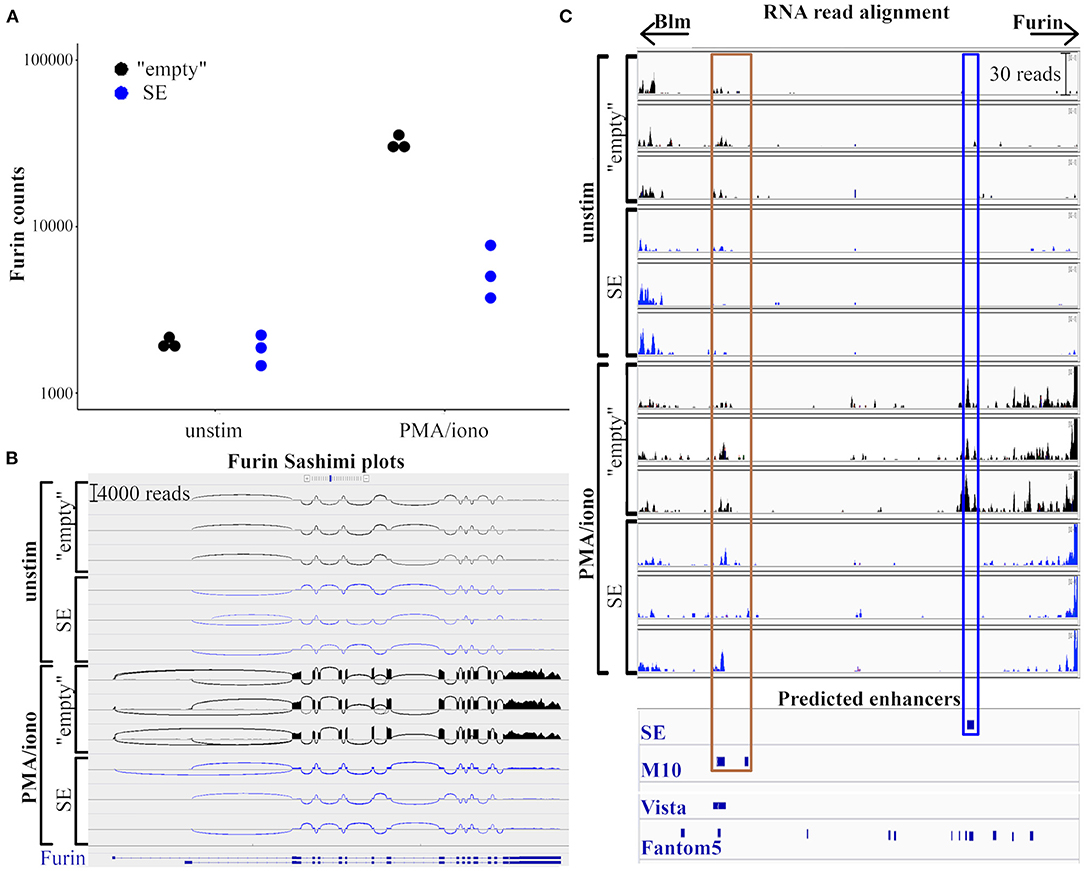
Figure 3. Deletion of putative Furin super-enhancer does not affect the RNA splicing. RNA expression in “empty” and SE EL-4 cell clones was analyzed using RNA sequencing. (A) Dot plot represents the counts of RNA reads aligning to Furin gene in unstimulated or 6 h PMA/ionomycin stimulated clones. (B) Sashimi plots of Furin region (chr7: 80,389,000-80,406,000; mm10 assembly) generated with integrative genomics viewer (IGV). The heights of the bar diagrams are proportional to read counts aligning to the given region. Loops represents reads aligning to more exons, the thickness of the line refers to the number of bridging reads. (C) Read coverage of the genomic region between Furin and Blm genes (chr7: 80,405,000–80,455,000; mm10 assembly). The modified IGV view shows RNA read alignments in unstimulated or PMA/ionomycin-stimulated “empty” and SE cell clones, as well as predicted enhancer sites (SE: putative super-enhancer (deleted in SE clones), M10: Furin enhancer (48), Vista: enhancers from Vista enhancer browser (49), Fantom5: permissive enhancers according to Fantom5 enhancer atlas (50). Brown frame marks genomic areas with validated Furin enhancer activity, blue frame marks the putative super-enhancer.
Alternative splicing can affect the stability, localization, or translation of the mRNA, and as such, it can play an important role in gene regulation (51). There are ten alternative transcripts of mouse Furin in the RefSeq database4 (52), eight of which are predicted with computational methods while two transcripts are experimentally validated5. To investigate how the deletion of the putative SE region affects the exon usage of Furin transcripts, we generated Sashimi plots with the built-in tool of the Integrative Genomics Viewer [IGV, (53)]. Sashimi plots (54) are used to depict RNAseq reads aligning to the exons of a gene, loops representing bridges between separate exons where a read aligns to more exons thus visualizing possible alternative splicing events. We investigated the quality and the quantity of mRNA isoforms originating from the Furin region in wild type (“empty”) and SE-deleted cell clones (Figure 3B). In steady-state, we could not detect any marked differences in Furin transcription between the “empty” and SE EL-4 clones; the quantity of the reads aligning to any given genomic location (the heights of the bars on the diagrams) were similar, and the junction coverage, the number of reads aligning to separate exons (represented by the thickness of the loops on Figure 3B), was also equal. The activation of T cells for 6 h resulted in a pronounced elevation (ca. 15 to 20 times) in all read counts aligning to the translating exons of Furin in the “empty” cell clones whereas the induction of Furin expression in SE-deleted cell clones was reduced globally (ca. three times more aligning reads across all encoding exons).
Gene expression can also be regulated by lncRNAs, especially those transcribing from the antisense strand of the protein-coding DNA (55). We observed the expression of a known lncRNA gene (Gm44851) overlapping the alternative first non-coding exon of Furin, with a low transcription level in steady-state (two to six reads both in “empty” and SE EL-4 clones). PMA/ionomycin stimulus led to a ca. 100-fold elevation in Gm44851 transcription, however, there was no statistically significant difference between the “empty” and SE-deleted EL-4 clones (data not shown).
The transcriptional activity at the active enhancers results in the production of enhancer RNAs (eRNAs), which may regulate their target gene by altering the chromatin architecture and histone modification, or by recruiting specific proteins to the enhancers (56). Super-enhancers are reported to produce higher amounts of eRNAs than typical enhancers (22). To evaluate eRNA transcription at the putative Furin super-enhancer region we compared the RNA alignments of resting and PMA/ionomycin stimulated “empty” and SE-deleted cell clones. We also examined the read alignment to the M10 area, a genomic region (30 kb upstream Furin, 10 kb downstream Blm) with reported Furin enhancer activity (48) (Figure 3C). In “empty” EL-4 clones, T cell activation resulted in 20–30 eRNA reads aligning to the super-enhancer region indicative of activation-induced eRNA production. Logically, in resting or activated SE clones where the p300-binding region is deleted, no eRNA reads aligned to the super-enhancer region. In contrast, the eRNA production at M10 in EL-4 cells was not evidently dependent of the SE region or T cell activation (8–16 aligning eRNA reads/condition).
The Furin Super-Enhancer Region Regulates Gamma Interferon Gene Signature
Next, we compared the genome-wide RNA expression profiles of unstimulated and stimulated (6 h, PMA/ ionomycin) “empty” and SE-deleted EL-4 cell clones (Supplementary Figure 1, Supplementary Table 1). This analysis revealed differential expression of a total of 141 genes, among those only immune system process (GO:0002376) associated genes were significantly over-represented (FDR = 0.04, data not shown). As the impact of SE on the Furin expression was only significant in activated cells, we next compared directly the gene expression profiles of activated “empty” and SE clones (Figure 4A). This analysis revealed that the Furin SE region significantly regulated the expression of a total of 40 transcripts (p adj < 0.05), some of which have been reported to share common ontologies or other features (Figure 4, Table 2). For example, SE region impacted the expression of both Furin and Fes, the gene directly downstream and in a short genomic distance to Furin. Two genes encoding previously identified FURIN target molecules [NOTCH1 (62) and ADAM33 (57)] were among the SE-dependent genes as well. Additionally, FURIN cleavage could be predicted with the ProP software6 (77) in the protein product of six other SE-dependent genes, namely Arc, Gimap4, Il18bp, Mst1r, Sh2d3c, and Slc16a6 genes (Table 2).
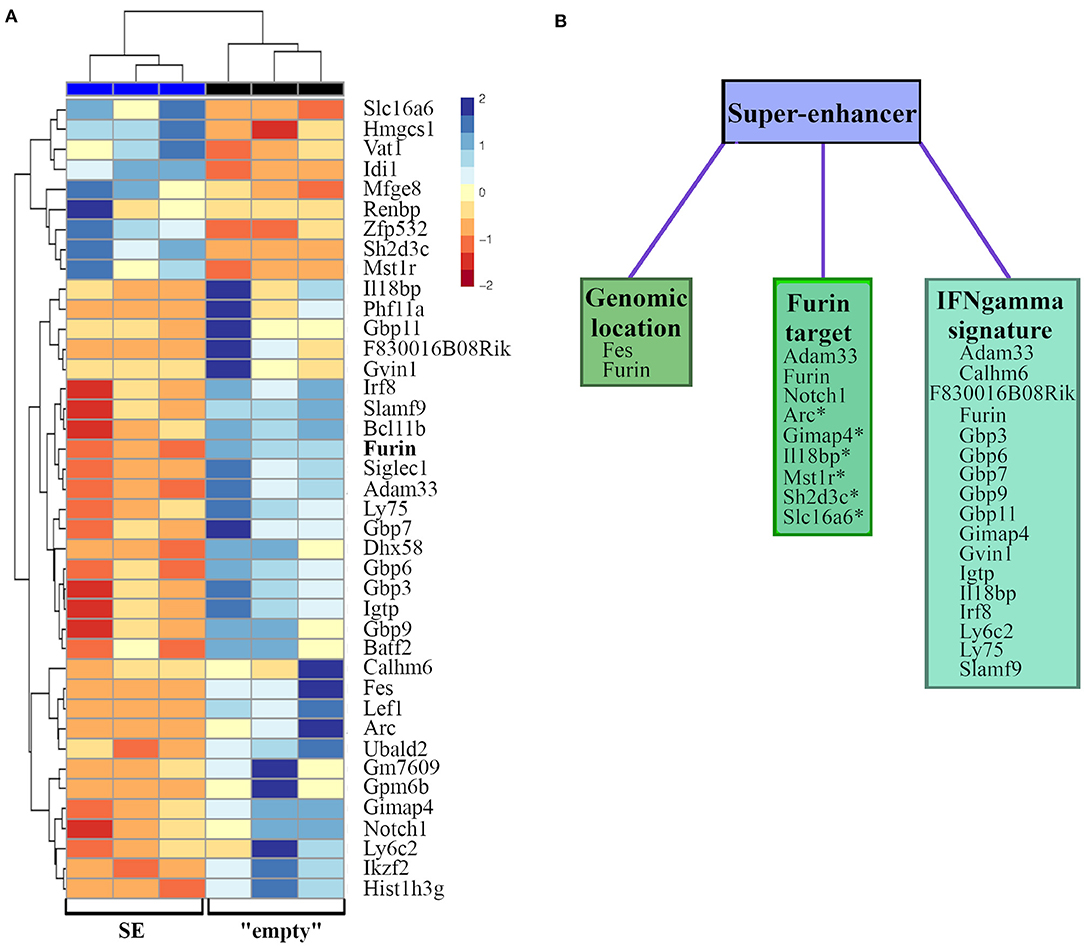
Figure 4. FURIN SE regulated RNA expressions in activated EL-4 T cells clones. “Empty” and SE EL-4 T cell clones were stimulated for 6 h with PMA and ionomycin (n = 3/genotype). Gene expression of clones was analyzed using RNA sequencing. (A) Heatmap representation of significantly differentially expressed genes (p adj < 0.05). Genes are arranged according to the expression pattern similarity, colors representing the log2-transformed internally normalized RNA read counts. (B) Differentially expressed genes are categorized into groups based on common features, such as close genomic location, validated or predicted (*) FURIN cleavage, or tie to IFNγ.
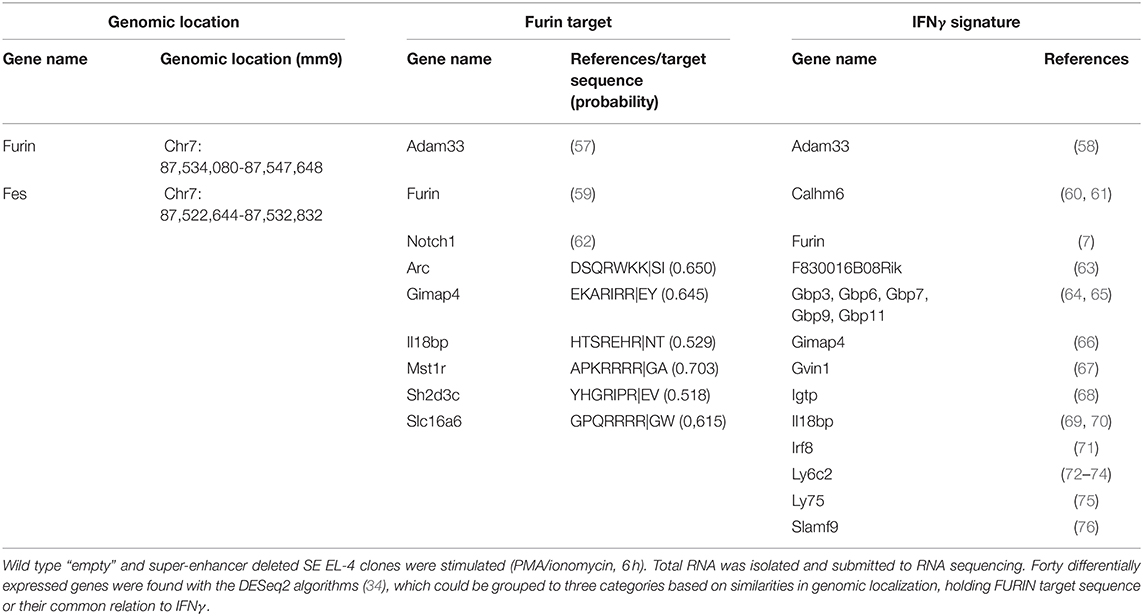
Table 2. Groups of differentially expressed genes.
A remarkable number of the SE-dependent genes have previously been associated with the Th1 signature cytokine IFNγ. Many of these exert GTPase activity [F830016B08Rik coding immunity-related GTPase 4 (IFGGA4) protein], or are IFNγ-inducible guanylate binding proteins (Gbp3, Gbp6, Gbp7, Gbp9, Gbp11), Gimap4, Gvin1 (also known as Vlig1) and Igtp). Also several genes that either regulate or are regulated by IFNγ were found to be SE-dependent. Adam33 is regulated in an IFNγ dependent manner in airway smooth muscle cells of asthma patients (58), Calhm6 (also known as Fam26f or Inam) both regulates IFNγ in NK cells (60) and is itself upregulated by IFNγ in lymphocytes (61), Il18bp is regulated by IFNγ (70) and it inhibits the levels of circulating IL-18 with a consequential IFNγ reduction (69). Irf8 is an IFNγ inducible transcription factor with a crucial role in myelopoiesis (71). Ly6c expression positively correlates with IFNγ production by effector T cells (72, 73), and endogenous IFNγ induces Ly6c expression (74). Ly75 (Dec205/CD205) is a surface molecule on a subset of dendritic cells (75). Slamf9 expression is also upregulated upon IFNγ stimulus in bone marrow-derived macrophages (76). Lastly, also Furin has been shown to control ifnγ expression, and both Furin and IFNγ expression are co-regulated via the IL-12/STAT4 pathway (7). As the number of significantly differentially expressed genes in actvated “empty” and SE clones was limited, we further ranked all genes according to the difference in expression levels between stimulated SE and “empty” cells (log2foldchange) and evaluated enriched gene ontology terms and KEGG pathways. These analyses did not reveal any additional gene set enrichments between the activated “empty” and SE clones (data not shown).
In sum, RNAseq data indicate that the Furin SE region regulates the transcription of genes that are located at its vicinity (Furin, Fes), FURIN target molecules as well as several genes that are associated with the IFNγ cytokine regulation or function.
Furin Super-Enhancer Promotes the Production of Th1 Cytokine IFNγ in Activated T Cells
Data from the RNA sequencing experiments imply that Furin SE may have a role in regulating Th1 type responses, such as the production of IFNγ. To test this hypothesis directly, we evaluated the production of T cell cytokines in “empty” and SE EL-4 T cell clones. To this end, EL-4 cell clones were stimulated with PMA/ionomycin for 24 h and 48 h, or left untreated, and cytokine levels were measured in the cell culture supernatans using commercial ELISA kits. Remarkably, deleting the Furin SE region significantly reduced the production of IFNγ by activated T cells at both 24 and 48 h (Figure 5) whereas the production of IL-2, TNFα, and IL-17 were unaffected by SE deletion. Th2 type hallmark cytokines were below the level of detection in both “empty” and SE EL-4 cell clones at all tested time points (data not shown). These data indicate that the p300 binding enrichment site ca. 20 kb upstream of Furin gene has a potential to serve as a genuine super-enhancer region for IFNγ production and T helper 1 type cell fate.
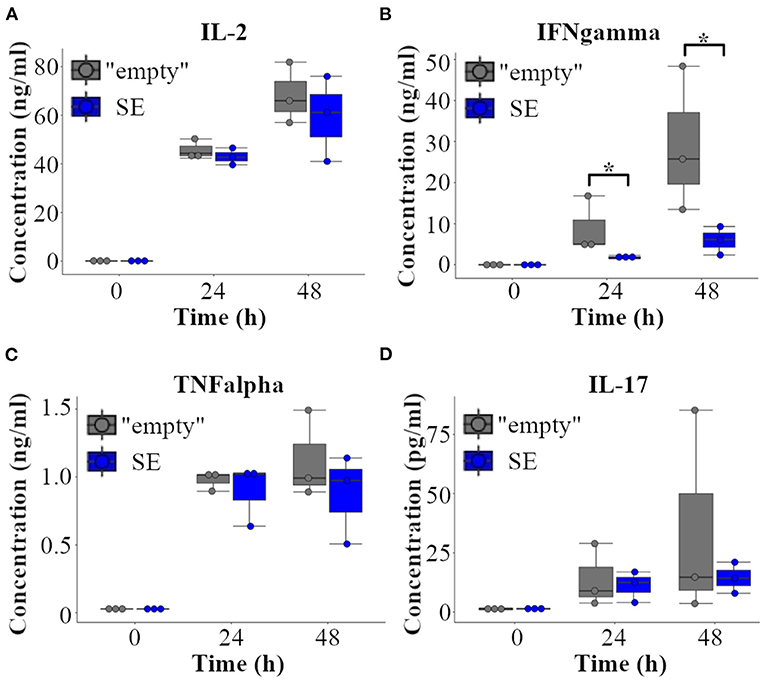
Figure 5. Furin super-enhancer regulates IFNγ in activated T cells. “Empty” and SE-deleted EL-4 T cell clones (n = 3/genotype) were left unstimulated or activated with PMA and ionomycin for 24 and 48 h. The production of (A) IL-2, (B) IFNγ, (C) TNFα and (D) IL-17 were evaluated from the supernatants with ELISA. The cytokine levels were compared using Student's t-test (*p < 0.05). Three independent “empty” and SE EL-4 clones were stimulated three times, ELISA measurements were repeated two to three times leading to similar results.
Discussion
Although the structure of Furin gene and its promoters have been described already in the 1990's, its genetic regulation is still not well-understood. The development of DNA sequencing technologies now allows for further deciphering regulatory sequences that control the spatial and temporal expression of genes. ChIP-seq using antibody against the acetyltransferase and transcriptional coactivator p300 protein predicts the presence of active enhancers with high accuracy, more p300 binding referring to higher transcriptional activity of a target gene (40). p300 has a dual role in the regulation of gene expression: as a chromatin-modification enzyme it can regulate chromatin accessibility, and by recruiting transcription factors it can help in the assembling of the transcriptional machinery. Further, genes determining cell identity are associated with super-enhancers, which are marked by exceptionally high p300 binding. This feature is useful for identifying genes that play key roles in defining cell fate. The exceptionally high p300 histone acetylase binding upstream of Furin gene in mouse Th1 cells (29) referring to the presence of a super-enhancer (SE) at this genomic area appoints Furin as a critical element of Th1 fate. Indeed, FURIN has previously been reported to regulate IFNγ (7) and to be essential for generating pathogen-specific Th1 lymphocytes after Toxoplasma gondii infection (8). However, a lower level of p300 binding was also found in the promoter region of other investigated T helper cell types (Th1, Th2, and Th17) as well as in the SE region of Th2 and Th17 cells. The quantity of p300 binding can be decisive in defining the rate of RNA transcription, and two other binding sites with lower p300 load were found upstream of the PRO and downstream of the SE area in Th1 and Th2 cells. Understanding the cell-specific regulation of Furin expression would benefit from the functional evaluation of the other two putative enhancer sites in the future.
In this work, we examined the regulatory role of the genomic regions appointed by high levels of p300 binding in mouse Th cells by generating cell clones with complete deletion of these sequences in Furin promoter region (EL-4 PRO) or ca. 20 kb upstream Furin (EL-4 SE) and comparing Furin expression to that of the wild type (EL-4 “empty”) cells. Surprisingly, deletion of the p300 binding sequence in the promoter region has not caused any changes of Furin expression in either steady-state or following stimulation although analysis of this sequence revealed putative binding sites for different transcription factors (such as EVI-1, HAND-1, PAX4, and c-REL, data not shown). Notably, the p300 peak present in the PRO region in primary mouse T cells does not overlap with the reported Furin promoter sequences but it is rather situated between the inducible P1 and the housekeeping-like P1A and P1B promoters.
On the other hand, deletion of the SE region led to significant reduction in stimulation-dependent upregulation of Furin expression while, in steady-state, Furin expression levels were similarly low in all three types of EL-4 cell clones. The importance of the SE region in EL-4 cells was underlined by the fact that this genomic region could be deleted referring to an open—thus accessible—chromatin state in this cell type. In contrast, targeting the same sequence in NIH 3T3 cells proved to be unsuccessful (data not shown) suggesting that in fibroblast cells the SE area can be closed, and as such, not accessible for the activity of Cas9 endonuclease. In line with the ubiquitous expression of Furin, the PRO region could be deleted in both EL-4 and NIH 3T3 cells (data not shown). The deletion of the SE sequence caused a significant decrease but not complete lack of Furin mRNA in stimulated cells, allowing the analysis of cellular processes which are dependent on dose-dependent Furin expression. For example, although Furin deficiency in mouse T cells was associated with increased T cell numbers (6), decrease in FURIN level seems not to influence cell proliferation and survival. However, it is important to note that the EL-4 cell line model might not fully reflect the true role of the SE region and it will be thus important to replicate our findings in more physiological settings, ideally by generating an SE targeted mouse strain.
While in T cells complete lack of FURIN results in differential expressions of several genes (9), the deletion of the putative SE area affected only a restricted set of genes. These included genes that are in close genomic distance to the putative SE, reported and predicted FURIN targets, and IFNγ signature genes. The regulatory effect of SE on Fes can be explained by the close genomic distance of Furin and Fes rendering these two genes to the same genomic regulatory domain. However, Blm, upstream of Furin, and in a similar (shorter) distance from the SE region as Fes (ca. 26 vs. 29 kb), was not differently expressed in stimulated SE and “empty” EL-4 clones although enhancers are able to activate gene expression independently of their orientation (78). The fact that FURIN target proteins are among the differentially expressed genes is in keeping with the observation that the expression of FURIN and other proprotein convertase enzyme genes are often co-regulated with their cognate target molecules (79).
The putative super-enhancer influenced the expression of several genes, which are known to be regulators of or being regulated by IFNγ. ELISA experiments demonstrated that IFNγ was produced at lower levels by SE-deleted EL-4 clones compared to the wild type “empty” EL-4 cells. This finding is in accordance with the presence of the investigated super-enhancer in Th1 cells: super-enhancers are thought to regulate genes which are decisive for cell identity. Interestingly, complete deletion of Furin in T cells seems to have wider effects on cytokine production than SE-deletion in EL-4 cells. For example, while Furin KO T cells produce elevated levels of IL-2 in steady-state but have impaired IL-2 responses upon T cell stimulus (9), SE-dependent reduction in Furin expression does not influence IL-2 production in EL-4 cells indicating a dose-dependent role for Furin in IL-2 regulation. TNFα and IL-17 productions remained unaffected by FURIN levels which is in accordance with earlier findings in FURIN cKO mice (6). Collectively, these data indicate that Furin may have an expression level dependent mode of action on T cell proliferation, activation and T helper cell polarization
To understand the mechanism by which the SE region regulates Furin expression, we investigated the possibility of gene regulation via alternative RNA splicing. T cell activation by PMA/ionomycin stimulation caused more RNA fragments aligning to Furin gene. Similarly to this finding, phorbol esters were reported to enhance Furin P1 promoter activity in neuronal cells (80). However, Furin mRNA splicing profiles were intact in SE-deleted EL-4 clones, which suggests that RNA splicing is independent of the SE region. In addition, we could not detect significant difference in the transcription of the lncRNA gene Gm44851 either in steady-state or following stimulation. We also noticed eRNA transcription at the putative super-enhancer site in “empty” EL-4 clones proving the enhancer activity of this genomic region. Upon stimulation, the amount of RNA reads aligning to this area increased suggesting elevated enhancer activity.
However, deletion of the SE sequence or PMA/ionomycin stimulation did not have a clear effect on the transcription of the earlier reported Furin enhancer, M10. The SE region includes target sequences for a different set of transcription factors (e.g., OCT1, PAX-6, NKX2-5, and HNF-1). The regulatory role of these transcription factors on Furin expression or in Th cell fate remains yet to be established. Notably, the SE region also includes a putative binding site for T-bet (GSM949921), a key regulator of Th1 polarization. Deletion of SE region can thus potentially disturb Th polarization (81) also by diminishing the T-bet dependent Th1 polarization events.
Our data demonstrate that the predicted super-enhancer indeed regulates Furin expression in stimulated mouse T cells. There are also reported super-enhancers upstream Furin gene in human cells, cell lines (CD4+CD25-Il17+ Th17, K562, Ly4, HeLa) and organs (liver, tonsils, small intestine, pancreatic islets and adipose nuclei) according to the super-enhancer database, dbSuper (82). Single nucleotide polymorphisms (SNPs) in the reported genomic regions are associated with stroke [rs4932370 (83)], blood pressure variation [rs4932371 (84), rs8029440 (85)], and asthma [rs8029440 (86), rs74874915 (87)]. Super-enhancers are emerging targets of therapies where cell-type specific gene regulation is impaired, such as in cancers (23, 88) or autoimmune diseases (28, 89, 90). Targeting the super-enhancer would enable to influence Furin expression only in selected conditions when the super-enhancer is in an active state.
FURIN has recently emerged as a potential target in infectious diseases and cancer. Especially, as the critical determinant of SARS-CoV-2 infectivity—the spike protein, is now known to be processed by FURIN, inhibitors may have clinical value in harnessing this global epidemy (91). Upregulated FURIN level/ activity can have both beneficial and pathological effects in malignant diseases. FURIN level is elevated in various tumor cell lines and primary tumors (11), and FURIN activity promotes many cancer-related processes, such as cell proliferation, migration or vascularization, for example (11). It is thus not surprising that FURIN inhibitors are suggested in the treatment of various cancers and to prevent infections (92). On the other hand, Furin overexpression is not a common feature of diseases associated with Furin: for example, Furin is downregulated in prostate cancer (93) and Furin mRNA and protein levels are significantly decreased in the brain of Alzheimer's disease patients (94). Additionally, in hepatocellular carcinoma, Furin overexpression associates with better prognosis (95).
In sum, our understanding on the regulation of Furin and its importance remains still incomplete. However, it will be critical to continue work on the subject as better understanding of this matter may potentially have clinical value in understanding the pathogenesis and treatment strategies for a wide range of detrimental diseases.
Data Availability Statement
The datasets presented in this study can be found in online repositories. The names of the repository/repositories and accession number(s) can be found below: https://www.ncbi.nlm.nih.gov/geo/, GSE158456.
Author Contributions
ZO organized experiments and participated in generating EL-4 clones, carried out and analyzed RNA sequencing, carried out ELISA, and drafted the manuscript. AG and ML designed and cloned gRNAs. MK-A transfected EL-4 cells and carried out cell viability assays, determined alive/dead cell counts, carried out qRT PCR. IH generated EL-4 cell clones. MP supervised research and reviewed data and revised the paper. All authors contributed to the article and approved the submitted version.
Funding
This work was supported by the Academy of Finland (Grant No. 286477 and 295814 to MP), the Competitive State Research Financing of the Expert Responsibility Area of Tampere University Hospital (Grant No. X50070 to MP), the Tampere Tuberculosis Foundation (MP), the Cancer Society of Finland (MP) and Tays tukisäätiö (Tays Support Foundation) (to MP).
Conflict of Interest
MP was affiliated with Fimlab ltd without employment.
The remaining authors declare that the research was conducted in the absence of any commercial or financial relationships that could be construed as a potential conflict of interest.
Supplementary Material
The Supplementary Material for this article can be found online at: https://www.frontiersin.org/articles/10.3389/fimmu.2021.630389/full#supplementary-material
Footnotes
2. ^http://chopchop.cbu.uib.no/
3. ^http://www.webgestalt.org/
4. ^https://www.ncbi.nlm.nih.gov/refseq/
5. ^https://www.ncbi.nlm.nih.gov/nuccore/NM_011046.3,NM_001081454.2,XM_011250818.2,XM_011250819.3,XM_011250820.3,XM_011250821.2,XM_011250822.2,XM_011250823.1,XM_030242209.1,XM_030242210.1
References
1. Seidah NG, Chrétien M. Proprotein and prohormone convertases: a family of subtilases generating diverse bioactive polypeptides. Brain Res. (1999) 848:45–62. doi: 10.1016/S0006-8993(99)01909-5
2. Seidah NG, Sadr MS, Chrétien M, Mbikay M. The multifaceted proprotein convertases: their unique, redundant, complementary, and opposite functions. J Biol Chem. (2013) 288:21473–81. doi: 10.1074/jbc.R113.481549
3. Scamuffa N, Calvo F, Chrétien M, Seidah NG, Khatib A-M. Proprotein convertases: lessons from knockouts. FASEB J. (2006) 20:1954–63. doi: 10.1096/fj.05-5491rev
4. Creemers JWM, Khatib AM. Knock-out mouse models of proprotein convertases: unique functions or redundancy? Front Biosci. (2008) 13:4960–71. doi: 10.2741/3055
5. Roebroek AJ, Umans L, Pauli IG, Robertson EJ, van Leuven F, Van de Ven WJ, et al. Failure of ventral closure and axial rotation in embryos lacking the proprotein convertase furin. Development. (1998) 125:4863–76.
6. Pesu M, Watford WT, Wei L, Xu L, Fuss I, Strober W, et al. T-cell-expressed proprotein convertase furin is essential for maintenance of peripheral immune tolerance. Nature. (2008) 455:246–50. doi: 10.1038/nature07210
7. Pesu M, Muul L, Kanno Y, O'Shea JJ. Proprotein convertase furin is preferentially expressed in T helper 1 cells and regulates interferon gamma. Blood. (2006) 108:983–85. doi: 10.1182/blood-2005-09-3824
8. Oksanen A, Aittomäki S, Jankovic D, Ortutay Z, Pulkkinen K, Hämäläinen S, et al. Proprotein convertase FURIN constrains Th2 differentiation and is critical for host resistance against toxoplasma gondii. J Immunol. (2014) 193:5470–79. doi: 10.4049/jimmunol.1401629
9. Ortutay Z, Oksanen A, Aittomäki S, Ortutay C, Pesu M. Proprotein convertase FURIN regulates T cell receptor-induced transactivation. J Leukocyte Biol. (2015) 98:73–83. doi: 10.1189/jlb.2A0514-257RR
10. Cordova ZM, Grönholm A, Kytölä V, Taverniti V, Hämäläinen S, Aittomäki S, et al. Myeloid cell expressed proprotein convertase FURIN attenuates inflammation. Oncotarget. (2016) 7:54392–404. doi: 10.18632/oncotarget.11106
11. Jaaks P, Bernasconi M. The proprotein convertase furin in tumour progression. Int J Cancer. (2017) 141:654–63. doi: 10.1002/ijc.30714
12. Inocencio NM, Moehring JM, Moehring TJ. Furin activates pseudomonas exotoxin a by specific cleavage in vivo and in vitro. J Biol Chem. (1994) 269:31831–35. doi: 10.1016/S0021-9258(18)31770-8
13. Chen Y, Xie X, Gu L, Huang X-H, Peng X-M. Furin MRNA expression in peripheral blood correlates with chronic hepatitis B virus infection. Hepatol Res. (2013) 43:208–16. doi: 10.1111/j.1872-034X.2012.01051.x
14. Lin H, Ah Kioon M-D, Lalou C, Larghero J, Launay J-M, Khatib A-M, et al. Protective role of systemic furin in immune response-induced arthritis. Arthritis Rheumatism. (2012) 64:2878–86. doi: 10.1002/art.34523
15. Ranta N, Valli A, Grönholm A, Silvennoinen O, Isomäki P, Pesu M, et al. Proprotein convertase enzyme FURIN is upregulated in primary sjögren's syndrome. Clin Exp Rheumatol. (2018) 36(Suppl. 112):47–50.
16. Ayoubi TA, Creemers JW, Roebroek AJ, Van de Ven WJ. Expression of the dibasic proprotein processing enzyme furin is directed by multiple promoters. J Biol Chem. (1994) 269:9298–303. doi: 10.1016/S0021-9258(17)37107-7
17. Blanchette F, Day R, Dong W, Laprise MH, Dubois CM. TGFbeta1 regulates gene expression of its own converting enzyme furin. J Clin Investigation. (1997) 99:1974–83. doi: 10.1172/JCI119365
18. Chen RN, Huang YH, Lin YC, Yeh CT, Liang Y, Chen SL, et al. Thyroid hormone promotes cell invasion through activation of furin expression in human hepatoma cell lines. Endocrinology. (2008) 149:3817–31. doi: 10.1210/en.2007-0989
19. McMahon S, Grondin F, McDonald PP, Richard DE, Dubois CM. Hypoxia-enhanced expression of the proprotein convertase furin is mediated by hypoxia-inducible factor-1: impact on the bioactivation of proproteins. J Biol Chem. (2005) 280:6561–69. doi: 10.1074/jbc.M413248200
20. Laprise M-H, Grondin F, Cayer P, McDonald PP, Dubois CM. Furin Gene (Fur) regulation in differentiating human megakaryoblastic dami cells: involvement of the proximal GATA recognition motif in the P1 promoter and impact on the maturation of furin substrates. Blood. (2002) 100:3578–87. doi: 10.1182/blood.V100.10.3578
21. Blanchette F, Rudd P, Grondin F, Attisano L, Dubois CM. Involvement of smads in TGFbeta1-induced Furin (Fur) transcription. J Cell Physiol. (2001) 188:264–73. doi: 10.1002/jcp.1116
22. Hnisz D, Abraham BJ, Lee TI, Lau A, Saint-André V, Sigova AA, et al. Super-enhancers in the control of cell identity and disease. Cell. (2013) 155:934–47. doi: 10.1016/j.cell.2013.09.053
23. Lovén J, Hoke HA, Lin CY, Lau A, Orlando DA, Vakoc CR, et al. Selective inhibition of tumor oncogenes by disruption of super-enhancers. Cell. (2013) 153:320–34. doi: 10.1016/j.cell.2013.03.036
24. Whyte WA, Orlando DA, Hnisz D, Abraham BJ, Lin CY, Kagey MH, et al. Master transcription factors and mediator establish super-enhancers at key cell identity genes. Cell. (2013) 153:307–19. doi: 10.1016/j.cell.2013.03.035
25. Rada-Iglesias A, Bajpai R, Swigut T, Brugmann SA, Flynn RA, Wysocka JA. Unique chromatin signature uncovers early developmental enhancers in humans. Nature. (2011) 470:279–83. doi: 10.1038/nature09692
26. Carullo NVN, Day JJ. Genomic enhancers in brain health and disease. Genes. (2019) 10:43. doi: 10.3390/genes10010043
27. Shin HY. Targeting super-enhancers for disease treatment and diagnosis. Mol Cells. (2018) 41:506–14. doi: 10.14348/molcells.2018.2297
28. Farh KK-H, Marson A, Zhu J, Kleinewietfeld M, Housley WJ, Beik S, et al. Genetic and epigenetic fine mapping of causal autoimmune disease variants. Nature. (2015) 518:337–43. doi: 10.1038/nature13835
29. Vahedi G, Kanno Y, Furumoto Y, Jiang K, Parker SCJ, Erdos MR, et al. Super-enhancers delineate disease-associated regulatory nodes in T cells. Nature. (2015) 520:558–62. doi: 10.1038/nature14154
30. Labun K, Montague TG, Krause M, Torres Cleuren YN, Tjeldnes H, Valen E. CHOPCHOP v3: expanding the CRISPR web toolbox beyond genome editing. Nucleic Acids Res. (2019) 47:W171–74. doi: 10.1093/nar/gkz365
31. Ran FA, Hsu PD, Wright J, Agarwala V, Scott DA, Zhang F. Genome engineering using the CRISPR-Cas9 system. Nat Protocols. (2013) 8:2281–308. doi: 10.1038/nprot.2013.143
32. Bauer DE, Canver MC, Orkin SH. Generation of genomic deletions in mammalian cell lines via CRISPR/Cas9. J Visualized Exp. (2015) 95:e52118. doi: 10.3791/52118
33. Dobin A, Davis CA, Schlesinger F, Drenkow J, Zaleski C, Jha S, et al. STAR: ultrafast universal RNA-Seq aligner. Bioinformatics. (2013) 29:15–21. doi: 10.1093/bioinformatics/bts635
34. Love MI, Huber W, Anders S. Moderated estimation of fold change and dispersion for RNA-Seq data with DESeq2. Genome Biol. (2014) 15:550. doi: 10.1186/s13059-014-0550-8
35. Anders S, Huber W. Differential expression analysis for sequence count data. Genome Biol. (2010) 11:R106. doi: 10.1186/gb-2010-11-10-r106
36. Zhu A, Ibrahim JG, Love MI. Heavy-tailed prior distributions for sequence count data: removing the noise and preserving large differences. Bioinformatics. (2019) 35:2084–92. doi: 10.1093/bioinformatics/bty895
37. Kolde R. Pheatmap: Pretty Heatmaps (version 1.0.12). (2019). Available online at: https://CRAN.R-project.org/package=pheatmap
38. Liao Y, Wang J, Jaehnig EJ, Shi Z, Zhang B. WebGestalt 2019: gene set analysis toolkit with revamped UIs and APIs. Nucleic Acids Res. (2019) 47:W199–205. doi: 10.1093/nar/gkz401
39. Ritz C, Baty F, Streibig JC, Gerhard D. Dose-response analysis using R. PLoS ONE. (2015) 10:e0146021. doi: 10.1371/journal.pone.0146021
40. Visel A, Blow MJ, Li Z, Zhang T, Akiyama JA, Holt A, et al. ChIP-Seq accurately predicts tissue-specific activity of enhancers. Nature. (2009) 457:854–58. doi: 10.1038/nature07730
41. Haeussler M, Zweig AS, Tyner C, Speir ML, Rosenbloom KR, Raney BJ, et al. The UCSC genome browser database: 2019 update. Nucleic Acids Res. (2019) 47:D853–8. doi: 10.1093/nar/gky1095
42. Yue F, Cheng Y, Breschi A, Vierstra J, Wu W, Ryba T, et al. Comparative encyclopedia of DNA elements in the mouse. Genome Nat. (2014) 515:355–64. doi: 10.1038/nature13992
43. Kunugita N, Mei N, Goncharova T, Norimura T. Measurement of mutant frequency in T-Cell Receptor (TCR) Gene by Flow Cytometry after X-Irradiation on EL-4 mice lymphoma cells. J Toxicol Sci. (2007) 32:377–86. doi: 10.2131/jts.32.377
44. Ai W, Li H, Song N, Li L, Chen H. Optimal method to stimulate cytokine production and its use in immunotoxicity assessment. Int J Environ Res Public Health. (2013) 10:3834–42. doi: 10.3390/ijerph10093834
45. Yang X, Wang Q, Gao Z, Zhou Z, Peng S, Chang WL, et al. Proprotein convertase furin regulates apoptosis and proliferation of granulosa cells in the rat ovary. PLoS ONE. (2013) 8:e50479. doi: 10.1371/journal.pone.0050479
46. López de Cicco R, Bassi DE, Zucker S, Seidah NG, Klein-Szanto AJP. Human carcinoma cell growth and invasiveness is impaired by the propeptide of the ubiquitous proprotein convertase furin. Cancer Res. (2005) 65:4162–71. doi: 10.1158/0008-5472.CAN-04-2820
47. Kim W, Essalmani R, Szumska D, Creemers JWM, Roebroek AJM, D'Orleans-Juste P, et al. Loss of endothelial furin leads to cardiac malformation and early postnatal death. Mol Cell Biol. (2012) 32:3382–91. doi: 10.1128/MCB.06331-11
48. Dupays L, Towers N, Wood S, David A, Stuckey DJ, Mohun T. Furin, a transcriptional target of NKX2-5, has an essential role in heart development and function. PLoS ONE. (2019) 14:e0212992. doi: 10.1371/journal.pone.0212992
49. Visel A, Minovitsky S, Dubchak I, Pennacchio LA. VISTA enhancer browser–a database of tissue-specific human enhancers. Nucleic Acids Res. (2007) 35:D88–92. doi: 10.1093/nar/gkl822
50. Andersson R, Gebhard C, Miguel-Escalada I, Hoof I, Bornholdt J, Boyd M, et al. An Atlas of active enhancers across human cell types and tissues. Nature. (2014) 27:2014. doi: 10.1038/nature12787
51. Baralle FE, Giudice J. Alternative splicing as a regulator of development and tissue identity. Nat Rev Mol Cell Biol. (2017) 18:437–51. doi: 10.1038/nrm.2017.27
52. Pruitt KD, Tatusova T, Maglott DR. NCBI Reference Sequences (RefSeq): a curated non-redundant sequence database of genomes, transcripts and proteins. Nucleic Acids Res. (2007) 35:D61–5. doi: 10.1093/nar/gkl842
53. Thorvaldsdóttir H, Robinson JT, Mesirov JP. Integrative Genomics Viewer (IGV): high-performance genomics data visualization and exploration. Brief Bioinform. (2013) 14:178–92. doi: 10.1093/bib/bbs017
54. Katz Y, Wang ET, Silterra J, Schwartz S, Wong B, Thorvaldsdóttir H, et al. Quantitative visualization of alternative exon expression from RNA-Seq data. Bioinformatics. (2015) 31:2400–2. doi: 10.1093/bioinformatics/btv034
55. Katayama S, Tomaru Y, Kasukawa T, Waki K, Nakanishi M, Nakamura M, et al. Antisense transcription in the mammalian transcriptome. Science. (2005) 309:1564–66. doi: 10.1126/science.1112009
56. de Lara JC, Arzate-Mejía RG, Recillas-Targa F. Enhancer RNAs: insights into their biological role. Epigenetics Insights. (2019) 12:2516865719846093. doi: 10.1177/2516865719846093
57. Umland SP, Wan Y, Shah H, Garlisi CG, Devito KE, Braunschweiger K, et al. Mouse ADAM33: two splice variants differ in protein maturation and localization. Am J Respiratory Cell Mol Biol. (2004) 30:530–39. doi: 10.1165/rcmb.2003-0220OC
58. Ito I, Laporte JD, Fiset PO, Asai K, Yamauchi Y, Martin JG, et al. Downregulation of a disintegrin and metalloproteinase 33 by IFN-gamma in human airway smooth muscle cells. J Allergy Clin Immunol. (2007) 119:89–97. doi: 10.1016/j.jaci.2006.08.038
59. Anderson ED, Molloy SS, Jean F, Fei H, Shimamura S, Thomas G. The ordered and compartment-specfific autoproteolytic removal of the furin intramolecular chaperone is required for enzyme activation. J Biol Chem. (2002) 277:12879–90. doi: 10.1074/jbc.M108740200
60. Kasamatsu J, Azuma M, Oshiumi H, Morioka Y, Okabe M, Ebihara T, et al. INAM plays a critical role in IFN-γ production by NK cells interacting with polyinosinic-polycytidylic acid-stimulated accessory cells. J Immunol. (2014) 193:5199–207. doi: 10.4049/jimmunol.1400924
61. Javed A, Leuchte N, Salinas G, Opitz L, Stahl-Hennig C, Sopper S, et al. Pre-infection transcript levels of FAM26F in peripheral blood mononuclear cells inform about overall plasma viral load in acute and post-acute phase after simian immunodeficiency virus infection. J General Virol. (2016) 97:3400–12. doi: 10.1099/jgv.0.000632
62. Logeat F, Bessia C, Brou C, LeBail O, Jarriault S, Seidah NG, et al. The Notch1 receptor is cleaved constitutively by a furin-like convertase. Proc Natl Acad Sci USA. (1998) 95:8108–12. doi: 10.1073/pnas.95.14.8108
63. Schwerbel K, Kamitz A, Krahmer N, Hallahan N, Jähnert M, Gottmann P, et al. Immunity-related GTPase induces lipophagy to prevent excess hepatic lipid accumulation. J Hepatol. (2020) 73:771–82. doi: 10.1016/j.jhep.2020.04.031
64. Santos JC, Broz P. Sensing of invading pathogens by GBPs: at the crossroads between cell-autonomous and innate immunity. J Leukocyte Biol. (2018) 104:729–35. doi: 10.1002/JLB.4MR0118-038R
65. Shuai H, Meng Maminska A, MacMicking JD. Cell-autonomous immunity by IFN-induced GBPs in animals and plants. Current Opinion Immunol. (2019) 60:71–80. doi: 10.1016/j.coi.2019.04.017
66. Heinonen MT, Kanduri K, Lähdesmäki HJ, Lahesmaa R, Henttinen TA. Tubulin- and actin-associating GIMAP4 is required for IFN-γ secretion during Th cell differentiation. Immunol Cell Biol. (2015) 93:158–66. doi: 10.1038/icb.2014.86
67. Klamp T, Boehm U, Schenk D, Pfeffer K, Howard JC. A. Giant GTPase, very large inducible GTPase-1, is inducible by IFNs. J Immunol. (2003) 171:1255–65. doi: 10.4049/jimmunol.171.3.1255
68. Taylor GA, Jeffers M, Largaespada DA, Jenkins NA, Copeland NG, Vande Woude GF. Identification of a novel GTPase, the inducibly expressed GTPase, that accumulates in response to interferon gamma. J Biol Chem. (1996) 271:20399–405. doi: 10.1074/jbc.271.34.20399
69. Novick D, Kim SH, Fantuzzi G, Reznikov LL, Dinarello CA, Rubinstein M. Interleukin-18 binding protein: a novel modulator of the Th1 cytokine response. Immunity. (1999) 10:127–36. doi: 10.1016/S1074-7613(00)80013-8
70. Hurgin V, Novick D, Rubinstein M. The promoter of IL-18 binding protein: activation by an IFN-gamma -induced complex of IFN regulatory factor 1 and CCAAT/enhancer binding protein beta. Proc Natl Acad Sci USA. (2002) 99:16957–62. doi: 10.1073/pnas.262663399
71. Tamura T, Kurotaki D, Koizumi S. Regulation of myelopoiesis by the transcription factor IRF8. Int J Hematol. (2015) 101:342–51. doi: 10.1007/s12185-015-1761-9
72. Walunas TL, Bruce DS, Dustin L, Loh DY, Bluestone JA. Ly-6C is a marker of memory CD8+ T Cells. J Immunol. (1995) 155:1873–83.
73. Marshall HD, Chandele A, Jung YW, Meng H, Poholek AC, Parish IA, et al. Differential expression of Ly6C and T-bet distinguish effector and memory Th1 CD4(+) cell properties during viral infection. Immunity. (2011) 35:633–46. doi: 10.1016/j.immuni.2011.08.016
74. DeLong JH, Hall AO, Konradt C, Coppock GM, Park J, Harms Pritchard G, et al. Cytokine- and TCR-mediated regulation of T cell expression of Ly6C and Sca-1. J Immunol. (2018) 200:1761–70. doi: 10.4049/jimmunol.1701154
75. Soares H, Waechter H, Glaichenhaus N, Mougneau E, Yagita H, Mizenina O, et al. A subset of dendritic cells induces CD4+ T cells to produce IFN-Gamma by an IL-12-independent but CD70-dependent mechanism in vivo. J Exp Med. (2007) 204:1095–106. doi: 10.1084/jem.20070176
76. Dollt C, Michel J, Kloss L, Melchers S, Schledzewski K, Becker K, et al. The novel immunoglobulin super family receptor SLAMF9 Identified in TAM of murine and human melanoma influences pro-inflammatory cytokine secretion and migration. Cell Death Dis. (2018) 9:939. doi: 10.1038/s41419-018-1011-1
77. Duckert P, Brunak S, Blom N. Prediction of proprotein convertase cleavage sites. Protein Eng Design Selection. (2004) 17:107–12. doi: 10.1093/protein/gzh013
78. Banerji J, Rusconi S, Schaffner W. Expression of a beta-globin gene is enhanced by remote SV40 DNA sequences. Cell. (1981) 27:299–308. doi: 10.1016/0092-8674(81)90413-X
79. Turpeinen H, Raitoharju E, Oksanen A, Oksala N, Levula M, Lyytikäinen L-P, et al. Proprotein convertases in human atherosclerotic plaques: the overexpression of FURIN and its substrate cytokines BAFF and APRIL. Atherosclerosis. (2011) 219:799–806. doi: 10.1016/j.atherosclerosis.2011.08.011
80. Zha JS, Zhu BL, Liu L, Lai YJ, Long Y, Hu XT, et al. Phorbol esters DPPA/DPA promote furin expression involving transcription factor CEBPβ in neuronal cells. Oncotarget. (2017) 8:60159–72. doi: 10.18632/oncotarget.18569
81. Zhu J, Jankovic D, Oler AJ, Wei G, Sharma S, Hu G, et al. The transcription factor T-Bet Is induced by multiple pathways and prevents an endogenous T helper-2 program during T Helper-1 responses. Immunity. (2012) 37:660–73. doi: 10.1016/j.immuni.2012.09.007
82. Khan A„ Zhang X. dbSUPER: a database of super-enhancers in mouse and human genome. Nucleic Acids Res. (2016) 44:D164–71. doi: 10.1093/nar/gkv1002
83. Malik R, Chauhan G, Traylor M, Sargurupremraj M, Okada Y, Mishra A, et al. Multiancestry genome-wide association study of 520,000 subjects identifies 32 loci associated with stroke and stroke subtypes. Nat Genetics. (2018) 50:524–37. doi: 10.1038/s41588-018-0058-3
84. Hoffmann TJ, Ehret GB, Nandakumar P, Ranatunga D, Schaefer C, Kwok P-Y, et al. Genome-wide association analyses using electronic health records identify new loci influencing blood pressure variation. Nat Genetics. (2017) 49:54–64. doi: 10.1038/ng.3715
85. Feitosa MF, Kraja AT, Chasman DI, Sung YJ, Winkler TW, Ntalla I, et al. Novel genetic associations for blood pressure identified via gene-alcohol interaction in up to 570K individuals across multiple ancestries. PLoS ONE. (2018) 13:e0198166. doi: 10.1371/journal.pone.0198166
86. Han Y, Jia Q, Jahani PS, Hurrell BP, Pan C, Huang P, et al. Genome-wide analysis highlights contribution of immune system pathways to the genetic architecture of asthma. Nat Commun. (2020) 11:1776. doi: 10.1038/s41467-020-15649-3
87. Yucesoy B, Kaufman KM, Lummus ZL, Weirauch MT, Zhang G, Cartier A, et al. Genome-wide association study identifies novel loci associated with diisocyanate-induced occupational asthma. Toxicol Sci. (2015) 146:192–201. doi: 10.1093/toxsci/kfv084
88. Tang F, Yang Z, Tan Y, Li Y. Super-enhancer function and its application in cancer targeted therapy. NPJ Precision Oncol. (2020) 4:2. doi: 10.1038/s41698-020-0108-z
89. Wu H, Chen Y, Zhu H, Zhao M, Lu Q. The pathogenic role of dysregulated epigenetic modifications in autoimmune diseases. Front Immunol. (2019) 10:2305. doi: 10.3389/fimmu.2019.02305
90. Jahagirdar R, Attwell S, Marusic S, Bendele A, Shenoy N, McLure KG, et al. RVX-297, a BET bromodomain inhibitor, has therapeutic effects in preclinical models of acute inflammation and autoimmune disease. Mol Pharmacol. (2017) 92:694–706. doi: 10.1124/mol.117.110379
91. Cheng YW, Chao TL, Li CL, Chiu MF, Kao HC, Wang SH, et al. Furin inhibitors block SARS-CoV-2 spike protein cleavage to suppress virus production and cytopathic effects. Cell Reports. (2020) 33, 108254. doi: 10.1016/j.celrep.2020.108254
92. Couture F, Kwiatkowska A, Dory YL, Day R. Therapeutic uses of furin and its inhibitors: a patent review. Expert Opinion Therapeutic Patents. (2015) 25:379–96. doi: 10.1517/13543776.2014.1000303
93. D'Anjou F, Routhier S, Perreault J-P, Latil A, Bonnel D, Fournier I, et al. Molecular validation of PACE4 as a target in prostate cancer. Translational Oncol. (2011) 4:157–72. doi: 10.1593/tlo.10295
94. Hwang EM, Kim S-K, Sohn J-H, Lee JY, Kim Y, Kim YS, et al. Furin is an endogenous regulator of alpha-secretase associated APP processing. Biochem Biophy Res Commun. (2006) 349:654–59. doi: 10.1016/j.bbrc.2006.08.077
Keywords: Furin regulation, super-enhancer, interferon gamma, p300, proprotein convertase
Citation: Ortutay Z, Grönholm A, Laitinen M, Keresztes-Andrei M, Hermelo I and Pesu M (2021) Identification of Novel Genetic Regulatory Region for Proprotein Convertase FURIN and Interferon Gamma in T Cells. Front. Immunol. 12:630389. doi: 10.3389/fimmu.2021.630389
Received: 17 November 2020; Accepted: 22 January 2021;
Published: 18 February 2021.
Edited by:
Navin Kumar Verma, Nanyang Technological University, SingaporeReviewed by:
Gangqing Hu, West Virginia University, United StatesMyong-Hee Sung, National Institutes of Health (NIH), United States
Copyright © 2021 Ortutay, Grönholm, Laitinen, Keresztes-Andrei, Hermelo and Pesu. This is an open-access article distributed under the terms of the Creative Commons Attribution License (CC BY). The use, distribution or reproduction in other forums is permitted, provided the original author(s) and the copyright owner(s) are credited and that the original publication in this journal is cited, in accordance with accepted academic practice. No use, distribution or reproduction is permitted which does not comply with these terms.
*Correspondence: Zsuzsanna Ortutay, enN1enNpLm9ydHV0YXkmI3gwMDA0MDtnbWFpbC5jb20=