 Marianna Santopaolo1
 Niall Sullivan2
 Anita Coral Thomas1
 Valeria Vincenza Alvino1
 Lindsay B. Nicholson3
 Yue Gu1
 Gaia Spinetti4Marinos Kallikourdis5,6Ashley Blom1
 Paolo Madeddu1*
- 1Bristol Medical School, Translational Health Sciences, University of Bristol, Bristol, United Kingdom
- 2University Hospitals Bristol NHS Trust, Bristol, United Kingdom
- 3Bristol Medical School, School of Cellular and Molecular Medicine, University of Bristol, Bristol, United Kingdom
- 4Laboratory of Cardiovascular Research, Istituto di Ricovero e Cura a Carattere Scientifico MultiMedica, Milan, Italy
- 5Department of Biomedical Sciences, Humanitas University, Milan, Italy
- 6Adaptive Immunity Laboratory, IRCCS Humanitas Research Hospital, Milan, Italy
Background: Chronic low-grade inflammation and alterations in innate and adaptive immunity were reported in Type 2 diabetes (T2D). Here, we investigated the abundance and activation of T cells in the bone marrow (BM) of patients with T2D. We then verified the human data in a murine model and tested if the activation of T cells can be rescued by treating mice with abatacept, an immunomodulatory drug employed for the treatment of rheumatoid arthritis. Clinical evidence indicated abatacept can slow the decline in beta-cell function.
Methods: A cohort of 24 patients (12 with T2D) undergoing hip replacement surgery was enrolled in the study. Flow cytometry and cytokine analyses were performed on BM leftovers from surgery. We next compared the immune profile of db/db and control wt/db mice. In an additional study, db/db mice were randomized to receive abatacept or vehicle for 4 weeks, with endpoints being immune cell profile, indices of insulin sensitivity, and heart performance.
Results: Patients with T2D showed increased frequencies of BM CD4+ (2.8-fold, p = 0.001) and CD8+ T cells (1.8-fold, p = 0.01), with the upregulation of the activation marker CD69 and the homing receptor CCR7 in CD4+ (1.64-fold, p = 0.003 and 2.27-fold, p = 0.01, respectively) and CD8+ fractions (1.79-fold, p = 0.05 and 1.69-fold, p = 0.02, respectively). These differences were confirmed in a multivariable regression model. CCL19 (CCR7 receptor ligand) and CXCL10/11 (CXCR3 receptor ligands), implicated in T-cell migration and activation, were the most differentially modulated chemokines. Studies in mice confirmed the activation of adaptive immunity in T2D. Abatacept reduced the activation of T cells and the levels of proinflammatory cytokines and improved cardiac function but not insulin sensitivity.
Conclusions: Results provide proof-of-concept evidence for the activation of BM adaptive immunity in T2D. In mice, treatment with abatacept dampens the activation of adaptive immunity and protects from cardiac damage.
Research in Context
What Is Already known?
• Type 2 diabetes (T2D) is characterized by systemic low-grade inflammation and activation of innate and adaptive immunity, which supports the novel medical theory that T2D is an autoimmune disease. The bone marrow (BM) is a primary immune organ. People with T2D have a fatty BM characterized by inflamed adipocytes that accumulate at the expense of hematopoietic cells and vascular cells.
• Abatacept, an immunomodulatory drug that acts through the selective inhibition of T-cell co-stimulation, was approved for rheumatoid arthritis in 2007. The drug has shown favorable action in preserving beta cell function in patients with rheumatoid arthritis, possibly due to its anti-inflammatory and immunomodulatory properties.
What Is the Key Question?
• Is adaptive immunity activated in the BM of patients with T2D?
• Do mice with T2D model the condition seen in patients?
• If so, can abatacept treatment rescue T-cell activation, thereby benefiting metabolic control and cardiac function?
What Are the New Findings?
• Patients and mice with T2D show a shift in the prevalent subsets of BM T lymphocytes, with enrichment of activated cells.
• Treatment of obese, T2D mice with abatacept rescued the altered adaptive immune profile and improved heart performance, without improving insulin sensitivity.
How Might This Impact Clinical Practice in the Foreseeable Future?
• The BM requires clinical attention as a target and trigger of inflammatory responses involving cells of the adaptive immunity.
• Multicenter trials are warranted to extend the implication of the study to the general population affected by T2D, to determine if those with an activation of adaptive immunity develop more cardiovascular complications.
• Modern immunomodulatory drugs that disable just the initial stage of lymphocyte activation leaving the remaining immune army unscathed may represent a novel approach to prevent cardiovascular complications.
Background
Chronic low-grade inflammation plays an important role in the progression of type 2 diabetes (T2D) mellitus and in the increased propensity of diabetic people to develop cardiovascular disease, infections, and cancer (1–4). Both innate and adaptive immunity play key roles in the development of metabolic inflammation and insulin resistance (5–11). Cross-sectional results from the Multi-Ethnic Study of Atherosclerosis (MESA) highlighted the association of T2D with adaptive immune response, reflected by higher memory and lower naive CD4+ cells (12). Moreover, higher levels of CD4+ memory cells have been reported in the peripheral blood of T2D subjects with cardiovascular disease as compared with those without, suggesting a state of exacerbated immune activation may be implicated in the development of complications (13). Likewise, T lymphocytes infiltrate the visceral adipose tissue (VAT), where they play pivotal roles in the regulation of mechanisms at the intersection of metabolism and immune tolerance (14–17). However, scanty information exists on the T-cell activation in the bone marrow (BM), a tissue crucial for the production and maturation of immune cells.
The BM not only functions as a primary B lymphocyte-producing organ but also represents a site where immune cells are formed, mature, and/or recirculate. Furthermore, the BM plays a key role as a secondary lymphoid organ, crucial for CD4 and CD8 cell-related responses, as well as a site of preferential homing and persistence for memory T cells (18, 19). These comprise subsets with important and specific functionalities, such as T cells, B cells, dendritic cells (DCs), and macrophages. In the BM, memory T cells that maintain a state of readiness after tissue injury can rapidly expand and mount a robust secondary cytotoxic response in case of new challenges, more potently than that afforded by other lymphoid and non-lymphoid organs (20, 21). T cells can home into the BM from the circulation and persist within this organ contributing to systemic immune memory (22). Moreover, the BM contains central CD4 Foxp3 Tregs, which not only suppress the effector T cells but also exert non-immune actions, such as vascular protection, metabolic homeostasis, and tissue repair (23, 24). Immune regulation occurs in the BM through direct cell–cell contacts and soluble factors, including cytokines and chemokines.
Several studies have shown that people with T2D incur a remarkable remodeling of BM, consisting of an accumulation of inflamed adipocytes and depletion of hematopoietic, neuronal, and vascular cells (25–28). These changes impinge on hematopoietic cell functions and contribute to altering the profile and mobilization capacity of hematopoietic stem/progenitor cells (HSPCs) (29, 30). An altered phenotype of released HSPCs reportedly conveys antiangiogenic and proapoptotic features to the peripheral vasculature, thereby contributing to diabetic complications (31). Based on this background, we posit that T2D could also impact BM immune cell homeostasis.
Modern immunomodulatory drugs, which—at variance from classical immunosuppressive agents—disable just a particular type of lymphocyte or interfere with the initial state of lymphocyte activation, leaving the global immune response intact, are attracting much clinical attention. One of these compounds, abatacept, exerts anti-inflammatory activity via the selective modulation of T-cell co-stimulation. In Europe, abatacept is approved for use in patients with highly active and progressive rheumatoid arthritis (32). Interestingly, clinical studies in patients with rheumatoid arthritis have shown that abatacept treatment reduced the risk of diabetes and improved markers of metabolic control, through an anti-inflammatory mechanism preserving β-cell function (33–35). However, it remains unknown if abatacept can impact adaptive immune response and preserve target organ damage in diabetes.
The present study was a proof-of-concept investigation assessing the frequencies and activation state of immune cell subsets in the BM of patients with T2D compared with non-diabetic (ND) individuals, with a focus on activated and memory T cells. After confirming human results in a murine model of T2D, we performed a therapeutic preclinical study in a murine model of T2D to determine the effect of abatacept on adaptive immunity, cytokine secretion, metabolic control, and cardiac function.
Research Design and Methods
Human Studies
Patients undergoing hip replacement surgery were recruited under informed consent at the Avon Orthopedic Centre, Southmead Hospital, Bristol, UK. The study protocol complied with the Declaration of Helsinki was covered by institutional ethical approval (REC14/SW/1083 and REC14/WA/1005) and was registered as an observational clinical study in the National Institute for Health Research Clinical Research Network Portfolio, UK Clinical Trials Gateway. Demographic and clinical data of the 24 enrolled subjects are reported in Table 1.
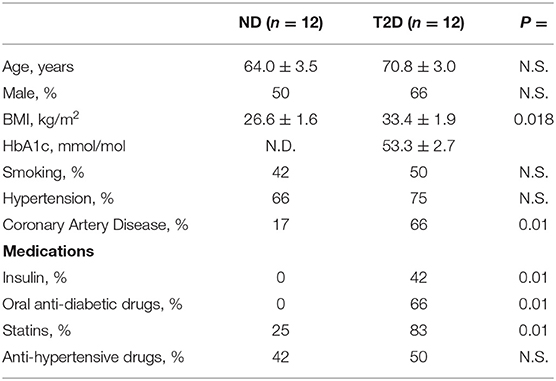
Table 1. Characteristics of study subjects.
Type 2 diabetes was diagnosed according to the American Diabetes Association guidelines. Specifically, it was defined as (1) patient/referring doctor reports a previous diagnosis of diabetes, and (2) HbA1c > 48 mmol/mol. We excluded subjects with acute disease/infection, inflammatory/immune diseases, current or past hematological disorders or malignancy, unstable angina, recent (within 6 months) myocardial infarction or stroke, heart failure, liver failure, dialysis, and pregnancy.
Human Bone Marrow Collection and Processing
Bone marrow samples were obtained from scooped femur heads remaining from hip replacement surgery. Only material that would otherwise be discarded was collected for the study. During the replacement procedure, the femoral head was removed with a saw, and the proximal femoral canal was opened with reamers and rasps. The BM displaced into the wound was scooped into a sterile pot with a curette. The sample was decanted into a collection tube with 0.5 mol/L ethylenediaminetetraacetic acid (EDTA), pH 8 (Thermo Fisher Scientific, Gloucester, UK, #28348) labeled, and placed in a fridge for collection by the investigator within 1 h.
The diluted BM suspension was passed through a 100-μm filter to remove bone fragments and cell clumps. The sample was stratified on Ficoll Histopaque 1077 (Sigma-Aldrich, St. Louis, MO, USA, #10771) and centrifuged without acceleration or brake at 300 × g for 45 min at 24°C. Mononuclear cells sedimented at the interphase were then collected, washed twice with phosphate buffered saline (PBS), assessed for viability by trypan blue staining (Thermo Fisher Scientific, #15250061), and counted at microscopy. Plasma was separated from freshly collected human BM mononuclear cells (BMMCs) through centrifugation at 3,500 rpm for 10 min and frozen immediately at −80°C.
Flow Cytometry Analysis of Human Bone Marrow Samples
The following monoclonal antibody combinations were used to characterize the phenotype of different immune cell subsets: anti-CD45RO-BB515 (#564529), anti-CD3-PE-cy5.5 (#340949), anti-CD4-PE-cy5.5 (#35-0047-42), anti-CD8-PE-cy5 (#15-0088-42), anti-CD45RA-BV605 (#562886), anti-CD25-PE-cy7 (#557741), anti-CD69-APC (#310910), anti-CCR7-Aleza700 (#565867), anti-CD45 BV771 (#304050), anti-CD56PE-cy7 (#557747), anti-CD8-BV510 (#563256), anti-CD19-APC (#340722), anti-CD4BV421 (#565997), anti-CD3PE #340662), and anti-CD19BV785 (#363028). All antibodies were titrated for optimal staining performance.
Cell viability was determined using Zombie NIR™ Fixable Viability Kit (BioLegend, San Diego, CA, USA; #423106). Briefly, 70 × 106 BMMCs (at a concentration of 1 × 10⁶ cells/ml) were stained with Zombie NIR™ Fixable Viability Kit for 30 min at room temperature (RT). Then, the cells were washed with Flow Cytometry Staining Buffer (FACS buffer) (eBioscience™ Flow Cytometry Staining Buffer, eBioscience, Inc., San Diego, CA, USA; #00-4222-57) at 300 × g for 10 min. The staining protocol included the use of an Fc blocking antibody (True-Stain Monocyte Blocker, BioLegend, #426102) to control for non-specific binding and background fluorescence. Each sample was added with 100 μl Fc blocking antibody (diluted in FACS buffer at 1:50 ratio) and incubated on ice for 20 min. The cells were then centrifuged at 500 × g for 5 min at 4°C. Subsequently, BMMCs were stained with a defined combination of antibodies, at the appropriate dilutions, in FACS buffer for 20 min at 4°C. Cells were washed twice in FACS buffer and stained with 1% PFA. A minimum of 2 × 10⁶ cells/ml was assayed in the flow cytometry studies. Fluorescence minus one (FMO) controls were included in building multicolor flow cytometry panels. Moreover, BD Comp Beads (#560497) were used to optimize fluorescence compensation settings in multicolor flow cytometry studies. The analysis was performed on a BD LSR II Fortessa X20 (Becton Dickinson, San Jose, CA, USA) using FlowJo software (TreeStar, San Carlos, CA, USA).
Animal Studies
Experiments were performed following the Guide for the Care and Use of Laboratory Animals (The Institute of Laboratory Animal Resources, 1996) and with the approval of the University of Bristol and the British Home Office (license 30/3373). As a model of T2D, we used a 10-week-old male obese leptin receptor homozygous mutant BKS.Cg-+Leprdb/+Leprdb/OlaHsd (db/db) mice (Envigo, Blackthorn, UK). Age- and sex-matched lean heterozygous + BKS.Cg-+Leprdb/+LeprWT/OlaHsd (db/WT) mice served as controls. Animals were maintained in the high standard animal facilities of the University of Bristol, under the surveillance of specialists trained in husbandry and welfare of the species. The animals fed standard chow (EURodent Diet 22%, www.LabDiet.com) and provided water ad libitum. Glucose was measured in urine using Diastix colorimetric reagent strips (Bayer, Reading, UK). At sacrifice, the BM, spleen, and peripheral blood were collected according to the procedures described below.
Abatacept Treatment
Abatacept (250 mg lyophilized powder per vial, Bristol-Myers Squibb, Princeton, NJ, USA) was purchased from the Bristol University Hospital Pharmacy. The drug was reconstituted at 2× of the concentration required in sterile distilled water (25 mg/ml). The vial was gently swirled until the complete dissolution of the compound. The reconstituted material was diluted with sterile pH-checked PBS for in vivo use on the same day of preparation.
A cohort of twelve 10-week-old male db/db mice was randomized for treatment with abatacept or vehicle. Mice were injected intraperitoneally with 300 μg abatacept in 100 μl PBS, three non-consecutive times a week, for 4 weeks, while controls received the vehicle. The dosage and control choice were adapted from a previous abatacept study in a murine model of cardiomyopathy (36). Dimensional and functional parameters of the heart were measured before sacrifice using a Vevo3100 echocardiography system, using an MX400 transducer (Fujifilm VisualSonics Inc, Toronto, ON, Canada). The echocardiography study was performed with mice under isoflurane anesthesia (2.5% for induction, followed by 0.5–1.2% as appropriate to maintain the heart rate between 400 and 450 bpm).
Collection and Processing of Bone Marrow
At sacrifice, whole BM cells were obtained from the mouse tibiae and femora. Both ends of the bones were cut using sterile, sharpened scissors. BM cells were harvested by repeated flushing of the bone shaft in 1 ml PBS in a tube using a syringe provided with a 23-gauge needle. After removal of aggregates from the BM suspension by vigorous pipetting and filtration through a 70-μm mesh nylon strainer (#07-201-431, Thermo Fisher Scientific), the sample was centrifuged at 300 × g for 10 min. The pellets were resuspended to obtain a suspension of 2 × 10⁶ cells/ml in fresh PBS for use in cytometry analysis. Supernatants were collected for cytokine assays and stored at −20°C.
Collection and Processing of Splenocytes
Mononuclear spleen suspensions were prepared by gently pressing the spleen tissue with the flat end of a syringe in 5 ml of Roswell Park Memorial Institute Medium (RPMI) containing 1% pen/strep, on a 100-mm culture dish. Then, the cell suspension was passed through on a 70-μm cell strainer into a 50-ml tube. After washing twice with 5-ml RPMI, the cell suspension was centrifuged at 300 × g for 10 min, and cells were resuspended in eBioscience™ 1 × red blood cell (RBC) Lysis Buffer (#00-4333-57) on ice for 3 min. Finally, splenocytes were washed, resuspended in PBS at a concentration of 2 × 10⁶ cells/ml, and counted.
Collection and Processing of Peripheral Blood
At sacrifice, the blood was harvested with an EDTA-coated syringe from the left ventricle and placed into Eppendorf tubes (Eppendorf, Hamburg, Germany). Blood was centrifuged for 15 min at 3,000 rpm (1,500 × g) at 4°C. After centrifugation, the plasma was removed, and the pellet was incubated with 1× RBC Lysis Buffer on ice for 10 min. Mononuclear cells were then resuspended at 2 × 10⁶ cells/ml in PBS. Plasma was stored at −80°C for later analysis.
Flow Cytometry Analyses
Immunofluorescence surface staining was performed by adding a panel of directly conjugated mAb to freshly prepared BMMCs, splenocytes, and peripheral blood mononuclear cells. Before staining, cell viability was assessed using Zombie NIR™ Fixable Viability Kit (#423106) for 30 min at RT. For all experiments, cell suspensions were preincubated with anti-CD16/CD32 mAb (BioLegend) to block FcγRII/III receptors. Cell staining was performed in the dark for 20 min at 4°C in FACS staining buffer (BD, #554656). The following reagents were used: CD4-PE-cy5.5 (#35-0042-82), CD8-PE-cy5 (#15-0083-81), CD25-FiTC (#130-120-172), CD45-BV785 (#103149), CD69 PE-Vio®770 (#30-103-944), NK1.1-AF700 (#108729), CD19-BV510 (#115545), CD44-Super Bright (#63-0441-82), CD62l BV650 (#564108), F4/80-APC (#123115), CD206-PE (#141705), CD11b-PE-cy 7 (#101215), CD80-PEdazzle (#104737), CD11c-BV605 (#117333), and MHCII-AF700 (#107621). The proliferation of CD4+ and CD8+ cells was assessed using the KI67-BV510 marker (#563462). Cells were fixed and permeabilized using the BD Pharmingen™ Transcription Factor Buffer Set Kit (#562574; BD Pharmingen Inc., San Diego, CA, USA). A minimum of 2 × 10⁶ cells/ml was assayed in the flow cytometry studies. BD Anti-Mouse Ig, κ/Negative Control (BSA) Compensation Plus (7.5 μm) Particles Set (#560497) were used to optimize fluorescence compensation settings in multicolor flow cytometry analysis. Cells were analyzed on LSR II Fortessa X20 Flow Cytometry instrument using the FlowJo software.
Cytokine Profiling
Cytokine content in plasma separated from BM was measured using the Proteome Profiler Human Cytokine Array Kit (Research & Diagnostic Systems, Inc, Minneapolis, MN, USA; #ARY005B). A dedicated mouse Cytokine Array Kit (#ARY006) was used to measure cytokines in the BM supernatants and the plasma isolated from the peripheral blood. The cytokines were detected by exposing the membrane to X-ray film, which was subsequently developed with ChemiDoc XRS+ System by Bio-Rad (Hercules, California, USA). The mean luminescence was normalized to reference spots from the same membrane following background correction. Pixel densities on developed X-ray film were analyzed using Fiji—ImageJ image analysis software (National Institutes of Health, Bethesda, MD, USA).
Insulin and Glucose Assays
Plasma levels of insulin and glucose were measured using colorimetric assay kits (from Thermo Fisher Scientific, #EMINS, and Abcam, #ab65333, respectively). The quantitative insulin sensitivity check index (QUICKI) was calculated according to the formula QUICKI = 1/(logI0 + logG0), where I is insulin (μU/ml) and G is glucose (nmol/μl). In addition, the HOMA-IR formula was calculated as fasting insulin multiplied by fasting glucose divided by 22.5.
Statistical Analysis
Values are presented as mean ± SEM. Two-tailed independent-samples t-test was used to compare groups with T2D and without diabetes. Value of p < 0.05 was considered statistically significant.
Results
T2D Increases the Frequency of T Lymphocytes in Human BM
The two studied groups were similar regarding age and sex distribution (Table 1). The average body mass index (BMI) was 26.6 ± 1.6 in ND subjects and 33.4 ± 1.9 in patients with T2D, thus classifying them as overweight and obese, respectively. Coronary artery disease was 3.9-fold more frequent in patients with T2D. In addition, the assessment of HbA1c levels (53.3 ± 2.7 mmol/mol) indicated that the patients with T2D had an acceptable metabolic control with insulin (42%) and/or oral anti-diabetic drugs (66%).
The flow cytometry analysis of BM cells was performed on data of the CD45/SSC gating, where lymphocytes showed the highest CD45 fluorescence intensity and the lowest SSC signal (Figures 1A–C). As indicated in section Research Design and Methods, the FMO control was used as a control in all the experiments. Cell viability was consistently >90% (Figure 1B). There were no differences in the total cellularity per ml of sample (data not shown) and the frequency of CD45 cells between T2D and ND groups (Figure 1C, p = 0.88). We next analyzed lymphocytes, namely, T cells (CD45+CD3+), natural killer (NK) cells (CD45+CD16+CD56+), and B cells (CD45+CD19+) using the gating strategy shown in Figure 1D. This characterization demonstrated an increase in the frequency of T cells (2.47-fold, p < 0.001) and NK cells (2.36-fold, p = 0.005) in T2D compared with ND, whereas B cells did not differ between the two groups (p = 0.17) (Figures 1E–G). T lymphocytes were further subdivided into CD4+ and CD8+ cells. Results indicated an increased frequency of both CD4+ (2.77-fold, p = 0.001) and CD8+ T cells (1.84-fold, p = 0.01) in T2D compared with ND (Figures 1H–J). Values are mean, with single points indicating individual samples.
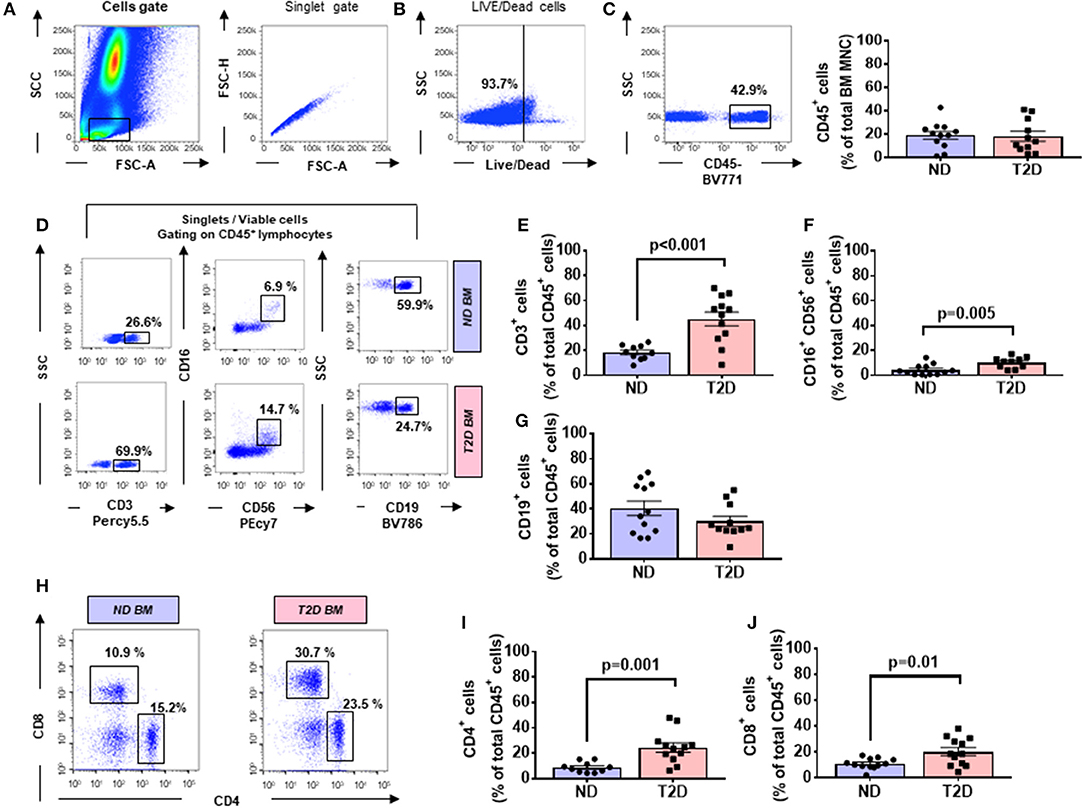
Figure 1. Flow cytometry analysis of immune cells in human bone marrow shows type 2 diabetes (T2D) is associated with an increased abundance of CD4+ and CD8+ cells. Scooped bone marrow (BM) from femoral head leftovers of orthopedic surgery was obtained from patients previously diagnosed to have T2D and controls without T2D (ND). (A) Lymphocytes were gated based on SSC-A vs. FSC-A, and singlets were selected from the FSC-A vs. FSC-H dot plot. (B) Subsequently, dead cells were excluded with Zombie NIR™ Fixable Viability Kit. (C–G) Lymphocytes were gated based on SSC-A vs. FSC-A, and singlets were selected from CD45+ cells to identify population subsets according to the staining for CD3 (T lymphocytes), CD19 (B lymphocytes), and CD16/CD56 (NK cells). (H–J) Gating for CD4 and CD8 (H) Bar graphs showing the frequency of CD4+ cells (I) CD8+ cells (J). Reported frequencies are illustrative of a representative case for each group. Values are mean ± SEM, with each point representing an individual case.
T2D Increases the Frequency of Activated T Lymphocytes
T cells are activated through the presentation of antigens expressed on the surface of antigen-presenting cells (APCs). Once activated, they divide rapidly and secrete cytokines that regulate and sustain the immune response. Previous studies have shown that the human BM contains T cells in the activated state as denoted by the expression of CD69 (37). Here, we report that BM CD4+ and CD8+ T cells from patients with T2D have a heightened activation state compared with ND individuals, as indicated by an increased frequency of CD69 (Figure 2A). The highest expression of CD69 was observed in the CD4+ fraction, which was increased 3.64-fold in T2D (p = 0.003 vs. ND), while the increase was 1.79-fold for the CD8+ fraction (p = 0.05 vs. ND) (Figures 2B,C). We looked for confirmation of T-cell activation by checking the expression of the late marker CD25. Data indicate a more modest difference between the two groups, not reaching statistical significance (p = 0.15 and 0.07, for CD4+ and CD8+ cells, respectively) (Figures 2D,E).
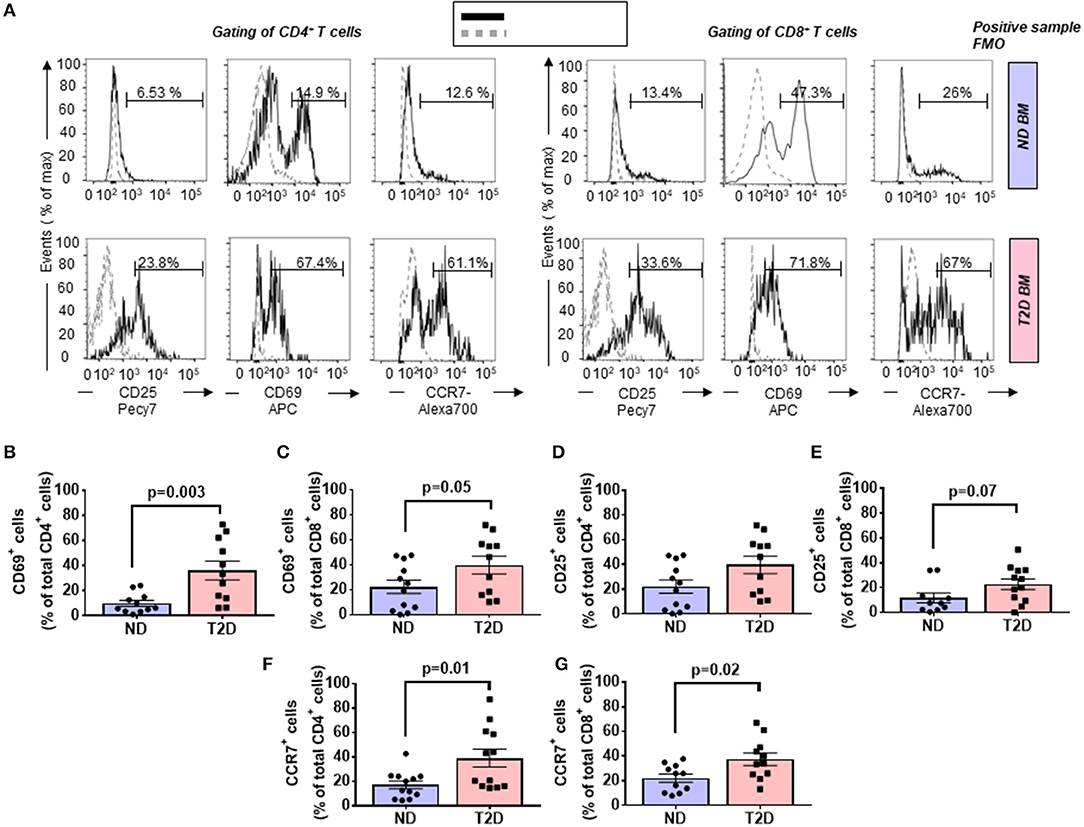
Figure 2. Increased relative abundance of activated T cells in the bone marrow (BM) of patients with T2D. (A) Representative histogram overlays of CD4+ (left panels) and CD8+ cells (right panels) expressing the activation markers CD25 (late marker), CD69 (early marker), and chemokine receptor CCR7 (black line histogram) and FMO control (gray dotted histogram). BM-MCs were stained as described in Materials and Methods with mAb mixture containing BV771-CD45, PE-cy5-CD8, PE-cy5.5-CD4, PE-cy7-CD25, APC-CD69, and Alexa700-CCR7. Reported frequencies are illustrative of a representative case for each group. (B,C) Relative frequency of CD69 within CD4+ and CD8+ cells. (D,E) Relative frequency of CD25 within CD4+ and CD8+ cells. (F,G) Relative frequency of CCR7 within CD4+ and CD8+ cells. Values are mean ± SEM, with each point representing an individual case.
Type 2 Diabetes Increases the Frequency of CCR7-Expressing T Lymphocytes
The CC-chemokine receptor 7 (CCR7) and its ligands play a key role in lymphocyte homing to lymphoid tissue. In the T2D group, both CD4+ and CD8+ lymphocytes expressed CCR7 with higher frequency than the ND group (2.27-fold, p = 0.01; and 1.69-fold, p = 0.02, respectively) (gating is shown in Figure 2A and results in Figures 2F,G). Moreover, we combined CCR7 and CD45RA antigens in the flow cytometry analysis to distinguish naïve and memory subpopulations (gating strategy is shown in Figure 3A). Naive CCR7+CD45RA+ T cells were more abundant in T2D, with 19.9 ± 5.4% of the CD4+ cell subfraction expressing this phenotype (2.46-fold more than ND, p = 0.04) (Figure 3B). Within CD8+ cells, naive T lymphocytes averaged 16.2 ± 3.2% (1.76-fold more than ND, p = 0.09) (Figure 3C). Naive lymphocytes are patrolling precursor cells that travel in and out of lymphoid organs in search of cognate antigens. Hence, changes in the local microenvironment might have contributed to the recruitment and homing of naive cells to the BM. Here, APCs could induce the differentiation into immune cells capable of effector responses. To test this possibility, we next investigated the influence of T2D on central memory (TCM, CCR7+ CD45RA−), effector memory (TEM, CCR7− CD45RA), and “revertant” terminally differentiated T memory cells (TEMRA, CCR7− CD45RA+). TCM and TEM cells were similar between groups (Figures 3D–G), whereas T2D was characterized by a reduction in the frequency of CD4+ and CD8+ TEMRA (0.34-fold, p = 0.006; and 0.47-fold vs. ND, p = 0.009, respectively) (Figures 3H,I).
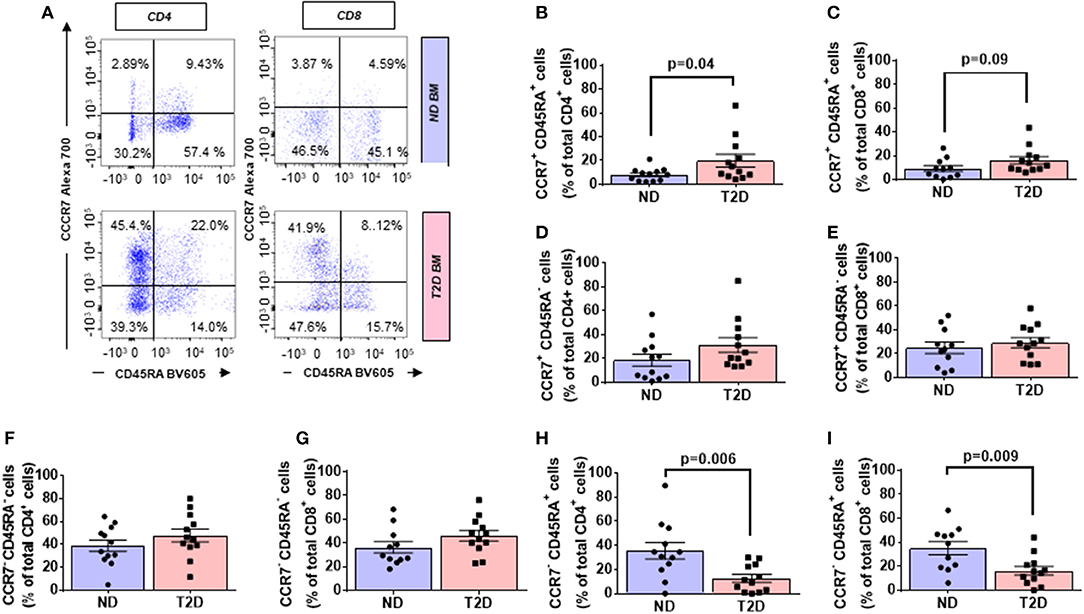
Figure 3. Increased relative abundance of CCR7 expressing T lymphocytes in BM of patients with T2D. (A) Gating strategy for identification of CCR7 and CD45RA. The numbers indicate the percentage of naïve T cells (CCR7+ CD45RA+, top right quadrant), central memory T cells (TCM, CCR7+ CD45RA−, top left quadrant), effector memory T cells (TEM, CCR7− CD45RA−, bottom left quadrant), and terminal effector T cells (TEMRA, CCR7− CD45RA+, bottom right quadrant) gated on the forward and side scatter of the lymphocyte populations. Reported frequencies are illustrative of a representative case for each group. (B–I) Bar graphs showing the relative frequency of CCR7+ CD45RA+ naive cells in CD4+ (B) CD8+ cells (C) CCR7+ CD45RA− TCM cells in CD4+ (D) and CD8+ cells (E), CCR7− CD45RA− TEM cells in CD4+ (F) and CD8+ cells (G) CCR7−CD45RA+ TEMRA cells in CD4+ (H) and CD8+ cells (I). Values are mean ± SEM, with each point representing an individual case.
A multivariable regression model including age, sex, and BMI as covariates confirmed the differences emerging from the univariate analysis illustrated in previous paragraphs.
Altered Chemokine Profile in the BM of Patients With T2D
We next examined the expression of a panel of cytokines, chemokines, and proteins in BM perfusates from three patients with T2D and three ND subjects. Of 104 measured factors, 65 were upregulated and 2 downregulated in T2D BM, considering a threshold fold change ≥2 (Figure 4A, Table 2).
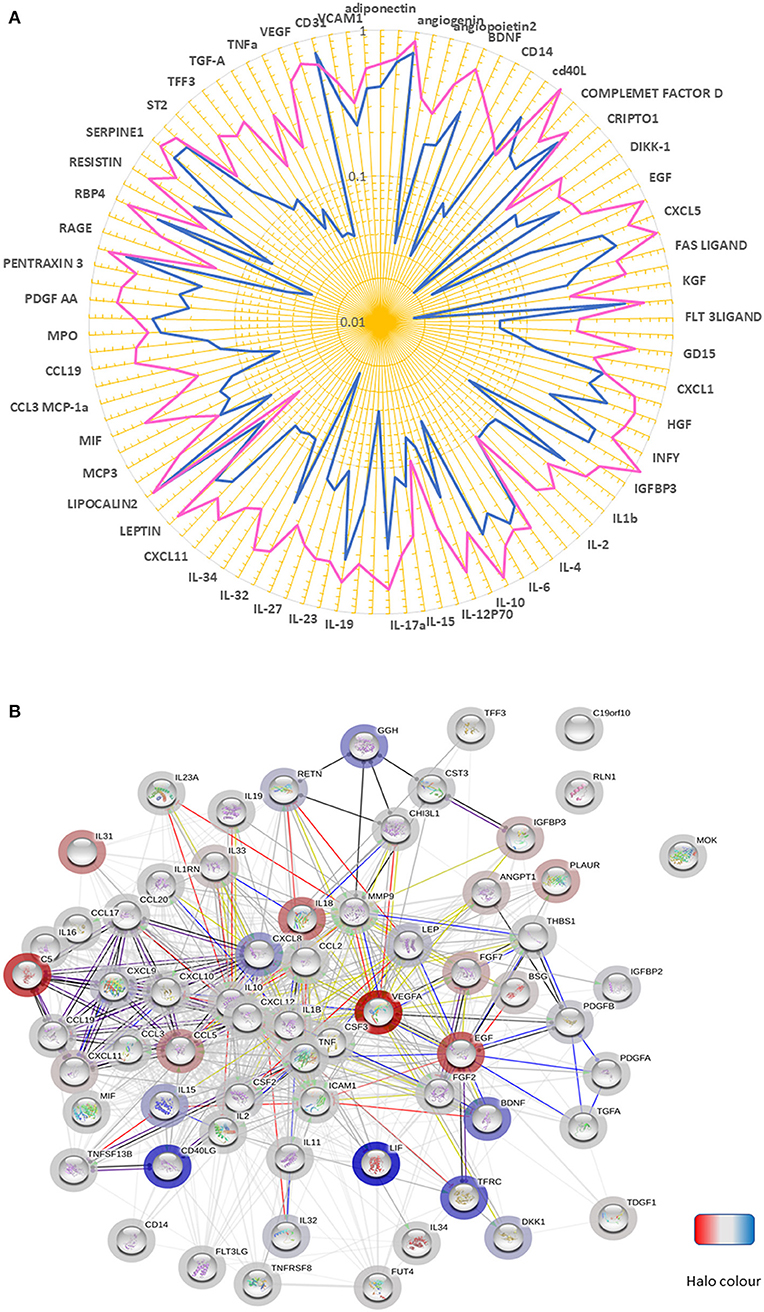
Figure 4. Altered chemokine profile in BM of patients with T2D. (A) Spider graph showing the expression levels of chemokines, cytokines, and proteins measured using a proteome profiling array in bone marrow perfusates of three subjects per group. Pink line (T2D) and the blue line (ND). (B) The network of factors found to be differentially regulated between T2D and ND. The bar halo color is based on the rank of the protein in the set of input values. Action types are shown as:  .
.
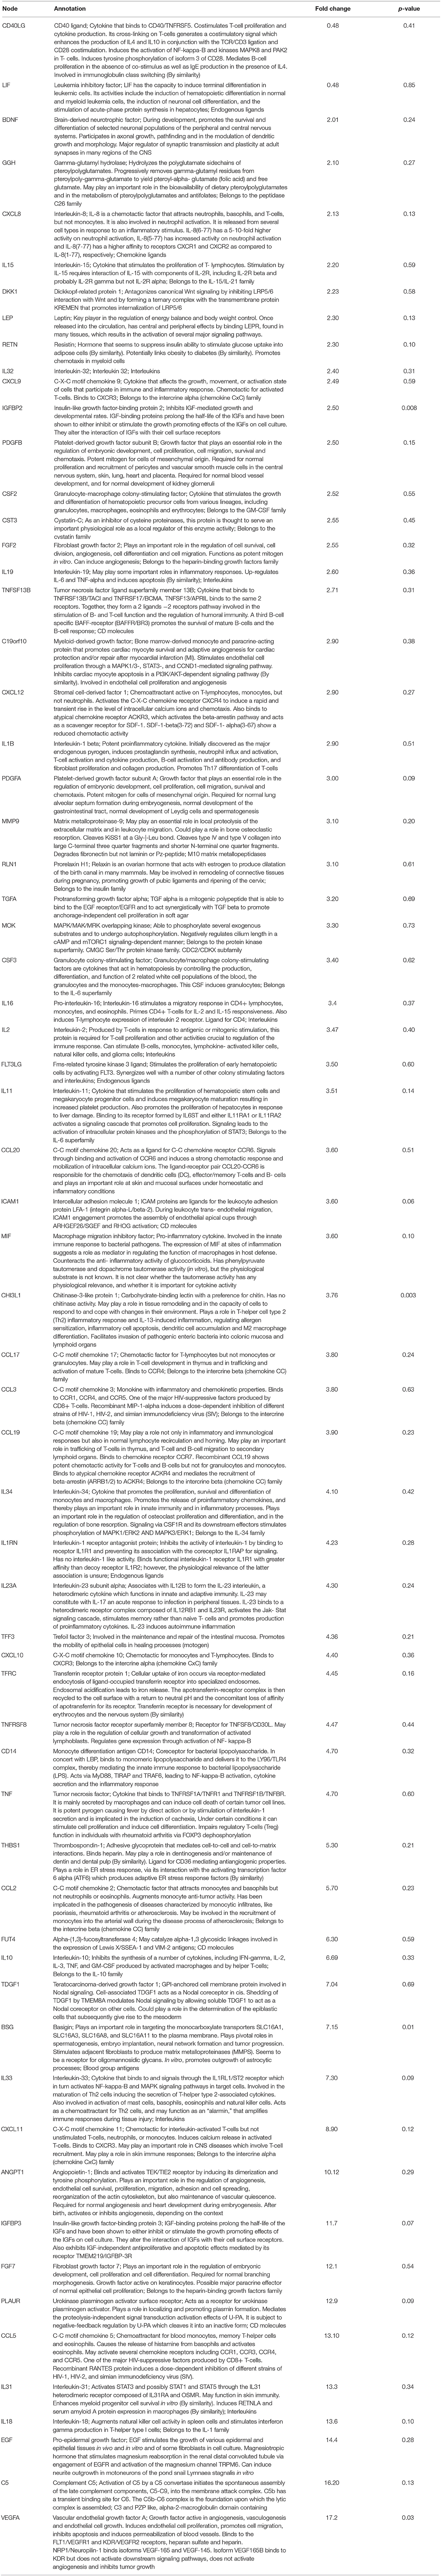
Table 2. List of modulated factors in human bone marrow with value of the fold change vs. ND.
An analysis conducted using the STRING database revealed that most of the differentially regulated factors were connected in a network with a PPI enrichment p-value: <1.0e−16 (Figure 4B). The highly significant interaction highlights the biological relevance of the phenomenon. Interestingly, in the cytokine series, IL-18, and IL-31 were the most upregulated (both over 13-fold). Among chemokines, CXCL10 and CXCL11 (CXCR3 receptor ligands), MCP-1 (CCR2 ligand), and CCL19 (CCR7 receptor ligand), which are implicated in T-cell migration to sites of inflammation, emerged as the most upregulated factors (all over 3.5-fold). Another ligand for CCR7, CCL21, was not measured because not included in the array, with this representing a limitation of the study. Twenty-six proteins were modulated, including VEGF-A, Complement C5, and EGF (all showing an increase >14-fold). Moreover, basigin (alias CD147), which functions as a receptor for soluble cyclophilins and is involved in cyclophilin-mediated viral infection (38), was upregulated in T2D, together with its transcriptional target MMP-9; whereas LIF, an inhibitor of immune response afforded by T lymphocytes (39), and CD40L, a costimulatory ligand for CD40 involved in modulation of lymphocyte activation (40), were downregulated. Analysis of covariance detected a strong overall effect of T2D on the analyzed factors (p < 0.001). Multiple comparison analysis documented a significant difference regarding VEGF-A (p = 0.03), basigin (p = 0.01), chitinase-3-like protein 1 (p = 0.003), and insulin-like growth factor-binding protein 2 (p = 0.008).
Analysis of Murine BM Confirms the Impact of T2D on the Frequency and Activation of T Lymphocytes
We next sought confirmation about the influence of T2D on immune cells by assessing the phenotype of different cell populations in the BM, spleen, and peripheral blood from 10-week-old db/db and control age-matched wt/db mice (Figure 5A). Confirmation of the diabetic state in the db/db group was achieved by the verification of persistent overt glycosuria. Flow cytometry analysis demonstrated db/db mice had substantial increases in the frequency of CD4+ and CD8+ cells in the BM (1.88-fold, p = 0.02; and 2.23-fold, p = 0.005, respectively), spleen (1.53-fold, p < 0.0001; 1.27-fold, p = 0.04, respectively), and peripheral blood (1.66-fold, p = 0.007; and 1.71-fold, p = 0.004) (Figures 5B,C), which were associated with decreased abundance of CD19+ B cells in the BM (0.67-fold, p < 0.0001), but not in the spleen or peripheral blood (Figure 5D). Regarding NK cells, higher numbers were found in BM of db/db mice (1.77-fold, p = 0.01), whereas no difference was observed in the other two districts (Figure 5E).
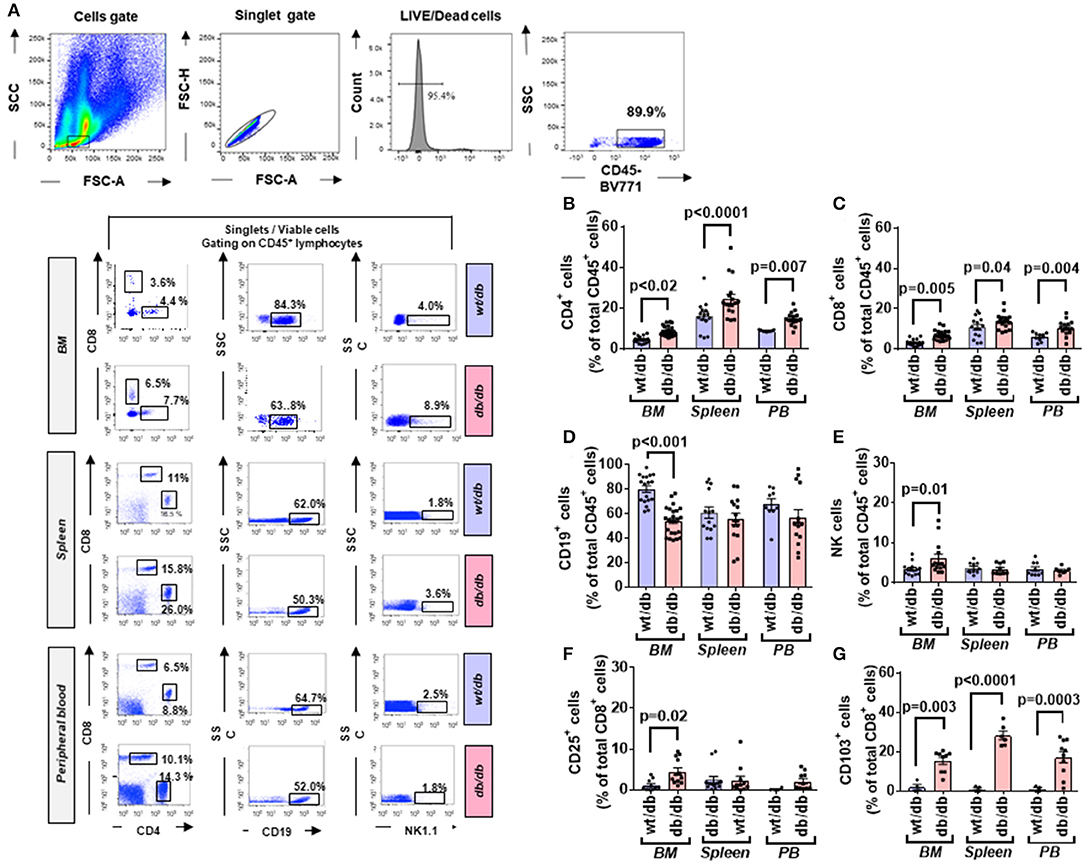
Figure 5. Higher frequency and activated state of T lymphocytes in diabetic mice. (A) Gating strategy for identification of CD4, CD8, CD19, and NK1.1 positive cells in the BM, spleen, and peripheral blood of wt/db and db/db mice. Reported frequencies are illustrative of a representative case for each group. (B) Relative frequency of CD4+ cells. (C) Relative frequency of CD8+ cells. (D) Relative frequency of B cells. (E) Relative frequency of NK cells. (F) Relative frequency of CD8+ cells expressing the activation marker CD25. (G) Relative frequency of CD8+ cells expressing CD103. Values are mean ± SEM, with each point representing an individual case.
We also extended the analysis beyond lymphocytes to macrophages, identified as CD11b+F4/80+ cells; they were more abundant in db/db mice at the level of BM (9.25 ± 0.89 vs. 5.77 ± 0.58% in wt/db, p = 0.04) and peripheral blood (15.25 ± 3.02 vs. 8.17 ± 1.64% in wt/db, p = 0.003), but not in the spleen (4.25 ± 0.76 vs. 2.02 ± 0.40% in wt/db, p = 0.56). The M1 subtype, represented by CD80+, showed a tendency to increase in the examined sites, albeit not statistically significant (BM: 8.15 ± 1.25 vs. 4.96 ± 1.12% in wt/db, p = 0.07; spleen: 3.91 ± 0.46 vs. 2.53 ± 0.46% in wt/db, p = 0.07; peripheral blood 7.68 ± 2.07 vs. 3.96 ± 1.16% in wt/db, p = 0.18). No difference was observed between groups for CD206+ M2 macrophages or MHCII+CD11c+CD11b−CD123− DC (data not shown).
Next, we assessed the specific subsets of CD4+ and CD8+ cells using immunostaining for the marker of activation CD25. No difference between db/db and wt/db mice was observed regarding CD4+ cells (data not shown). In contrast, as shown in Figure 5F, higher levels of CD8+ cells stained positive for CD25 in db/db mice at the level of the BM (3.87-fold, p = 0.02) but not in the spleen or peripheral blood. Finally, we determined the expression of CD103, an integrin that identifies tissue-resident-memory CD8+ cells with an immunosurveillance and protective function (41) and is dynamically involved in the functional differentiation of some cytotoxic T cells (42). As shown in Figure 5G, CD8+CD103+ cells were higher in db/db mice at the level of all examined tissue (p < 0.01).
Diabetic Mice Show a Redistribution of Naive and Central Memory T Cells From Peripheral Blood (PB) to the BM
CD4+ and CD8+ cells were further categorized into naïve and memory phenotypes based on the expression CD44 and CD62L, with the CD44−CD62Lhigh population being considered naïve, CD44highCD62high population considered TCM, and the CD44highCD62L− population considered TEM (Figure 6A).
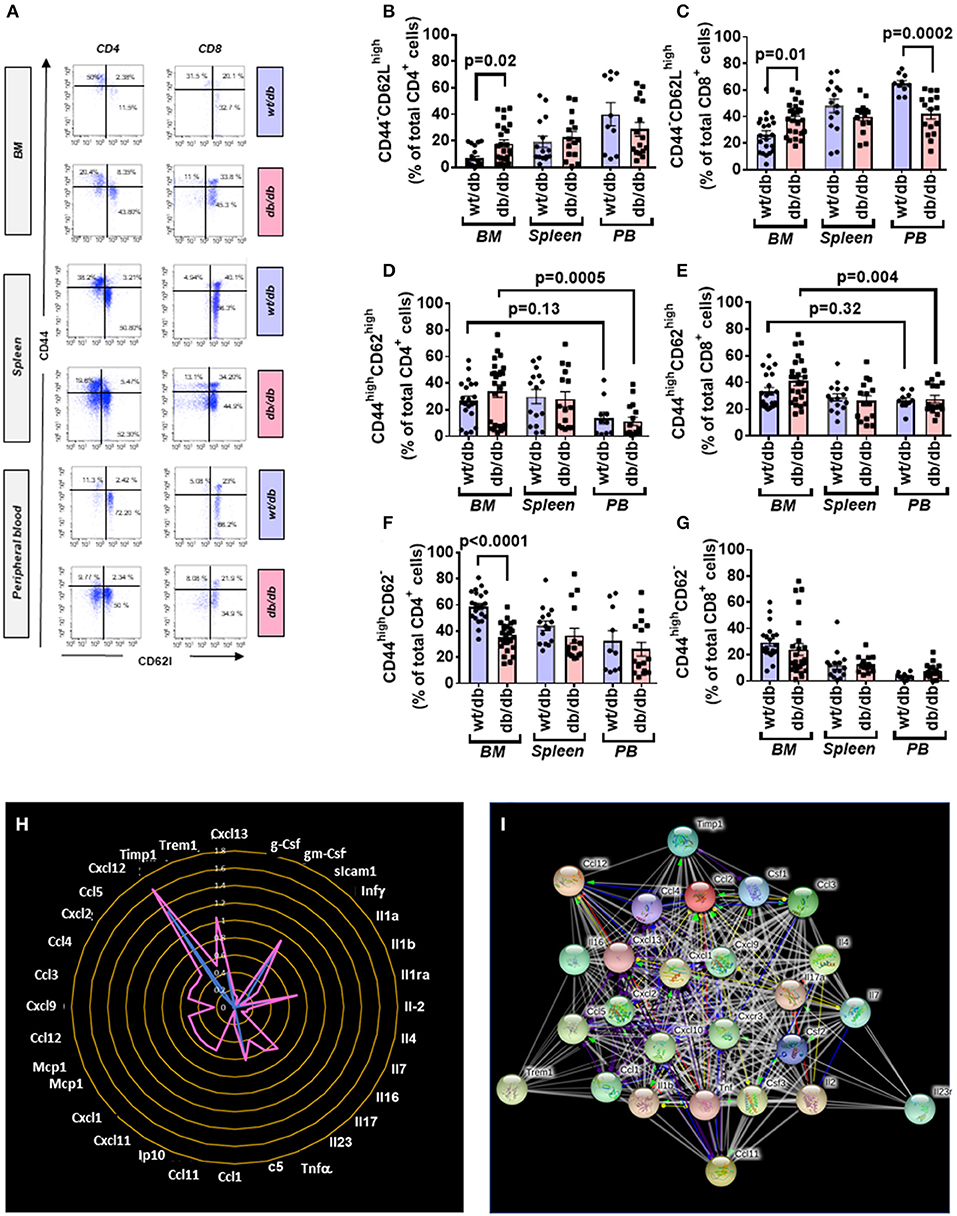
Figure 6. Increased central to peripheral memory cell gradient in diabetic mice. (A) Gating strategy for identification of CD44 and CD62L within CD4+ and CD8+ cells in the BM, spleen, and peripheral blood of wt/db and db/db mice. Reported frequencies are illustrative of a representative case for each group. (B) Relative frequency of CD44−CD62Lhigh population within CD4+ cells. (C) Relative frequency of CD44−CD62Lhigh population within CD8+ cells. (D) Relative frequency of CD44highCD62Lhigh population within CD4+ cells. (E) Relative frequency of CD44highCD62Lhigh population within CD8+ cells. (F) Relative frequency of CD44highCD62L− population within CD4+ cells. (G) Relative frequency of CD44highCD62L− population within CD8+ cells. Values are mean ± SEM, with each point representing an individual case. (H) Radar graph of modulated cytokine in BM of db/db mice. Measurements performed in a pool of four mice per group. (I) STRING network of modulated factors.
Naïve cells were increased in BM of db/db mice (CD4+: 2.70-fold, p = 0.02; CD8+: 1.44-fold p = 0.01), unaltered in the spleen, and reduced in the peripheral blood (CD4+: 0.71-fold, p = 0.26; CD8+: 0.64-fold, p = 0.0002), which resulted in the abrogation of the peripheral to BM gradient seen in the control mice (Figures 6B,C).
Type 2 diabetes on central memory cells did not show differences between groups. Nonetheless, db/db mice manifested a positive gradient between the BM and peripheral blood (CD4+: 2.98-fold, p = 0.0005; CD8+: 1.49-fold, p = 0.004) compared with control mice, which did not show a difference between the two districts (CD4+: p = 0.13; CD8+: p = 0.32) (Figures 6D,E). CD4+ TEM cells were less abundant in BM of db/db mice (0.61-fold, p < 0.0001) but unchanged in the other districts (Figure 6F). There was no difference between groups concerning CD8+ TEM cells (Figure 6G).
Altered Cytokine Profile in BM of db/db Mice
Having shown the activation and redistribution of different classes of immune cells in db/db mice, we next examined if this was associated with an alteration of the cytokines content in the BM. Of 40 factors tested, 32 were upregulated in the BM of diabetic mice compared with the wt/db controls. Of these, 22 were uniquely expressed in db/db mice (Figures 6H,I, Table 3). Results indicate the presence of an inflammatory environment in BM, which may account for the recruitment and activation of immune cells.
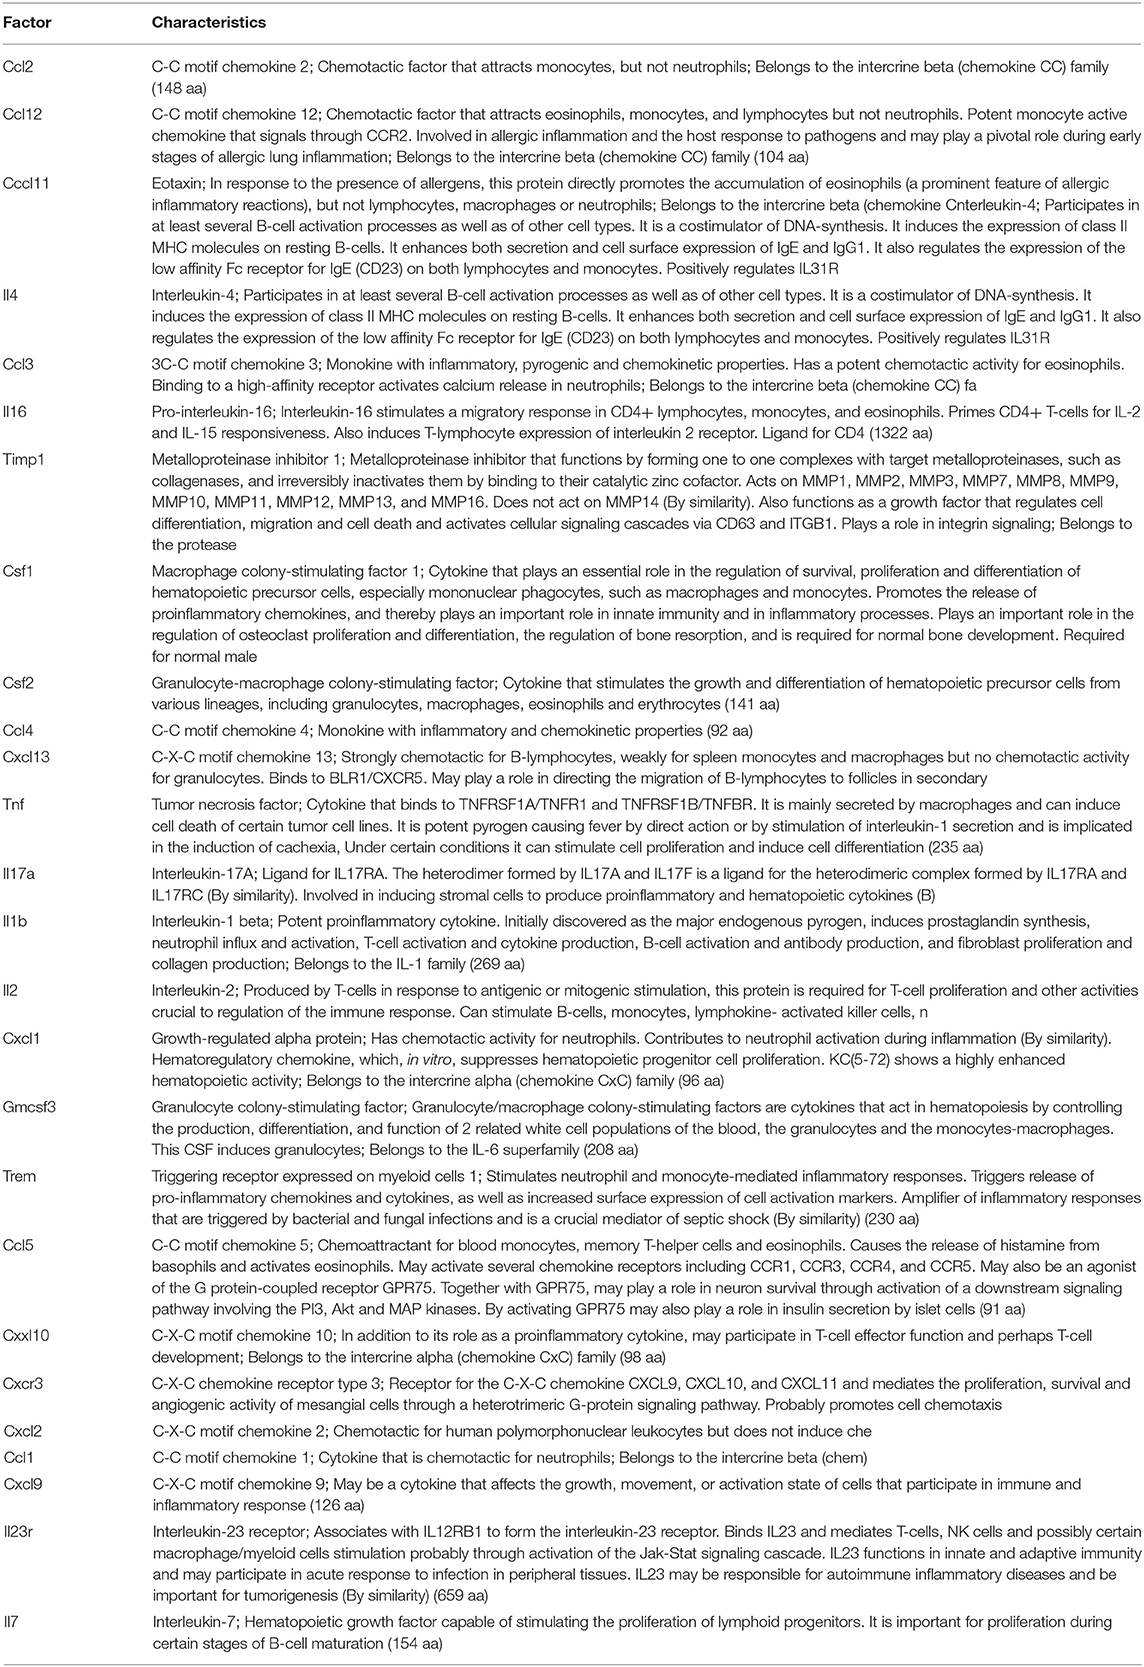
Table 3. Cytokine and chemokines differentially modulated in BM of db/db mice.
Rescue of Immune Profile of db/db Mice by Abatacept
Altogether the above findings show a state of inflammation in patients and mice with T2D. This involves activation of adaptive immunity, as evidenced by the increase in CD25+ T cells and corroborated by the upregulation of a multitude of inflammation-associated mediators.
We next investigated the effect of the in vivo administration of abatacept, a CTLA4-Ig fusion protein, on the immune profile of 10-week-old db/db mice. Abatacept- and vehicle-treated (control) mice were sacrificed 4 weeks later. Flow cytometry analysis demonstrated that, compared with control, the abatacept group had higher levels of CD4+ and CD8+ cells in the peripheral blood (p < 0.01 for both comparisons) and, limited to CD8+ cells, in BM (p = 0.003), whereas no difference was detected in the spleen (Figures 7A–C). The treatment did not affect the abundance of CD19+ B lymphocytes (data not shown). These changes in relative cell subsets abundance could be a side effect of changes in chemokine expression after co-stimulation blockade (43). Yet, most importantly, abatacept reduced the proliferation (judged by marker Ki67) of CD4+ T cells in the BM, spleen, and peripheral blood, as well of CD8+ T cells in the periphery (Figures 7D,E). Corroborating these findings, the levels of activation marker CD25 expressed by CD4+ T cells in the BM and the spleen were suppressed by the anti-inflammatory action of abatacept (p < 0.01 for both comparisons, Figure 7F) though this was not seen in CD8+ T cells (Figure 7G). Moreover, Abatacept reduced the frequency of CD4+ and CD8+ cells expressing CD103 in all the areas examined (Figures 7H,I).
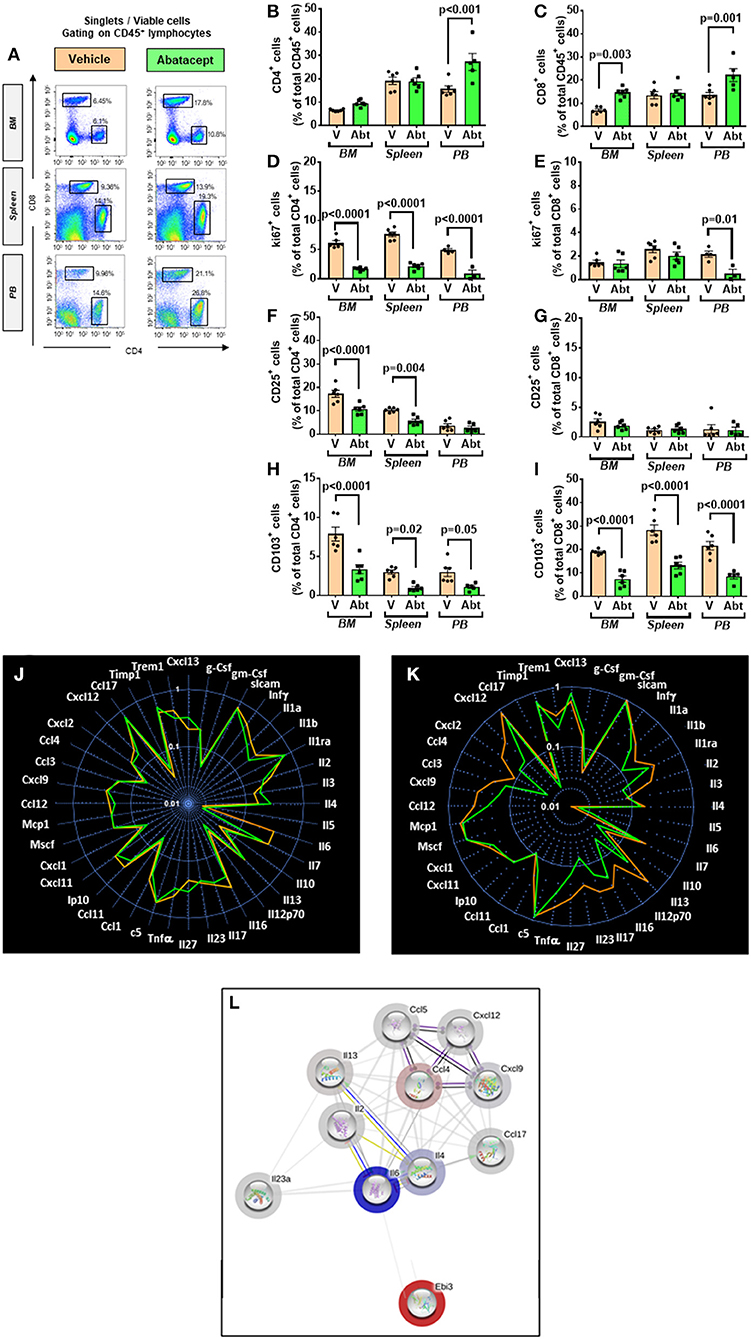
Figure 7. Effect of abatacept on immune cells of T2D mice. (A) Gating strategy for identification of CD4+ and CD8+ cells in the BM, spleen, and peripheral blood of db/db mice given vehicle or abatacept. Reported frequencies are illustrative of a representative case for each group. (B) Relative frequency of CD4+ cells. (C) Relative frequency of CD8+ cells. (D) Relative frequency of Ki67 expressing cells within CD4+ cells. (E) Relative frequency of Ki67 expressing cells within CD8+ cells. (F) Relative frequency of CD25+ cells within CD4+ cells. (G) Relative frequency of CD25+ cells within CD8+ cells. (H) Relative frequency of CD103+ cells within CD4+ cells. (I) Relative frequency of CD103+ cells within CD8+ cells. (J) Spider graph of cytokines in the BM of the abatacept (green line) and vehicle group (orange line). (K) Spider graph of cytokines in the peripheral blood of the abatacept (green line) and vehicle group (orange line). Measurements were performed in a pool of four mice per group. (L) Network analysis of regulated cytokines. Values are mean ± SEM, with each point representing an individual case.
Examining the cytokine and chemokine production using a Proteome Profiler Mouse Cytokine Array, we did not find any major differences in the BM between abatacept and control-treated animals (Figure 7J). However, in a manner compatible with the systemic effect of abatacept (36), the drug led to a relative reduction in the peripheral blood levels of key classical (type 1) proinflammatory cytokines Il-1b and Il-12, and chemokines Cxcl9, Ccl2/MCP1, Ccl4, and Ccl5, as well as type 17 proinflammatory cytokine Il-17 and Il-23, indicating a clear suppression of type 1 and type 17 proinflammatory signals, as a result of the inhibition of T-cell activation (Figures 7K,L, Table 4).
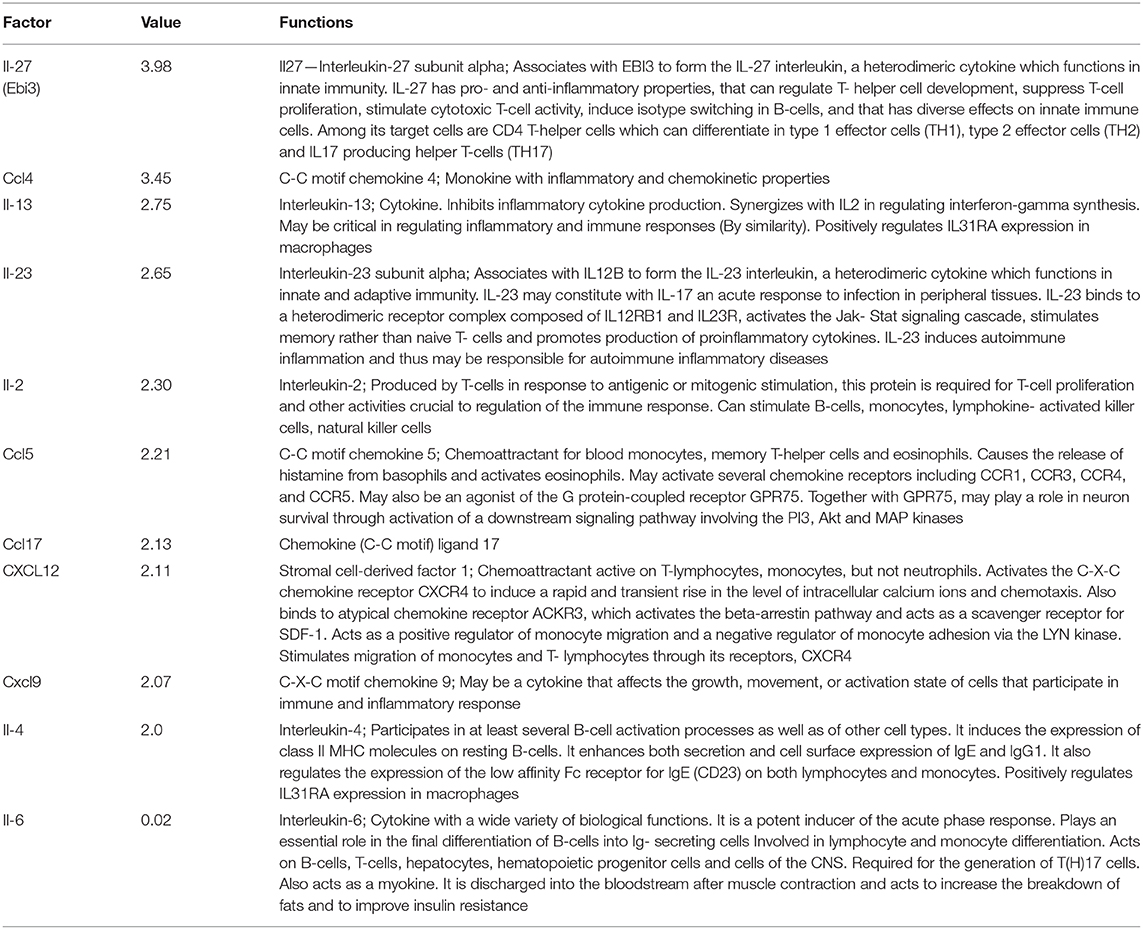
Table 4. Cytokine and chemokine changes induced by Abatacept.
We further analyzed the abundance of APCs. Abatacept decreased the number of DC in peripheral blood (3.3 ± 0.4 vs. 7.3 ± 1.2% in vehicle, p < 0.05) but did not alter the frequency of macrophages (data not shown). Finally, we examined the effect of abatacept on naïve and memory T cells (Figure 8A). Regarding naïve cells, the abatacept-treated group showed a borderline increase of the CD4+ fraction in BM (p = 0.05), whereas naïve CD8+ cells were unaltered (Figures 8B,C). CD4+ TEM cells were reduced by abatacept in BM and spleen (p < 0.0001 for both comparisons), whereas CD8+ TEM cells were decreased only in BM (p = 0.04). Figures 8D,E). TCM cells followed a more heterogeneous behavior, the CD4+ fraction being reduced in the spleen (p = 0.02) and the CD8+ fraction in the peripheral blood (p = 0.04) (Figures 8F,G).
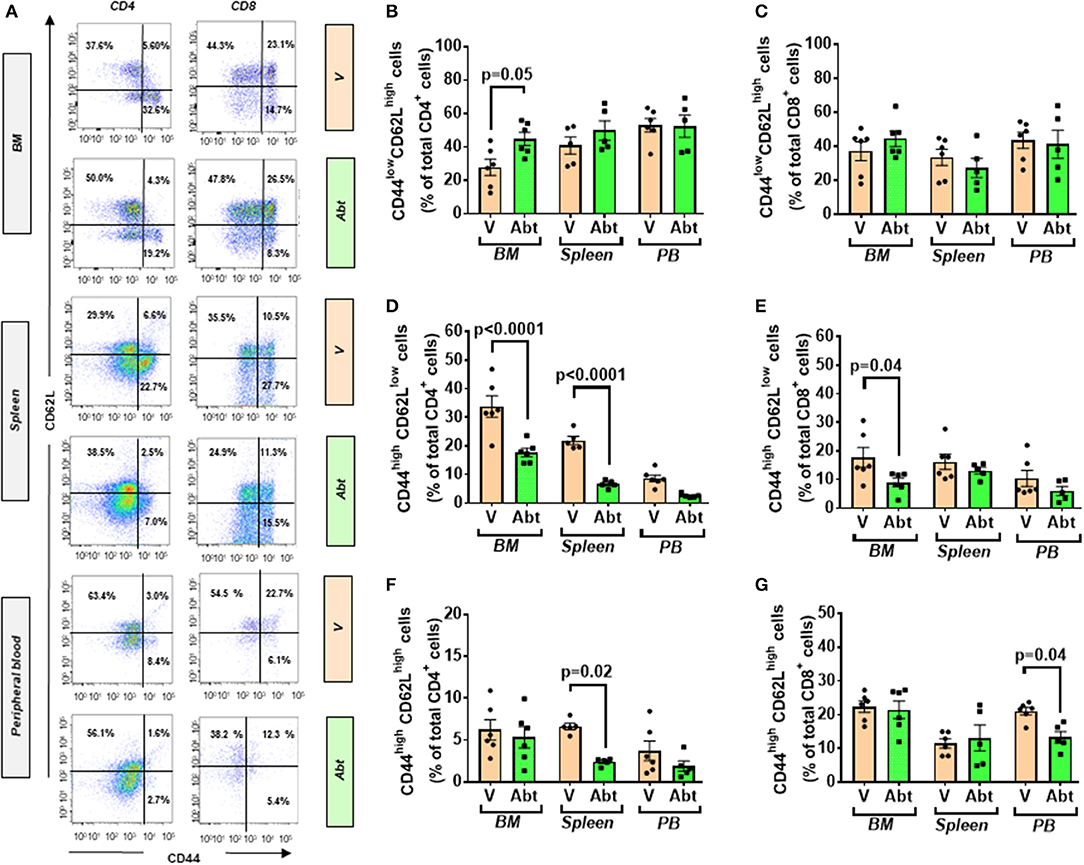
Figure 8. Effect of abatacept on naïve and memory T cells of T2D mice. (A) Gating strategy for identification of CD44+ and CD62L+ within CD4+ and CD8+ fractions in the BM, spleen, and peripheral blood of db/db mice given vehicle or abatacept. Reported frequencies are illustrative of a representative case for each group. (B) Relative frequency of naïve cells within CD4+ cells. (C) Relative frequency of naïve cells within CD8+ cells. (D) Relative frequency of TEM cells within CD4+ cells. (E) Relative frequency of TEM cells within CD8+ cells. (F) Relative frequency of TCM cells within CD4+ cells. (G) Relative frequency of TCM cells within CD8+ cells. Values are mean ± SEM, with each point representing an individual case.
Metabolic and Functional Endpoints
Body weight and the weight of heart and spleen were similar between groups given vehicle or abatacept (Figures 9A,B). Likewise, there was no difference in the fasting levels of insulin and glucose (data not shown), as well as in indexes of insulin sensitivity HOMA-IR and QUICKI (Figures 9C,D). We then analyzed the cardiac phenotype by echocardiography. The study was conducted at an age when db/db mice manifest echocardiographic evidence of left ventricular (LV) dysfunction (44). abatacept induced an improvement in echocardiographic indexes of systolic function compared with controls (Figures 9E–G). Specifically, compared with the control group, abatacept-treated mice showed higher cardiac output (CO, p < 0.001) and stroke volume (SV, p < 0.01), which could be reconducted to an increased preload, as suggested by the increased LV end diastolic volume (EDV, p < 0.01) (Figures 9H–M). However, abatacept did not reduce the LV mass, thus discarding an anti-hypertrophic effect of the drug.
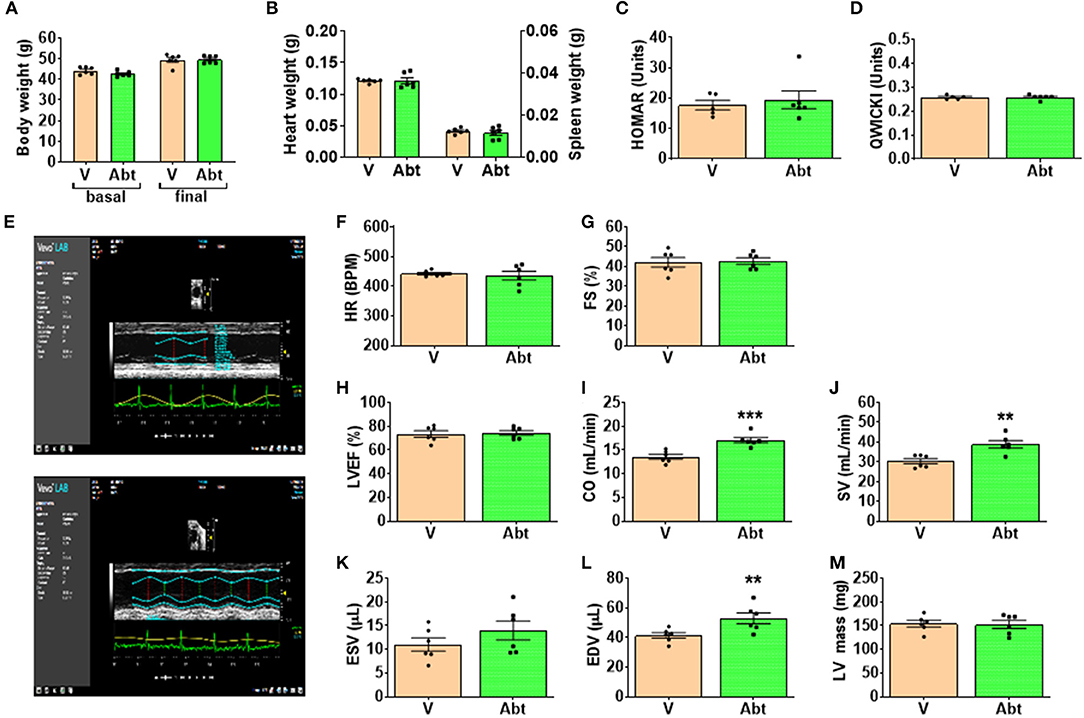
Figure 9. Effect of abatacept on metabolic and cardiac endpoints. (A) Body weight, (B) Heart weight, (C,D) indices of insulin sensitivity, and (E–M) indices of cardiac function. Values are mean ± SEM, with each point representing an individual case. **p < 0.01, and ***p < 0.001 vs. vehicle (V).
Discussion
Recent evidence indicates that T cells play key roles in the progression of T2D. In vitro studies on immune cells harvested from the peripheral blood of subjects with T2D and ND controls have shown that T2D is associated with overactivated T cells and the induction of the inflammatory pathways (45–47), thus positing the provoking hypothesis of T2D being an autoimmune disease (48). The role of BM in the maintenance of antigen-experienced adaptive immune cells is well-documented as reviewed in Bonomo et al. (49). Nonetheless, little is known about the immune profile of BM in T2D.
In the present study, we provide novel proof-of-concept evidence for the activation of adaptive immunity in the BM of patients and mice with T2D. The studied human diabetic cohort had an increased frequency of BM T lymphocytes. Both CD4+ and CD8+ cells abundantly expressed CCR7, which, together with the observed high levels of CCL19 (CCR7 receptor ligand), suggests that the local BM environment was reshaped to favor immune cell recruitment from the circulation. Moreover, we demonstrated that the diabetic BM contains TCM cells that have undergone recent activation. Most importantly, BM T cells showed a clear upregulation of typical activation markers. Several features of the adaptive immunity activation seen in patients were confirmed in db/db mice. Finally, we proved that the treatment with abatacept, which interferes with the co-stimulation signaling mechanism, inhibited the activation of adaptive immunity, and improved cardiac function in db/db mice.
Abundant fat depots of overweight/obese patients reportedly contain autoreactive T cells that exert a cytotoxic effect on adipocytes and fuel adipose inflammation (50, 51). Adipose tissue is also contiguous with main lymphoid organs, such as lymph nodes, thymus, and BM, participating in multiple intertwined mechanisms (52). For instance, adipocytes surrounding the thymus may influence T-cell differentiation in response to metabolic challenges (53). Likewise, adipocytes that reside in the BM are thought to play relevant roles in hematopoiesis, lymphopoiesis, and memory B- and T-cell responses (21). BM adiposity becomes more abundant with aging, in parallel with a decline of immunity and hematopoietic functions (54). Fat accumulation reported by us in the BM of patients and animal models with T2D represents a significant difference (25, 27, 55). In fact, the analysis of BM cells indicates a reactive adaptive immunity. These new data complement our previous report showing cytotoxic NK cells were significantly increased in the BM of subjects with T2D (25). The cellular phenotype reported in the present study was associated with alterations in the levels of cytokines and chemokines that influence the lodging and activation of naïve T cells and the maintenance of a memory reservoir. It remains to be ascertained whether adaptive immunity was induced by the previous exposure to foreign antigens or could be reconducted to dysregulation of co-signaling mechanisms that direct T-cell function and fate following antigen presentation. Interestingly, we found that CD147 was upregulated in the diabetic BM. This immunoglobulin acts as the main upstream stimulator of matrix metalloproteinases and may have pathogenic roles in diabetic complications, through the recruitment of immune cells. Intriguingly, CD147 is considered a key route for severe acute respiratory syndrome coronavirus 2 (SARS-CoV-2) invasion of immune cells (38), which might account for the susceptibility of diabetic patients to viral infection (56).
The co-signaling factor CTLA4 exerts competitive inhibition of T-cell activation (40). We tested the importance of this signaling mechanism by treating T2D mice with abatacept, a CTLA4-Ig fusion protein that exerts anti-inflammatory activity and attenuates T-cell activation by inhibiting the CD80/86:CD28 co-stimulatory pathway. The murine CD28 has a 77% homology with human CD28 (https://www.genecards.org/cgi-bin/carddisp.pl?gene=CD28). Moreover, this immunomodulatory drug showed cardioprotective effects in mice with pressure overload-induced heart failure (36). In our study abatacept inhibited T-cell activation and suppressed the production of several key inflammatory cytokines and chemokines. Treg cells are sensitive to co-stimulation perturbations, and it cannot be excluded that the reduction in CD25 expressing T cells following abatacept treatment is due to the effects on Treg. This possibility warrants focused future investigation.
The clinical indication of abatacept is to treat active rheumatoid arthritis, but seminal data are supporting its potential in the treatment of Type 1 diabetes and cardiovascular disease. In TrialNet study for people newly diagnosed, those who took Abatacept showed 59% higher insulin production and prolonged insulin production (57). Moreover, clinical studies in patients with rheumatoid arthritis have shown that Abatacept treatment reduced the risk of Type 1 or Type 2 diabetes, through an anti-inflammatory mechanism preserving β-cell function (33–35). A recent case report showed abatacept treatment led to the resolution of glucocorticoid-refractory myocarditis caused by rheumatoid arthritis or immune checkpoint inhibitor anti-cancer treatment (58). Here, we showed that, although not capable of improving insulin resistance, the anti-inflammatory action of abatacept could benefit the cardiac function of db/db mice.
Conclusion
In the present study, we have shown the activation of adaptive immunity in diabetic BM and the possibility to rescue immune and cardiac abnormalities using the clinically available, immunomodulatory drug abatacept. The compound is not risk free and the use in diabetes requires additional investigation assessing safety and optimal risk-to-benefit context. Regarding limitations, we could not perform analyses of peripheral blood cells in the human study because the ethical license covered the investigation of BM leftovers only. The focus of the present study was on specific populations of lymphocytes, which were found generally increased/activated. This change implies a relative reduction in other BM cell populations expressing the CD45 marker, an aspect that was not assessed in the present study but documented previously by us and others (25, 30, 59, 60). Considering the pilot nature of the work, further investigation is necessary in large cohorts of patients to determine whether the activation of adaptive immune cells in BM is a general phenomenon or characterizes specific subgroups of diabetic patients according to disease duration and severity of complications. Moreover, an additional mechanistic investigation is warranted on the causes responsible for the concomitant T-cell activation and expansion of naïve T cells in BM, the latter likely due to the increased homing from secondary lymphoid organs. Finally, studies in models of diet-induced diabetes could strengthen the novel evidence provided by data from the genetically diabetic db/db mice.
Data Availability Statement
The raw data supporting the conclusions of this article will be made available by the authors, without undue reservation.
Ethics Statement
The studies involving human participants were reviewed and approved by Bristol NHS. The patients/participants provided their written informed consent to participate in this study. The animal study was reviewed and approved by UK Home Office.
Author Contributions
MS performed the flow cytometry studies and wrote the draft of the paper. NS and AB were involved in patient recruitment and sample collections. AT was responsible for the in vivo studies. VA performed the metabolic assays. LN and MK provided expert opinion on protocols and interpretation of immune responses. GS contributed to the analysis and interpretation of data. PM elaborated on the scientific hypothesis, wrote the final version, procured financial support, was the guarantor of this work, had full access to all of the data in the study, and took responsibility for the integrity of the data and the accuracy of the data analysis. All authors contributed to the article and approved the submitted version.
Funding
This study was supported by a British Heart Foundation grant RG/13/17/30545, Unraveling mechanisms of stem cell depletion for the preservation of regenerative fitness in patients with diabetes. In addition, financial support was obtained from the Italian Ministry of Health, Ricerca Corrente to the IRCCS MultiMedica.
Conflict of Interest
The authors declare that the research was conducted in the absence of any commercial or financial relationships that could be construed as a potential conflict of interest.
Acknowledgments
This manuscript has been released as a preprint at BioRxiv 2020.07.03.187088; doi: 10.1101/2020.07.03.187088. The authors thank the personnel at Flow Cytometry Facility for assistance.
Abbreviations
APCs, antigen-presenting cells; BM, bone marrow; BMMCs, BM mononuclear cells; CO, cardiac output; TCM, central memory T cells; CCR7, CC-chemokine receptor 7; DCs, dendritic cells; EDV, end diastolic volume; TEM, effector memory T cells; ND, non-diabetic; HSPCs, hematopoietic stem/progenitor cells; SV, stroke volume; TEMRA, terminally differentiated T memory cells; T2D, type 2 diabetes; VAT, visceral adipose tissue; PBS, phosphate buffered saline; RT, room temperature; EDTA, ethylenediaminetetraacetic acid; RT, room temperature; FACS, flow cytometry staining; RPMI, Roswell Park Memorial Institute; RBS, red blood cell; SARS-CoV-2, severe acute respiratory syndrome coronavirus 2.
References
1. Fowkes FGR, Rudan D, Rudan I, Aboyans V, Denenberg JO, McDermott MM, et al. Comparison of global estimates of prevalence and risk factors for peripheral artery disease in 2000 and 2010: a systematic review and analysis. Lancet. (2013) 382:1329–40. doi: 10.1016/S0140-6736(13)61249-0
2. Spreen MI, Gremmels H, Teraa M, Sprengers RW, Verhaar MC, Statius van Eps RG, et al. Diabetes is associated with decreased limb survival in patients with critical limb ischemia: pooled data from two randomized controlled trials. Diabetes Care. (2016) 39:2058–64. doi: 10.2337/dc16-0850
3. Collins KK. The diabetes-cancer link. Diabetes Spectr. (2014) 27:276–80. doi: 10.2337/diaspect.27.4.276
4. Prattichizzo F, De Nigris V, Spiga R, Mancuso E, La Sala L, Antonicelli R, et al. Inflammageing and metaflammation: the yin and yang of type 2 diabetes. Ageing Res Rev. (2018) 41:1–17. doi: 10.1016/j.arr.2017.10.003
5. Hotamisligil GS. Inflammation, metaflammation and immunometabolic disorders. Nature. (2017) 542:177–85. doi: 10.1038/nature21363
6. Franceschi C, Garagnani P, Parini P, Giuliani C, Santoro A. Inflammaging: a new immune-metabolic viewpoint for age-related diseases. Nat Rev Endocrinol. (2018) 14:576–90. doi: 10.1038/s41574-018-0059-4
7. Gu Y, Hu K, Huang Y, Zhang Q, Liu L, Meng G, et al. White blood cells count as an indicator to identify whether obesity leads to increased risk of type 2 diabetes. Diabetes Res Clin Pract. (2018) 141:140–7. doi: 10.1016/j.diabres.2018.04.041
8. Dasu MR, Devaraj S, Zhao L, Hwang DH, Jialal I. High glucose induces toll-like receptor expression in human monocytes: mechanism of activation. Diabetes. (2008) 57:3090–8. doi: 10.2337/db08-0564
9. Zhou T, Hu Z, Yang S, Sun L, Yu Z, Wang G. Role of adaptive and innate immunity in Type 2 diabetes mellitus. J Diabetes Res. (2018) 2018:7457269. doi: 10.1155/2018/7457269
10. Xia C, Rao X, Zhong J. Role of T Lymphocytes in Type 2 diabetes and diabetes-associated inflammation. J Diabetes Res. (2017) 2017:6494795. doi: 10.1155/2017/6494795
11. Winer DA, Winer S, Shen L, Wadia PP, Yantha J, Paltser G, et al. B cells promote insulin resistance through modulation of T cells and production of pathogenic IgG antibodies. Nat Med. (2011) 17:610–7. doi: 10.1038/nm.2353
12. Olson NC, Doyle MF, de Boer IH, Huber SA, Jenny NS, Kronmal RA, et al. Associations of circulating lymphocyte subpopulations with Type 2 diabetes: cross-sectional results from the Multi-Ethnic Study of Atherosclerosis (MESA). PLoS ONE. (2015) 10:e0139962. doi: 10.1371/journal.pone.0139962
13. Rattik S, Engelbertsen D, Wigren M, Ljungcrantz I, Ostling G, Persson M, et al. Elevated circulating effector memory T cells but similar levels of regulatory T cells in patients with type 2 diabetes mellitus and cardiovascular disease. Diab Vasc Dis Res. (2019) 16:270–80. doi: 10.1177/1479164118817942
14. Hill DA, Lim HW, Kim YH, Ho WY, Foong YH, Nelson VL, et al. Distinct macrophage populations direct inflammatory versus physiological changes in adipose tissue. Proc Natl Acad Sci USA. (2018) 115:E5096–105. doi: 10.1073/pnas.1802611115
15. Misumi I, Starmer J, Uchimura T, Beck MA, Magnuson T, Whitmire JK. Obesity expands a distinct population of t cells in adipose tissue and increases vulnerability to infection. Cell Rep. (2019) 27:514–24 e515. doi: 10.1016/j.celrep.2019.03.030
16. Cox AR, Chernis N, Masschelin PM, Hartig SM. Immune cells gate white adipose tissue expansion. Endocrinology. (2019) 160:1645–58. doi: 10.1210/en.2019-00266
17. Kolodin D, van Panhuys N, Li C, Magnuson AM, Cipolletta D, Miller CM, et al. Antigen- and cytokine-driven accumulation of regulatory T cells in visceral adipose tissue of lean mice. Cell Metab. (2015) 21:543–57. doi: 10.1016/j.cmet.2015.03.005
18. Pabst R. The bone marrow is not only a primary lymphoid organ: the critical role for T lymphocyte migration and housing of long-term memory plasma cells. Eur J Immunol. (2018) 48:1096–100. doi: 10.1002/eji.201747392
19. Mercier FE, Ragu C, Scadden DT. The bone marrow at the crossroads of blood and immunity. Nat Rev Immunol. (2011) 12:49–60. doi: 10.1038/nri3132
20. Cavanagh LL, Bonasio R, Mazo IB, Halin C, Cheng G, van der Velden AW, et al. Activation of bone marrow-resident memory T cells by circulating, antigen-bearing dendritic cells. Nat Immunol. (2005) 6:1029–37. doi: 10.1038/ni1249
21. Di Rosa F, Gebhardt T. Bone marrow T cells and the integrated functions of recirculating and tissue-resident memory T cells. Front Immunol. (2016) 7:51. doi: 10.3389/fimmu.2016.00051
22. Di Rosa F, Pabst R. The bone marrow: a nest for migratory memory T cells. Trends Immunol. (2005) 26:360–6. doi: 10.1016/j.it.2005.04.011
23. Rothstein DM, Camirand G. New insights into the mechanisms of Treg function. Curr Opin Organ Transplant. (2015) 20:376–84. doi: 10.1097/MOT.0000000000000212
24. Tamosiuniene R, Manouvakhova O, Mesange P, Saito T, Qian J, Sanyal M, et al. Dominant role for regulatory T cells in protecting females against pulmonary hypertension. Circ Res. (2018) 122:1689–702. doi: 10.1161/CIRCRESAHA.117.312058
25. Spinetti G, Cordella D, Fortunato O, Sangalli E, Losa S, Gotti A, et al. Global remodeling of the vascular stem cell niche in bone marrow of diabetic patients: implication of the microRNA-155/FOXO3a signaling pathway. Circ Res. (2013) 112:510–22. doi: 10.1161/CIRCRESAHA.112.300598
26. Amadesi S, Reni C, Katare R, Meloni M, Oikawa A, Beltrami AP, et al. Role for substance p-based nociceptive signaling in progenitor cell activation and angiogenesis during ischemia in mice and in human subjects. Circulation. (2012) 125:1774–86, S1771–1719. doi: 10.1161/CIRCULATIONAHA.111.089763
27. Ferland-McCollough D, Maselli D, Spinetti G, Sambataro M, Sullivan N, Blom A, et al. MCP-1 feedback loop between adipocytes and mesenchymal stromal cells causes fat accumulation and contributes to hematopoietic stem cell rarefaction in the bone marrow of patients with diabetes. Diabetes. (2018) 67:1380–94. doi: 10.2337/db18-0044
28. Mangialardi G, Katare R, Oikawa A, Meloni M, Reni C, Emanueli C, et al. Diabetes causes bone marrow endothelial barrier dysfunction by activation of the RhoA-Rho-associated kinase signaling pathway. Arterioscler Thromb Vasc Biol. (2013) 33:555–64. doi: 10.1161/ATVBAHA.112.300424
29. Naveiras O, Nardi V, Wenzel PL, Hauschka PV, Fahey F, Daley GQ. Bone-marrow adipocytes as negative regulators of the haematopoietic microenvironment. Nature. (2009) 460:259–63. doi: 10.1038/nature08099
30. Albiero M, Ciciliot S, Tedesco S, Menegazzo L, D'Anna M, Scattolini V, et al. Diabetes-associated myelopoiesis drives stem cell mobilopathy through an OSM-p66Shc signaling pathway. Diabetes. (2019) 68:1303–14. doi: 10.2337/db19-0080
31. Spinetti G, Sangalli E, Tagliabue E, Maselli D, Colpani O, Ferland-McCollough D, et al. microRNA-21/PDCD4 proapoptotic signaling from circulating CD34(+) cells to vascular endothelial cells: a potential contributor to adverse cardiovascular outcomes in patients with critical limb ischemia. Diabetes Care. (2020) 43:1520–9. doi: 10.2337/figshare.12075639.v1
32. Blair HA, Deeks ED. Abatacept: a review in rheumatoid arthritis. Drugs. (2017) 77:1221–33. doi: 10.1007/s40265-017-0775-4
33. Desai RJ, Dejene S, Jin Y, Liu J, Kim SC. Comparative risk of diabetes mellitus in patients with rheumatoid arthritis treated with biologic or targeted synthetic disease-modifying drugs: a cohort study. ACR Open Rheumatol. (2020) 2:222–31. doi: 10.1002/acr2.11124
34. Orban T, Bundy B, Becker DJ, DiMeglio LA, Gitelman SE, Goland R, et al. Co-stimulation modulation with abatacept in patients with recent-onset type 1 diabetes: a randomised, double-blind, placebo-controlled trial. Lancet. (2011) 378:412–9. doi: 10.1016/S0140-6736(11)60886-6
35. Ursini F, Russo E, Letizia Hribal M, Mauro D, Savarino F, Bruno C, et al. Abatacept improves whole-body insulin sensitivity in rheumatoid arthritis: an observational study. Medicine. (2015) 94:e888. doi: 10.1097/MD.0000000000000888
36. Kallikourdis M, Martini E, Carullo P, Sardi C, Roselli G, Greco CM, et al. T cell costimulation blockade blunts pressure overload-induced heart failure. Nat Commun. (2017) 8:14680. doi: 10.1038/ncomms14680
37. Zhang X, Dong H, Lin W, Voss S, Hinkley L, Westergren M, et al. Human bone marrow: a reservoir for “enhanced effector memory” CD8+ T cells with potent recall function. J Immunol. (2006) 177:6730–7. doi: 10.4049/jimmunol.177.10.6730
38. Ulrich H, Pillat MM. CD147 as a target for COVID-19 treatment: suggested effects of azithromycin and stem cell engagement. Stem Cell Rev Rep. (2020) 16:434–40. doi: 10.1007/s12015-020-09976-7
39. Metcalfe SM. LIF in the regulation of T-cell fate and as a potential therapeutic. Genes Immun. (2011) 12:157–68. doi: 10.1038/gene.2011.9
40. Schneider H, Rudd CE. Diverse mechanisms regulate the surface expression of immunotherapeutic target ctla-4. Front Immunol. (2014) 5:619. doi: 10.3389/fimmu.2014.00619
41. Corgnac S, Boutet M, Kfoury M, Naltet C, Mami-Chouaib F. The emerging role of CD8(+) Tissue Resident Memory T (TRM) cells in antitumor immunity: a unique functional contribution of the CD103 integrin. Front Immunol. (2018) 9:1904. doi: 10.3389/fimmu.2018.01904
42. Hardenberg JB, Braun A, Schon MP. A Yin and Yang in epithelial immunology: the roles of the alphaE(CD103)beta7 integrin in T Cells. J Invest Dermatol. (2018) 138:23–31. doi: 10.1016/j.jid.2017.05.026
43. Bonelli M, Goschl L, Bluml S, Karonitsch T, Hirahara K, Ferner E, et al. Abatacept (CTLA-4Ig) treatment reduces T cell apoptosis and regulatory T cell suppression in patients with rheumatoid arthritis. Rheumatology. (2016) 55:710–20. doi: 10.1093/rheumatology/kev403
44. Dang Z, Avolio E, Thomas AC, Faulkner A, Beltrami AP, Cervellin C, et al. Transfer of a human gene variant associated with exceptional longevity improves cardiac function in obese type 2 diabetic mice through induction of the SDF-1/CXCR4 signalling pathway. Eur J Heart Fail. (2020) 22:1568–81. doi: 10.1002/ejhf.1840
45. Richard C, Wadowski M, Goruk S, Cameron L, Sharma AM, Field CJ. Individuals with obesity and type 2 diabetes have additional immune dysfunction compared with obese individuals who are metabolically healthy. BMJ Open Diabetes Res Care. (2017) 5:e000379. doi: 10.1136/bmjdrc-2016-000379
46. Moura J, Rodrigues J, Goncalves M, Amaral C, Lima M, Carvalho E. Impaired T-cell differentiation in diabetic foot ulceration. Cell Mol Immunol. (2017) 14:758–69. doi: 10.1038/cmi.2015.116
47. Stentz FB, Kitabchi AE. Activated T lymphocytes in Type 2 diabetes: implications from in vitro studies. Curr Drug Targets. (2003) 4:493–503. doi: 10.2174/1389450033490966
48. de Candia P, Prattichizzo F, Garavelli S, De Rosa V, Galgani M, Di Rella F, et al. Type 2 diabetes: how much of an autoimmune disease? Front Endocrinol. (2019) 10:451. doi: 10.3389/fendo.2019.00451
49. Bonomo A, Monteiro AC, Goncalves-Silva T, Cordeiro-Spinetti E, Galvani RG, Balduino A. A T cell view of the bone marrow. Front Immunol. (2016) 7:184. doi: 10.3389/fimmu.2016.00184
50. Procaccini C, Carbone F, Galgani M, La Rocca C, De Rosa V, Cassano S, et al. Obesity and susceptibility to autoimmune diseases. Expert Rev Clin Immunol. (2011) 7:287–94. doi: 10.1586/eci.11.18
51. Mzimela NC, Ngubane PS, Khathi A. The changes in immune cell concentration during the progression of pre-diabetes to type 2 diabetes in a high-fat high-carbohydrate diet-induced pre-diabetic rat model. Autoimmunity. (2019) 52:27–36. doi: 10.1080/08916934.2019.1575820
52. De Rosa V, La Cava A, Matarese G. Metabolic pressure and the breach of immunological self-tolerance. Nat Immunol. (2017) 18:1190–6. doi: 10.1038/ni.3851
53. Matarese G, La Cava A. The intricate interface between immune system and metabolism. Trends Immunol. (2004) 25:193–200. doi: 10.1016/j.it.2004.02.009
54. Pritz T, Weinberger B, Grubeck-Loebenstein B. The aging bone marrow and its impact on immune responses in old age. Immunol Lett. (2014) 162:310–5. doi: 10.1016/j.imlet.2014.06.016
55. Santopaolo M, Gu Y, Spinetti G, Madeddu P. Bone marrow fat: friend or foe in people with diabetes mellitus? Clin Sci. (2020) 134:1031–48. doi: 10.1042/CS20200220
56. Li B, Yang J, Zhao F, Zhi L, Wang X, Liu L, et al. Prevalence and impact of cardiovascular metabolic diseases on COVID-19 in China. Clin Res Cardiol. (2020) 109:531–8. doi: 10.1007/s00392-020-01626-9
57. Rachid O, Osman A, Abdi R, Haik Y. CTLA4-Ig (abatacept): a promising investigational drug for use in type 1 diabetes. Expert Opin Investig Drugs. (2020) 29:221–36. doi: 10.1080/13543784.2020.1727885
58. Salem JE, Allenbach Y, Vozy A, Brechot N, Johnson DB, Moslehi JJ, et al. Abatacept for severe immune checkpoint inhibitor-associated myocarditis. N Engl J Med. (2019) 380:2377–9. doi: 10.1056/NEJMc1901677
59. Fadini GP, Ciciliot S, Albiero M. Concise review: perspectives and clinical implications of bone marrow and circulating stem cell defects in diabetes. Stem Cells. (2017) 35:106–16. doi: 10.1002/stem.2445
Keywords: diabetes, immunity, bone marrow, cardiovaacular, adipo/cytokines
Citation: Santopaolo M, Sullivan N, Thomas AC, Alvino VV, Nicholson LB, Gu Y, Spinetti G, Kallikourdis M, Blom A and Madeddu P (2021) Activation of Bone Marrow Adaptive Immunity in Type 2 Diabetes: Rescue by Co-stimulation Modulator Abatacept. Front. Immunol. 12:609406. doi: 10.3389/fimmu.2021.609406
Received: 24 September 2020; Accepted: 27 January 2021;
Published: 04 March 2021.
Edited by:
Guochang Hu, University of Illinois at Chicago, United StatesReviewed by:
Shulin Qin, University of Pittsburgh, United StatesHussein Al-Mossawi, University of Oxford, United Kingdom
Copyright © 2021 Santopaolo, Sullivan, Thomas, Alvino, Nicholson, Gu, Spinetti, Kallikourdis, Blom and Madeddu. This is an open-access article distributed under the terms of the Creative Commons Attribution License (CC BY). The use, distribution or reproduction in other forums is permitted, provided the original author(s) and the copyright owner(s) are credited and that the original publication in this journal is cited, in accordance with accepted academic practice. No use, distribution or reproduction is permitted which does not comply with these terms.
*Correspondence: Paolo Madeddu, bWRwcm1AYnJpc3RvbC5hYy51aw==; orcid.org/0000-0002-4718-9205