 Philipp Adams1,2,3*
 Gilles Iserentant1
 Jean-Yves Servais1Linos Vandekerckhove4Guido Vanham2,3
 Carole Seguin-Devaux1 and the PhenoCure Study Group
- 1Department of Infection and Immunity, Luxembourg Institute of Health, Esch-sur-Alzette, Luxembourg
- 2Departments of Biomedical and Clinical Sciences, Institute of Tropical Medicine, Antwerp, Belgium
- 3Department of Biomedical Sciences, University of Antwerp, Antwerp, Belgium
- 4Department of Internal Medicine, Ghent University, Ghent, Belgium
Antiretroviral therapy (ART) is not curative as HIV-1 persists in long-lived viral reservoirs. Consequently, patients are dependent on life-long drug adherence with possible side effects. To overcome these limitations strategies of a functional cure aim at ART free viral remission. In this study, we sought to identify detailed subsets of anti-viral CD8+ T cell immunity linked to natural long-term control of HIV-1 infection. Here, we analyzed HIV controllers and ART suppressed progressors for in vitro viral suppressive capacity (VSC) at baseline and after peptide stimulation. Functional properties and phenotypes of CD8+ T cells were assessed by IFN-γ ELISPOT and 18 color flow cytometry. HIV controllers showed significantly increased suppression at baseline as well as after peptide stimulation. IFN-γ secretion and the proliferation marker Ki67 positively correlated with VSC. Moreover, the detailed phenotype of three distinct multifunctional memory CD8+ T cell subsets were specific traits of HIV controllers of which two correlated convincingly with VSC. Our results underline the importance of multifunctional CD8+ T cell responses during natural control. Especially the role of CXCR5 expressing cytotoxic subsets emphasizes potential surveillance in sites of reservoir persistence and demand further study.
Introduction
Antiretroviral therapy (ART) halts the progression to AIDS by suppressing viral replication but is not curative, because HIV-1 persists in long-lived latent reservoirs (1–3). Interestingly a small group of HIV-1 infected patients succeeds in maintaining low plasma viral loads (pVL) over many years in the absence of therapy. They are regarded as the role model for a functional cure, which refers to ART free HIV-1 remission. HIV controllers are subdivided according to their level of viremia into elite controllers (EC), with pVL < 20 copies, and viremic controllers (VC), with pVL ≤ 2000 copies (4). The association of EC with certain HLA-I alleles is one of the strongest indications for an involvement of anti-viral CD8+ T cells (5–7). An abundance of literature has characterized the anti-HIV-1 CD8 + T cell response in EC displaying greater cytotoxicity (8, 9), higher proliferation (10, 11) and polyfunctionality (12, 13). There is strong evidence that specificity, quality and broadness are all key determinants of efficient HIV-1- specific CD8+ T-cell mediated responses (14). Also do a number of functional studies substantiate that protection against HIV-1 is more related to the quality (such as polyfunctionality) of the T cell response than to its magnitude (15). Moreover higher frequencies of early T cell responses preferentially targeting the Gag protein are predictive of low viral set point, control of infection and found to be dominant in EC (16–18). Among other aspects, targeting Gag constraints immune escape as it comes with high costs in viral fitness when mutated (19, 20). Therefore eliciting polyclonal T cell responses targeting conserved epitopes in Gag is a major objective in HIV vaccinology (21).
HIV controllers are a heterogeneous population. Potent anti-HIV-1 CD8+ T cell responses are not restricted to HIV controllers carrying protective HLA alleles. Moreover very weak HIV-1-specific T cell responses can be found in HIV controllers while non-HIV controllers may present with such favorable genetic background (22, 23). Taken together, these finding indicate that additional factors may contribute to achieve sustained viral control (24).
Direct evidence for viral suppressive capacity (VSC) in vitro is derived from the viral inhibition assay (VIA), which measures viral outgrowth from CD4+ T cells in the presence of CD8+ T cells. Several studies highlighted improved VSC in EC compared to progressors (9, 25, 26). The breadth of Gag CD8+ T cell responses was found to be associated with higher VSC and reduced viral loads in vivo (27, 28). Interestingly low VSC predicts CD4+ T cell decline in untreated patients (29). We recently reported that VSC after peptide stimulation was correlated in ART-treated patients with higher expression of immune checkpoint markers on subsets of terminally differentiated effector memory (TEMRA) CD8+ T cells producing higher level of IFN-γ, TNF-α and IL-10 (30). However to understand which specific CD8+ T-cell subsets are most effective in viral suppression of HIV controllers is still needed.
Over the last years secondary lymphoid organs were pinpointed as the major anatomical sites of HIV persistence during ART (31). Recent studies highlighted the importance of lymph node resident follicular CD4 + T helper cells for ongoing viral replication correlating with the presence CD8+ T cell (32). Further data from SIV infection suggest a functional role of B-cell follicle homing CD8+ T cells (CXCR5+) that could contribute to control SIV infection (33). To what degree CXCR5+CD8+ T cells are present in EC and which functional phenotype they have remains to be clarified.
To that aim, we performed an in-depth characterization of CD8+ T cells after expansion of Gag-specific memory responses. We identified three distinct multifunctional subsets in natural controllers associated with strong CD8+ T-cell responses and VSC. For the first time, we report the emergence of CXCR5 cytotoxic subsets from peripheral blood of EC that might target the productive HIV-1 reservoir.
Material and Methods
Study Design and Participants
A total of 56 patients were recruited in the Belgian clinical AIDS Reference Centers of Antwerp (Institute of tropical medicine), Brussels (Centre Hospitalière Universitaire Sint Pierre and Universitair Ziekenhuis Brussels), Liège (Centre Hospitalière Universitaire) and Hasselt (Jessa Ziekenhuis). Inclusion criteria defined elite controller (EC) as being treatment naïve, pVL ≤ 20 copies/ml with a duration ≥ 12 months; viral controller (VC) as treatment naïve, pVL 20–2000 copies/ml with a duration ≥ 12 months; ART as patients under treatment, pVL ≤ 20 copies/ml for ≥ 24 months. The numbers of patients in the different categories were as follows: EC (n=15), VC (n=11), ART (n=30). Although not set as a inclusion criterium it is worth to mention that all patients had stable CD4+ T cell counts above 500 cells/mm3. Patients signed informed consent for longitudinal blood donation of 100 ml every 6 months over a period of 3 years. The study was approved by each local ethical committee and received the ethical approval from the university hospital of Antwerp (Belgium) under the registration number: B300201731330 as a multicenter Belgian cohort called as PhenoCure. Furthermore, anonymized blood samples from healthy donors (HD) (seronegative for HIV, HBV, and HCV) were collected from the red cross in Luxembourg as controls for certain immune assays.
Blood was processed within a maximum of 6 h to maintain functionality of PBMCs. Whole blood separation was done by gradient centrifugation using lymphoprep™ (Stemcell technologies) and LeucoSEP™ (Greiner Bio-One) tubes according to harmonized standard operating procedures. Isolated PBMCs were cryopreserved in commercially available medium (Cryostor, CS10, Stemcell technologies, Vancouver, Canada) and stored in liquid nitrogen (-196°C). Plasma and whole blood samples were stored at -80°C.
Viral Inhibition Assay
The viral inhibition assay was set-up as described previously with significant modifications (34). CD4+ T cells and CD8+ T cells were prepared and isolated from freshly thawed PBMCs as follows:
Preparation of CD4+ T target cells: freshly thawed PBMCs were stimulated with an anti-human CD3/CD8 bi-specific monoclonal antibody (1µg/ml, NIH AIDS Reagent Program) and cultured during 7 days in “R10/IL-2” medium, composed of Rosewell Park Memorial Institute (RPMI) medium with 10% fetal bovine serum (FBS), L-Glutamine (0,4 mM per ml), supplemented with Penicillin and Streptomycin at 100 IU/ml and interleukin-2 (IL-2 500 IU/ml, Gentaur, Kampenhout, Belgium). PBMCs were cultured at a density of 2x10⁶ cells per ml at 37°C with 5% CO2. Fresh R10/IL-2 medium was added on day 3 and 5 of culture. On day 7 cells were harvested, washed three times with cold PBS (Gibco, Fisher Scientific, Waltham, Massachusetts, USA) and CD4+ T cells were isolated using negative selection magnetic beads (Miltenyi Biotech, San Diego, California, USA) according to the manufacturer’s protocol. Purities of CD4+ T cells of more than 90% were confirmed by flow cytometry for CD3 (BUV496, clone OKT3), CD4 (BUV395, clone SK3) and CD8 (BUV737, clone SK1). Enriched cells were washed twice with R10/IL2 and then infected with HIV IIIB lab strain (NIH AIDS reagent program) at a multiplicity of infection of 10-3 using spinoculation at 1200 g for 2 h at 25°C followed by 1 h of incubation at 37°C 5% CO2. Cells were washed twice with R10/IL2 and resuspended at 1 x 10⁶cells per ml in R10/IL2 medium to distribute for the VIA culture.
Preparation of CD8+ T effector cells: CD8+ T effector cells were prepared in two conditions: stimulated (in vitro) and non-stimulated (ex vivo). Freshly thawed PBMCs were stimulated with a potential T cell epitope (PTE) Gag peptide pool (NIH reagent program) at 100 ng/ml per peptide in R10 medium and cultured for 7 days at 2 x 10⁶ cells per/ml density without changing the medium. For unstimulated cells freshly thawed PBMCs were cultured overnight in R10 medium at 2 x 10⁶cells per/ml density. Both stimulated and unstimulated PBMCs were harvested on the same day and subjected to CD8+ T cell negative selection (Miltenyi Biotech, San Diego, California, USA). Purities of more than 90% were confirmed by flow cytometry as described above. Cells were washed twice with R10/IL2 and resuspended at 1 x 10⁶ cells per ml in R10/IL2 medium to distribute for the subsequent VIA culture.
The VIA was performed in flat bottom 96-well culture plate (Greiner BIO-ONE) in 200 µl volume of R10/IL2 medium. Each patient sample was run in five conditions and each condition in triplicates. The conditions were, non-stimulated and stimulated CD8+ T effector cells in coculture with IIIb-infected CD4+ T target cells at an effector-to-target (E:T) ratio of 1:1 and 1:10, as well as IIIb-infected CD4 + T target cells only. Half of culture medium was recovered and refreshed every 3 days. Specificity of the assay was previously shown (30) and no further group of uninfected controls was included during this study. Levels of p24 antigen in supernatants were quantified on day 14 in coculture by p24 ELISA (BioMARIC, Ghent, Belgium) according to the manufacturer’s protocol. VSC was calculated as log10 [p24 CD4+ T cells only] – [p24 coculture with CD8+ T cells].
Measurement of Soluble Factors by MULTI-ARRAY ELISA
Several cytokines and chemokines were assessed in plasma of patients and at day 5 of the VIA coculture using two different configurations of MULTI-ARRAY ELISA (mesoscale discovery,Rockville, Maryland, USA) U-plex detection plates respectively. On plasma we assessed IFN-γ, TNF-α, IL1-β, IL-6, IL18, and IP10. On supernatants from the VIA coculture we assessed IFN-γ, IL-2, IL6, IL-12p70, IP-10, TNF-α, TRAIL, CCL4 (MIP1β). Technical procedures were executed according to the manufacturer’s instructions and acquired on the MESO SECTOR S600 (mesoscale discovery) reader.
ELISPOT for IFN-γ Production
MultiScreenHTS-IP, 0,45µm, 96-well plates (Merck Millipore, Burlington, Massachusetts, USA) were coated overnight with anti-human IFN-γ monoclonal antibody (clone 1-D1K, MABTECH, Stockholm, Sweden) diluted 1/100 in PBS at 4°C. The next day plates were washed with PBS and then blocked with R10 medium for 60 min. 2 x 10⁵PBMCs/per well in 200 µl volume were loaded onto the plate supplemented with PTE Gag peptide pool (NIH reagent program) at 100 ng/ml concentration. Samples were run in two conditions: 7 days Gag prestimulated PBMCs and overnight rested non-stimulated PBMCs, each in duplicates for a total duration of 36 h at 37°C 5% CO2. Duplicate positive controls were stimulated with PMA (50 ng/ml, Invivogen) and Ionomycin (500 ng/ml, Invivogen). PBMCs from healthy donors were included as to estimate non-specific background signal. After incubation plates were washed with PBS and incubated with biotinylated IFN-γ detection antibody (clone 7-B6-1, MABTECH) diluted 1/100 PBS-0,05 Tween- 0,5% BSA for 2 h. Revelation was performed using HRP Streptavidin for ELISPOT (BD Biosciences) and AEC Substrate Set (BD Biosciences) according to manufacturer’s instructions. Plates were read and analyzed using Easy-Count and the SmartCount (ImmunoSpot, Bonn, Germany) software.
Flow Cytometry
Detailed cellular phenotyping of PBMCs using 18-color flow cytometry was performed just before the coculture and during coculture (96 h into VIA culture). Before coculture, PBMCs were evaluated in two conditions per patient. Either after 7 days of prestimulation (stimulated condition) or after overnight resting (Non-stimulated condition). Prior to staining both conditions were exposed to PTE Gag peptides at 100 ng/ml per peptide for a total of 16 h with Golgi Stop (1/1000 final dilution, BD Biosciences). Golgi Plug (1/1000 final dilution) was added during the last 10 h of culture together with anti-CD107a antibody (BV421, clone H4A3).
During the VIA coculture, prestimulated CD8+ T cells with infected autologous CD4+ T cells or with non-infected autologous CD4 + T cells at the 1:1 E:T ratio were analyzed after 120 h (5 days) in coculture. Golgi Stop (1/1000 final dilution, BD Biosciences), Golgi Plug (1/1000 final dilution) and anti-CD107a antibody (BV421, clone H4A3) were added into the culture 6 h before staining.
Cells were further harvested for antibody staining, washed twice with 4 ml of FACS buffer (PBS with 1%BSA) and stained with the LIVE/DEAD Fixable NearIR Dead cell stain kit (Thermo Fisher Scientific) as well as the antibodies for the extracellular antigens for 30 min at 4°C. Subsequently cells were washed twice with 4 ml FACS buffer and permeabilized/fixed using the FOXP3 transcription factor staining buffer set (eBioscience, Santa Clara, California, USA) according to the manufacturer’s instructions. Next the intracellular antigens were stained for 30 min. Cells were washed twice with 4 ml of FACS Buffer and acquired on the Fortessa LSR flow cytometer (BD Biosciences, USA).
Different panels were used for phenotyping sharing a common backbone panel for lineage gating on T cells containing anti human antibodies for CD4 (BUV395, clone SK3, BD), CD3 (BUV496, clone UCHT1), CD8 (BUV737, clone SK1), CD45RA (BV460, clone HI100), CXCR5(BV711, clone J52D4), CCR7 (PE-CF594, clone 150305), CD14 (PECy5, clone G1D3), and LIVE/DEAD Fixable NearIR Dead cell stain kit (APC-Cy7, Thermo Fisher Scientific). The additional antibodies used in the panels were anti-human: HLA-DR (BV510, clone L243), IL2 (BV605, clone MQ1-17H12), CD57 (BV605, clone NK-1) IFN-γ (BV650, clone 4S.B3), PD-1 (BV786, clone EH12.1), Ki67 (Alexa Fluor 488, clone B56), CD38 (PERCP-Cy5, clone HIT2), TNF-α (APC, clone Mab11), IL-2 (PE, clone MQ1-17H12), Granzyme B (PE, clone GB11), Perforin (PE-Cy7, clone B-D48), MIP-1β (APC, clone D21-1351).
Quantification of HIV-1 DNA
Cell-associated HIV-1 DNA was isolated from purified CD4+ T cells (CD4+ T cell microbeads, Miltenyi) from final quantities of 2x10⁶ cells per patient. Extraction was done using the DNeasy Blood and tissue kit (Qiagen, Hilden, Germany) according to manufacturer’s instruction. Absolute quantification of HIV-1 DNA was performed by droplet digital PCR (ddPCR) (Bio-Rad, Hercules, California) as previously described (35) with total HIV-1 DNA primers and probes as reported (36).
Data Analysis and Statistics
Flow cytometry data were analyzed using Flow Jo (version 10, BD Biosciences) and Kaluza (version 1.5, Beckman Coulter). Analysis was done by a classical gating strategy focused hierarchically on lymphocytes, single cells, live-cells, CD3+, CD8+ cells. Subsequently CD8+ T cells were subdivided into the four main subsets (Naïve (CD45RA+CCR7+), Central Memory (CM) (CD45RA-CCR7+), Effector memory (EM) (CD45RA-CCR7-) and terminally differentiated effector memory subsets re-expressing CD45RA (TEMRA) (CD45RA+CCR7-). Subsequently each subset was analyzed using a Boolean gating strategy combining eight phenotypic and functional markers. Data was exported as.csv files and imported into the Tableau (Tableau Software, Seattle, Washington, USA) environment for data cleaning and organization. Statistical testing was executed with the QluCore (Qlucore, Scheelvägen, Sweden) software using Kruskal Wallis non-parametric comparison with a false discovery rate (FDR) of 0.2. Identified hits were exported into Prism version 8 (GraphPad Software, California, USA) and represented with from non-parametric multiple comparison with Dunn’s correction.
All other data was analyzed with Prism (version 8, GraphPad) with non-parametric statistical methods tests (specified in figure legends for each data set).
Results
Participants Demographics, Plasma Markers, and Cell Associated HIV-1 DNA
The characteristics of HIV-1 patients recruited in the PhenoCure cohort are given in Table 1. Inclusion criteria were mentioned in the Material and Methods section defining the three categories. Importantly, EC and VC were treatment naïve with the exception of two female EC which have been ART-treated during pregnancy. Information on the specific subtype of HIV-1 was not available for all patients. With regard to plasma markers an elevated concentration of circulating IL-18 in ART patients [median 534,8 pg/ml, (290,9–1478)] compared to EC [336 pg/ml, (149,1–412,1)] was observed (Supplementary Figure 1A), suggesting that systemic inflammation stays elevated during ART and in contrast is more limited during natural control of HIV-1 infection. The other cytokines (IL-6, IP-10, TNF-α) didn’t differ among patient groups (Supplementary Figures 1B–D).
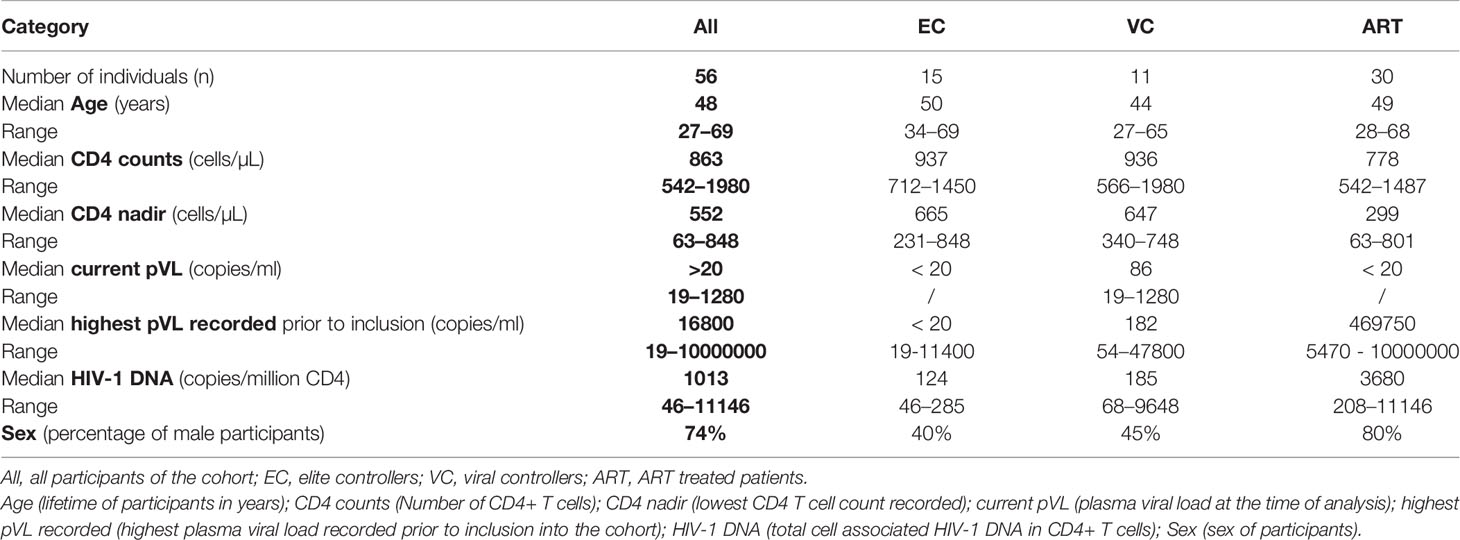
Table 1 Patient characteristics recruited in the PhenoCure cohort.
Cell-associated total HIV-1 DNA was significantly lower for EC [median 124 copies/million CD4 + T cells, (46–2530)] compared to the ART group [median 3680 copies/million CD4 + T cells, (208–11146)] whereas the values for VC (median 185 copies/million CD4 + T cells, [68-9648]) were not significantly different between EC and ART-treated patient (Supplementary Figure 2A). These findings are concordant to published literature (37).
Viral Suppressive Capacity Significantly Increases by Gag Stimulation and Was More Pronounced During Natural Control of HIV-1 Infection
Increased VSC is commonly observed during in vivo viral control. In the present study, two questions were addressed: First, to what extent will pre-stimulation with Gag peptides improve VSC of CD8+ T cells compared to non-stimulated, baseline VSC. Secondly, how this potential induction of VSC compares among different clinical phenotypes, namely HIV controllers (EC and VC) and treated progressors (ART). In addition we ran VIA assays using two E:T ratios (1:1 and 1:10) to estimate the per cell capacity of suppression. In the non-stimulated (ex vivo) setting VSC in 1:1 ratios was significantly increased for EC and VC as compared to ART (median VSC in log10: EC 2.5, VC 2.02, ART 0.63). When the E:T ratio was reduced (1:10), VSC was decreased so that no further difference among groups was observed (Figure 1A) (median VSC in log10: EC 0.47, VC 0.33, ART 0.29).
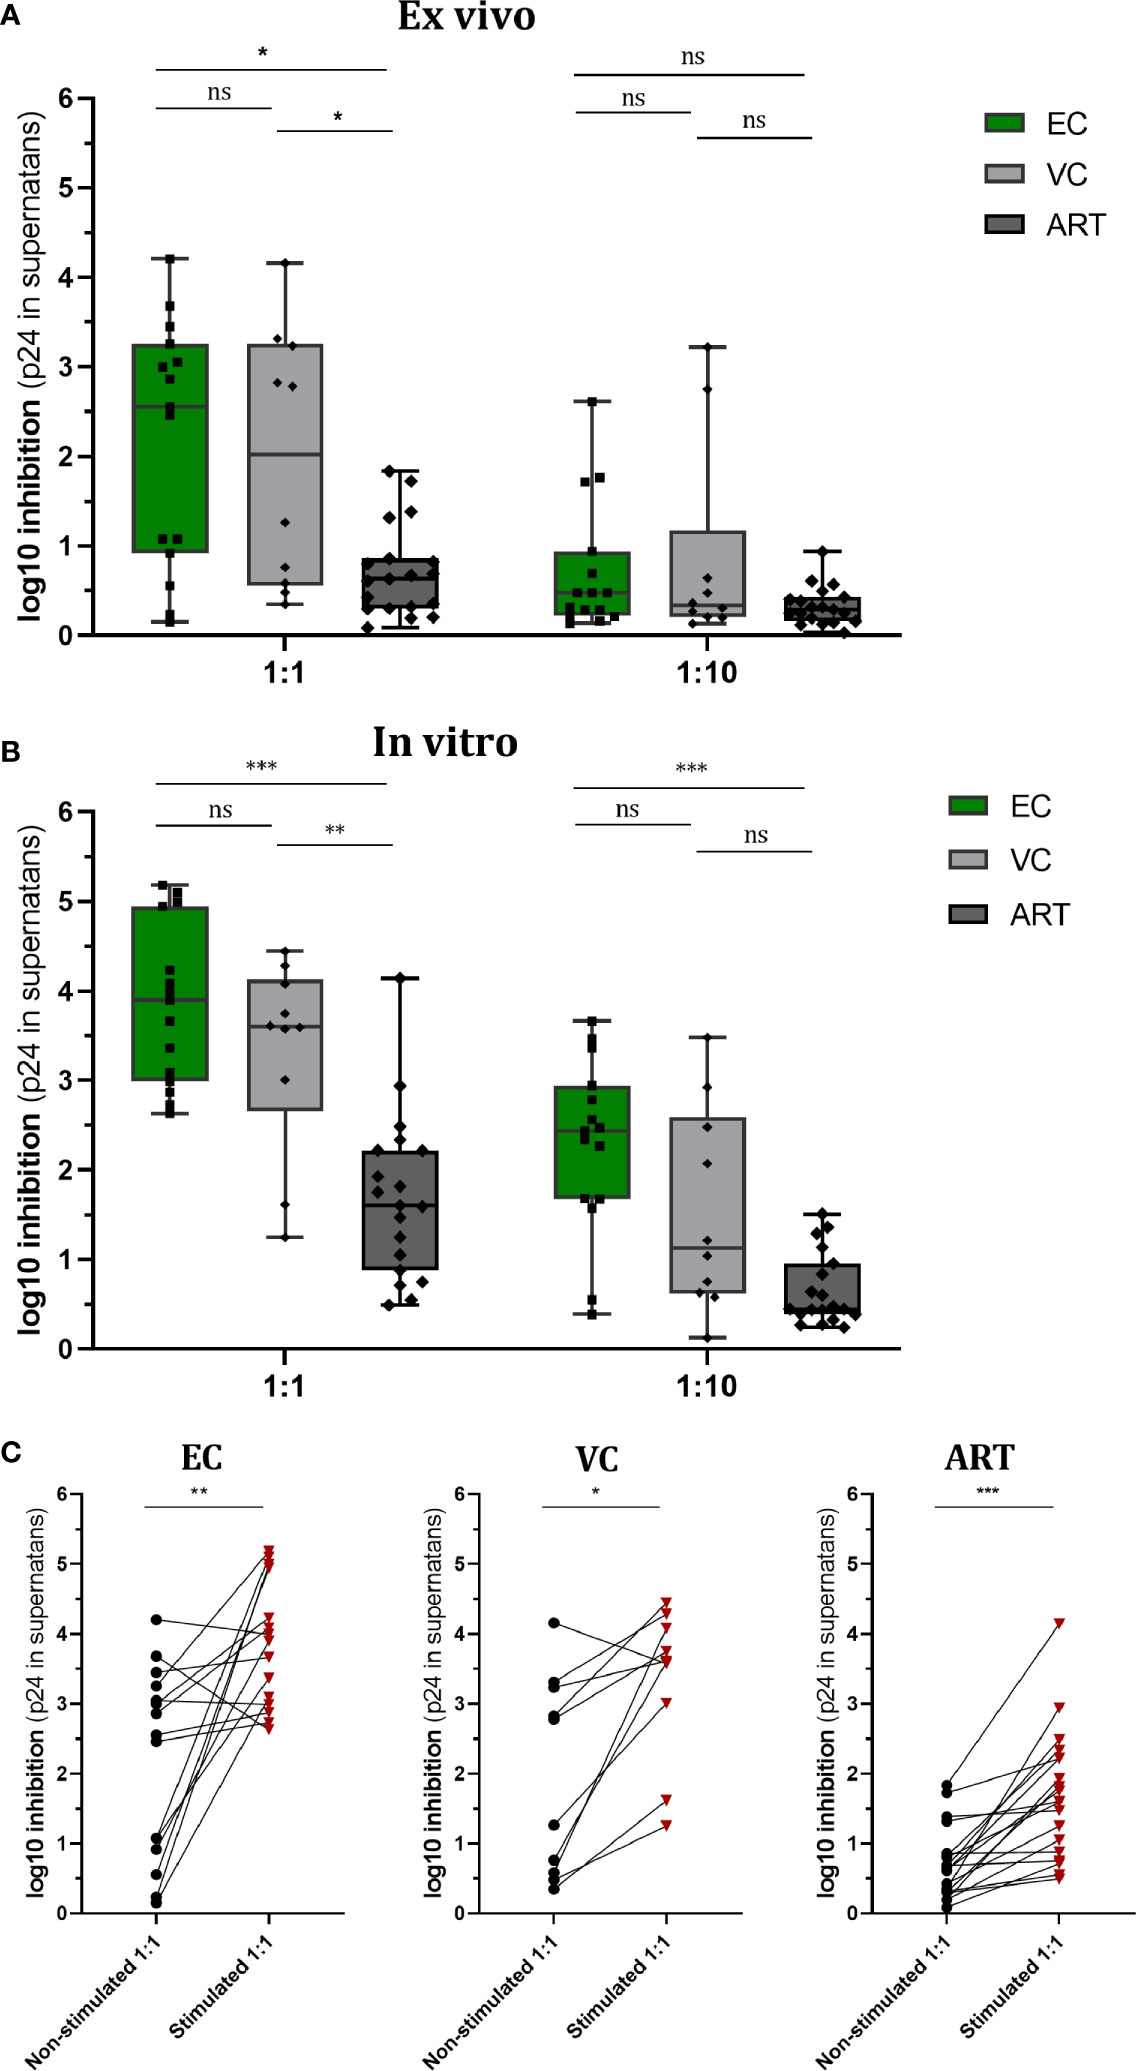
Figure 1 Viral Suppressive capacity is highest in EC and significantly increased after peptide stimulation for all patient groups. Log10 inhibition of HIV p24 production measured for non-stimulated (A) and Gag PTE peptide pool (NIH) stimulated (B) CD8+ T cells towards superinfected autologous CD4+ T cells at E/T of 1:1 and 1:10. Statistical testing by non-parametric Kruskal Wallis with Dunn’s correction for multiple comparison. VSC compared between non-stimulated and stimulated conditions for each patient group (C). Analysis by Mann Whitney non-parametric statistics. *<0.05, **<0.01, ***<0.001; ns: not significant.
After Gag PTE stimulation (in vitro) for 7 days, VSC in EC and VC was still significantly higher than in ART patients (median VSC: EC 3.9, VC 3.6, ART 1.6.). Interestingly VSC stayed significantly elevated for EC when ten times less effector cells were present (Figure 1B) (median VSC: EC 2.4, VC 1.1, ART 0.4). This points to a higher presence of HIV-1 specific T cells or an increased per cell based ability to suppress viral outgrowth. Interestingly stimulation with the Gag peptides enhanced VSC in all patient groups (Figure 1C). The ratio of enhancement for VSC stimulated over non-stimulated condition (EC. 1.56, VC 1.78, ART 2.54) was the highest for ART patients.
Collectively, these data underline the importance of anti-Gag CD8+ T cell response for viral suppression across different clinical phenotypes. EC and VC harbored a high VSC already at baseline which further increased upon stimulation. ART patients, did show significant increase upon pre-stimulation as well raising the question which aspects of T cell immunity delineate progressors from controllers in this condition.
IFN-γ Secretion Increases After Stimulation and Correlates Moderately With VSC
IFN-γ secretion, measured by ELISPOT, is a hallmark of antiviral immunity and is frequently used to assess the effect of T cell vaccination strategies in clinical trials. In order to know whether secretion of IFN-γ does correlate with VSC we assessed the number of spot-forming cells (SFC) in non-stimulated PBMCs and Gag PTE-stimulated PBMCs. In both conditions, HD PBMCs showed minimal responses, as expected; ART patients showed a weak response as well (not significantly different from HD), but enhanced by stimulation (Figure 2A). In EC the response was heterogeneous but significantly increased from VC and ART when PBMCs were not-stimulated (Figure 2A). After stimulation for 7 days ELISPOT responses increased in all patient groups as compared to their respective non-stimulated condition (Wilcoxon paired rank test, EC: p < 0.0005, VC: p < 0.005 and ART: p< 0.005). The fold change of stimulated versus non-stimulated (ratio of median values) condition per patient group was: EC (2.25), VC (1,98), ART (2.84). Hence, the number of IFN-γ secreting cells increased most in ART patients. However EC had still the highest total measures after peptide stimulation for 7 days (median SFC, EC: 392, VC: 214, ART: 151). Overall, the number of IFN-y secreting cells did correlate moderately with VSC for both conditions (Figures 2B, D).
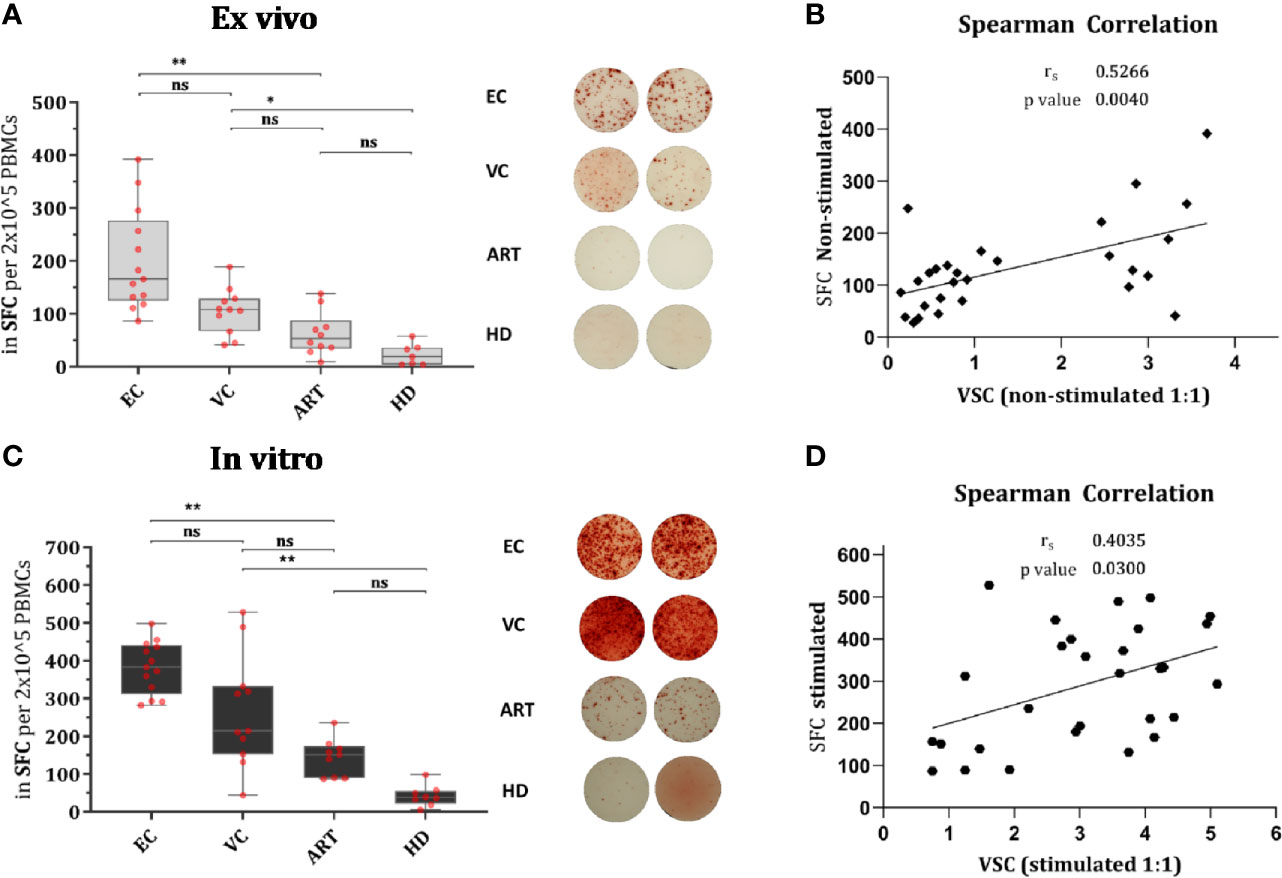
Figure 2 IFN-γ secretion is significantly increased in EC and correlates moderately with VSC. Overnight rested PBMCs were either ex vivo (Non-stimulated) (A) or in vitro (Stimulated) with Gag PTE peptides for 7 days (C) before IFN-γ secretion of PBMCs was measured by ELISPOT during 36 h in culture. Data plotted as spot forming counts (SFC) and representative duplicates are shown as photos. Statistical analysis by Kruskal Wallis nonparametric statistics with correction for multiple comparison by Dunn’s method. All HIV-1 infected patients were analyzed for correlation with VSC by Spearman’s rank correlation for Non-stimulated (B) and Stimulated (D) PBMCs. *lt;0.05, **<0.01; ns: not significant.
Upon Gag Peptide Stimulation CD8+ T Cells Increase Ki67 and CXCR5 but IFN-γ and CD107a Are Significantly Upregulated in HIV Controllers Only
EC showed significantly increased production of IFN-γ in CD8+ T cells after Gag PTE prestimulation compared with non-stimulated PBMCs but also compared to other patient groups (Figure 3A). Remarkably, pre-stimulation selectively enhanced IFN-γ production in EC and not in VC or ART (Figure 3A). CD107a expression was similarly low in non-stimulated cells from all groups but significantly increased in EC and VC after pre-stimulation, although more pronounced in EC than in VC or ART patients (Figure 3B). A similar trend was observed for Ki67, a proliferation-associated marker, but the increase in expression after pre-stimulation, was significant in all HIV(+) subjects, including ART. However, EC showed significantly higher percentages of Ki67 positive cells than VC and ART (Figure 3C). Of note Ki67 in the ART group was also significantly increased compared to uninfected, healthy controls after peptide stimulation (p <0.05, not shown in the graph) underlining GAG specific CD8+ T cell proliferation. Interestingly an increase in CXCR5 was observed on CD8+ T cells which was significant for EC and ART (Figure 3D). The analysis of bulk CD8+ T cells showed no difference in Granzyme B or Perforin (data not shown). There was no correlation with VSC for IFN-γ, CD107a and CXCR5. Ki67 correlated only weakly with VSC (Supplementary Figure 3C). Overall, these data showed that all HIV-1 patients respond to Gag stimulation by upregulation of the proliferation marker, Ki67. IFN-γ and CD107a, however, were selective traits of HIV controllers.
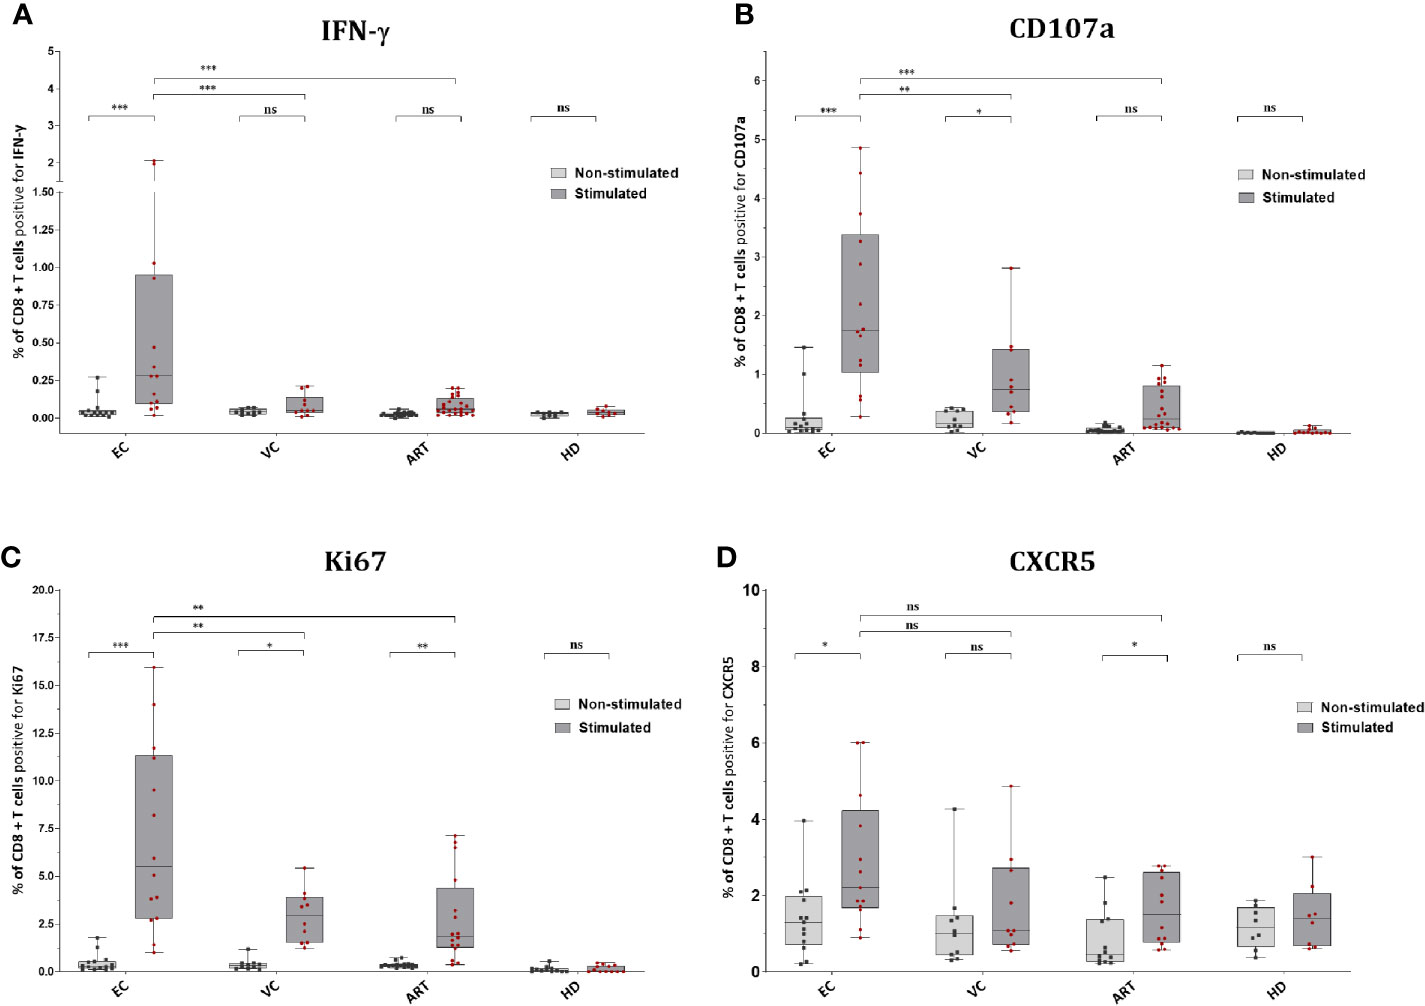
Figure 3 CD8+ T cells of EC express significantly more IFN-γ, CD107a, Ki67 and CXCR5 after peptide stimulation. Expression of IFN-y (A), CD107a (B), Ki67 (C), and CXCR5 (D) on CD8+ T cells ex vivo or Non-stimulated (light grey) and in vitro or Stimulated (dark grey). Statistical comparison by Kruskal Wallis with Dunn’s correction for multiple comparison across groups. Paired Wilcoxon rank test comparison of non-stimulated versus stimulated conditions within groups. *<0.05, **<0.01, ***<0.001; ns: not significant.
EC Develop Distinct, Multifunctional, and Cytotoxic CD8+ T Cell Subsets Upon Stimulation of Which One Has Potential Access to Lymph Node Follicles
To assess combined expression of phenotypical and functional proteins of CD8+ T cells in detail we established a Boolean gating strategy on the main memory and effector subsets. According to these analyses, we found several rather unique multifunctional subsets in EC (Figure 4). Two distinct subsets with a cytotoxic profile expressing Ki67, IFN-γ, CD107a, Perforin, and Granzyme B were observed, in the effector memory (Figure 4A) and the central memory compartment (Figure 4B). Both subsets were nearly absent in VC or ART patients and correlated convincingly with VSC (Figures 4A, B). Interestingly a third distinct subset with expression of CXCR5 and cytotoxic markers was identified (Figure 4C) which was significantly more prevalent in EC compared to ART but did not correlate with VSC (Figure 4C). Taken together, the identified subsets suggest the importance of multiple distinct cytotoxic subsets during natural control of HIV-1.
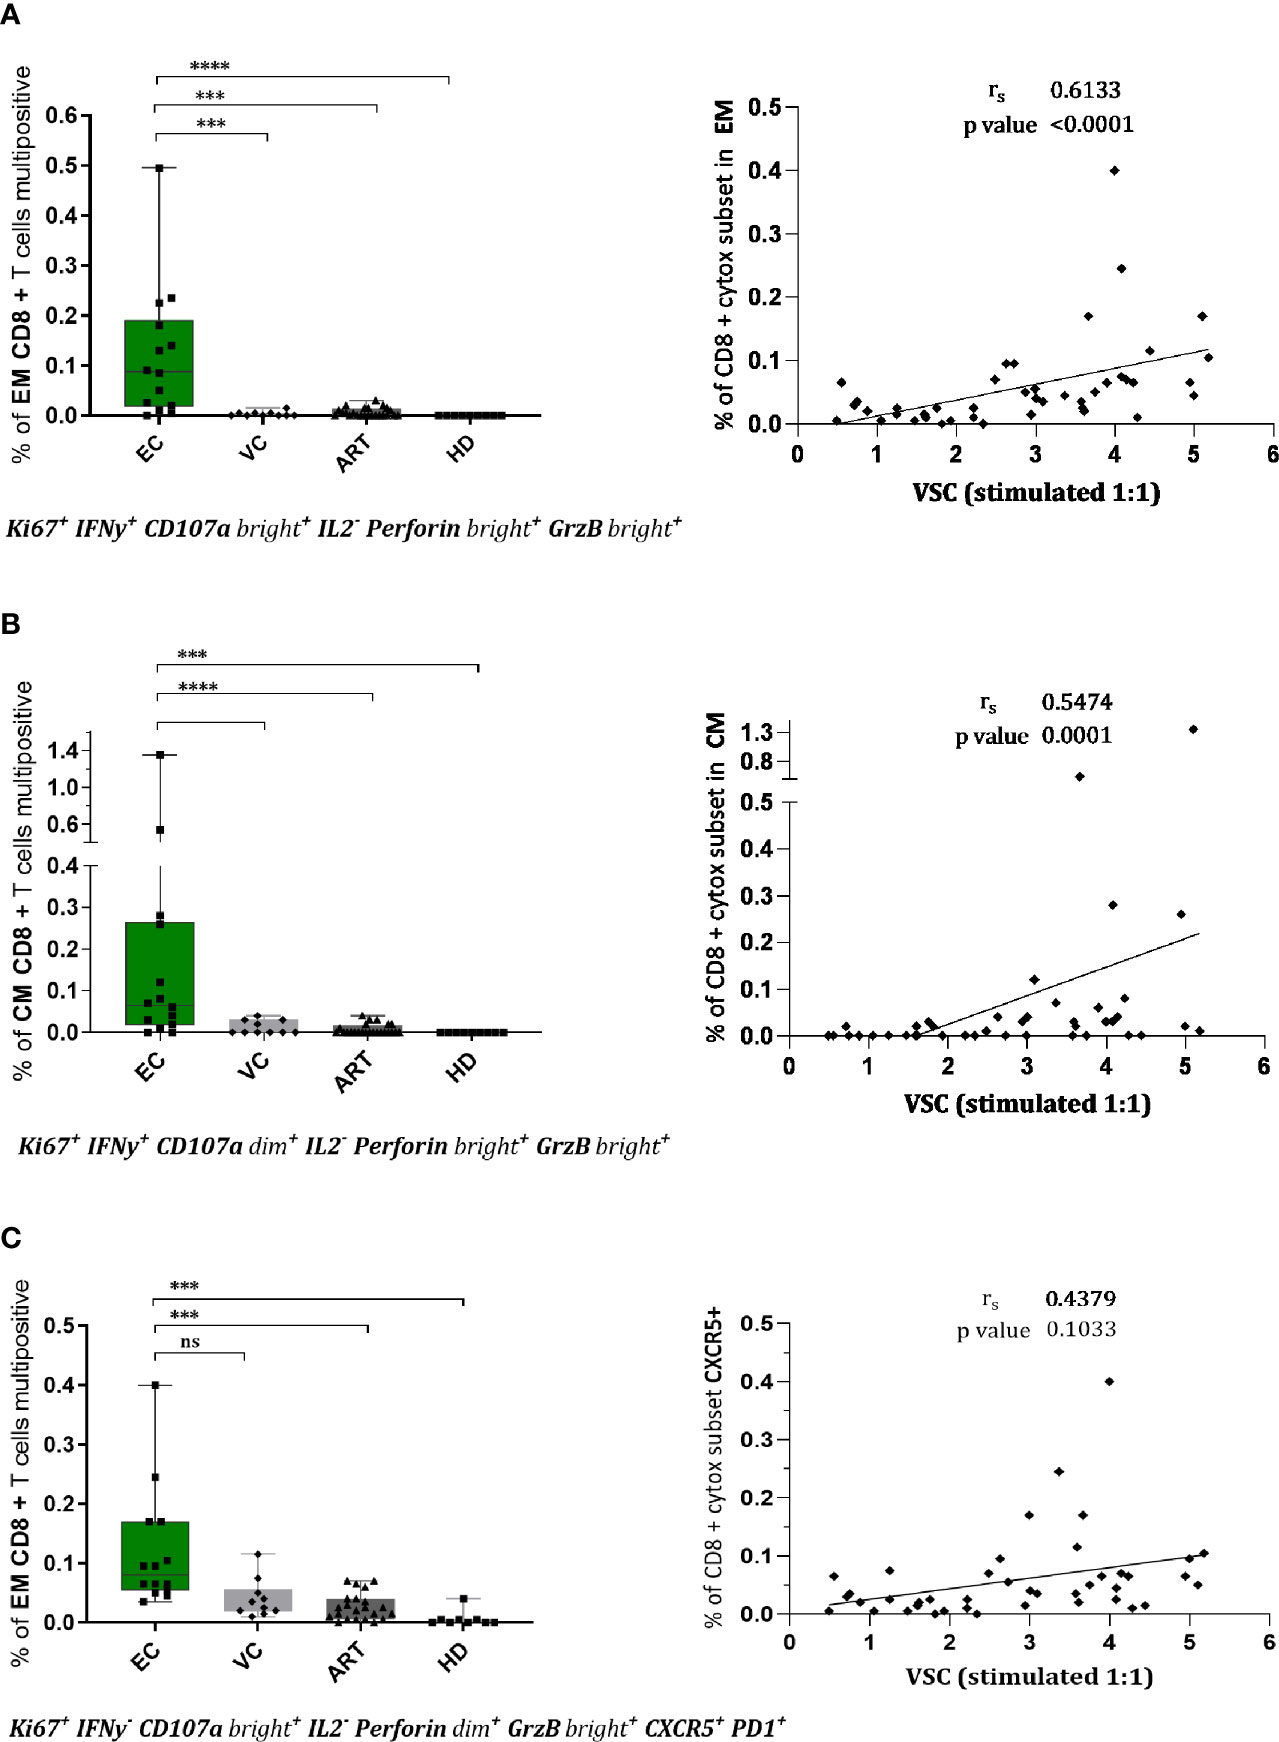
Figure 4 CD8+ T cells of EC show multifunctional, cytotoxic profiles in effector and central memory compartment which correlate with viral suppression. Phenotypes of CD8+ T cells were assessed upon stimulation for 7 days by flowcytometry. Combinatorial expression of different markers was analyzed by boolean gating strategy. CD8+ effector memory T cells (CCR7-CD45RA-) in (A, C) and central memory T cells in (B) with respective spearman correlations with viral suppression. The specific combination of expressed proteins is annotated below the graphs. Statistical testing in two steps, first the identification of hits by Kruskal Wallis with a FDR of 0.2 followed by non-parametric Kruskal Wallis comparison with Dunn correction for multiple comparison. ***<0.001, ****<0.0001, ns: not significant.
Slight Increase in TNF-α but No Further Differences in Cellular Phenotype nor Soluble Factors During the Co-Culture of VIA
To explore the mechanism of action by which CD8+ T cells suppress viral outgrowth during VIA culture we performed flow cytometry at 120 h in co-culture (Figure 5). TNF-α showed a slight but significant increase in EC compared to ART (Figure 5A) but its expression did not correlate with VSC (data not shown). For all other proteins, a strong expression of the proliferation marker (Ki67), the effector molecule (Perforin) and terminal differentiation marker (CD57) was detected in all patient groups (Figure 5B). Especially the high levels of Perforin suggest an involvement of direct cell to cell killing. PD-1 expression trended higher in ART patients without any significance compared to viral controllers (Figure 5B). Overall, besides TNF-α, single marker expression levels did not show any significant differences between patient groups. Furthermore, Boolean analysis of combinatorial expression revealed no significant differences among clinical phenotypes as well (data not shown). In addition, we assessed the effect of in-vitro superinfection of CD4+ T cells on the CD8+ T cells responses during coculture by comparing cocultures of non-superinfected CD4+ T cells with superinfected CD4+ T cells. We did not detect any differences (Supplemental Figure 5). Interestingly and although only assessed on a small number patients, we observed a trending difference in CD8+ T cells co-expressing Ki67, Perforin and IFN-γ at only 48 h in coculture (Supplementary Figure 6). In addition to these data we further assessed soluble markers (IFN-γ, IL-6, IP10, MIP-1β, TNF-α and TRAIL) from the culture supernatants at 72 h in coculture with no significant changes across patient groups (Supplementary Figure 7).
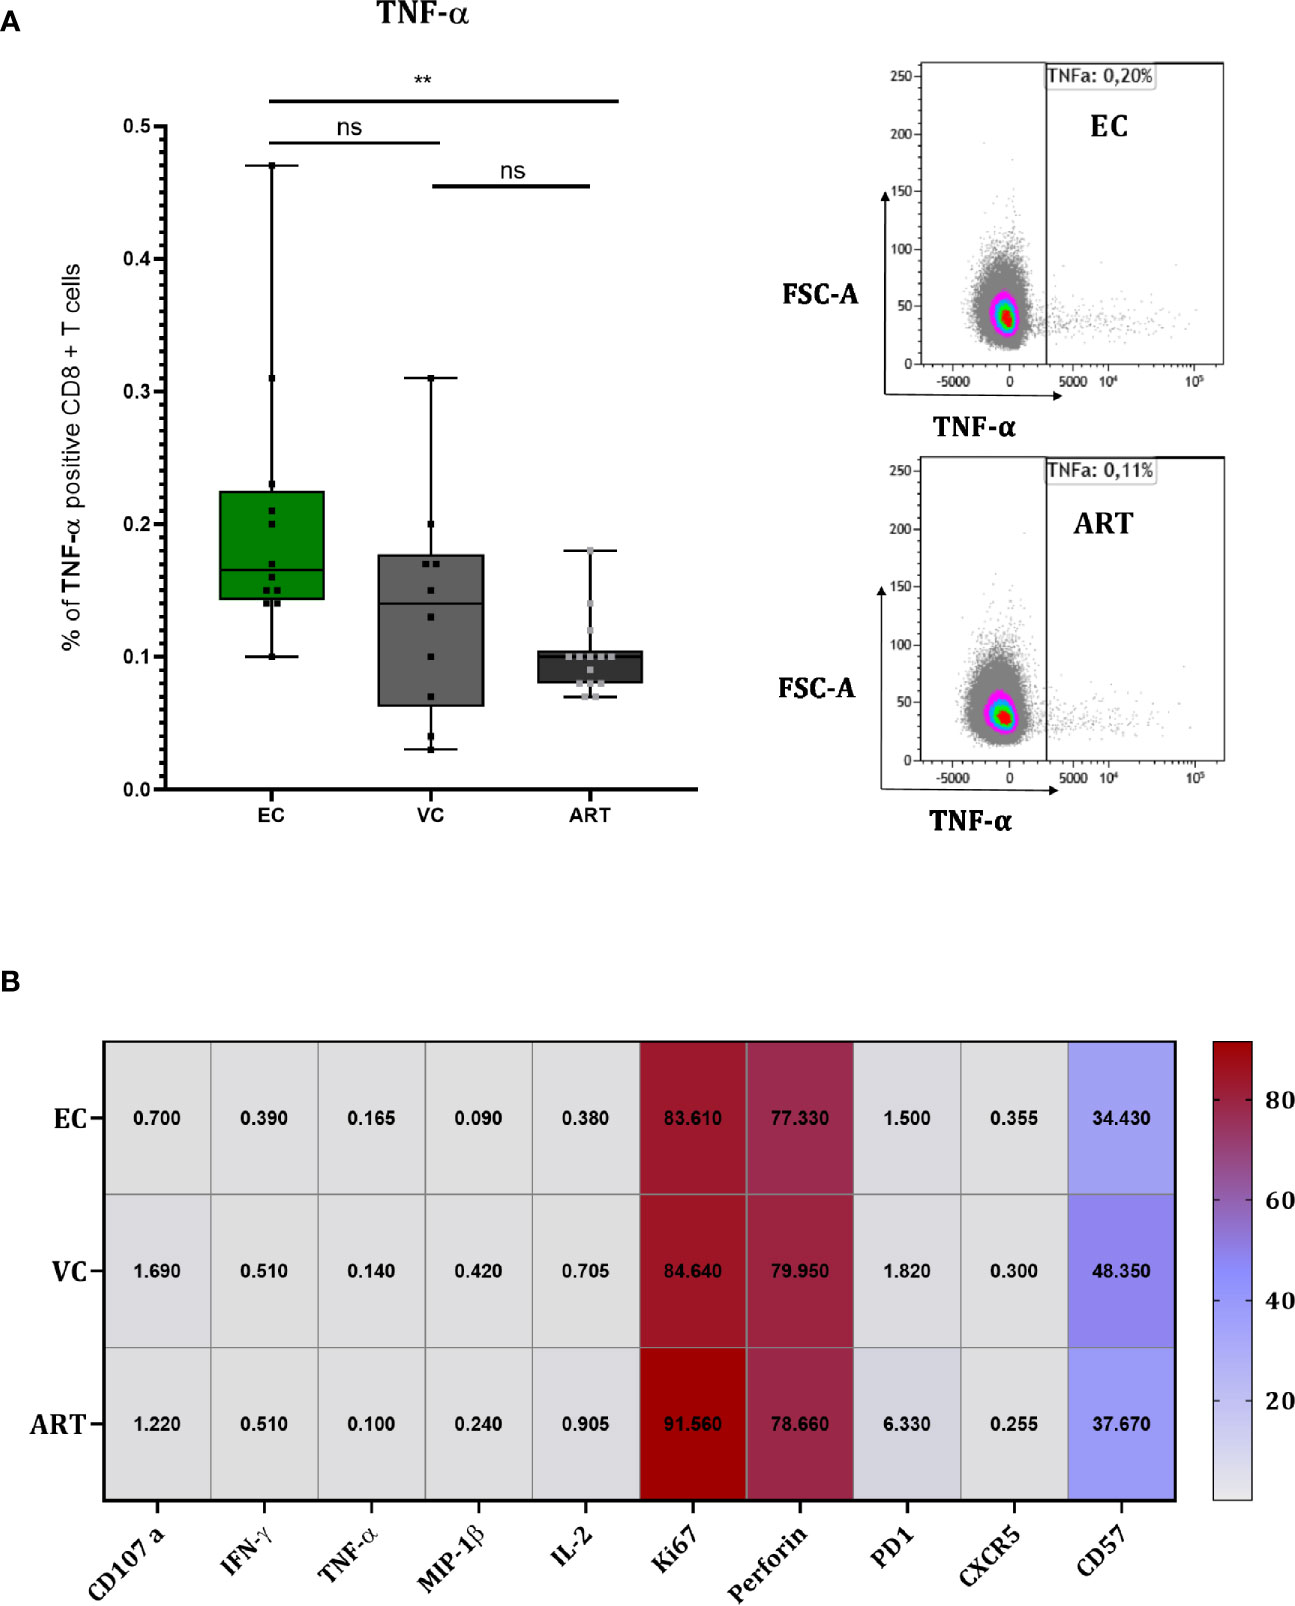
Figure 5 CD8+ T cells of EC show slightly higher TNF-α production but overall no differences during coculture screening. TNF-α measured at 120 h in coculture with representative flow charts (A). Heat Map depicting median expression of proteins in columns and patient group in rows with exact values plotted inside of the cells of the heat map (B). Statistical testing by Mann Whitney nonparametric statistics. **<0.01; ns, not significant.
Discussion
Evidence for the importance of anti–HIV-1 CD8+ T cell responses during natural control continues to substantiate. In our study, we evaluated two aspects of in vitro viral suppression in patients with natural control of HIV-1 infection and well-treated progressors: the ex vivo “effector function” (unstimulated condition) as well as the “memory function” (after in vitro stimulation with Gag peptides for 7 days). We focused specifically on the immune phenotypes of CD8+ T cells and their functionality. While VSC did only weakly correlate with the viral reservoir and not with the clinical parameters of the patients, we observed a clear association with IFN-γ secretion and proliferation markers of CD8+ T cells. Furthermore, we identified three cytotoxic subsets with different tissue homing abilities specific for natural control of HIV-1. One of these Gag reactive memory subsets expressed CXCR5 thus has potential access to the B cell zone of lymphoid tissues. Overall, we show that the use of a polyvalent Gag peptide pool induced a significant increase of VSC in HIV-1 infected patients, including treated progressors. However, multifunctional cytotoxic CD8 T cell responses emerge in HIV controllers only and hence might be key to sustained ART free HIV-1 control.
Several studies have reported elevated ex vivo VSC in EC compared to progressors providing a direct link between control of viremia and anti-viral CD8+ T cell immunity (9, 25, 26, 28, 38, 39). We observed a significant higher suppression of EC in non-stimulated CD8+ T cells as well, however with a higher heterogeneity across EC compared to other reports (Figure 1A). Interestingly the use of lower E:T ratio (1:10) abrogates suppression of non-stimulated CD8+ T cells in our setting in contrast to what Cirion et al. have reported. They observed the same level of VSC for HIV controllers in 1:1 and 1:10 ratios (38). Possible reasons for these divergent findings could be the slightly different technical setup for the VIA and different Gag peptide pools for stimulation. In addition, the used cryopreserved PBMCs could have introduced variance, although we applied the widely established procedure of overnight resting for functional studies on lymphocytes before use (40, 41), we cannot rule out an effect of cryopreservation.
In contrast with most other studies we included VC and EC as two distinctive groups of slow progressors. It has to be emphasized that the current median pVL in this group was 86 copies/ml (Table 1). Consequently at this low range a big proportion of these patients was categorized as EC in the past when detection limits for pVL were at 50 copies/ml or higher. Therefore, caution is advised when relating our findings to the existing literature. Secondly, most studies either do merge EC and VC or just look at EC. As a result, studies on VC are comparably scarce. Our data shows that VC excerpt comparable VSC to EC (Figure 1A). The study from Spentzou et al. has reported similar results (34). This suggests that slightly elevated pVLs do not reflect a loss of CD8+ T cell suppression. Interestingly at the current understanding elevated pVL could even contribute to the maintenance of anti-viral CD8+ T cell responses because decreasing pVLs during the initiation of ART associated with loss of VSC in progressors (39). But for VC we did not find any correlation between pVL and VSC (Supplementary Figure 4), suggesting that the level of viremia in these patients does not reflect a loss or gain in CD8+ T cell functionality.
In several previous studies Gag-specific CD8+ T cell responses (measured by ELISPOT or flow cytometry) were inversely correlated to viral load and were also described to be a major contributor to increased VSC (27, 28, 42). We sought to investigate the potential of 7 days Gag stimulation using the PTE Gag peptide pool (NIH reagents program) across the different patient groups. These peptides cover multiple overlapping sequences reflecting the natural diversity of circulating HIV-1 strains (21). Consequently, they offer a large antigenic breadth, the coverage of potential T cell epitopes, and depth, the cross recognition of variants of epitopes. Hence many of those are clustered in conserved regions (43–45). Likewise, the importance of breadth in the anti-Gag response during control of HIV-1 or SIV has been underscored (46, 47). To this end, we hypothesized that expanding such memory T cells creates an opportunity to delineate the decisive CD8+ T cell subsets of HIV control. This because long lasting stimulation with conserved Gag epitopes boosted VSC in progressors (30) and thus could allow to identify detailed functional differences in T cell subsets compared to controllers.
We observed that VSC increased with several orders of magnitude significantly after stimulation with PTE Gag peptides in all patient groups (Figure 1C). This strong effect reflects their potency possibly rooted in the rapid recognition of Gag epitopes as they can be presented on HLA-I molecules even before viral integration (48, 49). The ability to redirect CTL killing against reactivated autologous virus by Gag stimulation was reported previously for EC and ART, however using IL2 during pre-stimulation of CD8 + T cells (50), which we omitted to not alter the phenotype of cells by exogenous cytokines and reduce background noise in the VIA. Notably both controller groups showed significantly higher VSC after peptide stimulation as compared to ART (Figure 1B). This might be rooted in an increased immunodominance of anti-Gag T cells of controllers (51, 52), which could be further amplified by their expansion. The significantly higher expression of Ki67, a proliferation marker, on CD8+ T cells of EC could support this hypothesis (Figure 3C). Importantly the proliferation of antigen specific CD8+ T cells was associated to natural control by other studies as well (10, 11). Shan et al. also observed increased proliferation for ART patients in response to Gag peptides (50), our data revealed significant higher expression of Ki67 pointing into a similar direction (Figure 3C). Next, we saw that the VSC of EC after pre-stimulation with Gag PTE stayed elevated even when E:T ratio is decreased to 1:10 (Figure 1B) indicating a higher magnitude in Gag specific CD8+ T cell expansion (as shown by higher Ki67 expression in EC) (Figure 3C) or a stronger per cell suppressive capacity.
To explore this aspect in detail we applied IFN-γ ELISPOT at baseline and after 7 days of peptide stimulation. ELISPOT results clearly showed the increased frequency of IFN-γ-secreting T cells in PBMCs of EC at baseline and after prestimulation (Figures 2A, C). We observed only moderate correlation with VSC for both conditions (Figures 2B, D). Other studies reported also divergent results (28, 53). Interestingly an in vitro vaccination study reported a correlation with IFN-γ only when co-expressed with CD107a and MIP-1β (54). This suggests that not IFN-γ alone but rather multifunctionality might be the best reflector of increased VSC.
To explore functionality and phenotype on a single cell level we phenotyped by 18 color flow cytometry without and after 7 days of peptide stimulation. The expression of IFN-γ in total CD8+ T cells was significantly increased only after stimulation between EC and VC and ART (Figure 3A). The degranulation marker CD107a increased significantly for both groups, VC and EC (Figure 3B). Interestingly Ki67 expression increased significantly in all three groups which was suggestive of a specific HIV-1 proliferative response to the Gag epitopes (Figure 3C), and corroborated by its strict absence in HD controls (Figures 3A–C). Ki67 did show moderate correlation with viral suppression in vitro.
Polyfunctional anti-viral CD8+ T cells, defined as “having the ability to secrete chemokines and mediate cytolysis” (55), are a qualitative feature of EC (18, 45, 56). To assess the combinatorial expression of functional and phenotypic we applied a Boolean gating strategy. By doing so, we identified three distinct subsets significantly increased in EC. Two of those showed strong cytotoxic characteristics (Figures 4A, B) from the EM and CM compartment which correlated convincingly with VSC (Figure 4). This provides evidence for the co-existence of multiple subsets that could be implicated in HIV-1 control homing to central lymphoid organs and peripheral tissues.
Intriguingly Gag peptide stimulation upregulated CXCR5 in EC and ART patients (Figure 3D). Recent studies suggest that circulating CXCR5+ CD8+ T cells are major producers of IL21 and associate with limited HIV-1 replication (57). We cannot confirm differences either at baseline nor after peptide stimulation. However a cytotoxic subset expressing CXCR5 with potential access to the B cell follicles (Figure 4C) a major site of the viral reservoir (58, 59) was significantly expanded in natural controllers. Recent literature is controversial on the functionality of these cells. Reuter et al. have reported a strong correlation between CXCR5+ CD8+ T cells isolated from lymph node (LN) and pVL in VC but a decreased killing ability compared to bulk CD8+ T cells from PBMCs of the same patients (60). In contrast, although Petrovas et al. observed a similar strong correlation with pVL they find increased killing capacities of follicular CD8+ T cells from LN as compared to CXCR5 negative counterparts despite their compromised cytokine profile (61). To our knowledge, we characterized for the first time a polyfunctional CD8+ T cell subset combining features of cytotoxicity, proliferation and expressing CXCR5 after expansion with Gag peptides. However we observed no correlation with VSC (Figure 4C) that could be explained by the low presence of this subset in blood. Still, this finding is of utmost importance since follicular helper CD4+ T cells (TFH), residing in B-cell follicles of secondary lymphoid tissues, represent a major site of viral persistence (58). Future studies need to evaluate if Gag specific CXCR5 positive subsets have suppressive abilities and access to the LN of HIV controllers. Importantly, a recent study has further substantiated that the predominant proportion of circulating TCR repertoires in HIV-1 infected patients under ART is able to target latent reservoirs (62). Future studies now should scrutinize how to achieve proper qualitative features in such effector cells. In conclusion, therapies boosting existing T cell immunity are a potential angle of intervention but need to prove their potency in vivo as resistance of reservoirs to complete elimination was a concern raised earlier (63).
To elucidate the mechanism of HIV-1 CD8+ T cell mediated suppression in vitro during the VIA coculture we phenotyped T cells 120 h after the coculture when solid viral replication was observed by intracellular P24 staining (data not shown). Only for TNF-α we found a very minor increase which didn’t correlate with VSC. Overall we could not identify any clear significant differences between patient groups, but the strong increase of Perforin on total CD8+ T cells of all patients (Figure 5B) suggests a direct cytotoxic mechanism as previously proposed (9). Interestingly we detected Perforin, IFN-γ and Ki67 positive subsets at 48 h between EC and ART (Supplementary Figure 6) in a subset of seven patients suggesting that the assessment for phenotypic and functional properties should be done earlier, before notable viral replication. Furthermore, at 120 h in coculture the effect of exogenous IL-2 supplemented to the VIA media might have already levelled out phenotypic differences between clinical phenotypes. A similar effect might apply to the levels of cytokines or chemokines at 72 h in coculture (Supplementary Figure 7). Overall the exact mechanism of viral suppression in vitro remains to be determined.
In conclusion, our work demonstrated that stimulation with polyvalent Gag peptide pools efficiently increased VSC in all patient groups. Interestingly upregulation of CXCR5 expression was noted upon pre-stimulation. The increased frequencies of several distinct multifunctional CD8+ T cells subsets which correlated convincingly with the magnitude of viral suppression is an particular attribute of natural controllers. Furthermore Gag targeting CXCR5+CD8+ T cells represent a unique subset of antiviral CD8+ T cells that may play a pivotal role in the containment of reservoirs. Overall, our data highlighted a multi-qualitative anti-Gag CD8+ T cell response during control of HIV-1 that should be elicited for future vaccination strategies to achieve ART free viral remission.
Data Availability Statement
The raw data supporting the conclusions of this article will be made available by the authors, without undue reservation.
Ethics Statement
Blood samples were collected in accordance with the Declaration of Helsinki. The study was approved by each local ethical committee and received the ethical approval from the university hospital of Antwerp (Belgium) under the registration number: B300201731330 as a multicenter Belgian cohort called “PhenoCure”. All participants gave written informed consent.
PhenoCure Study Group
The authors of the PhenoCure Study group are: Eric Florence, ZWZsb3JlbmNlQGl0Zy5iZQ==, Institute of tropical medicine, HIV/STD outpatient department, Antwerp Belgium; Maartje van Frankenhujizen, bXZhbmZyYW5rZW5odWlqc2VuQGl0Zy5iZQ==, Institute of tropical medicine, HIV/STD outpatient department, Antwerp Belgium; Joeri Aerts, am9lcmkuQWVydHNAdnViLmJl, Vrije Universiteit Brussel, Neuro-aging and Viro-imunotherapy research group, Brussels, Belgium; Sabine Allard, U2FiaW5lLkFsbGFyZEB2dWIuYWMuYmU=, Universitair Ziekenhuis Brussels, internal medicine-endocrinology, Brussels, Belgium; Stephane De Wit, c3RlcGhhbmUuZGUud2l0QHVsYi5hYw==, Saint-Pierre University Hospital, Service of Infectious Diseases, Brussels, Belgium; Nescoi Coca, Y29jYS5uZWNzb2lAc3RwaWVycmUtYnJ1LmJl, Saint-Pierre University Hospital, Service of Infectious Diseases, Brussels; Peter Messiaen, cGV0ZXIubWVzc2lhZW5AdWhhc3NlbHQuYmU=, Jessa Ziekenhuis, Hasselt, Belgium; Michel Moutschen, bW1vdXRzY2hlbkBjaHUudWxnLmFjLmJl, Liège University Hospital, Université de Liège, Liège, Belgium.
Author Contributions
PA designed, performed and analyzed experiments, drafted figures, and wrote the manuscript. GI did setup some of the used FACS panels. J-YS did the multiplex ELISA and supported with P24 ELISA experiments. LV did perform total HIV-1 DNA measurements by ddPCR. GV designed and supervised the study and wrote the manuscript. CS-D designed and supervised the study. The PhenoCure Study group designed and performed the recruitment of the patients and the collection of the samples. All authors contributed to the article and approved the submitted version.
Funding
PA received an AFR PhD grant (ID: PHD-2015-1-10111126) from the FNR in Luxembourg.
Conflict of Interest
The authors declare that the research was conducted in the absence of any commercial or financial relationships that could be construed as a potential conflict of interest.
Acknowledgments
The authors would like to thank all patients who participated in the PhenoCure Study. We thank BioMARIC (Gent,Belgium), for providing the p24 ELISA kits and the RedCross Luxembourg, who provided blood from healthy volunteers to the study (protocol reference number:LIH-2018-0005). The following reagents were obtained through the HIV Reagent Program, Division of AIDS, NIAID, NIH: Peptide Array, Human Immunodeficiency Virus Type 1 Potential T-Cell Epitopes (PTE) Gag Region, ARP-11554, contributed by DAIDS/NIAID; Anti-Human CD3/8 Bi-specific Monoclonal, ARP-12277, contributed by Drs. Johnson Wong and Galit Alter.
Supplementary Material
The Supplementary Material for this article can be found online at: https://www.frontiersin.org/articles/10.3389/fimmu.2020.622343/full#supplementary-material
Supplementary Figure 1 | IL18 concentration in plasma differs significantly between EC and ART. Plasma samples isolated during blood donation were analyzed for the concentration of cytokines IL18 (A), IL-6 (B), IP-10 (C), and TNF-α (D). Statistical testing by nonparametric Kruskal Wallis test with Dunn correction for multiple comparison.
Supplementary Figure 2 | HIV-1 DNA is significantly lower in EC compared to ART and has a weak negative correlation with VSC over the whole cohort. Absolute quantification of cell associated HIV-1 DNA on purified CD4 + T cells by ddPCR. Five samples (A) (two of EC and three of VC measurements were below the confidence interval of the negative control and cannot be accurately quantified. These values have been excluded from the analysis to preclude statistical bias). Testing was done with Kruskal Wallis nonparametric statistics with Dunn correction. Spearman correlation of cell associated HIV-1 DNA with VSC on non-stimulated (B) and stimulated (C) cells.
Supplementary Figure 3 | No correlation with IFN-γ, CD107a, CXCR5 but a weak correlation with Ki67 expression and VSC. Correlation of CD8+ T cell expression of IFN-γ (A), CD107a (B), Ki67 (C), and CXCR5 (D) with VSC. Non-parametric rank spearman correlation with rho and p values are given in the figure.
Supplementary Figure 4 | No correlation of pVL with VSC of VC. Spearman correlation of pVL with VSC for non-stimulated (A) and stimulated (B) CD8+ T cells given for VC only because all other patients of the cohort have undetectable viremia. Statistical values plotted in the graph.
Supplementary Figure 5 | No impact on the cellular phenotypes detected by superinfection at 120 h in coculture. To assess if the superinfection with HIV-1 (IIIB) has a detectable impact on the CD8+ T cell phenotypes we analyzed superinfected and non-superinfected conditions separately by flow cytometry. No differences were found as exemplified here for IFN-y (A) and CD107a (B) staining’s. Statistics by paired Mann Whitney nonparametric testing.
Supplementary Figure 6 | A trend between EC and ART patients of Ki67, Perforin, and IFN-γ co-expressing CD8+ T cells at 48 h in coculture. To explore the kinetic pattern of cytotoxic markers during coculture we phenotyped seven patients at 48 h. Statistical testing by Mann-Whitney nonparametric comparison.
Supplementary Figure 7 | Concentration of cytokines at 3 days in VIA coculture revealed no differences between patient groups. Supernatants of VIA coculture at 72 h (day 3) were tested with mutliplex ELISA for IFN-γ (A), IL-6 (B), IP-10 (C), MIP-1β (D), TNF-α (E), and TRAIL (F). Statistical testing by nonparametric Kruskal Wallis test with Dunn correction for multiple comparison.
References
1. Finzi D, Hermankova M, Pierson T, Carruth LM, Buck C, Chaisson RE, et al. Identification of a reservoir for HIV-1 in patients on highly active antiretroviral therapy. Sci (80- ) (1997) 278(5341):1295–300. doi: 10.1126/science.278.5341.1295
2. El-Sadr WM, Lundgren JD, Neaton JD, Gordin F, Abrams D, Arduino RC, et al. CD4+ count-guided interruption of antiretroviral treatment. N Engl J Med (2006) 355(22):2283–96. doi: 10.1056/nejmoa062360
3. Calin R, Hamimi C, Lambert-Niclot S, Carcelain G, Bellet J, Assoumou L, et al. Treatment interruption in chronically HIV-infected patients with an ultralow HIV reservoir. AIDS (2016) 30(5):761–9. doi: 10.1097/QAD.0000000000000987
4. Gurdasani D, Iles L, Dillon DG, Young EH, Olson AD, Naranbhai V, et al. A systematic review of definitions of extreme phenotypes of HIV control and progression. AIDS (2014) 28(2):149–62. doi: 10.1097/QAD.0000000000000049
5. Altfeld M, Kalife ET, Qi Y, Streeck H, Lichterfeld M, Johnston MN, et al. HLA alleles associated with delayed progression to AIDS contribute strongly to the initial CD8+ T cell response against HIV-1. PloS Med (2006) 3(10):1851–64. doi: 10.1371/journal.pmed.0030403
6. Fellay J, Shianna KV, Ge D, Colombo S, Ledergerber B, Weale M, et al. A whole-genome association study of major determinants for host control of HIV-1. Sci (80- ) (2007) 317(5840):944–7. doi: 10.1126/science.1143767
7. Pereyra F, Jia X, McLaren PJ, Telenti A, De Bakker PIW, Walker BD. The major genetic determinants of HIV-1 control affect HLA class I peptide presentation. Sci (80- ) (2010) 330(6010):1551–7. doi: 10.1126/science.1195271
8. Hersperger AR, Martin JN, Shin LY, Sheth PM, Kovacs CM, Cosma GL, et al. Increased HIV-specific CD8+ T-cell cytotoxic potential in HIV elite controllers is associated with T-bet expression. Blood (2011). doi: 10.1182/blood-2010-12-322727
9. Migueles SA, Osborne CM, Royce C, Compton AA, Joshi RP, Weeks KA, et al. Lytic Granule Loading of CD8+ T Cells Is Required for HIV-Infected Cell Elimination Associated with Immune Control. Immunity (2008) 29(6):1009–21. doi: 10.1016/j.immuni.2008.10.010
10. Migueles SA, Laborico AC, Shupert WL, Sabbaghian MS, Rabin R, Hallahan CW, et al. HIV-specific CD8+T cell proliferation is coupled to perforin expression and is maintained in nonprogressors. Nat Immunol (2002) 3(11):1061–8. doi: 10.1038/ni845
11. Day CL, Kiepiela P, Leslie AJ, van der Stok M, Nair K, Ismail N, et al. Proliferative capacity of epitope-specific CD8 T-cell responses is inversely related to viral load in chronic human immunodeficiency virus type 1 infection. J Virol (2007) 81(1):434–8. doi: 10.1128/JVI.01754-06
12. Betts MR, Nason MC, West SM, De Rosa SC, Migueles SA, Abraham J, et al. HIV nonprogressors preferentially maintain highly functional HIV-specific CD8+ T cells. Blood (2006) 107(12):4781–9. doi: 10.1182/blood-2005-12-4818
13. Peris-Pertusa A, López M, Rallón NI, Restrepo C, Soriano V, Benito JM. Evolution of the functional profile of HIV-specific CD8 + T cells in patients with different progression of HIV infection over 4 years. J Acquir Immune Defic Syndr (2010) 55(1):29–38. doi: 10.1097/QAI.0b013e3181e69609
14. Genovese L, Nebuloni M, Alfano M. Cell-mediated immunity in elite controllers naturally controlling hiv viral load. Front Immunol (2013) 4. doi: 10.3389/fimmu.2013.00086
15. Carcelain G, Autran B. Immune Interventions In HIV Infection. Immunol Rev (2013) 254(1):355–71. doi: 10.1111/imr.12083
16. Edwards BH, Bansal A, Sabbaj S, Bakari J, Mulligan MJ, Goepfert PA. Magnitude of Functional CD8+ T-Cell Responses to the Gag Protein of Human Immunodeficiency Virus Type 1 Correlates Inversely with Viral Load in Plasma. J Virol (2002). doi: 10.1128/jvi.76.5.2298-2305.2002
17. Ferrando-Martinez S, Casazza JP, Leal M, Machmach K, Munoz-Fernandez MA, Viciana P, et al. Differential Gag-Specific Polyfunctional T Cell Maturation Patterns in HIV-1 Elite Controllers. J Virol (2012). doi: 10.1128/JVI.07034-11
18. Ferre AL, Lemongello D, Hunt PW, Morris MM, Garcia JC, Pollard RB, et al. Immunodominant HIV-Specific CD8+ T-Cell Responses Are Common to Blood and Gastrointestinal Mucosa, and Gag-Specific Responses Dominate in Rectal Mucosa of HIV Controllers. J Virol (2010). doi: 10.1128/JVI.00803-10
19. Miura T, Brumme ZL, Brockman MA, Rosato P, Sela J, Brumme CJ, et al. Impaired Replication Capacity of Acute/Early Viruses in Persons Who Become HIV Controllers. J Virol (2010). doi: 10.1128/JVI.00286-10
20. Henn MR, Boutwell CL, Charlebois P, Lennon NJ, Power KA, Macalalad AR, et al. Whole genome deep sequencing of HIV-1 reveals the impact of early minor variants upon immune recognition during acute infection. PloS Pathog (2012). doi: 10.1371/journal.ppat.1002529
21. Fischer W, Perkins S, Theiler J, Bhattacharya T, Yusim K, Funkhouser R, et al. Polyvalent vaccines for optimal coverage of potential T-cell epitopes in global HIV-1 variants. Nat Med (2007). doi: 10.1038/nm1461
22. Emu B, Sinclair E, Hatano H, Ferre A, Shacklett B, Martin JN, et al. HLA Class I-Restricted T-Cell Responses May Contribute to the Control of Human Immunodeficiency Virus Infection, but Such Responses Are Not Always Necessary for Long-Term Virus Control. J Virol (2008). doi: 10.1128/JVI.02176-07
23. Pereyra F, Addo MM, Kaufmann DE, Liu Y, Miura T, Rathod A, et al. Genetic and Immunologic Heterogeneity among Persons Who Control HIV Infection in the Absence of Therapy. J Infect Dis (2008). doi: 10.1086/526786
24. Noel N, Peña R, David A, Avettand-Fenoel V, Erkizia I, Jimenez E, et al. Long-Term Spontaneous Control of HIV-1 Is Related to Low Frequency of Infected Cells and Inefficient Viral Reactivation. J Virol (2016). doi: 10.1128/JVI.00419-16
25. Akinsiku OT, Bansal A, Sabbaj S, Heath SL, Goepfert PA. Interleukin-2 production by polyfunctional HIV-1-specific CD8 T cells is associated with enhanced viral suppression. J Acquir Immune Defic Syndr (2011). doi: 10.1097/QAI.0b013e318224d2e9
26. Lécuroux C, Girault I, Chéret A, Versmisse P, Nembot G, Meyer L, et al. CD8 T-Cells from Most HIV-Infected Patients Lack Ex Vivo HIV-Suppressive Capacity during Acute and Early Infection. PloS One (2013) 8(3). doi: 10.1371/journal.pone.0059767
27. Julg B, Williams KL, Reddy S, Bishop K, Qi Y, Carrington M, et al. Enhanced Anti-HIV Functional Activity Associated with Gag-Specific CD8 T-Cell Responses. J Virol [Internet] (2010) 84(11):5540–9. doi: 10.1128/JVI.02031-09
28. Sáez-Cirión A, Sinet M, Shin SY, Urrutia A, Versmisse P, Lacabaratz C, et al. Heterogeneity in HIV Suppression by CD8 T Cells from HIV Controllers: Association with Gag-Specific CD8 T Cell Responses. J Immunol (2009) 182(12):7828–37. doi: 10.4049/jimmunol.0803928
29. Yang H, Wu H, Hancock G, Clutton G, Sande N, Xu X, et al. Antiviral inhibitory capacity of CD8+ T cells predicts the rate of CD4+ T-cell decline in HIV-1 infection. J Infect Dis (2012) 206(4):552–61. doi: 10.1093/infdis/jis379
30. Pannus P, Adams P, Willems E, Heyndrickx L, Florence E, Rutsaert S, et al. In-vitro viral suppressive capacity correlates with immune checkpoint marker expression on peripheral CD8+ T cells in treated HIV-positive patients. AIDS (2019) 33(3):387–98. doi: 10.1097/QAD.0000000000002068
31. Huang S-H, McCann CD, Mota TM, Wang C, Lipkin SM, Jones RB. Have Cells Harboring the HIV Reservoir Been Immunoedited? Front Immunol (2019). doi: 10.3389/fimmu.2019.01842
32. Reuter MA, Del Rio Estrada PM, Buggert M, Petrovas C, Ferrando-Martinez S, Nguyen S, et al. HIV-Specific CD8+ T Cells Exhibit Reduced and Differentially Regulated Cytolytic Activity in Lymphoid Tissue. Cell Rep (2017). doi: 10.1016/j.celrep.2017.11.075
33. Mylvaganam GH, Rios D, Abdelaal HM, Iyer S, Tharp G, Mavinger M, et al. Dynamics of SIV-specific CXCR5+ CD8 T cells during chronic SIV infection. Proc Natl Acad Sci U S A (2017). doi: 10.1073/pnas.1621418114
34. Spentzou A, Bergin P, Gill D, Cheeseman H, Ashraf A, Kaltsidis H, et al. Viral Inhibition Assay: A CD8 T Cell Neutralization Assay for Use in Clinical Trials of HIV-1 Vaccine Candidates. J Infect Dis (2010). doi: 10.1086/650492
35. Rutsaert S, De Spiegelaere W, Van Hecke C, De Scheerder MA, Kiselinova M, Vervisch K, et al. In-depth validation of total HIV-1 DNA assays for quantification of various HIV-1 subtypes. Sci Rep (2018). doi: 10.1038/s41598-018-35403-6
36. Schvachsa N, Turk G, Burgard M, Dilernia D, Carobene M, Pippo M, et al. Examination of real-time PCR for HIV-1 RNA and DNA quantitation in patients infected with HIV-1 BF intersubtype recombinant variants. J Virol Methods (2007). doi: 10.1016/j.jviromet.2006.11.012
37. Blankson JN, Bailey JR, Thayil S, Yang H-C, Lassen K, Lai J, et al. Isolation and Characterization of Replication-Competent Human Immunodeficiency Virus Type 1 from a Subset of Elite Suppressors. J Virol (2007). doi: 10.1128/JVI.02165-06
38. Sáez-Cirión A, Lacabaratz C, Lambotte O, Versmisse P, Urrutia A, Boufassa F, et al. HIV controllers exhibit potent CD8 T cell capacity to suppress HIV infection ex vivo and peculiar cytotoxic T lymphocyte activation phenotype. Proc Natl Acad Sci U S A (2007) 104(16):6776–6781. doi: 10.1073/pnas.0611244104
39. Freel SA, Picking RA, Ferrari G, Ding H, Ochsenbauer C, Kappes JC, et al. Initial HIV-1 Antigen-Specific CD8+ T Cells in Acute HIV-1 Infection Inhibit Transmitted/Founder Virus Replication. J Virol (2012). doi: 10.1128/JVI.00437-12
40. Kreher CR, Dittrich MT, Guerkov R, Boehm BO, Tary-Lehmann M. CD4+ and CD8+ cells in cryopreserved human PBMC maintain full functionality in cytokine ELISPOT assays. J Immunol Methods (2003). doi: 10.1016/S0022-1759(03)00226-6
41. Lemieux J, Jobin C, Simard C, Néron S. A global look into human T cell subsets before and after cryopreservation using multiparametric flow cytometry and two-dimensional visualization analysis. J Immunol Methods (2016). doi: 10.1016/j.jim.2016.04.010
42. Koofhethile CK, Ndhlovu ZM, Thobakgale-Tshabalala C, Prado JG, Ismail N, Mncube Z, et al. CD8 + T Cell Breadth and Ex Vivo Virus Inhibition Capacity Distinguish between Viremic Controllers with and without Protective HLA Class I Alleles. J Virol (2016). doi: 10.1128/JVI.00276-16
43. Li F, Malhotra U, Gilbert PB, Hawkins NR, Duerr AC, McElrath JM, et al. Peptide selection for human immunodeficiency virus type 1 CTL-based vaccine evaluation. Vaccine (2006). doi: 10.1016/j.vaccine.2006.06.009
44. Barouch DH, O’Brien KL, Simmons NL, King SL, Abbink P, Maxfield LF, et al. Mosaic HIV-1 vaccines expand the breadth and depth of cellular immune responses in rhesus monkeys. Nat Med (2010) 16(3):319–23. doi: 10.1038/nm.2089
45. Turk G, Gherardi MM, Laufer N, Saracco M, Luzzi R, Cox JH, et al. Magnitude, Breadth, and Functional Profile of T-Cell Responses during Human Immunodeficiency Virus Primary Infection with B and BF Viral Variants. J Virol (2008). doi: 10.1128/JVI.02260-07
46. Kiepiela P, Ngumbela K, Thobakgale C, Ramduth D, Honeyborne I, Moodley E, et al. CD8 + T-cell responses to different HIV proteins have discordant associations with viral load. Nat Med (2007). doi: 10.1038/nm1520
47. Liu J, O’Brien KL, Lynch DM, Simmons NL, La Porte A, Riggs AM, et al. Immune control of an SIV challenge by a T-cell-based vaccine in rhesus monkeys. Nature (2009) 457(7225):87–91. doi: 10.1038/nature07469
48. Sacha JB, Chung C, Rakasz EG, Spencer SP, Jonas AK, Bean AT, et al. Gag-Specific CD8 + T Lymphocytes Recognize Infected Cells before AIDS-Virus Integration and Viral Protein Expression. J Immunol (2007). doi: 10.4049/jimmunol.178.5.2746
49. Kloverpris HN, Payne RP, Sacha JB, Rasaiyaah JT, Chen F, Takiguchi M, et al. Early Antigen Presentation of Protective HIV-1 KF11Gag and KK10Gag Epitopes from Incoming Viral Particles Facilitates Rapid Recognition of Infected Cells by Specific CD8+ T Cells. J Virol (2013). doi: 10.1128/JVI.02131-12
50. Shan L, Deng K, Shroff NS, Durand CM, Rabi SA, Yang HC, et al. Stimulation of HIV-1-Specific Cytolytic T Lymphocytes Facilitates Elimination of Latent Viral Reservoir after Virus Reactivation. Immunity (2012) 36(3):491–501. doi: 10.1016/j.immuni.2012.01.014
51. Turk G, Ghiglione Y, Falivene J, Socias ME, Laufer N, Coloccini RS, et al. Early Gag Immunodominance of the HIV-Specific T-Cell Response during Acute/Early Infection Is Associated with Higher CD8+ T-Cell Antiviral Activity and Correlates with Preservation of the CD4+ T-Cell Compartment. J Virol [Internet] (2013) 87(13):7445–62. doi: 10.1128/JVI.00865-13
52. Zuniga R, Lucchetti A, Galvan P, Sanchez S, Sanchez C, Hernandez A, et al. Relative Dominance of Gag p24-Specific Cytotoxic T Lymphocytes Is Associated with Human Immunodeficiency Virus Control. J Virol (2006) 80(6):3122–5. doi: 10.1128/JVI.80.6.3122-3125.2006
53. Chen H, Piechocka-Trocha A, Miura T, Brockman MA, Julg BD, Baker BM, et al. Differential Neutralization of Human Immunodeficiency Virus (HIV) Replication in Autologous CD4 T Cells by HIV-Specific Cytotoxic T Lymphocytes. J Virol (2009). doi: 10.1128/JVI.02073-08
54. Freel SA, Lamoreaux L, Chattopadhyay PK, Saunders K, Zarkowsky D, Overman RG, et al. Phenotypic and Functional Profile of HIV-Inhibitory CD8 T Cells Elicited by Natural Infection and Heterologous Prime/Boost Vaccination. J Virol (2010). doi: 10.1128/JVI.00138-10
55. Minton K. Hiv: Mechanisms of t cell polyfunctionality. Nat Rev Immunol (2013) 14:7. doi: 10.1038/nri3596
56. Almeida JR, Price DA, Papagno L, Arkoub ZA, Sauce D, Bornstein E, et al. Superior control of HIV-1 replication by CD8+ T cells is reflected by their avidity, polyfunctionality, and clonal turnover. J Exp Med (2007) 204:2473–85. doi: 10.1084/jem.20070784
57. Perdomo-Celis F, Taborda NA, Rugeles MT. Circulating CXCR5-Expressing CD8+ T-Cells Are Major Producers of IL-21 and Associate With Limited HIV Replication. JAIDS J Acquir Immune Defic Syndr (2018) 78(4):473–82. doi: 10.1097/QAI.0000000000001700
58. Perreau M, Savoye AL, De Crignis E, Corpataux J-M, Cubas R, Haddad EK, et al. Follicular helper T cells serve as the major CD4 T cell compartment for HIV-1 infection, replication, and production. J Exp Med (2013). doi: 10.1084/jem.20121932
59. Banga R, Procopio FA, Noto A, Pollakis G, Cavassini M, Ohmiti K, et al. PD-1 + and follicular helper T cells are responsible for persistent HIV-1 transcription in treated aviremic individuals. Nat Med (2016) 22(7):754–61. doi: 10.1038/nm.4113
60. Reuter MA, Del Rio Estrada PM, Buggert M, Petrovas C, Ferrando-Martinez S, Nguyen S, et al. HIV-Specific CD8+T Cells Exhibit Reduced and Differentially Regulated Cytolytic Activity in Lymphoid Tissue. Cell Rep (2017) 21(12):3458–70. doi: 10.1016/j.celrep.2017.11.075
61. Petrovas C, Ferrando-Martinez S, Gerner MY, Casazza JP, Pegu A, Deleage C, et al. Follicular CD8 T cells accumulate in HIV infection and can kill infected cells in vitro via bispecific antibodies. Sci Transl Med (2017) 9(373). doi: 10.1126/scitranslmed.aag2285
62. Warren JA, Zhou S, Xu Y, Moeser MJ, Macmillan DR, Council O, et al. The HIV-1 latent reservoir is largely sensitive to circulating T cells. Elife (2020) 9:1–28. doi: 10.7554/eLife.57246
Keywords: HIV controllers, functional cure, viral suppressive capacity, multifunctional CD8+ T cells, CXCR5 CD8 T cells + +, elite controllers
Citation: Adams P, Iserentant G, Servais J-Y, Vandekerckhove L, Vanham G, Seguin-Devaux C and the PhenoCure Study Group (2021) Cytotoxic CD8+ T Cells Expressing CXCR5 Are Detectable in HIV-1 Elite Controllers After Prolonged In Vitro Peptide Stimulation. Front. Immunol. 11:622343. doi: 10.3389/fimmu.2020.622343
Received: 28 October 2020; Accepted: 21 December 2020;
Published: 24 February 2021.
Edited by:
Persephone Borrow, University of Oxford, United KingdomReviewed by:
Paul Goepfert, University of Alabama at Birmingham, United StatesLilin Ye, Third Military Medical University, China
Copyright © 2021 Adams, Iserentant, Servais, Vandekerckhove, Vanham, Seguin-Devaux and the PhenoCure Study Group. This is an open-access article distributed under the terms of the Creative Commons Attribution License (CC BY). The use, distribution or reproduction in other forums is permitted, provided the original author(s) and the copyright owner(s) are credited and that the original publication in this journal is cited, in accordance with accepted academic practice. No use, distribution or reproduction is permitted which does not comply with these terms.
*Correspondence: Philipp Adams, UGhpbGlwcC5BZGFtc0BsaWgubHU=