 Li-Jun Song1,2,3
 Xu-Ren Yin2
 Sha-Sha Mu2
 Jia-Huang Li1,4,5
 Hong Gao6
 Ying Zhang2
 Pan-Pan Dong2
 Cong-Jin Mei2
 Zi-Chun Hua1,4,5*
- 1School of Life Sciences and the State Key Laboratory of Pharmaceutical Biotechnology, Nanjing University, Nanjing, China
- 2National Health Commission Key Laboratory of Parasitic Disease Control and Prevention, Jiangsu Provincial Key Laboratory on Parasite and Vector Control Technology, Jiangsu Institute of Parasitic Diseases, Wuxi, China
- 3Public Health Research Center, Jiangnan University, Wuxi, China
- 4School of Biopharmacy, China Pharmaceutical University, Nanjing, China
- 5Jiangsu TargetPharma Laboratories Inc., Changzhou High-Tech Research Institute of Nanjing University, Changzhou, China
- 6Department of Pathology, Nanjing Drum Tower Hospital, The Affiliated Hospital of Nanjing University Medical School, Nanjing, China
Liver fibrosis can result from various causes and could progress to cirrhosis and cancer; however, there are no effective treatments due to that its molecular mechanism is unclear. liver fibrosis model made by Schistosoma japonicum (S. japonicum) infection or Carbon tetrachloride (CCl4) intraperitoneal injection is a conventional model used in liver fibrosis-related studies for mechanism or pharmaceutical research purposes. But the differences in the pathological progression, immune responses and the underlying mechanism between the two liver fibrosis model have not been carefully compared and characterized, which hinders us from correctly understanding and making better use of the two models. In the present study, the pathological changes to the liver, and the cytokines, inflammatory factors, macrophages, and lymphocytes subsets involved were analyzed in the liver fibrosis model of S. japonicum infection or CCl4 intraperitoneal injection. Additionally, the pathological progression, immune responses and the underlying injury mechanism in these two models were compared and characterized. The results showed that the changing trend of interleukin-13 (IL-13), transforming growth factor beta (TGF-β), inflammatory factors, and M1, M2 macrophages, were consistent with the development trend of fibrosis regardless of whether liver fibrosis was caused by S. japonicum or CCl4. For lymphocyte subsets, the proportions of CD3+ T cells and CD4+ T cells decreased gradually, while proportion of CD8+ T cells peaked at 6 weeks in mice infected with S. japonicum and at 12 weeks in mice injected with CCl4. With prolonged S. japonicum infection time, Th1 (CD4+IFN-γ+) immunity converted to Th2 (CD4+IL-4+)/Th17 (CD4+IL-17+) with weaker regulatory T cell (Treg) (CD4+CD25+FOXP3+) immunity. However, in liver fibrosis caused by CCl4, Th1 cells occupied the dominant position, while proportions of Th2, Th17, and Treg cells decreased gradually. In conclusion, liver fibrosis was a complex pathological process that was regulated by a series of cytokines and immune cells. The pathological progressions and immune responses to S. japonicum or CCl4 induced liver fibrosis were different, possibly because of their different injury mechanisms. The appropriate animal model should be selected according to the needs of different experiments and the pathogenic factors of liver fibrosis in the study.
Introduction
Liver fibrosis caused by, for example, metabolic diseases, virus infection, and drug toxicity, result in liver injury and inflammation. These factors stimulate the quiescent hepatic stellate cells (HSCs), which are activated and differentiate into myofibroblasts, secreting a large amount of extracellular matrix (ECM) components, such as collagen, glycoprotein, and proteoglycan. Meanwhile, myofibroblast tissue metalloproteinase inhibitors (TIMPs) secreted by cells inhibit the activity of matrix metalloproteinases (MMPs) in degrading the ECM, resulting in abnormal deposition of fibrous connective tissue in the liver and the formation of liver fibrosis (1, 2). The exact molecular mechanism of liver fibrosis is still unclear (3). Additionally, liver fibrosis could progress to cirrhosis and cancer, which are detrimental to health and may cause death (3). Previous experimental models have been confirmed that liver fibrosis could be reversed by increasing collagenolytic activity (4) or by removing activated HSCs via apoptosis (5). However, there are no effective drug treatments in the clinic. Therefore, it is very important to study the pathological characteristics and possible regulatory mechanisms of liver fibrosis to search for novel treatments.
In vivo models are indispensable tools to study molecular mechanisms. Currently, there are five categories of in vivo models for liver fibrosis: Chemical, dietary, surgical, genetically modified, and infection (6). Ethanol and carbon tetrachloride (CCl4) (7) in the chemical category, a high-fat diet (8) in the dietary category, and HBV infection (9) have been used widely to induce liver fibrosis in animal experiments. Infection with schistosoma parasites (10) is also a popular model of liver fibrosis.
liver fibrosis model made by S. japonicum infection or CCl4 intraperitoneal injection is a conventional models used in liver fibrosis-related studies for mechanism or pharmaceutical research purposes, for example, in the recent five years since June, 2015, there are over 95 papers using liver fibrosis model by S. japonicum infection and about 775 papers using liver fibrosis model by CCl4 injection. In several studies, both S. japonicum infection and CCl4 intraperitoneal injection models were used. Similar results were obtained in the two models (11–13). The difference between the two models was also reported, such as the expression of protein Septin4 (14). But the similarities and differences between the two liver fibrosis models have not been carefully compared and characterized. The comparisons between the two liver fibrosis models are helpful to understand the possible molecular mechanism and make better use of the two models.
Dynamic progressions of pathological changes, the cytokines and lymphocytes subsets in mice infected by S. japonicum have been reported in several reports with various results (15–18), while those in CCl4 induced liver fibrosis were rarely reported or detected at different time point (19, 20). It was difficulty to make comparisons between the two models from the previous literatures. In the present study, the dynamic progressions of pathological changes, the cytokines, inflammatory factors, macrophages, lymphocytes subsets and underlying injury mechanism involved were compared and characterized between the liver fibrosis model of S. japonicum infection and CCl4 intraperitoneal injection at the same time point using the same evaluation indexes and methods.
Materials and Methods
Ethics and Biosecurity Statement
All animals were placed in the facility, provided food and water according to the Convention. The intraperitoneal injection, infection and euthanasia (carbon dioxide asphyxia) were carried out according to the Guidelines for feeding and using experimental animals of the Ministry of science and technology of the people’s Republic of China ((2006) No. 398). According to the guidelines, suffering was minimized.
All experimental operations were performed in accordance with the Laboratories - General requirements for biosafety of the people’s Republic of China (GB19489-2008).
Animals and Parasites
S. japonicum cercariae (strain isolated in Jiangsu, China), hatched from infected Oncomelania hupensis, were provided by the Department of Snail Biology, Jiangsu Institute of Parasitic Diseases. Mice (C57BL/6), weighing 22–24 g, were purchased from the Shanghai Sub-Center of Experimental Animals, Chinese Academy of Sciences, and raised in the Department of Experimental Animals, Jiangsu Institute of Parasitic Diseases.
Establishment of the Hepatic Fibrosis Model Using S. japonicum
The infected Oncomelania hupensis were placed in dechlorinated water and the cercariae spontaneously escaped from them under 25°C incubation. Normal female C57BL/6J mice, aged 6–8 weeks, 10 mice in each group of 6, 8, and 12 weeks, were challenged with the cercariae (12 ± 1) for 20 min (21). Blood was collected from the mouse’s eyeballs. Then the mice were euthanized at 6, 8, and 12 weeks after infection, and uninfected mice were used as a control group. The worms were perfused from portal veins and the number of worms was counted. The mouse livers were digested overnight with 5% potassium hydroxyl solution at 37°C and the number of eggs in the liver tissue was counted under an inverted phase contrast microscope. The number of eggs per gram of liver = the total number of eggs in the liver tissue/the liver weight. The mice were weighed weekly (Figure 1A).
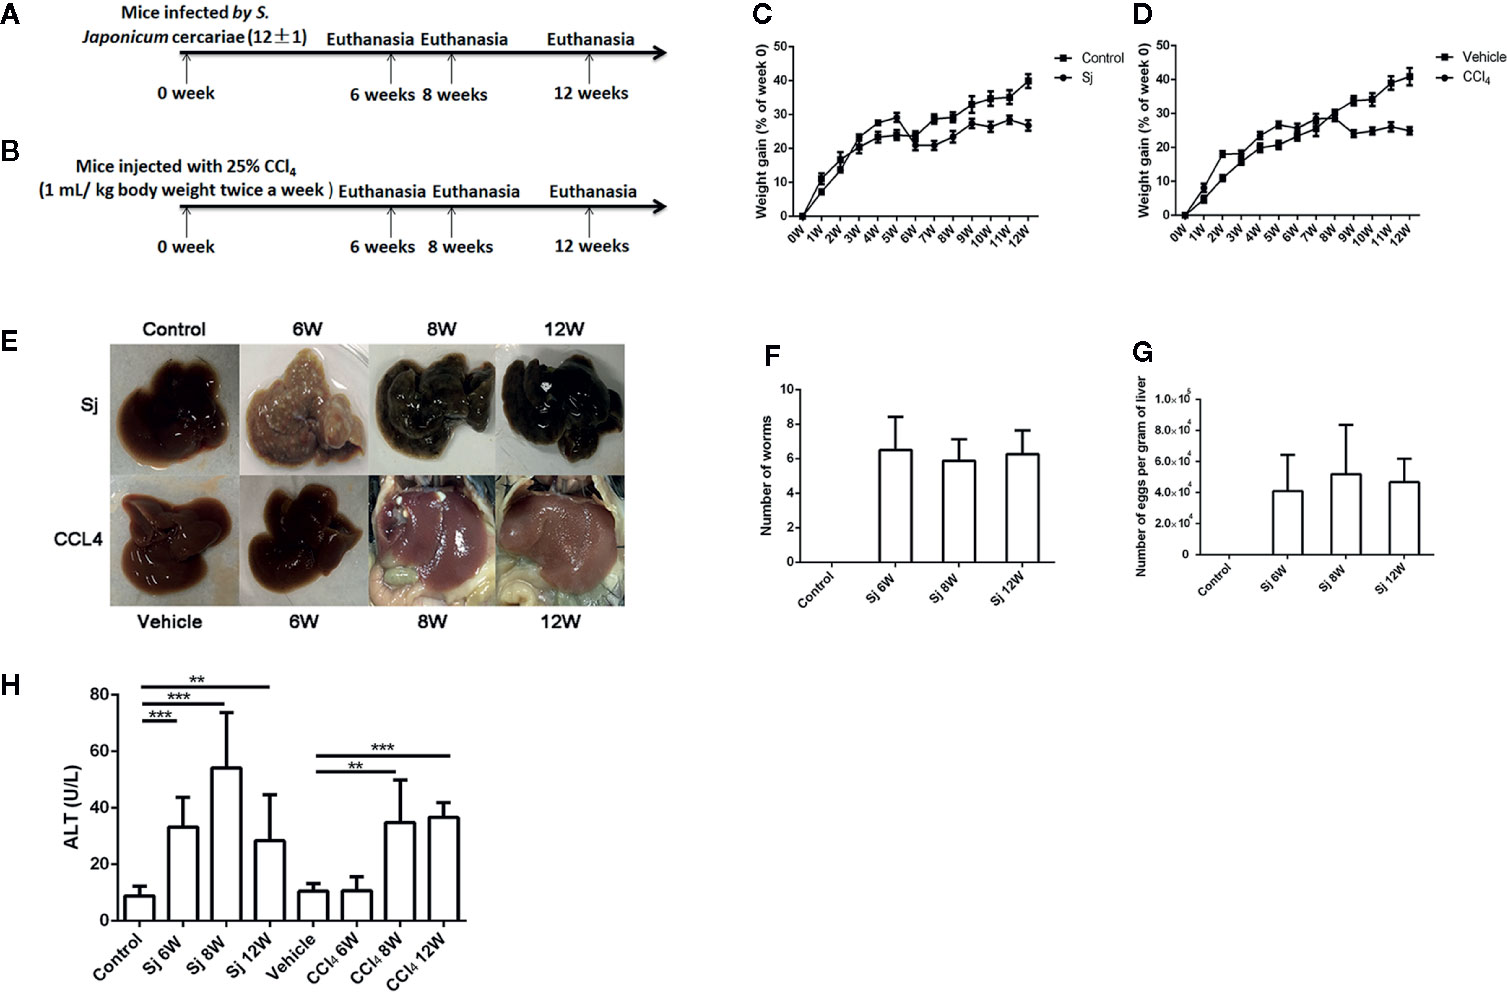
Figure 1 The schematic diagram, weight gain and serum ALT of mice infected with S. japonicum or injected with CCl4 intraperitoneally. (A) The schematic diagram of mice infected with S. japonicum. (B) The schematic diagram of mice injected with CCl4 intraperitoneally. (C) The weight gain of mice infected with S. japonicum (% of week 0). (D) Bodyweight gain of mice injected with CCl4 intraperitoneally (% of week 0). (E) Image of the morphology of liver in mice infected with S. japonicum and injected with CCl4 intraperitoneally. (F) The number of adult worm in mice infected with S. japonicum challenged with the cercariae (12 ± 1). (G) The number of eggs per gram of liver in mice infected with S. japonicum challenged with the cercariae (12 ± 1). (H) The serum ALT levels in mice infected with S. japonicum or injected with CCl4 intraperitoneally. ALT, alanine aminotransferase; SJ, S. japonicum. Vehicle, olive oil. Data represent the mean ± SE from three independent experiments. **P < 0.01, ***P < 0.001.
Establishment of the Hepatic Fibrosis Model Using CCl4
Normal female C57BL/6J mice, 6–8 weeks old, 6 mice in each group of 6, 8, and 12 weeks, were used. CCl4 (Shanghai Oulu Bio-Technology Co., Ltd (Shanghai, China)) was diluted with olive oil to obtain a 25% solution. Mice were injected intraperitoneally with 1 mL of 25% CCl4 per kg body weight twice a week for 6, 8, and 12 weeks, consecutively(22). Blood was collected from the mouse’s eyeballs at 6, 8, and 12 weeks. Then the mice were euthanized and the livers were taken for assay. Mice receiving the control solvent olive oil were used as the vehicle group. The mice were weighed weekly (Figure 1B).
Serum Collection From Mice and the Detection of Alanine Aminotransferase (ALT)
Blood was collected from the mouse’s eyeballs, stored overnight at 4°C, and then centrifuged at 1,000 g for 5 min. The upper layer (serum) was removed and stored at −80°C. The ALT level in the serum was detected using Alanine aminotransferase Assay Kit from the Nanjing Jiancheng Biotechnology Co., Ltd (Nanjing, China).
The Colorimetric Hydroxyproline Assay in the Liver Tissue of Mice
The hydroxyproline levels in the mouse liver (30–100 mg) were detected using Hydroxyproline Assay Kit from Nanjing Jiancheng Biotechnology Co., Ltd.
Masson Staining of Mouse Liver Tissue
The right anterior lobe of the mouse liver was excised and immersed in 4% polyformaldehyde for fixation. The tissue was dehydrated in 70%, 80%, 95%, and 100% ethanol in turn. The dehydrated liver tissue was transparent in ethanol/xylene. After tissue immersion and embedding, wax blocks were continuously sectioned using a microtome at a thickness of 4 μm, and then attached to a slide. A Masson staining kit from Nanjing Jiancheng Biotechnology Co., Ltd. was used to stain the sections. Each section was randomly acquired from 6–8 visual fields under a microscope. Images were taken and Masson staining positive areas were analyzed using Image-Pro software (Media Cybernetics, Rockville, MD, USA).
Fluorescence Quantitative PCR Reactions
Total RNA was extracted from the mouse liver using Trizol. Total RNA (500 ng) was subjected to reverse transcription to produce cDNA using Transcriptor First Strand cDNA Synthesis kit (Roche, Basel, Switzerland), which was used as the template for fluorescence quantitative real-time PCR (qPCR) reactions to detect of cytokine mRNA levels using SYBR Green I Master (Roche, Basel, Switzerland) and LightCycler 480 instrument (Roche, Basel, Switzerland). The reaction procedure was as following: 95°C for 30 s; 40 cycles of 95°C for 5 s, 56°C for 10 s, 72°C for 15 s; 95°C for 15s, 60°C for 10s. 18S was used as an internal control, and the fold changes were quantified by the 2-△△Ct method. The sequences of the primers are shown in Supplementary Table 1 and all primer sequences were blasted in NCBI for ensuring their specificities.
Flow Cytometry
Hepatic nonparenchymal cells were prepared as described previously with some modifications (23). The livers of 6–10 mouse were cut into small pieces and digested by 0.5 mg/ml collagenase and 4 U/ml DNase I in PBS at 37 °C for 30 min. The digested was filtered using 200-mesh and 400-mesh sieves, centrifuged for 5 min at 300 × g and terminated by adding phosphate-buffered saline (PBS). Hepatic parenchymal cells were removed after centrifugation at 30 × g for 5 min. The supernatant cells were centrifuged for 5 min at 300 × g in a new tube. The cells were then suspended in the D-Hanks solution. The suspension was slowly added into a centrifuge tube containing OptiPrep (40% v/v) to a final concentration of 20% (v/v) and overlaid with D-Hanks solution, centrifuged at 1500 × g 20 min. After centrifugation, the interface of cells was extracted, which comprised lymphocytes, macrophages, monocytes, HSCs cells and other cells, called nonparenchymal cells. The nonparenchymal cells (2 × 10⁶) were added with the following labeled antibodies: F4/80-phycoerythrin (PE) (Becton, Dickinson and Company, New Jersey, USA) CD16/32-FITC (Becton, Dickinson and Company, New Jersey, USA), CD206-allophycocyanin (APC) (Becton, Dickinson and Company, New Jersey, USA) (for M1, M2 macrophages); CD3-PE(Becton, Dickinson and Company, New Jersey, USA), CD4-FITC (Becton, Dickinson and Company, New Jersey, USA), CD8-APC (Becton, Dickinson and Company, New Jersey, USA) (for T cells). The proportions of macrophages and T cells in the samples were detected using flow cytometry. The nonparenchymal cells (2 x 10⁶) were cultured in 24-well plates. A cell stimulation cocktail was added into each well and the plates were placed at 37°C for 5 h in 5% CO2 incubator. The supernatant was discarded. Then, fixation/permeabilization solution was added and incubated for 20 min at 4°C. The cells were washed twice with 1 x perm/wash, and CD4-FITC, CD25-APC, forkhead box P3 (FOXP3)-PE, IL-4-PE, interferon gamma (IFN-γ)-APC, IL-17A-PE antibodies were added. The cells in the samples were then detected using flow cytometry.
Statistical Analysis
The percentage of weight gain, the ALT levels in blood, the hydroxyproline levels in liver tissue, the mRNA levels of inflammatory factors, and the proportion of cells in liver tissue detected by flow cytometry between the two groups were tested using a t-test. SPSS 13.0 (IBM Corp., Armonk. NY, USA) was used for the statistical analyses. Differences between mean values were considered significant at P < 0.05.
Results
The Weight and Serum ALT in Mice Infected with S. japonicum or Injected Intraperitoneally With CCl4
The mortality of mice infected with S. japonicum was 30.0% at 9W post infection and 28.6% at 10W post infection. By contrast, the mortality of mice injected with CCl4 within 12 weeks was 0.0%. The weight gain (% of week 0) of mice infected with S. japonicum was significantly reduced (P=0.000) at 7 weeks compared with that of the control group (Figure 1C). The weight gain (% of week 0) of the mice in the CCl4 liver fibrosis model increased slowly with time but decreased at 9 weeks (Figure 1D). The liver surface of mice infected with S. japonicum had obvious egg nodules, and diffuse granular nodules on the liver surface of mice injected with CCl4 were seen (Figure 1E). The number of adult worms in mice infected by S. japonicum at 6, 8, 12 weeks was 6.5 ± 1.9, 5.9 ± 1.2, 6.3 ± 1.4, respectively (Figure 1F). The number of eggs per gram of liver in mice infected by S. japonicum at 6, 8, 12 weeks was 41068.1 ± 23,344.0, 51,838.46 ± 31,883.6, 46759.15 ± 15,105.8, respectively (Figure 1G). The level of ALT in the sera of mice infected with S. japonicum was 33.2 ± 10.6 U/L at 6 weeks, 54.2 ± 19.5 U/L at 8 weeks, and 28.4 ± 16.3 U/L at 12 weeks, which were all significantly higher than the 8.9 ± 3.4 U/L in the control group (P=0.000, 0.000, 0.002). At 6, 8, and 12 weeks, the levels of ALT in sera of mice intraperitoneally injected with CCl4 were 10.6 ± 4.9 U/L, 34.8 ± 15.0 U/L, and 36.7 ± 5.2 U/L, respectively. Compared with that in the control group, the levels at 8 and 12 weeks had statistical significance (P=0.003, 0.000) (Figure 1H). The level of ALT in mice infected with S. japonicum at 6 weeks was higher than that of mice injected with CCl4. The difference had statistical significance (P=0.000).
The Intensity of Liver Fibrosis in Mice Infected With S. japonicum or Injected With CCl4 Intraperitoneally
Mice infected with S. japonicum developed fibrosis in relation to the granulomas formed around the parasite’s eggs. At the end of the experiment (12 weeks), there was fibrosis around the granulomas and sometimes granulomas fused by the fibrosis (Figure 2A). At 6, 8, and 12 weeks, the fibrotic area of a single egg caused by S. japonicum was 6,517.3 ± 2,624.5 μm2, 8,941.4 ± 3,414.3 μm2, and 7,935.4 ± 2,001.8 μm2, respectively. The differences were statistically significant compared with that of the control group (P=0.000, 0.000, 0.000) (Figure 2B). The levels of hydroxyproline in the liver were 220.5 ± 42.2 mg/g, 403.4 ± 114.6 mg/g, and 313.7 ± 91.1 mg/g at 6, 8, and 12 weeks, respectively. The differences were statistically significant compared with that of the control group (108.7 ± 7.0 mg/g) (P=0.000, 0.000, 0.000) (Figure 2C). The fibrotic area of a single egg and the level of hydroxyproline in the liver caused by S. japonicum peaked at 8 weeks, as did the levels of mRNA encoding collagen I and III, and α-smooth muscle actin (α-SMA) in the liver (Figures 2D–F). The level of mRNA encoding MMP9 peaked at 8 weeks, but decreased at 12 weeks, while the mRNA levels of TIMP1 increased with time (Figures 2G, H). The mRNA expression levels of interleukin 13 (IL-13) and TGF-β (related to fibrosis) were the highest at 8 weeks and decreased at 12 weeks (Figures 2I, J).
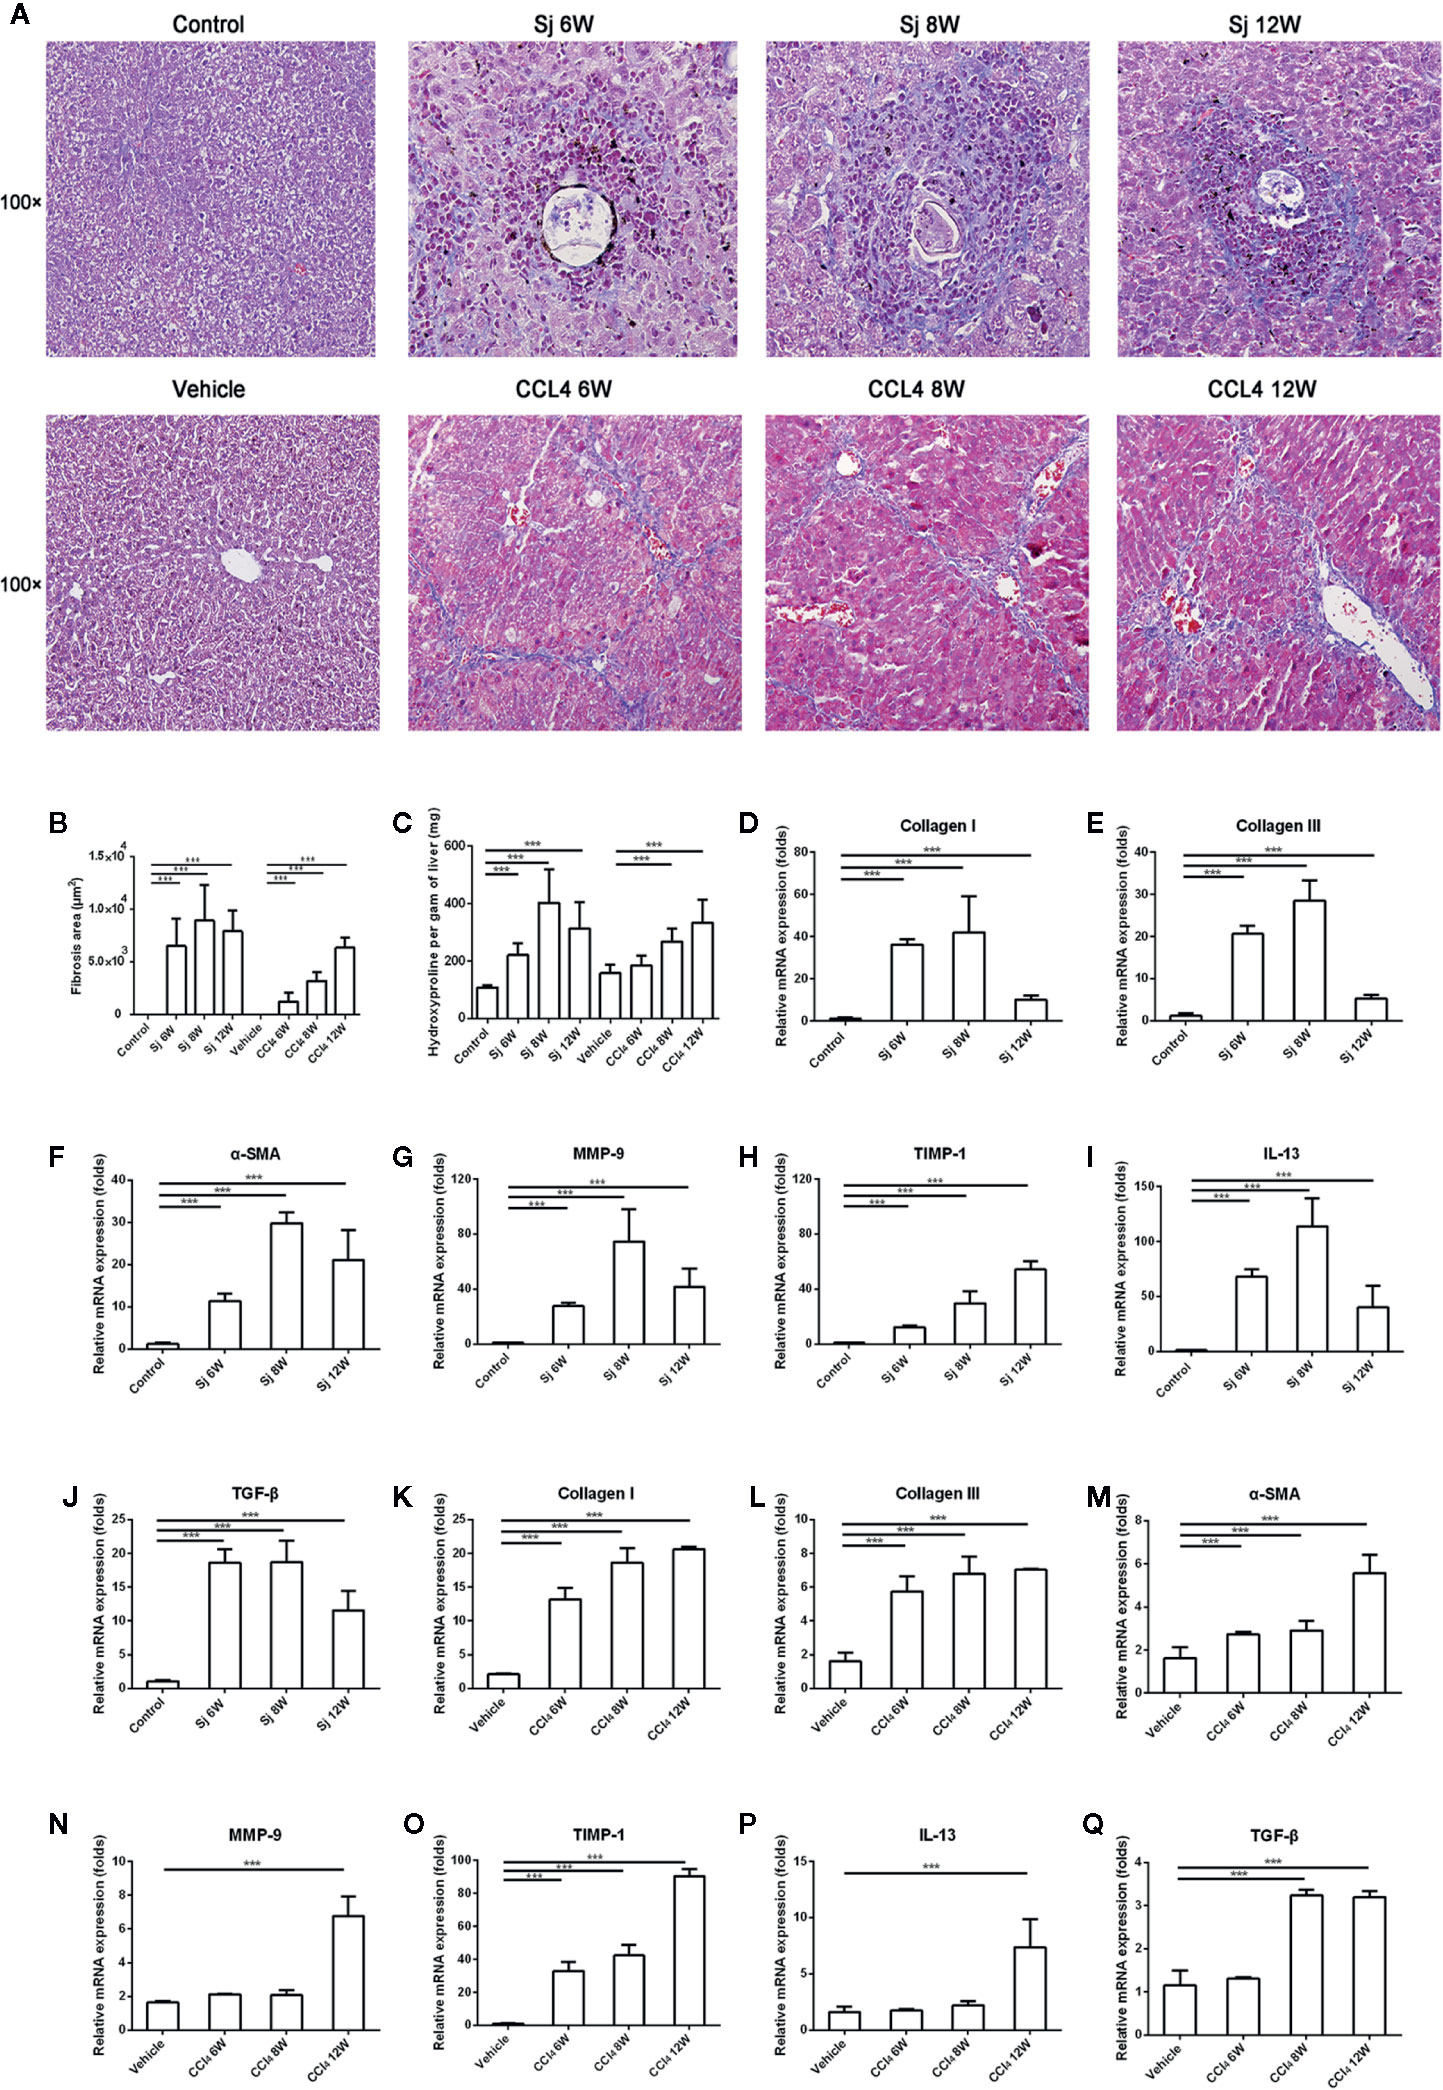
Figure 2 The intensity of liver fibrosis and cytokine levels in the liver of mice infected with S. japonicum or injected with CCl4 intraperitoneally. (A) Masson staining of the liver in mice. Original magnification 100×. (B)The fibrosis areas of the liver of mice infected with S. japonicum or injected with CCl4 intraperitoneally. (C) The hydroxyproline level in the mice liver. (D–J) The relative mRNA expression levels of collagen I, collagen III, α-SMA, MMP-9, TIMP-1, IL-13, and TGF-β in the liver of mice infected with S. japonicum. (K–Q) The relative mRNA expression levels of collagen I, collagen III, α-SMA, MMP-9, TIMP-1, IL-13, and TGF-β in the liver of mice injected with CCl4 intraperitoneally. SJ, S. japonicum Vehicle, olive oil. Data represent the mean ± SE from three independent experiments. ***P < 0.001.
In CCl4-treated mice, fibrosis developed from areas of necrosis mainly located in zone three of hepatic acini. At the end of the experiment, there was septal fibrosis with the formation of septa connecting the central veins to the portal spaces and connecting the portal spaces to each other. Pseudo lobules surrounded by collagen fibers were observed (Figure 2A). The areas of fibrosis caused by CCl4 were 1236.5 ± 842.6 μm2, 3203.5 ± 867.6 μm2, and 6352.5 ± 1008.2 μm2 at 6, 8, and 12 weeks, respectively, which were significantly different compared with that of the control group (P=0.000, 0.000, 0.000) (Figure 2B). The levels of hydroxyproline in liver were 184.9 ± 34.7 mg/g, 268.3 ± 44.4 mg/g, and 333.4 ± 80.0 mg/g at 6, 8, and 12 weeks, respectively (Figure 2C). The area of CCl4-induced fibrosis and the hydroxyproline in the liver reached the highest value at 12 weeks. The levels of mRNA encoding Collagen I and III, and α-SMA in the liver reached their highest values at 12 weeks (Figures 2K–M). MMP9 and TIMP1, the enzymes related to the degradation of fibrosis, showed their highest mRNA levels at 12 weeks (Figures 2N, O). The highest mRNA levels of IL-13 and TGF-β were found at 12 weeks (Figures 2P, Q).
The area of fibrosis in mice infected with S. japonicum at 6, 8, and 12 weeks was higher than that of mice injected with CCl4, respectively. The differences had statistical significances (P=0.000, 0.000, 0.000). The level of hydroxyproline in liver of mice infected with S. japonicum at 8 weeks was significantly higher than that of mice injected with CCl4 (P=0.008).
The mRNA Levels of Inflammatory Factors in the Liver of Mice Infected With S. japonicum or Injected With CCl4 Intraperitoneally
The levels of mRNA encoding inflammatory factors epidermal growth factor-like module-containing mucin-like hormone receptor-like 1 (ERM1, also known as F4/80), interleukin 6 (IL-6), interleukin 1beta (IL-1β), and tumor necrosis factor alpha (TNF-α) in liver fibrosis caused by S. japonicum at 6, 8, and 12 weeks were significantly higher than those of the control (F4/80 compared with the control group at 6, 8, and 12 weeks, P=0.003, 0.000, 0.004; TNF-α compared with the control group at 6, 8, and 12 weeks, P=0.001, 0.001, 0.000; IL-1β compared with the control group at 6, 8, and 12 weeks, P=0.000, 0.004, 0.000; IL-6 compared with the control group at 6, 8, and 12 weeks, P=0.024, 0.001, 0.002), reaching their highest level at 8 weeks, and decreasing at 12 weeks. In the liver fibrosis caused by CCl4, the levels of mRNA encoding inflammatory factors F4/80, IL-6, IL-1β, and TNF-α reached a high value at 12 weeks. At 6, 8, and 12 weeks, the mRNA levels of F4/80 and TNF-α were statistically significantly higher than those in the control group (F4/80 compared with the vehicle group at 6, 8, and 12 weeks, P=0.003, 0.000, 0.003; TNF-α compared with the vehicle group at 6, 8, and 12 weeks, P=0.000, 0.002, 0.000), while IL-1β and IL-6 mRNA levels at 8 and 12 weeks were statistically significantly higher compared with those in the control group (IL-1β compared with the vehicle group at 8 and 12 weeks, P=0.008, 0.002; IL-6 compared with the vehicle group at 8 and 12 weeks, P=0.001, 0.000) (Figure 3).
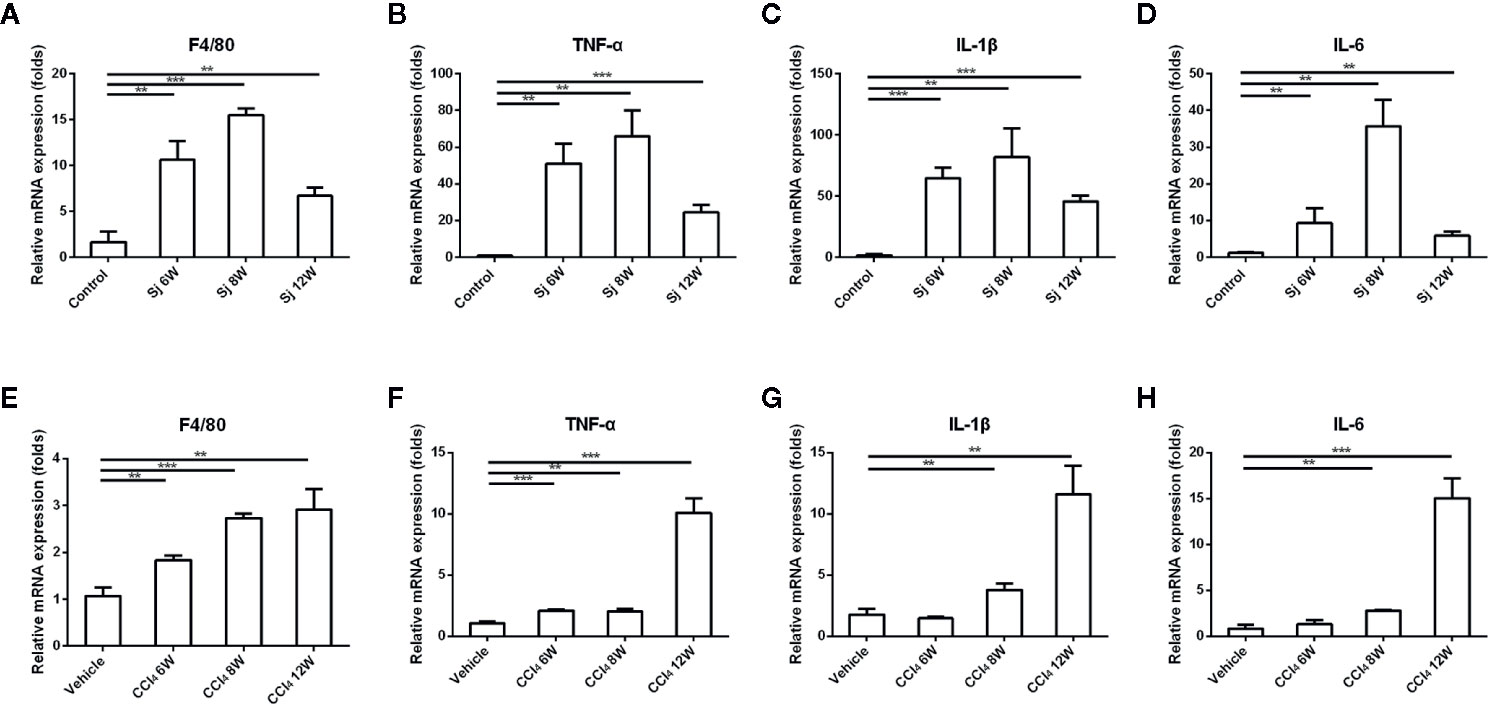
Figure 3 The mRNA levels of inflammatory factors in the liver of mice infected with S. japonicum or injected with CCl4 intraperitoneally. (A–D) The relative mRNA expression levels of F4/80, TNF-α, IL-1β and IL-6 in the liver of mice infected with S. japonicum. (E–H) The relative mRNA expression levels of F4/80, TNF-α, IL-1β, and IL-6 in the liver of mice injected with CCl4 intraperitoneally. SJ, S. japonicum. Vehicle, olive oil. Data represent the mean ± SE from three independent experiments. **P < 0.01, ***P < 0.001.
Flow Cytometry Analysis of Macrophages in the Liver of Mice Infected With S. japonicum or Injected Intraperitoneally With CCl4
The proportions of M1 macrophages in the liver of mice infected with S. japonicum were 27.13 ± 0.76%, 35.5 ± 2.90%, and 20.47 ± 1.50% at 6, 8, and 12 weeks, respectively, which were statistically significantly higher compared with that in the control group (7.60 ± 0.91%) (P=0.000, 0.000, 0.002) (Figures 4A, B). The proportions of M2 macrophages were 5.06 ± 0.89%, 6.61 ± 1.02%, and 3.23 ± 0.37% at 6, 8, and 12 weeks, respectively. The differences were statistically significant compared with that in the control group (1.91 ± 0.06%) (P=0.003, 0.001, 0.004) (Figures 4C, D).
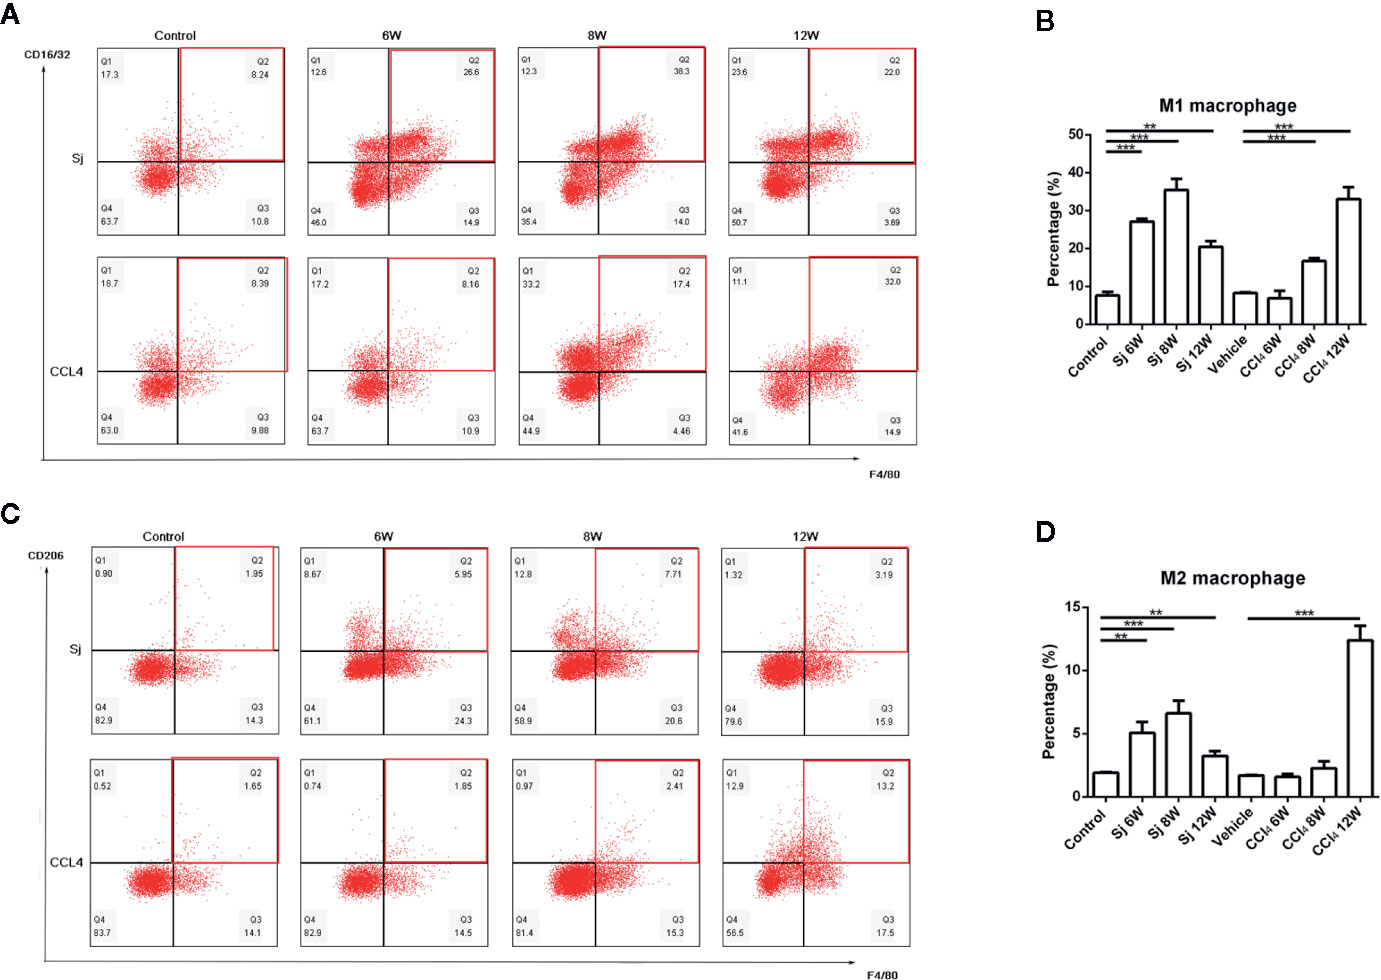
Figure 4 Flow cytometric analysis of macrophages in the liver of mice infected with S. japonicum or injected with CCl4 intraperitoneally. Scatter diagram of (A) M1 macrophages or (C) M2 macrophages in the mice liver. Statistical data analysis of (B) M1 macrophages or (D) M2 macrophages in the mice liver. SJ, S. japonicum. Vehicle, olive oil. Data represent the mean ± SE from three independent experiments. **P < 0.01, ***P < 0.001.
The proportions of M1 macrophages in the liver of mice injected with CCl4 at 6, 8, and 12 weeks were 6.90 ± 1.98%, 16.7 ± 0.75%, and 33.03 ± 3.17% respectively. The differences between the proportions at 8 and 12 weeks and that of the control group (8.27 ± 0.16%) were statistically significant (P=0.000, 0.001) (Figures 4A, B). The proportions of M2 macrophages were 1.58 ± 0.23%, 2.26 ± 0.54% and 12.40 ± 1.14% at 6, 8, and 12 weeks, respectively. The proportion of M2 macrophage at 12 week was statistically significant compared with that in the control group (P=0.000) (1.69 ± 0.06%) (Figures 4C, D).
Flow Cytometric Analysis of CD3/CD4/CD8+ Lymphocytes in the Liver of Mice Infected With S. japonicum or Injected Intraperitoneally With CCl4
For the S. japonicum model, the results showed that the percentages of CD3+ T cells in liver nonparenchymal cells were 35.80 ± 0.70%, 21.50 ± 2.00%, and 11.00 ± 0.26% at 6, 8, and 12 weeks, respectively, which were statistically significantly lower compared with that in the control group (42.85 ± 1.48%) (P=0.002, 0.001, 0.000) (Figures 5A, B). The proportions of CD4+ T cells in liver nonparenchymal cells were 15.30 ± 0.70%, 11.23 ± 0.68%, and 4.03 ± 0.61% at 6, 8, and 12 weeks, respectively, which were statistically significantly lower compared with that in the control group (19.55 ± 1.91%) (P=0.022, 0.002, 0.000) (Figures 5C, D). The proportions of CD8+ T cells in liver nonparenchymal cells were 11.45% ± 0.92%, 9.65 ± 0.70%, 5.43% ± 0.31% at 6, 8, and 12 weeks, respectively. The proportion of CD8+ T cells in the 12 weeks group was statistically significantly lower than that in the control group (11.47 ± 1.17%) (P=0.000) (Figures 5E, F).
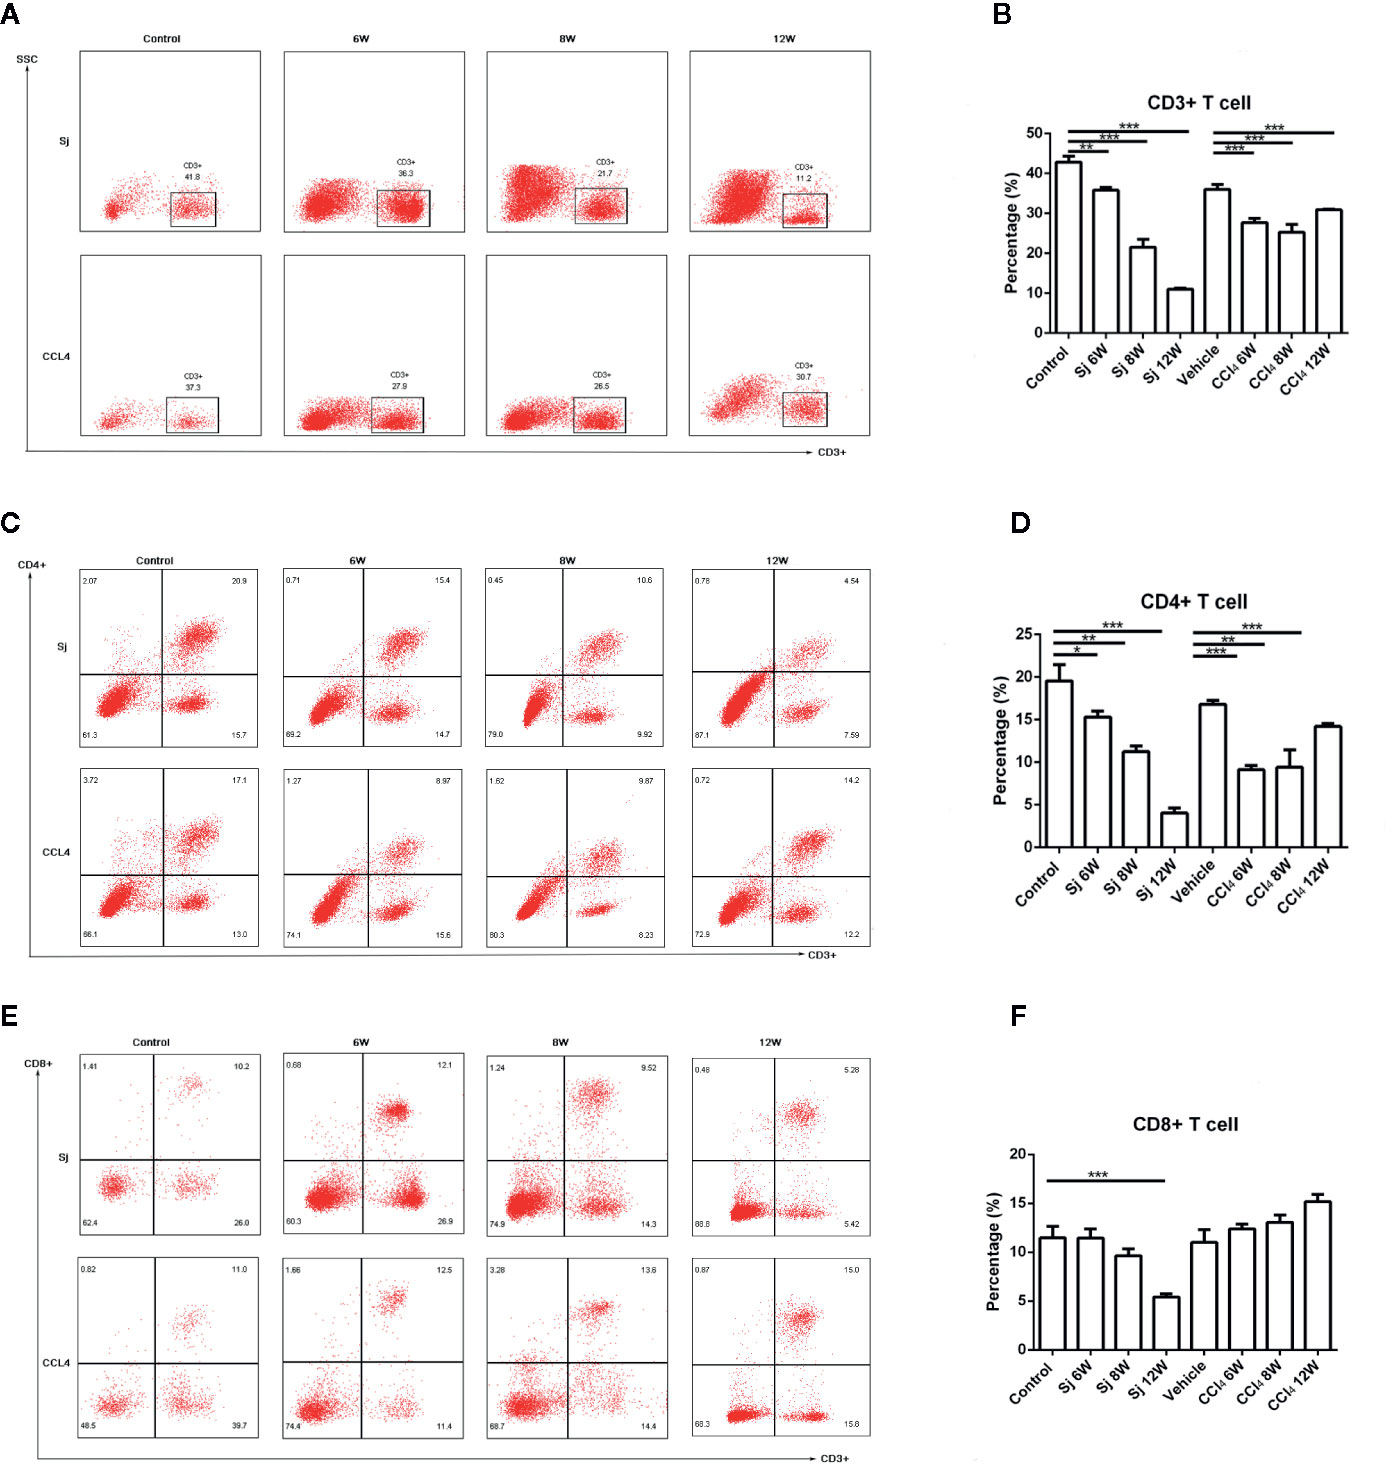
Figure 5 Flow cytometric analysis of CD3/CD4/CD8+ lymphocytes in the liver of mice infected with S. japonicum or intraperitoneally injected with CCl4. Scatter diagram of (A) CD3+ lymphocytes, (C) CD4+ lymphocytes or (E) CD8+ lymphocytes in the mice liver. Statistical data analysis of (B) CD3+ lymphocytes, (D) CD4+ lymphocytes or (F) CD8+ lymphocytes in the mice liver. SJ, S. japonicum. Vehicle, olive oil. Data represent the mean ± SE from three independent experiments. *P < 0.05, **P < 0.01, ***P < 0.001.
The percentages of CD3+ T cells in the liver nonparenchymal cells of CCl4 liver fibrosis model were 27.67 ± 1.07%, 25.27 ± 1.94%, and 30.90 ± 0.20% at 6, 8, and 12 weeks, and the differences between the values at 6, 8 and 12 weeks and that of the control group (36.03 ± 1.20%) were statistically significant (P=0.000, 0.000, 0.001) (Figures 5A, B). The percentages of CD4+ T cells in the liver parenchyma cells were 9.12 ± 0.52%, 9.41 ± 2.05%, and 14.20% ± 0.36% at 6, 8, and 12 weeks, respectively, and the differences in the percentages at 6, 8, or 12 weeks compared with that in the control group (16.80 ± 0.45%) were statistically significant (P=0.000, 0.004, 0.001) (Figures 5C, D). The proportions of CD8+ T cells in liver nonparenchymal cells at 6, 8, and 12 weeks, respectively, were 12.36 ± 0.51%, 13.05 ± 0.78%, 15.20 ± 0.72%, and the proportion at 6, 8, 12 weeks had no statistical significance with that in the control group (11.00 ± 1.32%) (Figures 5E, F).
Flow Cytometry for the Detection of Th1/Th2/Th17/Treg Cell in Mice Infected With S. japonicum or Injected Intraperitoneally With CCl4
In the S. japonicum model, flow cytometry showed that the proportions of Th1 (CD4+ IFN-γ+) cells in liver nonparenchymal cells were 25.30 ± 3.65%, 30.70 ± 5.47%, and 25.67 ± 3.33% at 6, 8, and 12 weeks, respectively, which were statistically significantly different compared with that in the control group (10.13 ± 0.58%) (P=0.002, 0.003, 0.001) (Figures 6A, B). The proportions of Th2 (CD4+IL-4+) cells in liver nonparenchymal cells were 9.27 ± 0.56%, 12.60 ± 3.39%, and 15.60 ± 0.40% at 6, 8, and 12 weeks, respectively, which were statistically significantly higher compared with that in the control group (2.87 ± 0.20%) (P=0.000, 0.007, 0.000) (Figures 6C, D). The proportions of Th17 (CD4+IL-17+) cells in liver nonparenchyma cells were 2.79 ± 0.47%, 3.78 ± 0.15%, and 4.41 ± 0.81% at 6, 8 and 12 weeks, respectively. The proportions of Th17 cells at 8 or 12 weeks were statistically significantly higher than that in the control group (1.57 ± 0.62%) (P=0.004, 0.008) (Figures 6E, F). The proportions of Treg (CD4+CD25+Foxp3+) cells in liver nonparenchyma cells were 4.34 ± 0.11, 4.88% ± 0.34%, and 1.74 ± 0.19% at 6, 8, and 12 weeks, respectively, which were statistically significantly higher compared with that in the control group (1.47 ± 0.14%) (P=0.000, 0.000) (Figures 6G, H).
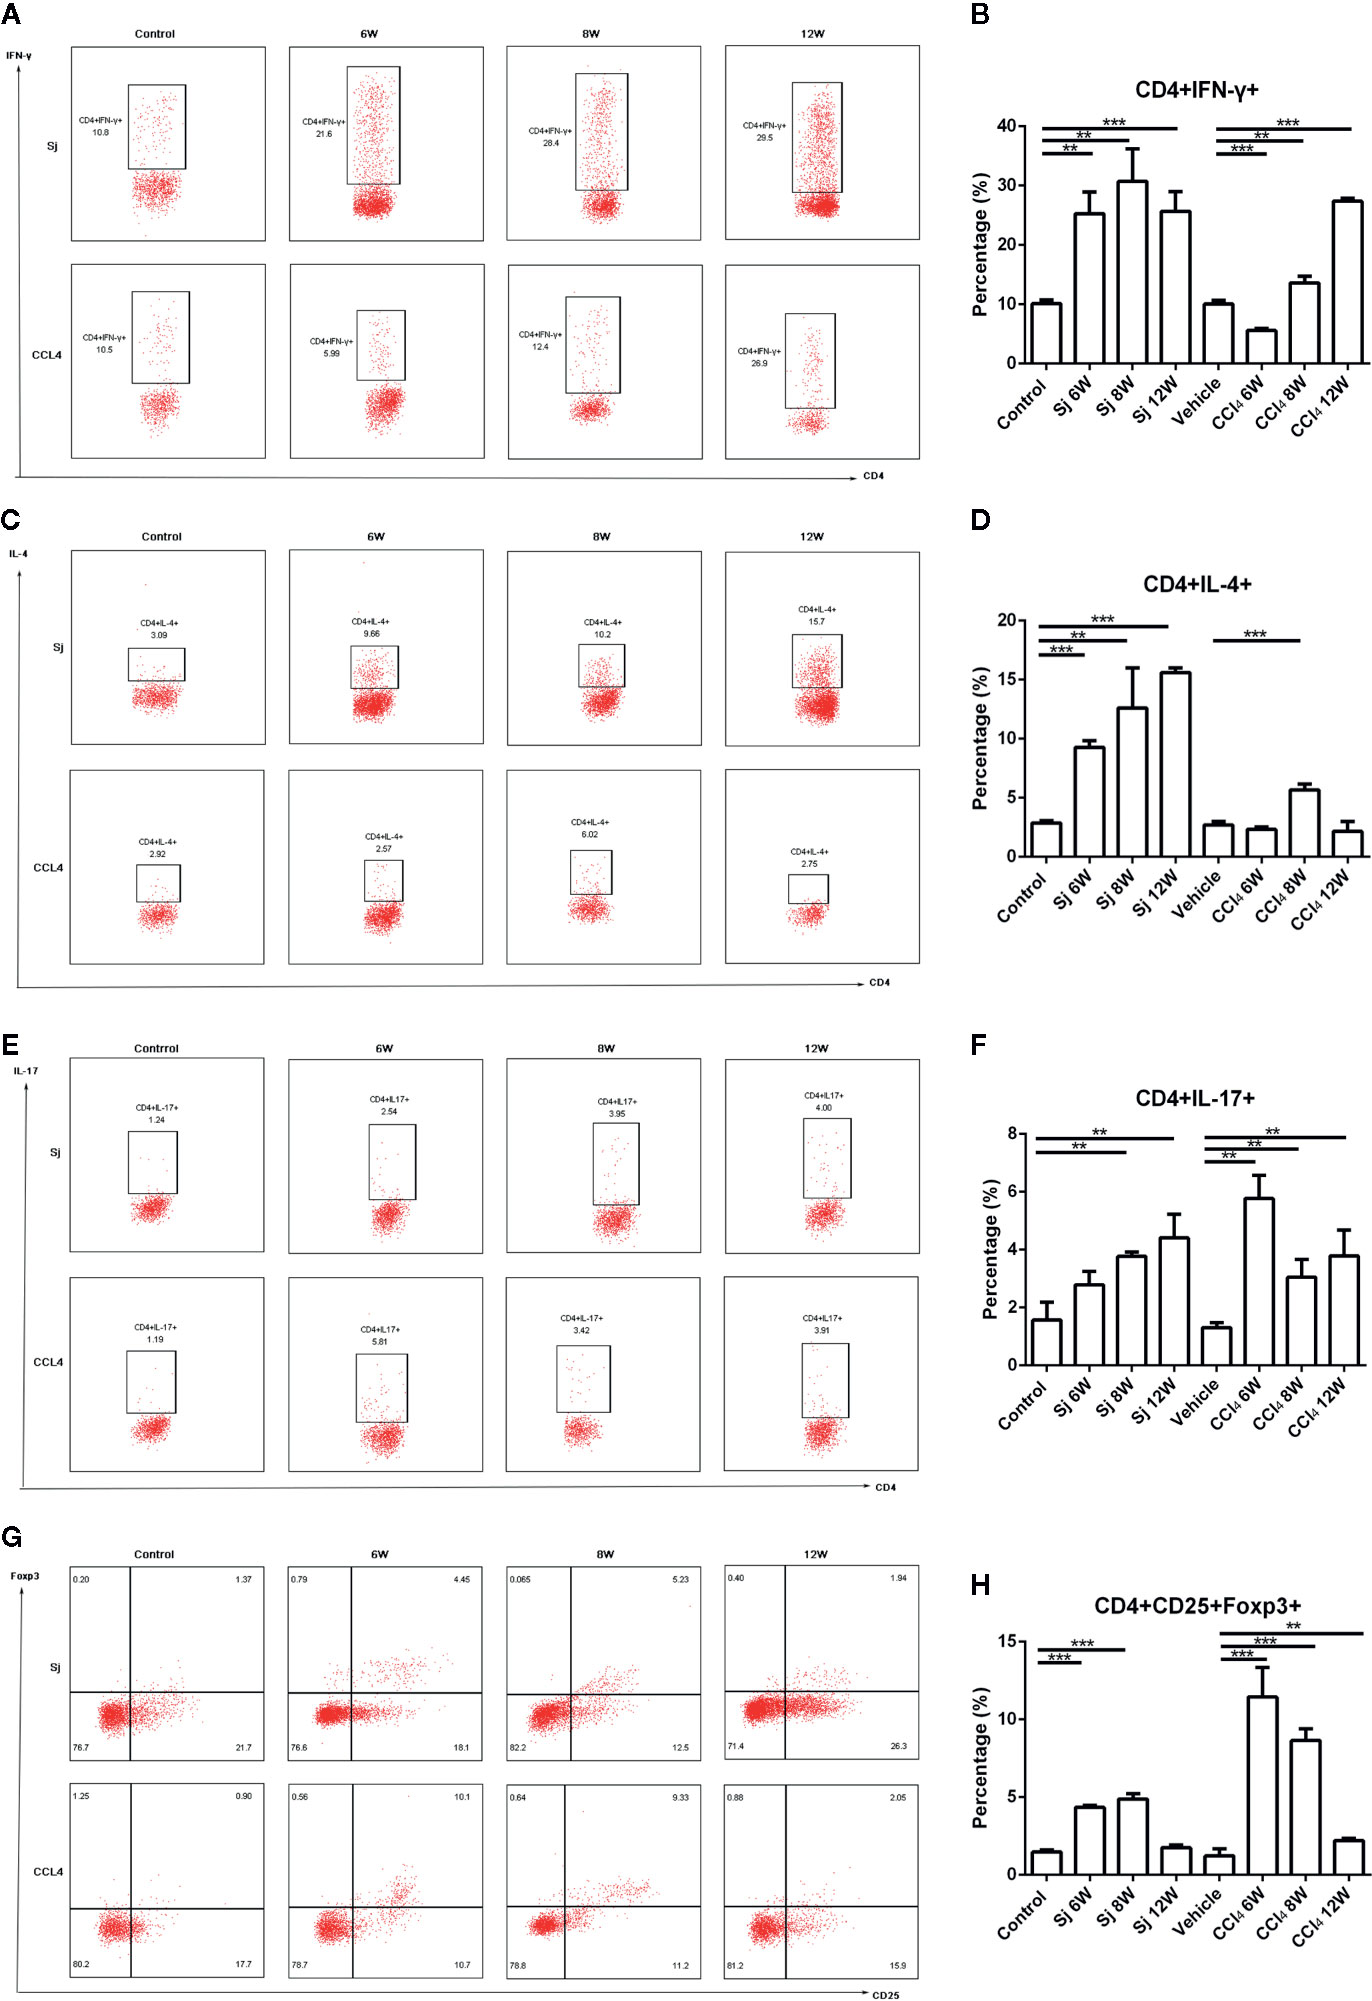
Figure 6 Flow cytometric for the detection of Th1/Th2/Th17/Treg cells in mice infected with S. japonicum or intraperitoneally injected with CCl4. Scatter diagram of (A) Th1 cells (CD4+IFN-γ+), (C) Th2 cells (CD4+IL-4+), (E) Th17 cells (CD4+IL-17+) or (G) Treg cells (CD4+CD25+Foxp3+) in total CD4+ T cells from mice liver. Statistical data analysis of (B) Th1 cells (CD4+IFN-γ+), (D) Th2 cells (CD4+IL-4+), (F) Th17 cells (CD4+IL-17+), or (H) Treg cells (CD4+CD25+Foxp3+) in total CD4+ T cells from mice liver. SJ, S. japonicum; Vehicle, olive oil; Treg, regulatory T cell. Data represent the mean ± SE from three independent experiments. Cells were gated on the CD4+ population. **P < 0.01, ***P < 0.001.
In the CCl4 liver fibrosis model, the proportions of Th1 (CD4+IFN-γ+) cells in liver nonparenchymal cells were 5.60 ± 0.37%, 13.63 ± 1.09%, and 27.40 ± 0.43% at 6, 8, and 12 weeks, respectively, which were statistically significantly different compared with that of the control group (10.06 ± 0.62%) (P=0.000, 0.008, 0.000) (Figures 6A, B). The proportions of Th2 (CD4+IL-4+) cells in liver non parenchymal cells were 2.32 ± 0.22%, 5.67 ± 0.49%, and 2.16 ± 0.84% at 6, 8, and 12 weeks, respectively, and the proportion at 8 weeks group was statistically significantly higher compared with that in the control group (2.70 ± 0.31%) (P=0.000) (Figures 6C, D). The proportions of Th17 (CD4+IL-17+) cells were 5.77 ± 0.80%, 3.05 ± 0.62%, and 3.78% ± 0.89% at 6, 8, and 12 weeks, respectively, which were statistically significantly higher compared with that of the control group (1.31 ± 0.17%) (P=0.007, 0.009, 0.010) (Figures 6E, F). The proportions of Treg (CD4+CD25+Foxp3+) cells were present at 11.45 ± 1.90%, 8.64 ± 0.75%, and 2.20 ± 0.16% at 6, 8, and 12 weeks, respectively. Compared with that of the control group (1.22 ± 0.45%), the differences were statistically significant (P=0.000, 0.000, 0.001) (Figures 6G, H).
Discussion
The weight gain of mice slowed dramatically at 6 weeks post-schistosome infection, while decreased at 9 weeks in the CCl4 liver fibrosis model, which was not reported in the previous literatures. The weight loss indicated that the health status of the body had declined. The liver morphological differences of the two models were that egg nodules on the liver surface of mice infected with S. japonicum, while diffuse granular nodules on that of mice injected with CCl4. The discrepancy may be related to the pathogenesis. The cercariae of S. japonicum develop into adults at 5 weeks post-infection. Female and male worms pair and eggs are laid, deposited into the liver (2). Mature eggs of S. japonicum in the liver causing an inflammatory granuloma, characterized by egg nodule. CCl4 produces free radical in the hepatocytes, which attack membrane unsaturated lipids and damage hepatocytes (24). The necrotic hepatocytes releasing damage associated molecular patterns (DAMPs), induced chronic inflammation followed by fibrosis. The proliferative collagenous fiber retracted the capsule, highlighting the regenerated parenchyma, characterized by diffuse granular nodules (25).
As the data greatly depend on the infection number of S. japonicum or the dosage, the time and frequency of the injection of CCl4, the dynamic progressions of pathological changes, the cytokines, inflammatory factors, macrophages and lymphocytes subsets were compared in the two models of liver fibrosis.
ALT exists in the cytoplasm of hepatocytes and is released into the blood when they are damaged; therefore, ALT was assayed to reflect the damage to hepatocytes (26). Hydroxyproline levels correlate significantly with liver fibrosis (27) and its level could reflect the intensity of fibrosis. The results showed that ALT, hydroxyproline, collagen I and III, and α-SMA mRNA levels all increased at 6 weeks, peaked at 8 weeks, and decreased at 12 weeks in response to S. japonicum infection. The pathological results showed that a small amount of blue collagen appeared around the egg granuloma at 6 weeks, which peaked at 8 weeks, and then decreased at 12 weeks. The lesions observed at different times were similar to those described in the literature (18). MMP-9, the metalloenzyme involved in collagen degradation, also reached a peak at 8 weeks, and then decreased. However, TIMP-1, the inhibitor of metalloenzymes, increased with the time of infection. The results indicated that collagen synthesis was more active than degradation. The balance between MMP/TIMP has been shown to be critical for the turnover of ECM (28). The progressions of collagen I and III, α-SMA, hydroxyproline, fibrosis intensity were generally consistent with previous reports (15, 16). The levels of ALT in serum were lower than those reported maybe relevant with different assay kits and methods (29).
Unlike the S. japonicum infection, the ALT, hydroxyproline, collagen I and III, and α-SMA mRNA levels in the livers treated with CCl4 increased with time, reaching their highest values at 12 weeks, which were not reported previously. MMP-9 and TIMP-1 mRNA levels increased with time; however, the increase in TIMP-1 was greater than that of MMP-9, which indicated that collagen synthesis was more active than degradation, resulting in fibrosis. Masson staining showed blue collagen concentrated in the portal area at the beginning of the CCl4 administration, and the degree of fibrosis increased with extended treatment time. The lesions at different times of observation were similar with previous reports (27).
The levels of cytokines IL-13 and TGF-β were consistent with the development trend of liver fibrosis caused by S. japonicum or CCl4, suggesting that TGF-β and IL-13 were important factors that promoted the progress of liver fibrosis. The results were similar to those reported previously. TGF-β-Smads signaling pathway was confirmed that could boost the activation and release of collagen from stationary HSCs (30). Furthermore, anti-TGF-β approaches have been established and utilized for the treatment of experimental liver fibrosis (31). IL-13 was reported that could promote liver fibrosis by activating HSCs through the protein kinase C pathway (32). Until recently it was believed that IL-13 could directly upregulate genes involved in the fibrotic response, including collagen I, collagen III, MMP and TIMP-1 (33, 34).
The changes in the levels of mRNA encoding TNF-α, F4/80, IL-1β, and IL-6 also correlated with the trend of fibrosis in the S. japonicum model. They all increased at 6 weeks, peaked at 8 weeks, and decreased at 12 weeks. Similar results were obtained for these mRNAs in the CCl4 fibrosis model. The changes in the levels of mRNA encoding TNF-α, F4/80, IL-1β, and IL-6 were in parallel to the trend of fibrosis in the CCl4 model. These results suggested that inflammation played an important role in liver fibrosis, and that the development of inflammation accelerated the progress of liver fibrosis, which agreed with the results of previous studies. Pradere and colleagues (35) confirmed that TNF-α and IL-1β accelerated liver fibrosis by promoting the survival of activated HSCs in vitro and in vivo. Miura and colleagues (36) demonstrated that in mouse non-alcoholic steatohepatitis (NASH), the production of IL-1β by macrophages could activate HSCs. Inflammatory mediators including TNF-α, IL-1β, and IL-10 may influence the progression of liver disease (37, 38). TNF-α stimulated ROS production in hepatocytes sensitized to undergo apoptosis, which induced HSCs activated (39).
At the cellular level, macrophages and lymphoid T cells are involved in liver fibrosis (40). In response to ongoing injury, M1 macrophages propagate inflammation and the development of fibrosis ultimately. Depending on cytokines in the microenvironment, M2 macrophages are recruited or activated as a result of an M1-to-M2 phenotype switch. M2 macrophages promote cell proliferation and reduce apoptosis (41–43). Our results showed that regardless of whether fibrosis was caused by S. japonicum or CCl4, the changing trend of macrophages, including M1 and M2 macrophages, were consistent with the development trend of fibrosis. M1 and M2 macrophages in liver nonparenchymal cells both peaked at 8 week, but decreased quickly in 12 week post S. japonicum infection. However, Zhu and colleagues reported that the percentage of M1 macrophages in peritoneum significantly increased 3 weeks but decreased by 8 weeks post-infection. While the percentage of M2 macrophages started to increase at 8 weeks after infection (44). The macrophages were detected in different tissues may lead to the discrepancy with the Zhu’s study. More M1 and M2-phenotypic markers including nitric oxide synthase (iNOS) and arginase-1 (Arg-1) would be tested in the future study. In CCl4-induced fibrosis, M2 macrophages may have more key roles in the later stage, which was not reported previously. The results of the two models suggested that both M1 and M2 macrophages were involved at each stage of liver fibrosis. The polarization of M1 or M2 macrophages depends on the cytokines in the microenvironment (45).
In T cells, our results showed that the proportions of CD3+, CD4+ T cells decreased with time, which might be relevant to the immune escape of S. japonicum via T cell apoptosis, especially CD4+ T cells (46). However, CD8+ T cell proportion reached their highest value at 6 weeks in mice infected with S. japonicum, suggesting that CD8+ T cells were mainly involved in the granuloma formation. It was reported (47) that the proportion of CD8+ T cells increased after infection at the early stage in the mice infected S. mansoni, with the function of inhibiting immunopathology. CD8+ T cells might be essential in the reduction of granuloma in vivo and in vitro (48, 49). In liver fibrosis caused by CCl4, the change trend of CD3+, CD4+ T cells was similar to that in mice infected by S. japonicum. The proportions of CD3+ T cells and CD4+ T cells decreased gradually, while CD8+ T cell proportion reached their highest value at 12 weeks, which was not reported previously. Previous experimental models implied that CD4 T-helper lymphocytes, especially Th1/Th2 balance may activate HSCs via cytokine production (50). Th1/Th2/Th17/Treg subtypes in CD4 T-helper lymphocytes were detected in our study.
With prolonged S. japonicum infection time, proportion of Th1 cells in liver nonparenchymal cells producing IFN-γ peaked at 8 weeks, and then decreased. Th2 cells secreting IL-4 predominated and reached their highest value at 12 weeks. The balance was consistent with previous reports (51). Th17 cell proportion gradually increased to a high value at 12 weeks, while Treg cells reached their highest levels at 8 weeks, and then declined. Our results were agreed with previous reported that weaker Treg responses were observed in the liver (52). In fact, a decreased expression of liver homing markers was detected on Tregs accumulated in the blood of patients with severe fibrosis during schistosomiasis (53). Our results showed that the immune response of host liver changed from Th1 to Th2/Th17 with weaker Treg, indicating that the antigen of eggs preferentially induced the generation of Th17 and Th2 cells (17). However, in liver fibrosis caused by CCl4, Th1 cells occupied the dominant position, while Th2, Th17, and Treg cells proportions decreased gradually. The host’s immune response was mainly Th1 type, a state of hyperactivity in liver microenvironment, which was not reported previously.
The reasons for differences in pathological progression and immune response may be related to the injury mechanism of the two modeling methods. Mature eggs of S. japonicum in the liver could release SEA into surrounding tissues, treated by APCs and presented to helper T cells. T cells can produce a variety of lymphokines, causing an inflammatory granulomatous reaction characterized by aggregation of macrophages, lymphocytes, neutrophils, and eosinophils. At this stage, the immunoreaction of the host was mainly Th1 activity secreting IFN-γ, which promoted inflammation. To avoid the damage caused by excessive inflammation to the body, the immunoreaction transformed into a Th2 immunosuppression response secreting IL-4, IL-10, and IL-13, induced by egg antigens (2). In S. japonicum infection, it has been reported that Th17 may play an important role in the formation and growth of granulomas around the eggs produced by the adult worm (17). The Treg cells with anti-inflammatory and anti-fibrotic role accumulate in the blood but failed to be recruited to the liver during schistosomiasis (53). Th2 response creates granulomas around schistosome eggs surrounded by a collagen ECM deposited by activated HSCs that protects the surrounding hepatocytes and other parenchymal cells from toxic egg-produced antigens (54). A dominant role of Th2 rather than Th1 response mediators during the schistosomiasis liver fibrotic process has been reported (55, 56).
CCl4 produces free CCl3· and Cl· after activation of a cytochrome P450-dependent oxidase in the hepatocyte endoplasmic reticulum. The free radicals bind covalently with macromolecules in hepatocytes, which could attack membrane unsaturated lipids, trigger the production of reactive oxygen species and lipid peroxidation, and damage hepatocytes, leading to necrosis, chronic inflammation and HSC activation, the release of collagen, and advanced liver fibrosis (20, 24). With the prolongation of treatment, the damage caused by CCl4 to hepatocytes accumulated gradually, increasing inflammation and fibrosis. The host immune system mainly promoted a Th1 type immune response to inflammation. Mahrouf-Yorgov and colleagues (57) reported that 8-week-old mice administrated with CCl4 for 6 weeks expressed less Th2 cytokines, while 15-month-old mice oriented toward a Th2 response. The type immune response may be connected with ages. Innate immune responses with a few participation of cell-mediated immunity may contribute to the progression of CCl4-induced fibrosis (20).
Altogether, in the present study IL-13, TGF-β, inflammatory factors, macrophages, and T lymphocyte contributed to the progress of liver fibrosis induced by S. japonicum and CCl4, but the time course or subtype of their participation were different, especially distinct T lymphocytes subtypes involved in the two models. The dynamic changes of pathological intensity reflected the above differences. The peak of pathological intensity appeared simultaneously with that of IL-13, TGF-β, inflammatory factors and macrophages in the two models, respectively.
Data Availability Statement
All datasets presented in this study are included in the article/Supplementary Material.
Ethics Statement
The animal study was reviewed and approved by the ethics committee of Jiangsu Institute of Parasitic Diseases.
Author Contributions
L-JS designed and performed the study; managed, analyzed, and interpreted the data; and prepared the manuscript. X-RY, S-SM, and HG assisted in the design and study implementation and revised the manuscript. J-HL and YZ designed the study and facilitated and assisted the study implementation. P-PD and C-JM assisted in the design of the study and data analysis. Z-CH designed the study, supervised the study implementation, analyzed the data, and revised the manuscript. All authors contributed to the article and approved the submitted version.
Funding
This work was supported by grants from the National Natural Science Foundation of China (grant number 81802035, 81630092); the Project of Invigorating Health Care through Science, Technology and Education; the Scientific Research Projects from Jiangsu Provincial Commission of Health and Family Planning (grant number H201635); and the Public Health Research Center at Jiangnan University (grant number JUPH201812).
Conflict of Interest
J-HL and Z-CH were employed by Jiangsu TargetPharma Laboratories Inc.
The remaining authors declare that the research was conducted in the absence of any commercial or financial relationships that could be construed as a potential conflict of interest.
Supplementary Material
The Supplementary Material for this article can be found online at: https://www.frontiersin.org/articles/10.3389/fimmu.2020.570524/full#supplementary-material
Supplementary Table 1 | Primers used for mRNA analysis.
References
2. Hirata M, Fukuma T. Cytokine regulation in experimentally-induced Schistosoma japonicum egg granuloma formation. Parasitol Int (2003) 52:341–9. doi: 10.1016/s1383-5769(03)00050-3
3. Zhang CY, Yuan WG, He P, Lei JH, Wang CX. Liver fibrosis and hepatic stellate cells: Etiology, pathological hallmarks and therapeutic targets. World J Gastroenterol (2016) 22:10512–22. doi: 10.3748/wjg.v22.i48.10512
4. Arthur MJ. Reversibility of liver fibrosis and cirrhosis following treatment for hepatitis C. Gastroenterology (2002) 122:1525–8. doi: 10.1053/gast.2002.33367
5. Issa R, Zhou X, Constandinou CM, Fallowfield J, Millward-Sadler H, Gaca MD, et al. Spontaneous recovery from micronodular cirrhosis: evidence for incomplete resolution associated with matrix cross-linking. Gastroenterology (2004) 126:1795–808. doi: 10.1053/j.gastro.2004.03.009
6. Yanguas SC, Cogliati B, Willebrords J, Maes M, Colle I, van den Bossche B, et al. Experimental models of liver fibrosis. Arch Toxicol (2016) 90:1025–48. doi: 10.1007/s00204-015-1543-4
7. Khan RA, Khan MR, Sahreen S, Ahmed M, Shah NA. Carbon tetrachloride-induced lipid peroxidation and hyperglycemia in rat: a novel study. Toxicol Ind Health (2015) 31:546–53. doi: 10.1177/0748233713475503
8. Ito M, Suzuki J, Tsujioka S, Sasaki M, Gomori A, Shirakura T, et al. Longitudinal analysis of murine steatohepatitis model induced by chronic exposure to high-fat diet. Hepatol Res (2007) 37:50–7. doi: 10.1111/j.1872-034X.2007.00008.x
9. Sitia G, Aiolfi R, Di Lucia P, Mainetti M, Fiocchi A, Mingozzi F, et al. Antiplatelet therapy prevents hepatocellular carcinoma and improves survival in a mouse model of chronic hepatitis B. Proc Natl Acad Sci U S A (2012) 109:E2165–72. doi: 10.1073/pnas.1209182109
10. Zhang Y, Huang D, Gao W, Yan J, Zhou W, Hou X, et al. Lack of IL-17 signaling decreases liver fibrosis in murine schistosomiasis japonica. Int Immunol (2015) 27:317–25. doi: 10.1093/intimm/dxv017
11. Kamel MM, Baz HGE, Demerdash Z, Hassan S, Salah F, Mansour WA, et al. Cord blood-derived mesenchymal stem cells with hepatogenic differentiation potential ameliorate chronic liver affection in experimental models. Adv Clin Exp Med (2018) 27:1329–39. doi: 10.17219/acem/70430
12. Liang YJ, Luo J, Yuan Q, Zheng D, Liu YP, Shi L, et al. New insight into the antifibrotic effects of praziquantel on mice in infection with Schistosoma japonicum. PLoS One (2011) 6:e20247. doi: 10.1371/journal.pone.0020247
13. Liu J, Kong D, Qiu J, Xie Y, Lu Z, Zhou C, et al. Praziquantel ameliorates CCl4 -induced liver fibrosis in mice by inhibiting TGF-β/Smad signalling via up-regulating Smad7 in hepatic stellate cells. Br J Pharmacol (2019) 176:4666–80. doi: 10.1111/bph.14831
14. Zhu D, Song K, Chen J, Wang J, Sun X, Qian H, et al. Expression of Septin4 in Schistosoma japonicum-infected mouse livers after praziquantel treatment. Parasit Vectors (2015) 8:19. doi: 10.1186/s13071-015-0640-9
15. Du WD, Zhang YE, Zhai WR, Zhou XM. Dynamic changes of type I,III and IV collagen synthesis and distribution of collagen-producing cells in carbon tetrachloride-induced rat liver fibrosis. World J Gastroenterol (1999) 5:397–403. doi: 10.3748/wjg.v5.i5.397
16. Bartley PB, Ramm GA, Jones MK, Ruddell RG, Li Y, McManus DP, et al. A contributory role for activated hepatic stellate cells in the dynamics of Schistosoma japonicum egg-induced fibrosis. Int J Parasitol (2006) 36:993–1001. doi: 10.1016/j.ijpara.2006.04.015
17. Wen X, He L, Chi Y, Zhou S, Hoellwarth J, Zhang C, et al. Dynamics of Th17 cells and their role in Schistosoma japonicum infection in C57BL/6 mice. PLoS Negl Trop Dis (2011) 5:e1399. doi: 10.1371/journal.pntd.0001399
18. Zhang B, Wu X, Liu J, Song L, Song Q, Wang L, et al. β-Actin: Not a Suitable Internal Control of Hepatic Fibrosis Caused by Schistosoma japonicum. Front Microbiol (2019) 10:66. doi: 10.3389/fmicb.2019.00066
19. Yang T, Chen SL, Lu XJ, Shen CY, Liu Y, Chen YP. Bone morphogenetic protein 7 suppresses the progression of hepatic fibrosis and regulates the expression of gremlin and transforming growth factor β1. Mol Med Rep (2012) 6:246–52. doi: 10.3892/mmr.2012.892
20. Barnes MA, McMullen MR, Roychowdhury S, Madhun NZ, Niese K, Olman MA, et al. Macrophage migration inhibitory factor is required for recruitment of scar-associated macrophages during liver fibrosis. J Leukoc Biol (2015) 97:161–9. doi: 10.1189/jlb.3A0614-280R
21. Smithers SR, Simpson AJ, Yi X, Omer-Ali P, Kelly C, McLaren DJ. The mouse model of schistosome immunity. Acta Trop Suppl (1987) 12:21–30.
22. Dong S, Chen QL, Song YN, Sun Y, Wei B, Li XY, et al. Mechanisms of CCl4-induced Liver Fibrosis With Combined Transcriptomic and Proteomic Analysis. J Toxicol Sci (2016) 41:561–72. doi: 10.2131/jts.41.561
23. Mohar I, Brempelis KJ, Murray SA, Ebrahimkhani MR, Crispe IN. Isolation of Non-parenchymal Cells from the Mouse Liver. Methods Mol Biol (2015) 1325:3–17. doi: 10.1007/978-1-4939-2815-6_1
24. Comporti M. Three models of free radical-induced cell injury. Chem Biol Interact (1989) 72:1–56. doi: 10.1016/0009-2797(89)90016-1
25. Takebe H, Sato I, Tajima S, Ikeda Y, Ito K, Nose T. Effects of cianidanol (KB-53) on liver cirrhosis induced by CCl4 in rats: a pathological investigation. Nihon Yakurigaku Zasshi (1983) 81:585–91. doi: 10.1254/fpj.81.585
26. Tu H, Chen D, Cai C, Du Q, Lin H, Pan T, et al. microRNA-143-3p attenuated development of hepatic fibrosis in autoimmune hepatitis through regulation of TAK1 phosphorylation. J Cell Mol Med (2020) 24:1256–67. doi: 10.1111/jcmm.14750
27. Kim YO, Popov Y, Schuppan D. Optimized Mouse Models for Liver Fibrosis. Methods Mol Biol (2017) 1559:279–96. doi: 10.1007/978-1-4939-6786-5_19
28. Elpek GÖ. Cellular and molecular mechanisms in the pathogenesis of liver fibrosis: An update. World J Gastroenterol (2014) 20:7260–76. doi: 10.3748/wjg.v20.i23.7260
29. Cai P, Gobert GN, You H, Duke M, McManus DP. Circulating miRNAs: Potential Novel Biomarkers for Hepatopathology Progression and Diagnosis of Schistosomiasis Japonica in Two Murine Models. PLoS Negl Trop Dis (2015) 9:e0003965. doi: 10.1371/journal.pntd.0003965
30. Breitkopf K, Godoy P, Ciuclan L, Singer MV, Dooley S. TGF-beta/Smad signaling in the injured liver. Z Gastroenterol (2006) 44:57–66. doi: 10.1055/s-2005-858989
31. Xu R, Zhang Z, Wang FS. Liver fibrosis: mechanisms of immune-mediated liver injury. Cell Mol Immunol (2012) 9:296–301. doi: 10.1038/cmi.2011.53
32. Sui G, Cheng G, Yuan J, Hou X, Kong X, Niu H. Interleukin (IL)-13, Prostaglandin E2 (PGE2), and Prostacyclin 2 (PGI2) Activate Hepatic Stellate Cells via Protein kinase C (PKC) Pathway in Hepatic Fibrosis. Med Sci Monit (2018) 24:2134–41. doi: 10.12659/msm.906442
33. Kaviratne M, Hesse M, Leusink M, Cheever AW, Davies SJ, McKerrow JH, et al. IL-13 activates a mechanism of tissue fibrosis that is completely TGF-beta independent. J Immunol (2004) 173:4020–29. doi: 10.4049/jimmunol.173.6.4020
34. Lee CG, Homer RJ, Zhu Z, Lanone S, Wang X, Koteliansky V, et al. Interleukin-13 induces tissue fibrosis by selectively stimulating and activating transforming growth factor beta(1). J Exp Med (2001) 194:809–21. doi: 10.1084/jem.194.6.809
35. Pradere JP, Kluwe J, De Minicis S, Jiao JJ, Gwak GY, Dapito DH, et al. Hepatic macrophages but not dendritic cells contribute to liver fibrosis by promoting the survival of activated hepatic stellate cells in mice. Hepatology (2013) 58:1461–73. doi: 10.1002/hep.26429
36. Miura K, Kodama Y, Inokuchi S, Schnabl B, Aoyama T, Ohnishi H, et al. Toll-like receptor 9 promotes steatohepatitis by induction of interleukin-1beta in mice. Gastroenterology (2010) 139:323–34. doi: 10.1053/j.gastro.2010.03.052
37. Degoul F, Sutton A, Mansouri A, Cepanec C, Degott C, Fromenty B, et al. Homozygosity for alanine in the mitochondrial targeting sequence of superoxide dismutase and risk for severe alcoholic liver disease. Gastroenterology (2001) 120:1468–74. doi: 10.1053/gast.2001.24051
38. Järveläinen HA, Orpana A, Perola M, Savolainen VT, Karhunen PJ, Lindros KO. Promoter polymorphism of the CD14 endotoxin receptor gene as a risk factor for alcoholic liver disease. Hepatology (2001) 33:1148–53. doi: 10.1053/jhep.2001.24236
39. Maher JJ, Zia S, Tzagarakis C. Acetaldehyde-induced stimulation of collagen synthesis and gene expression is dependent on conditions of cell culture: studies with rat lipocytes and fibroblasts. Alcohol Clin Exp Res (1994) 18:403–9. doi: 10.1111/j.1530-0277.1994.tb00033.x
40. Koyama Y, Brenner DA. Liver inflammation and fibrosis. J Clin Invest (2017) 127:55–64. doi: 10.1172/JCI88881
41. Wan J, Benkdane M, Teixeira-Clerc F, Bonnafous S, Louvet A, Lafdil F, et al. M2 Kupffer cells promote M1 Kupffer cell apoptosis: a protective mechanism against alcoholic and nonalcoholic fatty liver disease. Hepatology (2014) 59:130–42. doi: 10.1002/hep.26607
42. Mosser DM, Edwards JP. Exploring the full spectrum of macrophage activation. Nat Rev Immunol (2008) 8:958–69. doi: 10.1038/nri2448
43. Zhang F, Wang H, Wang X, Jiang G, Liu H, Zhang G, et al. TGF-beta induces M2-like macrophage polarization via SNAIL-mediated suppression of a pro-inflammatory phenotype. Oncotarget (2016) 7:52294–306. doi: 10.18632/oncotarget
44. Zhu J, Xu Z, Chen X, Zhou S, Zhang W, Chi Y, et al. Parasitic antigens alter macrophage polarization during Schistosoma japonicum infection in mice. Parasit Vectors (2014) 7:122. doi: 10.1186/1756-3305-7-122
45. Ricardo SD, van Goor H, Eddy AA. Macrophage diversity in renal injury and repair. J Clin Invest (2008) 118:3522–30. doi: 10.1172/JCI36150
46. Chen L, Rao KV, He YX, Ramaswamy K. Skin-stage schistosomula of Schistosoma mansoni produce an apoptosis-inducing factor that can cause apoptosis of T cells. J Biol Chem (2002) 277:34329–35. doi: 10.1074/jbc.M201344200
47. Ragheb S, Boros DL. Characterization of granuloma T lymphocyte function from Schistosoma mansoni-infected mice. J Immunol (1989) 142:3239–46.
48. Chensue SW, Warmington KS, Hershey SD, Terebuh PD, Othman M. Evolving T cell responses in murine schistosomiasis. Th2 cells mediate secondary granulomatous hypersensitivity and are regulated by CD8+ T cells in vivo. J Immunol (1993) 151:1391–400.
49. Perrin PJ, Phillips SM. The molecular basis of granuloma formation in schistosomiasis. I. A T cell-derived suppressor effector factor. J Immunol (1988) 14:1714–19.
50. Li JT, Liao ZX, Ping J, Xu D, Wang H. Molecular mechanism of hepatic stellate cell activation and antifibrotic therapeutic strategies. J Gastroenterol (2008) 43:419–28. doi: 10.1007/s00535-008-2180-y
51. Pearce EJ, MacDonald AS. The immunobiology of schistosomiasis. Nat Rev Immunol (2002) 2:499–511. doi: 10.1038/nri843
52. Romano A, Hou X, Sertorio M, Dessein H, Cabantous S, Oliveira P, et al. FOXP3+ Regulatory T Cells in Hepatic Fibrosis and Splenomegaly Caused by Schistosoma japonicum: The Spleen May Be a Major Source of Tregs in Subjects with Splenomegaly. PLoS Negl Trop Dis (2016) 10:e0004306. doi: 10.1371/journal.pntd.0004306
53. Watanabe K, Mwinzi PN, Black CL, Muok EM, Karanja DM, Secor WE, et al. T regulatory cell levels decrease in people infected with Schistosoma mansoni on effective treatment. Am J Trop Med Hyg (2007) 77:676–82. doi: 10.4269/ajtmh.2007.77.676
54. Barron L, Wynn TA. Macrophage activation governs schistosomiasis-induced inflammation and fibrosis. Eur J Immunol (2011) 41:2509–14. doi: 10.1002/eji.201141869
55. Kamdem SD, Moyou-Somo R, Brombacher F, Nono JK. Host Regulators of Liver Fibrosis During Human Schistosomiasis. Front Immunol (2018) 9:2781. doi: 10.3389/fimmu.2018.02781
56. Fallon PG, Mangan NE. Suppression of TH2-type allergic reactions by helminth infection. Nat Rev Immunol (2007) 7:220–30. doi: 10.1038/nri2039
Keywords: liver fibrosis, Schistosoma japonicum, carbon tetrachloride, hepatic inflammation, immune response, dynamic progression, differential progression
Citation: Song L-J, Yin X-R, Mu S-S, Li J-H, Gao H, Zhang Y, Dong P-P, Mei C-J and Hua Z-C (2020) The Differential and Dynamic Progression of Hepatic Inflammation and Immune Responses During Liver Fibrosis Induced by Schistosoma japonicum or Carbon Tetrachloride in Mice. Front. Immunol. 11:570524. doi: 10.3389/fimmu.2020.570524
Received: 08 June 2020; Accepted: 21 September 2020;
Published: 07 October 2020.
Edited by:
Thiago Almeida Pereira, Stanford University, United StatesReviewed by:
Pengfei Cai, QIMR Berghofer Medical Research Institute, AustraliaSheilla Andrade De Oliveira, Fiocruz Pernambuco, Brazil
Copyright © 2020 Song, Yin, Mu, Li, Gao, Zhang, Dong, Mei and Hua. This is an open-access article distributed under the terms of the Creative Commons Attribution License (CC BY). The use, distribution or reproduction in other forums is permitted, provided the original author(s) and the copyright owner(s) are credited and that the original publication in this journal is cited, in accordance with accepted academic practice. No use, distribution or reproduction is permitted which does not comply with these terms.
*Correspondence: Zi-Chun Hua, aHVhemNAbmp1LmVkdS5jbg==