- 1Program in Molecular and Cellular Biology, University of Massachusetts, Amherst, MA, United States
- 2Department of Veterinary and Animal Sciences, University of Massachusetts, Amherst, MA, United States
γδ T cells have broad reactivity and actively participate in protective immunity against tumors and infectious disease-causing organisms. In γδ-high species such as ruminants and other artiodactyls many γδ T cells bear the lineage-specific markers known as WC1. WC1 molecules are scavenger receptors coded for by a multigenic array and are closely related to SCART found on murine γδ T cells and CD163 found on a variety of cells. We have previously shown that WC1 molecules are hybrid pattern recognition receptors thereby binding pathogens as well as signaling co-receptors for the γδ T cell receptor. WC1+ γδ T cells can be divided into two major subpopulations differentiated by the WC1 genes they express and the pathogens to which they respond. Therefore, we hypothesize that optimal γδ T cell responses are contingent on pathogen binding to WC1 molecules, especially since we have shown that silencing WC1 results in an inability of γδ T cells from primed animals to respond to the pathogen Leptospira, a model system we have employed extensively. Despite this knowledge about the crucial role WC1 plays in γδ T cell biology, the pattern of WC1 gene expression by individual γδ T cells was not known but is critical to devise methods to engage γδ T cells for responses to specific pathogens. To address this gap, we generated 78 γδ T cell clones. qRT-PCR evaluation showed that approximately 75% of the clones had one to three WC1 genes transcribed but up to six per cell occurred. The co-transcription of WC1 genes by clones showed many combinations and some WC1 genes were transcribed by both subpopulations although there were differences in the overall pattern of WC1 genes transcription. Despite this overlap, Leptospira-responsive WC1+ memory γδ T cell clones were shown to have a significantly higher propensity to express WC1 molecules that are known to bind to the pathogen.
Introduction
WC1 family members are T cell co-receptors and pathogen recognition receptors uniquely expressed by the majority of γδ T cells in the blood of ruminants (1). Structurally they are Group B scavenger receptor cysteine rich (SRCR) molecules (2) and belong to the CD163 family (2, 3) which also includes the murine γδ T cell marker SCART (3, 4). WC1-expressing γδ T cells in cattle, a γδ T cell high species and our experimental model, are classified into two main subpopulations referred to as WC1.1+ or WC1.2+ based on expression of different WC1 molecules that react with monoclonal antibodies (mAb) that recognize epitopes in their N-terminal SRCR domains (5). We and others have previously shown that these subpopulations also differ in their responses to pathogens. For example, following in vivo priming of cattle cells in the WC1.1+ subpopulation respond by proliferation and interferon-γ production to Leptospira spp. in in vitro recall responses (6, 7) whereas cells in the WC1.2+ subpopulation respond in vitro to other pathogens such as Anaplasma marginale following infection (8). When cattle are infected with virulent strains of Mycobacterium bovis both WC1+ lineages are recruited to the granulomas in infected cattle (9) but only the WC1.1+ cells respond to the vaccine strain BCG (10). Following in vivo-sensitization, these WC1+ mycobacterial-responsive bovine γδ T cells also have been shown to respond in recall responses in vitro to both protein and non-protein antigens while WC1+ and CD8+ γδ T cells respond to BCG-infected macrophages (9, 11). Adaptive-like memory γδ T cells are not confined to the bovine model having been described for specific subpopulations of murine γδ T cells (12, 13) and to be sensitized by Listeria monocytogenes (14) and Staphyloccus aureus (15) in vivo while in humans and non-human primates memory γδ T cells responses to mycobacteria (16–18), influenza (19), and malaria (20) have been reported.
The 13 WC1 molecules can be divided into 10 WC1.1-types and 3 WC1.2-types based on signature insertions or deletions of amino acids in their most membrane-distal SRCR domain known as the a1 domain (Figure S1 in Supplementary Material). The first sequenced WC1 genes (21) and therefore considered to be the archetypal WC1.1 [coded for by WC1-3 (22)] and WC1.2 molecules [coded for by WC1-4 (22)] differ in their binding to Leptospira. As many as five of WC1-3’s 11 SRCR domains are engaged, including the a1 domain, while none of the SRCR domains of its WC1.2 counterpart, WC1-4, bind Leptospira despite considerable sequence similarity (23). Binding can be disrupted by a single amino acid mutation (23). Four other WC1.1 type molecules also have SRCR domains that bind Leptospira but none of the WC1.2 molecules have such domains. This knowledge contributed to our understanding of the dichotomy in the ability of cells in the subpopulations to respond to particular pathogens. We hypothesize that the WC1 molecules expressed by a γδ T cell contribute to its pathogen responsiveness and that co-expression of multiple WC1 gene products that bind the same pathogen could result in increased avidity for the pathogen and amplify the signal in a dose-dependent manner (i.e., the more WC1’s of the same or multiple types that bind the pathogen, the stronger the cellular activation signal). The latter is based on our findings that when all (vs. a proportion of) the WC1 receptors are co-crosslinked in conjunction with the γδ T cell receptor (TCR) augmentation of the cellular activation is enhanced (24). Conversely, when WC1 expression is downregulated by RNA silencing there is an abrogation of γδ T cell response (25).
The previous analyses of WC1 transcripts in the subpopulations suggest co-expression of WC1 genes in a variegated pattern. While the WC1.2+ population has transcripts for all three WC1.2-type genes, only two of the three WC1.2-type gene products react with the population-defining mAb (5, 26). This suggests the non-mAb-reactive gene product is co-expressed in cells expressing the mAb-reactive gene product. WC1.3+ cells, a subpopulation of the WC1.1+ population, express at least two WC1 genes based on reactivity with two mAbs: mAb CACT21A that reacts with WC1-8 only and mAb BAG25A that reacts with WC1.1-like molecules but not WC1-8 (5, 24). However, the following questions remained: is there a specific number of different WC1 genes that all WC1+ γδ T cells express and are there set combinations of WC1 genes always expressed together? Understanding the expression of WC1 genes on individual γδ T cells is necessary to build models of how to induce cellular immune responses to specific pathogens. By analyzing WC1+ γδ T cell clones here, we showed that the WC1 locus is permissive for transcription of more than one gene by an individual cell and describe the many combinations of WC1 gene transcription. Finally, using the Leptospira-responsive WC1+ memory γδ T cell clones we showed these cells have a high propensity to express WC1 molecules that bind to the pathogen.
Materials and Methods
Isolation of Cells and RNA
Whole blood was collected with heparin by jugular venipuncture from a single adult Holstein heifer that had been vaccinated against Leptospira serovar Hardjo with a commercial inactivated vaccine (Spirovac, Pfizer) using an initial two-dose regime during calfhood and subsequently boosted intermittently with a single dose during adulthood as approved by the University of Massachusetts IACUC. Rabies vaccines were given. This vaccination procedure in cattle has been shown previously to result in γδ T cells in blood that respond in recall responses when stimulated in vitro with Leptospira (6, 7, 27). Peripheral blood mononuclear cells (PBMC) were isolated from blood by Ficoll-hypaque density gradient centrifugation. Total RNA was isolated from cells using TRIzol (Invitrogen) with 20 µg of glycogen carrier added after the chloroform step. 0.5–1 µg RNA was treated with 1 U of DNase enzyme (Promega) for 30 min at 37°C, then 70°C for 5 min. RNA purity and concentration were determined by Nanodrop spectrophotometry (Thermo-Fisher). cDNA synthesis was done using a commercial reverse-transcriptase kit (Promega) according to the manufacturer’s protocol. For T cell clone cDNA samples, we used Single Cell PreAmp Mix with random primers (Fisher Scientific), at 95°C for 10 min, followed by 14 cycles of 15 s at 95°C and 4 min at 60°C with a final inactivation at 99°C for 10 min.
Lymphocyte Cultures
Lymphocytes were cultured with a modification of the protocol for generating bovine central memory T cells (TCM) (28). Briefly, 2.5 × 10⁶ PBMC were stimulated in a 24-well culture plates in 1 ml of complete RPMI (c-RPMI) medium [RPMI-1640 supplemented with 10% heat-inactivated fetal bovine serum (Hyclone), 200 mM l-glutamine (Sigma), 5 × 10⁻⁵ M 2-mercaptoethanol (Sigma) and 10 mg/ml gentamycin (Invitrogen)] with 0.16 µg/ml of sonicated Leptospira borgpetersenii serovar Hardjobovis. On days 3 and 7, 0.5 ml of supernatant was removed from each well and replenished with 0.5 ml of c-RPMI containing 30 U/ml of recombinant bovine IL-2 (rBoIL-2; R&D Systems). On days 10 and 12, 0.5 ml of the supernatant was removed and replaced with fresh c-RPMI medium. This protocol is referred to as the TCM protocol throughout. On day 14, cultures were pooled and washed with sterile PBS and then dye-loaded with 0.5 µM efluor-670 cell division dye (eBioSciences) according to the manufacturer’s protocol. Cells were cultured with sonicated Leptospira for an additional 7 days; this modification is referred to as the TEM protocol.
Immunofluorescence Staining and Flow Cytometric Sorting
WC1.1+ and WC1.2+ γδ T cell subpopulations were obtained by staining lymphocytes with anti-WC1.1 mAb (BAG25A with anti-Mu IgM-FITC) and anti-WC1.2 mAb (CACTB32A with anti-Mu IgG1-PE). For WC1.3+ cells, lymphocytes were stained with anti-WC1.1 mAb and anti-WC1.3 mAb (CACT21A with anti-Mu IgG1-PE). Double or single-stained cells were sorted using FACS ARIA (BD). To obtain cell populations for T cell expansion, efluor670 dye-loaded cells were washed and stained as above, but sorted on efluor670-APC low cells (indicating multiple cell divisions had occurred in culture) to obtain WC1.1, WC1.2, and WC1.3 cell populations. Evaluation of memory markers by indirect immunofluorescence with mAbs against TCRδ (mAb GB21A, IgG2b), CD44 (mAb BAQ40A, IgG3-PE), and CD62L (mAb BAQ92A, IgG1-PE) and appropriate secondary Abs conjugated to fluorophores was conducted and evaluated by flow cytometry. MAbs were purchased from Washington State University Monoclonal Antibody Center (Pullman, WA, USA), and fluorophore-conjugated secondary polyclonal antibodies were purchased from Southern Biotechnology. All analyses were done using FlowJo v10 (TreeStar, Inc.).1
Generation of T Cell Clones
On day 21 of the TEM protocol, sorted WC1+ γδ T cell populations were plated into 96-well round-bottom tissue culture plates at a concentration of 1 cell/well in 100 µl volume. Plated cells were stimulated by adding 5 × 10⁴ irradiated (5,000 rads) autologous PBMC and 10 U/ml rBoIL-2 with or without 0.5 ng/ml rHuIL-15 (R&D Systems) with or without 0.16 µg/ml sonicated Leptospira borgpetersenii serovar Hardjbovis. Every 10 days, 100 µl of supernatant from each well was removed and replaced with 100 µl medium containing the same components until cells were harvested. Cell colonies were visible by 20 days after plating in 96-well plates and were harvested in TRIzol for RNA isolation about 7 weeks post-plating. The likelihood that any of the cell colonies had arisen from a single cell was determined by the method of de St. Groth (29). For each putative T cell clone, we harvested between 5 × 10⁴ and 5 × 10⁵ cells for cDNA synthesis. Viable cells were counted in a hemocytometer by microscopy using Trypan Blue exclusion.
Primer Design and qRT-PCR
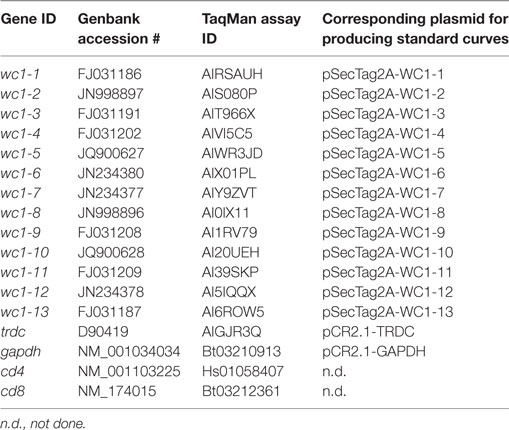
ClustalW22 was used for multiple sequence alignment for bovine WC1 SRCR a1 domains based on accession numbers as published (26) to design TaqMan assays for individual WC1 genes (Figure S1 in Supplementary Material). Custom designed primers and the FAM/MGB fluorophore/quencher system (referred to as TaqMan assays) were prepared by Invitrogen. Additionally, commercially available TaqMan assays for the bovine TCRδ constant gene (TRDC), GAPDH, beta-2 microglobulin, CD4 and CD8α were obtained from Invitrogen (Table 1). GAPDH and beta-2 microglobulin were used as housekeeping genes to determine template concentrations while CD4 and CD8α were used as negative controls (data not shown). Amplicons were generated using the Stratagene qPCR system with the following settings: an initial 2 min UDG step followed by 10 min at 95°C and 40 cycles of 15 s at 95°C, and 30 s at 60°C. The mean and SEM of replicate wells for WC1 and TRDC TaqMan assays was calculated for each target.
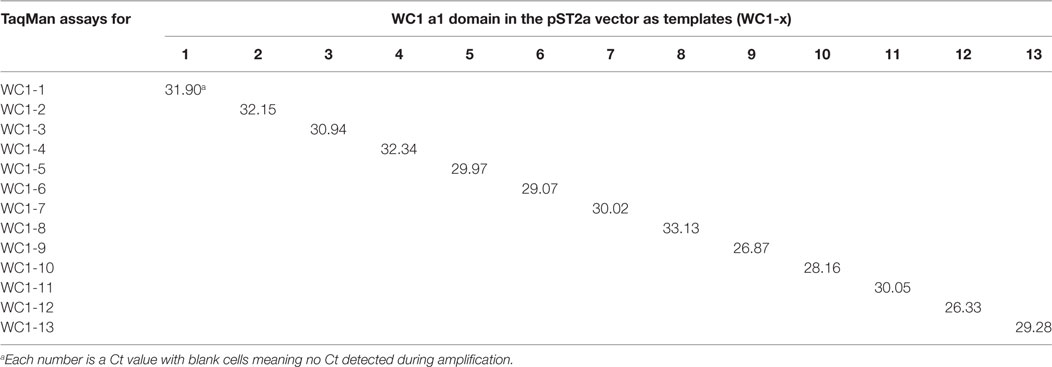
Amplicons were run on 2% TAE-agarose gels, purified by gel extraction (Qiagen) (Figure S2A in Supplementary Material), cloned into pCR2.1 vector using TOPO-TA (Invitrogen), transformed into ONE-SHOT competent cells (Invitrogen), and plated on LB-kanamycin plates. Bacterial colonies were selected and the plasmids purified using the mini-prep plasmid purification kit (Qiagen). Selected cDNA clones were commercially sequenced by Genewiz (South Plainfield, NJ, USA) and results were analyzed using BioEdit (Version 7.0.5.3) and sequences aligned using Clustalw2 (see text footnote 2) (Figure S2B in Supplementary Material). The primers occasionally amplified a secondary SRCR a1 domain as well as the targeted one, determined by cloning and sequencing the amplicons. We tested for and found no off-target detection with the TaqMan assays (Table 2) when using previously generated constructs of WC1 SRCR a1-domain-coding sequences cloned into the pSecTag2 vector (23) as templates (WC1-pST2A). Thus, we interpreted this to mean that the FAM probe corrects any spurious transcript amplification by the primers. For generating standard curves, WC1-pST2A plasmids were diluted to equal concentrations by spectrophotometric quantification; primers to the vector backbone and qPCR were used to confirm the concentration of the constructs. TRDC amplified from PBMC was cloned into pCR2.1 and used to generate a standard curve.
Statistics
Pearson’s r correlation was used to determine the relationship between the number of WC1 genes transcribed and the moles of either TRDC or WC1 gene transcripts measured. Student’s t-test was used to determine significant differences in the proportion of cells in the WC1 subpopulations with transcripts for WC1 genes whose products bind Leptospira.
Results
Derivation and Analysis of WC1+ γδ T Cell Lines and Clones
While previous studies indicated that bulk γδ T cell subpopulations can express more than one WC1 gene (9, 24), expression of WC1 genes by individual γδ T cells has been largely undefined. To fill this gap, we evaluated WC1 gene transcription by clones of WC1+ γδ T cells using a customized TaqMan assay system. Due to a high degree of sequence similarity among WC1 genes (Figure S1 in Supplementary Material), a number of experiments were performed to validate the specificity of the TaqMan assays (see M&M: Table 2; Figure S2 in Supplementary Material) and differences in efficiency (Ct values using the plasmids with cloned WC1 SRCR a1 domains ranged from Ct 26 to 33 when equal concentrations of template were used) were compensated for by constructing standard curves (Figure 1); the difference in efficiency was accepted as a necessary compromise to maintain the ability of the TaqMan assays to distinguish among WC1 transcripts. Bulk cell lines were generated from which to derive γδ T cell clones using a mixture of Leptospira and cytokine cocktail stimulations. γδ T cells in PBMC from Leptospira-vaccinated animals but not unvaccinated animals (6) are known from our previous studies to have recall responses in vitro (27). We evaluated the γδ T cells in the expansion cultures with Leptospira for changes in expression of memory markers as we have shown previously these differ from the expression by naïve cells from unvaccinated cattle (27). An increase in CD44 and decrease in CD62L was seen in the initial round of stimulation using a protocol to generate bovine TCM cells (28) (Figure 2, day 0–day 12). There was an even greater increase in CD44 expression and decrease in CD62L by day 21 (Figure 2) when the dividing cells were sorted for T cell cloning (a time when the cells would be ready to respond to a new round of stimulation). Variations in the cloning protocol after day 14 were tried with a total of four distinct strategies and included sorting populations of dividing cells to enhance the chance of clonal diversity (Table S1 in Supplementary Material). Clones were generated from 12 cycles of expansion (Table S1 in Supplementary Material) with purity of all the flow cytometry sorts ranging from 87.9 to 99.3% (Figure S3 and Table S1 in Supplementary Material). WC1.1+ and WC1.1+/WC1.3+ sorted cells were cultured with IL-2 and Leptospira (Table S1 in Supplementary Material, Strategy 3) since we knew that some WC1.1+ (7) and WC1.3+ cells (Chen C and Baldwin CL, unpublished data) from vaccinated animals are Leptospira responsive. Clones from these sorted populations that were expanded by re-stimulation with Leptospira grew more efficiently than those without. To obtain WC1.2+ clones IL-2 alone or in combination with IL-15 with or without IL-18 was used, since IL-15 is known to stimulate γδ T cells (30, 31). In total, we generated 78 clones (Table 3). The cloning efficiency of each cycle showed that the probability that any individual T cell line was actually a clonal population was 96–99% based on the maximum likelihood method of de St Groth [Table S2 in Supplementary Material; (29)].
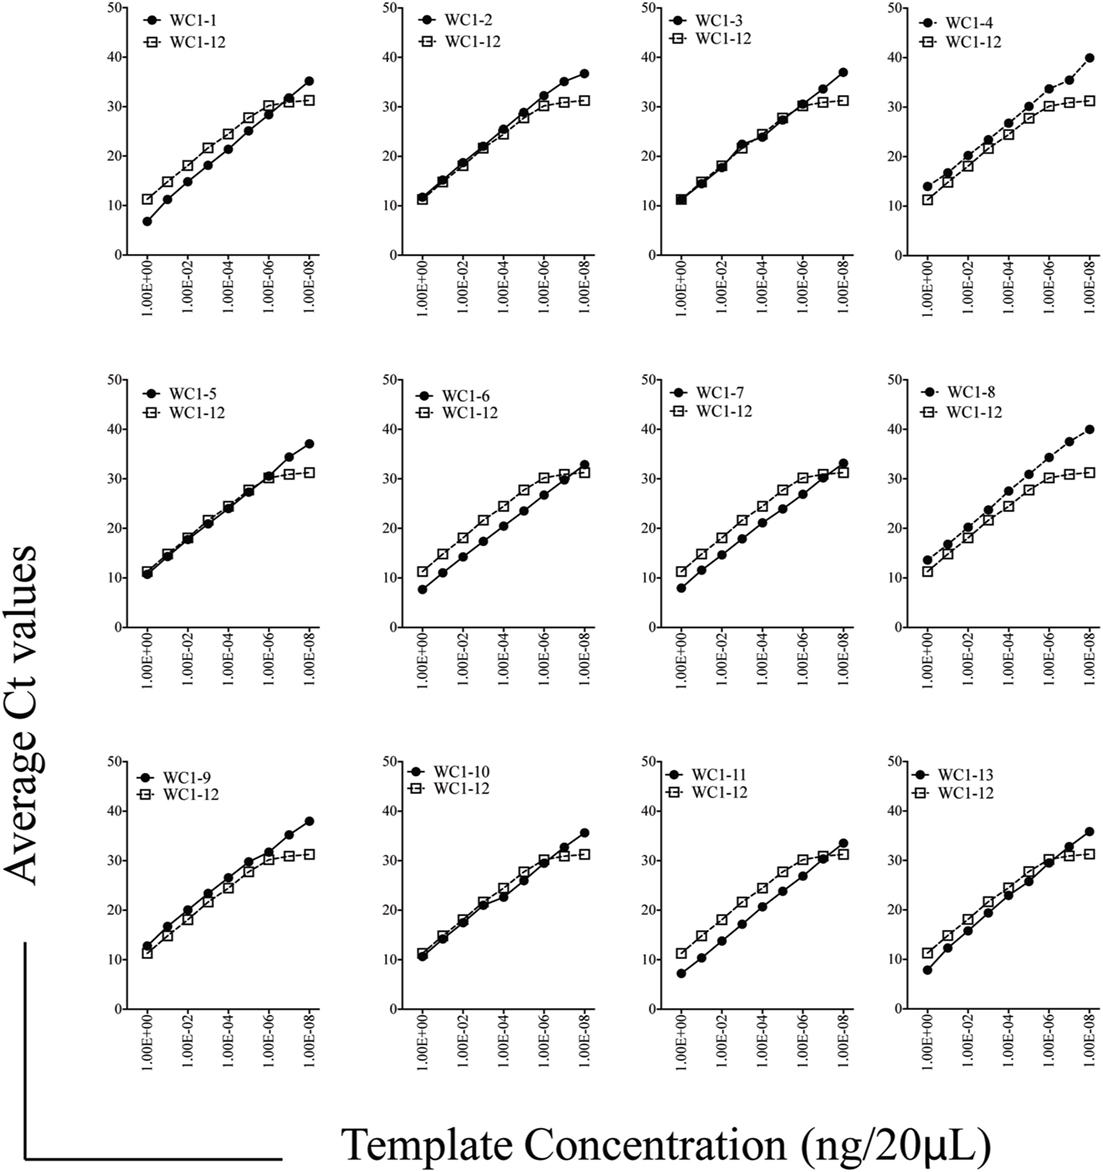
Figure 1. Efficiency of Taqman assays for WC1 transcripts. Standard curves for individual WC1 genes’ scavenger receptor cysteine rich a1 domains were amplified and detected with the Taqman primer/probe assays using serially diluted pST2a-WC1 templates. In each case, WC1-12 efficiency is shown as a benchmark.
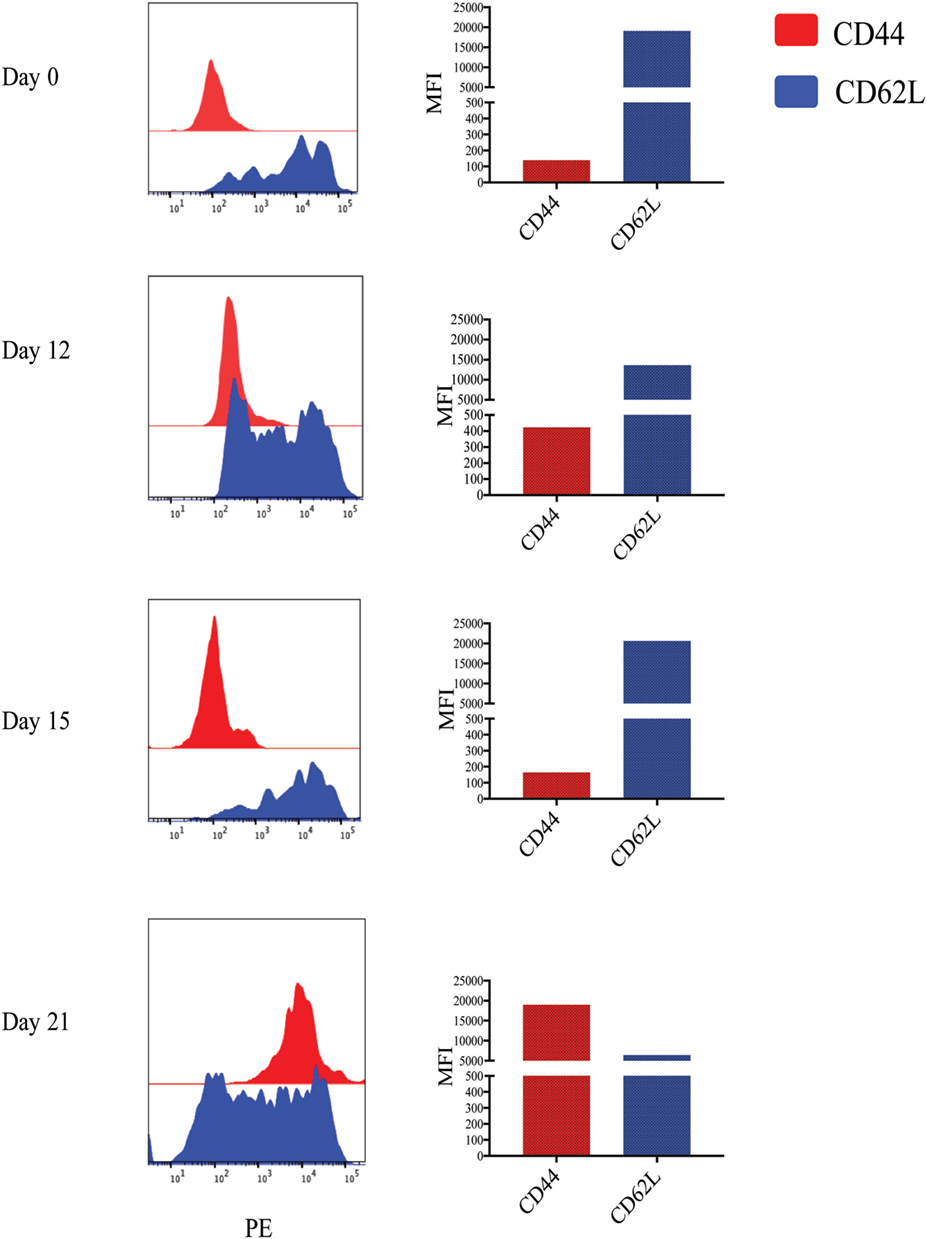
Figure 2. Memory markers of Leptospira stimulated cultures. Cultures of peripheral blood mononuclear cells from a vaccinated animal subjected to the TCM and TEM protocol and cells stained for T cell receptor (TCR)δ with monoclonal antibody (mAb) GB21A (FITC) at the times indicated. The TCRδ+ cells were flow cytometrically gated on mAb GB21A+ and evaluated for their surface marker expression of either CD44 or CD62L (PE) by two-color immunofluorescence shown as histograms. The mean fluorescence intensity (MFI) is shown in the bar graphs.
Variegated WC1 Gene Transcription by γδ T Cell Clones
Analysis of the gene transcription by the γδ T cell clones showed the number of WC1 genes transcribed per clone varied and that many more combinations occurred than expected (Table 3). If the mean and SE was at zero, the gene was not included in the tally of transcription since this indicated it was not measurable in all replicate samples. T cell clones expressing only 1–3 WC1 genes accounted for ~75% of all γδ T cell clones (Figure 3) with 8 of the 13 WC1 genes found to be transcribed alone in individual clones. The consistency of transcription over time for sample clones was evaluated (Figure 4) and showed that while the magnitude of transcription was not identical (e.g., see Clone 6: at Wk 0 WC1-1 has the greatest level of transcription while at Wk4 WC1-4 did) the transcription of specific genes was generally consistent. While cDNA preparations from clones had different molar concentrations of transcripts for WC1 genes and TRDC (shown for representative clones in Figure S4 in Supplementary Material), neither correlated with the number of different WC1 gene transcripts detected (Pearson’s r correlations were 0.01662 and 0.00016, respectively). While evaluation of all putative clones showed that the frequency that had transcripts from five or six different WC1 genes was low (11% of the colonies) (Figure 5), based on the prediction that only 1–4% of the colonies that arose are not clonal populations using the maximum likelihood method (29) then at least some of the colonies transcribing five or six different WC1 genes would be expected to have been derived from a single cell.
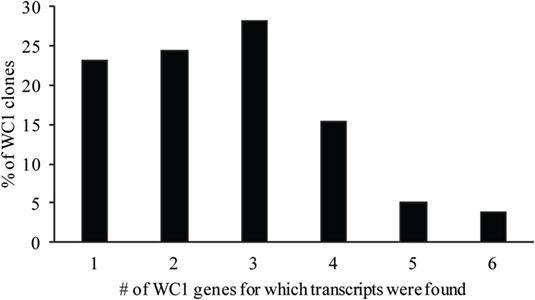
Figure 3. Percentage of WC1 transcripts expressed per γδ T cell clone. The percentage of clones with a particular number of different WC1 gene transcripts is shown.
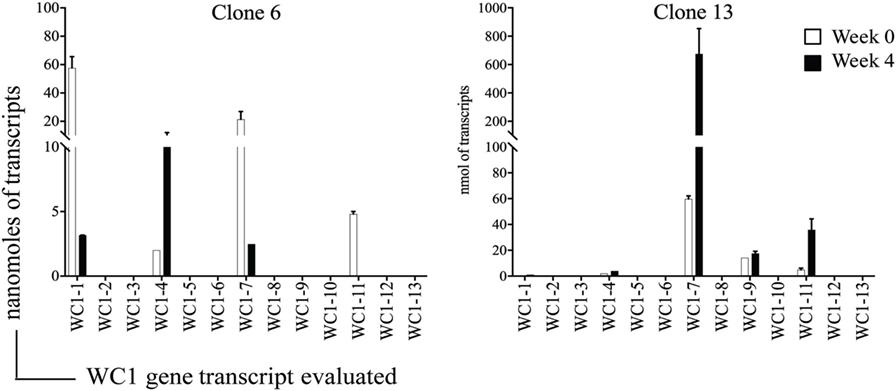
Figure 4. Time-course evaluation of WC1 gene transcription. Evaluation of WC1 gene transcription by selected clones at two different time-points 4 weeks apart are shown. Filled bars show earlier time point and open bars the later. Transcripts are represented as moles of the mean ± SE of replicates. This was done three times with triplicate samples.
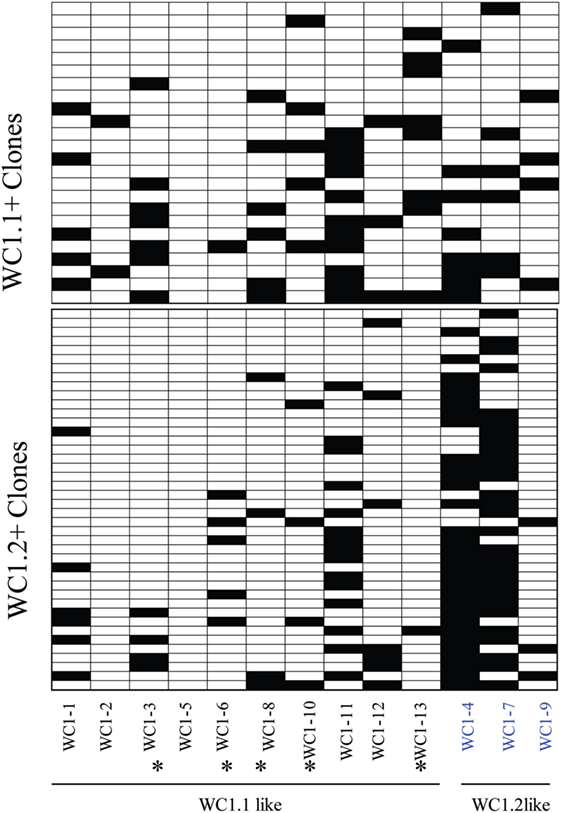
Figure 5. WC1 gene transcripts associated with individual WC1.1+ or WC1.2+ clones. The various combinations of WC1 gene transcripts are shown for clones derived by flow cytometrically sorted cell subpopulations in a heat map. * = WC1 gene products that bind Leptospira.
Previous analyses of bulk-sorted WC1+ subpopulations indicated that the WC1 genes with the highest levels of transcription differed between the WC1.1 and WC1.2 subpopulations (9, 24). Here, we found the transcription of WC1 genes overlapped among clones from the two subpopulations (Figure 5) but when just the gene with the highest WC1 transcript level for each T cell clone was considered and re-aggregated (Figure 6A) the pattern of relative transcription was generally similar to what we reported for bulk-sorted subpopulations previously. The diversity index also showed that there are differences in WC1 gene transcription between WC1.1 and WC1.2 clones (Figure 6B). Nevertheless, unexpected combinations of transcripts were found together, although the archetypal genes for the WC1.1 and WC1.2 subpopulations (WC1-3 and WC1-4, respectively) were only detected together in cell lines that had transcripts for four or more WC1 genes (Table 3). The infrequent occurrence of this phenomenon considering all 78 clones evaluated largely supports our previous findings that WC1.1 and WC1.2 are the two foundational sub-lineages of WC1+ γδ T cells expressing an array of WC1 genes that enable them to respond to specific pathogens differently.
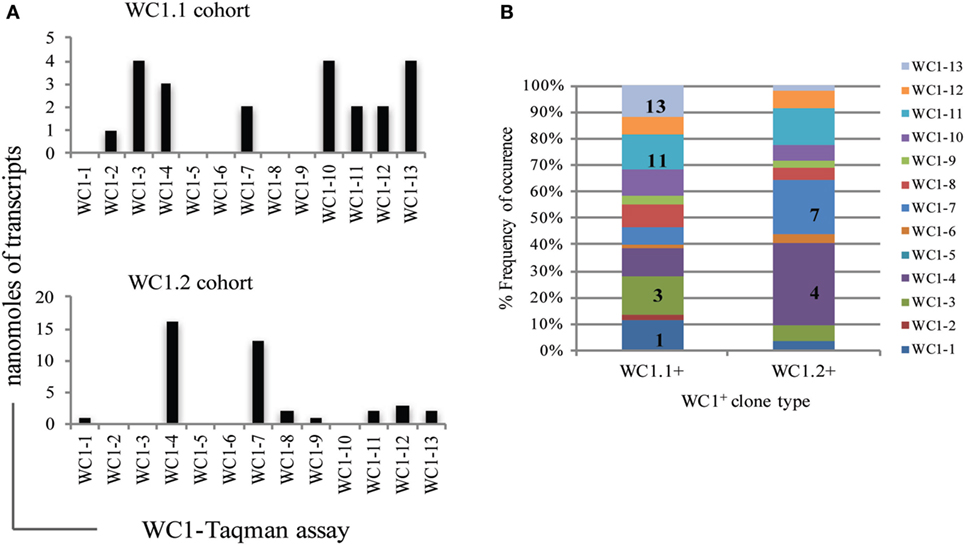
Figure 6. Diversity index of individual WC1 gene transcription by γδ T cell clones in each WC1 cohort. (A) For each clone the predominately expressed WC1 gene, based on highest mean transcript level, was noted and the total number of times a WC1 gene was the predominant is plotted. (B) Diversity index shows the percentage of times transcripts for the WC1 genes occurred in a cohort of clones (y-axis). WC1 genes most frequently transcribed within the repertoire of WC1 transcripts is indicated as a number x (e.g., WC1-x) in appropriate boxes to add emphasis.
WC1 Gene Transcript by Pathogen-Specific Memory γδ T Cells
A proportion of the cells in the WC1.1+ subpopulation of γδ T cells from animals that have been primed by vaccination specifically proliferate and produce IFNγ in response to stimulation with Leptospira in recall assays indicating their role as adaptive-like memory lymphocytes (27). In contrast, many fewer in the WC1.2+ subpopulation do so. Based on these observations, we sought to determine if the WC1 gene transcription was different among clones that responded to Leptospira (WC1.1 cohort) compared with those that generally did not (WC1.2 cohort) since we have shown previously that 5 of the 13 bovine WC1 molecules have SRCR domains that directly bind Leptospira (i.e., WC1-3, WC1-6, WC1-8, WC1-10, and WC1-13) (23). Since antibody-mediated co-ligation of WC1 and TCR/CD3 results in augmented proliferation and IFNγ production, it suggests that pathogen-mediated co-ligation of WC1 and TCR/CD3 would also and thus that WC1 expression and pathogen binding specificity would influence γδ T cell responsiveness (24, 25, 32). 80% of the WC1.1 cohort of clones that were generated with cells from a primed animal and continually cultured with Leptospira had transcripts for at least one WC1 gene that had a binding domain for Leptospira (Figure 5). Clones from the WC1.2 cohort were necessarily developed with cytokine stimulation here and only 37% of those clones had transcripts coding for WC1 molecules with a binding domain for Leptospira. This was significantly different (p < 0.008). The observation that some WC1.2+ cells do have transcripts for Leptospira-binding WC1 molecules is consistent with the minor population of WC1.2+ γδ T cells that have been found to respond to Leptospira stimulation (7) and that would be preferentially expanded under these conditions given the initial culture was with Leptospira.
Discussion
We previously hypothesized that within the WC1.1+ and WC1.2+ subpopulations there would be set WC1 gene programming that broke down these cohorts into even smaller populations. This was rejected based on the results here because few clones had the same pattern of WC1 gene transcription. This mix of patterns occurred even though all the clones were derived from a single animal. We would expect similar complex patterns in other animals since unlike the gene numbers for Ly49 and KIR (other multigenic arrays of immune system cell receptors) that are highly variable among the genomes of mouse strains (33) and humans (34), respectively, the WC1 family is highly conserved with regard to gene number and sequence among cattle breeds including for Bos taurus and Bos indicus (3, 26). Although the gene transcription and presumably expression of the WC1 multigenic array was more complex and variable than predicted it is similar to the 30 different Ly49 patterns seen for 62 clones of murine NK cells (35) and agrees with TLR gene expression by human and murine CD4 and CD8 T cells which ranges from four to seven TLR [reviewed in Ref. (36)] and with transcription of one to eight KIR family genes by human NK clones (37). However, for NK cells the number of different KIR genes transcribed/cell is normally distributed (37) while our results indicated transcription of fewer WC1 genes per cell is favored.
Variegated gene expression of immune cell receptors that sense the environment, including KIR, Ly49, and TLR, is common and allows individual cells to detect specific stimuli (38). Some multigenic arrays of PRR such as TLR have some genes constitutively expressed on lymphocytes while expression of other genes is induced in response to environmental cues such as microbes and cytokines (39). In contrast, the WC1 transcription patterns appear to be stable since among animals there is a largely consistent ratio of WC1.1+ and WC1.2+ cells, defined by their WC1 gene expression, that changes according to age (7) and which first appears during thymic development (Damani-Yokota, unpublished data). This is similar to the set proportion of cells expressing specific KIR genes in human or Ly49 genes in mice (40–42). Variegated gene expression of these multigenic arrays has been shown to be controlled by differential methylation of CpG islands around the transcriptional start site (43), by bidirectional promoter switches that are controlled by noncoding RNA (38, 42, 44), and by differences in 5′ upstream regulatory regions (41) which ensure stability of gene expression. Finally, there is precedent for the SRCR receptor transcriptome in a population of immune cells changing in response to bacterial injection into sea urchins (45), suggesting that the clonal expansion of cells with stable expression of SRCR receptors in response to infection is an ancient and conserved mechanism.
The WC1 transcriptome of the two major subpopulations of WC1+ γδ T cells (WC1.1+ and WC1.2+) isolated from either ex vivo PBMC or following culture with antigens have signature WC1 genes dominantly transcribed but they also have lower levels of transcripts for additional WC1 genes (9, 24). These minor transcripts could represent low-level sterile transcription since their gene products were not evident by immunofluorescence. For example, sterile transcripts for TLR are found in CD4 T cells (46). Nevertheless, some of the clones had transcripts that coded for WC1 genes normally expressed by the other cohort that may have arisen from impurities in the flow cytometric sorting process (i.e., WC1.1+ cells in the WC1.2+ sorted population) while others may be cell lines, i.e., not of single cell origin. The presence of two or more clonal populations of cells in a culture could convey a growth advantage to cells including some not activated directly by antigen. These issues are unresolved but would account for only a small percentage of the colonies or cell lines derived since the maximum likelihood method (29) indicates that there is 96–99% probability that they are derived from a single cell.
Our previous studies support a model of γδ T cell activation in which pathogen ligation of the WC1 co-receptors along with the TCR is necessary for optimal cellular responses (32, 47). Moreover, crosslinking of the γδ TCR with WC1s using an mAb that recognizes most WC1 molecules (mAb CC15) has been shown to give a stronger and more amplified signal compared with crosslinking with an mAb that recognizes a specific WC1 molecule within the family of 13 (i.e., WC1-8 by mAb CACT21A) (24). Thus, co-crosslinking of all WC1 molecules on a cell with the γδ TCR by natural ligand binding would be expected to provide an advantage to the cell while multiple different WC1 molecules increase the potential for WC1 molecules to bind more than one ligand of a pathogen. Also expression of WC1 molecules in various combinations could increase the types of pathogens to which an individual cell could respond. Conversely, expression of multiple WC1 genes could decrease avidity for a particular pathogen if some of the WC1 molecules did not bind a ligand on the particular pathogen. We present these alternatives in a model (Figure 7).
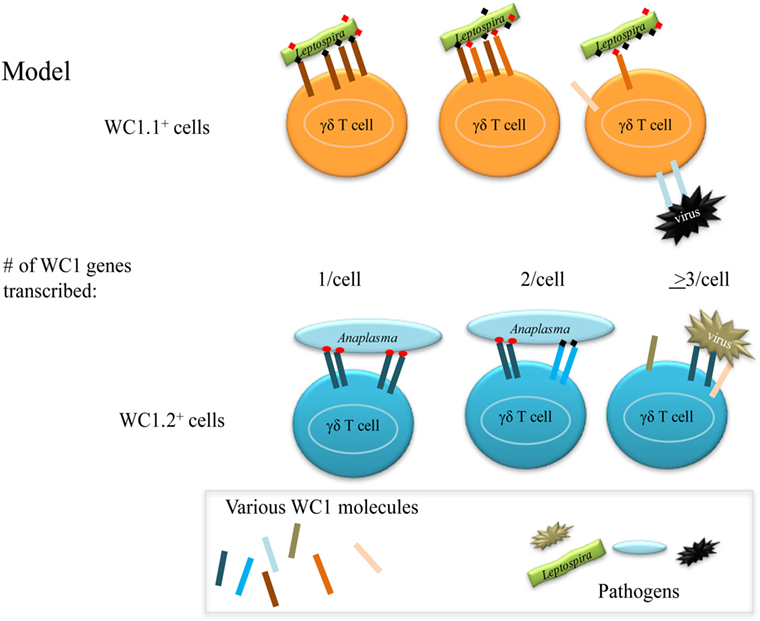
Figure 7. Model for WC1 interaction with pathogens. γδ T cells may express variable numbers of different WC1 molecules thus potentially enabling them to interact with more than one ligand on the same or different pathogens. However, since the number of WC1 co-receptors is necessarily limited on a cell an increase in receptor diversity could affect the avidity of the interaction with any particular ligand.
Since much of our work has used the recall response to Leptospira as the model to elucidate the role of WC1 molecules in directing γδ T cell responses, we framed the results in that context. Our hypothesis that the individual or combination of WC1 molecules being expressed by a γδ T cell contributes to its pathogen responsiveness is supported by our finding that the majority of memory γδ WC1.1+ T cell clones had transcripts for WC1 molecules that bind Leptospira (23). Since we were unable to grow WC1.1+ clones without repeated stimulation with Leptospira, we suggest that the remaining clones that did not express WC1 molecules with known Leptospira-binding domains may have a TCR with higher affinity for the bacteria and thus do not need co-ligation of WC1 for activation. With regard to the WC1.2+ population, it is known to be characterized by dominant transcription of genes WC1-4, WC1-7, and WC1-9, none of which have been found to bind Leptospira (23). However, some WC1.2+ γδ T cell clones had transcripts for WC1 genes whose products bind Leptospira which agrees with the small proportion of WC1.2+ γδ T cells in PBMC that do in fact respond to Leptospira (7).
The cloning system yielded valuable insights into the variegated WC1 gene transcription but the question of how stable WC1 transcriptional programming is established in thymocytes remains unresolved. We are currently investigating differential occupancy of WC1 enhancers in the WC1.1 and WC1.2 loci by transcription factors implicated in γδ T cell development (12) and consequent epigenetic modification of the loci to help resolve this question. It also will be important to characterize the TCR repertoires of those Leptospira-responsive WC1.1+ γδ T cell clones that did not have transcripts for Leptospira-binding WC1 molecules. We predict that the CDR3 repertoires for these cells will be significantly different from those with Leptospira-binding WC1 co-receptors and are the subject of current studies.
Ethics Statement
All animal use was approved by the University of Massachusetts’ Institutional Animal Care and Use Committee.
Author Contributions
PD-Y contributed to the design of experiments, acquisition, analysis, and interpretation of the data and helped draft the manuscript. CB and JT contributed to the conception and design of the research, analysis and interpretation of the data, and drafting the manuscript. All authors critically revised, read and approved the final manuscript, and agreed to be fully accountable for ensuring the integrity and accuracy of the work.
Conflict of Interest Statement
The authors declare that the research was conducted in the absence of any commercial or financial relationships that could be construed as a potential conflict of interest.
Acknowledgments
We thank Dr. Amy Burnside for assistance with the flow cytometry cell sorting in the Institute of Applied Life Sciences at University of Massachusetts Amherst. We thank Alexandria Gillespie and Samuel Black for reading the manuscript.
Funding
This research was supported by grant no. 2011-67015-30736 under NIFA-USDA/NIH “Dual Purpose with Dual Benefit Research in Biomedicine and Agriculture Using Agriculturally Important Domestic Animals” and USDA National Institute for Food and Agriculture grant no. 2017-67015-26631 to Drs. Cynthia L. Baldwin and Janice C. Telfer.
Supplementary Material
The Supplementary Material for this article can be found online at https://www.frontiersin.org/articles/10.3389/fimmu.2018.00717/full#supplementary-material.
Figure S1. Sequence alignment of bovine WC1 genes. General structure of bovine WC1 molecules is shown for 6 and 11 scavenger receptor cysteine rich (SRCR)-containing molecules along with the transmembrane (TM) and endodomain. Multiple sequence alignment of the deduced amino acids of the SRCR a1 domains (the most membrane distal) of the 13 bovine WC1 molecules using ClustalW with identical amino acids shown as dots and gaps as dashes. Variable regions 1 and 2 (VR1 and VR2, respectively) are marked to show regions of greatest sequence variability among the different WC1 sequences. WC1-4, WC1-7, and WC1-9 are considered WC1.2-type molecules while the rest are WC1.1 based on amino acid deletions or additions at positions 75, 76, and 89.
Figure S2. Establishment of TaqMan primer assays. (A) Evaluation of TaqMan primer amplified PCR products on 2% TAE-agarose gel showing amplicon size ranging from 100 to 200 bp for WC1 transcripts labeled WC1-1 to WC1-13 and other genes as indicated. (B) PCR products were gel-purified and cloned into pCR2.1 and subsequently analyzed with Sanger sequencing. Multiple sequence alignment using BioEdit shows nucleotide sequences of TaqMan assay-amplified WC1 genes from cDNA relative to the reference gene sequence found in Genbank (see Table 1 for accession numbers).
Figure S3. Sorting strategy to obtain WC1+ γδ T cell subpopulations for single cell cloning. (A) Single-positive WC1.1+ or WC1.2+ and (B) double positive WC1.1+/WC1.3+ γδ T cells were flow cytometrically analyzed and gates applied. The three gated cell populations were then evaluated for their level of cell division dye and the efluor-670low cells (indicative of multiple cell divisions) were collected as shown. This is representative of multiple flow cytometric sorts.
Figure S4. Representative clones with variable numbers of WC1 gene transcripts. Examples (from the 78 total clones) that had transcripts for one to five WC1 gene transcripts. If the mean was less than 2 and SE was at below zero, the gene was not included in the tally of transcripts in Figures 5 and 6 or Table 3. (A) WC1.1 cohort of γδ T cell clones from monoclonal antibodies (mAb) BAG25A+/CACTB32A− sorted cells expanded using expansion strategy 3 (Leptospira and IL-2) or (B) WC1.2 cohort of γδ T cell clones from mAb BAG25A−/CACTB32A+ sorted cells expanded with IL-2 with or without IL-15 and IL-18 supplementation. Moles of transcripts for each clone (mean ± SE) for WC1 and TRDC (hatched bars) are shown.
Footnotes
- ^https://www.flowjo.com (Accessed: December, 2017).
- ^http://www.ebi.ac.uk/Tools/clustalw2/index.html (Accessed: December, 2017).
References
1. Telfer JC, Baldwin CL. Bovine gamma delta T cells and the function of gamma delta T cell specific WC1 co-receptors. Cell Immunol (2015) 296:76–86. doi:10.1016/j.cellimm.2015.05.003
2. PrabhuDas MR, Baldwin CL, Bollyky PL, Bowdish DME, Drickamer K, Febbraio M, et al. Classification of scavenger receptors and their roles in health and disease. J Immunol (2017) 198:3775–89. doi:10.4049/jimmunol.1700373
3. Herzig CT, Waters RW, Baldwin CL, Telfer JC. Evolution of the CD163 family and its relationship to the bovine gamma delta T cell co-receptor WC1. BMC Evol Biol (2010) 10:181. doi:10.1186/1471-2148-10-181
4. Kisielow J, Kopf M, Karjalainen K. SCART scavenger receptors identify a novel subset of adult gammadelta T cells. J Immunol (2008) 181:1710–6. doi:10.4049/jimmunol.181.3.1710
5. Chen C, Herzig CT, Telfer JC, Baldwin CL. Antigenic basis of diversity in the gammadelta T cell co-receptor WC1 family. Mol Immunol (2009) 46(13):2565–75. doi:10.1016/j.molimm.2009.05.010
6. Naiman BM, Alt D, Bolin CA, Zuerner R, Baldwin CL. Protective killed Leptospira borgpetersenii vaccine induces potent Th1 immunity comprising responses by CD4 and gammadelta T lymphocytes. Infect Immun (2001) 69:7550–8. doi:10.1128/IAI.69.12.7550-7558.2001
7. Rogers AN, Vanburen DG, Hedblom EE, Tilahun ME, Telfer JC, Baldwin CL. Gammadelta T cell function varies with the expressed WC1 coreceptor. J Immunol (2005) 174:3386–93. doi:10.4049/jimmunol.174.6.3386
8. Lahmers KK, Norimine J, Abrahamsen MS, Palmer GH, Brown WC. The CD4+ T cell immunodominant Anaplasma marginale major surface protein 2 stimulates gammadelta T cell clones that express unique T cell receptors. J Leukoc Biol (2005) 77:199–208. doi:10.1189/jlb.0804482
9. McGill JL, Sacco RE, Baldwin CL, Telfer JC, Palmer MV, Waters WR. Specific recognition of mycobacterial protein and peptide antigens by gammadelta T cell subsets following infection with virulent Mycobacterium bovis. J Immunol (2014) 192:2756–69. doi:10.4049/jimmunol.1302567
10. Price S, Davies M, Villarreal-Ramos B, Hope J. Differential distribution of WC1(+) gammadelta TCR(+) T lymphocyte subsets within lymphoid tissues of the head and respiratory tract and effects of intranasal M. bovis BCG vaccination. Vet Immunol Immunopathol (2010) 136:133–7. doi:10.1016/j.vetimm.2010.02.010
11. Hogg AE, Worth A, Beverley P, Howard CJ, Villarreal-Ramos B. The antigen-specific memory CD8+ T-cell response induced by BCG in cattle resides in the CD8+gamma/deltaTCR-CD45RO+ T-cell population. Vaccine (2009) 27:270–9. doi:10.1016/j.vaccine.2008.10.053
12. Munoz-Ruiz M, Sumaria N, Pennington DJ, Silva-Santos B. Thymic determinants of gammadelta T cell differentiation. Trends Immunol (2017) 38:336–44. doi:10.1016/j.it.2017.01.007
13. Lombes A, Durand A, Charvet C, Riviere M, Bonilla N, Auffray C, et al. Adaptive immune-like gamma/delta T lymphocytes share many common features with their alpha/beta T cell counterparts. J Immunol (2015) 195:1449–58. doi:10.4049/jimmunol.1500375
14. Sheridan BS, Pham QM, Lee YT, Cauley LS, Puddington L, Lefrancois L. Oral infection drives a distinct population of intestinal resident memory CD8(+) T cells with enhanced protective function. Immunity (2014) 40:747–57. doi:10.1016/j.immuni.2014.03.007
15. Murphy AG, O’Keeffe KM, Lalor SJ, Maher BM, Mills KH, McLoughlin RM. Staphylococcus aureus infection of mice expands a population of memory gammadelta T cells that are protective against subsequent infection. J Immunol (2014) 192:3697–708. doi:10.4049/jimmunol.1303420
16. Shen Y, Zhou D, Qiu L, Lai X, Simon M, Shen L, et al. Adaptive immune response of Vgamma2Vdelta2+ T cells during mycobacterial infections. Science (2002) 295:2255–8. doi:10.1126/science.1068819
17. Hoft DF, Brown RM, Roodman ST. Bacille Calmette-Guerin vaccination enhances human gamma delta T cell responsiveness to mycobacteria suggestive of a memory-like phenotype. J Immunol (1998) 161:1045–54.
18. Li L, Wu CY. CD4+ CD25+ Treg cells inhibit human memory gammadelta T cells to produce IFN-gamma in response to M tuberculosis antigen ESAT-6. Blood (2008) 111:5629–36. doi:10.1182/blood-2008-02-139899
19. Qin G, Liu Y, Zheng J, Xiang Z, Ng IH, Malik Peiris JS, et al. Phenotypic and functional characterization of human gammadelta T-cell subsets in response to influenza A viruses. J Infect Dis (2012) 205:1646–53. doi:10.1093/infdis/jis253
20. Teirlinck AC, McCall MB, Roestenberg M, Scholzen A, Woestenenk R, de Mast Q, et al. Longevity and composition of cellular immune responses following experimental Plasmodium falciparum malaria infection in humans. PLoS Pathog (2011) 7(12):e1002389. doi:10.1371/journal.ppat.1002389
21. Clevers H, MacHugh ND, Bensaid A, Dunlap S, Baldwin CL, Kaushal A, et al. Identification of a bovine surface antigen uniquely expressed on CD4-CD8- T cell receptor gamma/delta+ T lymphocytes. Eur J Immunol (1990) 20:809–17. doi:10.1002/eji.1830200415
22. Herzig CT, Baldwin CL. Genomic organization and classification of the bovine WC1 genes and expression by peripheral blood gamma delta T cells. BMC Genomics (2009) 10:191. doi:10.1186/1471-2164-10-191
23. Hsu H, Chen C, Nenninger A, Holz L, Baldwin CL, Telfer JC. WC1 is a hybrid gammadelta TCR coreceptor and pattern recognition receptor for pathogenic bacteria. J Immunol (2015) 194:2280–8. doi:10.4049/jimmunol.1402021
24. Chen C, Hsu H, Hudgens E, Telfer JC, Baldwin CL. Signal transduction by different forms of the gammadelta T cell-specific pattern recognition receptor WC1. J Immunol (2014) 193:379–90. doi:10.4049/jimmunol.1400168
25. Wang F, Herzig CT, Chen C, Hsu H, Baldwin CL, Telfer JC. Scavenger receptor WC1 contributes to the gammadelta T cell response to Leptospira. Mol Immunol (2011) 48:801–9. doi:10.1016/j.molimm.2010.12.001
26. Chen C, Herzig CT, Alexander LJ, Keele JW, McDaneld TG, Telfer JC, et al. Gene number determination and genetic polymorphism of the gamma delta T cell co-receptor WC1 genes. BMC Genet (2012) 13:86. doi:10.1186/1471-2156-13-86
27. Blumerman SL, Herzig CT, Baldwin CL. WC1+ gammadelta T cell memory population is induced by killed bacterial vaccine. Eur J Immunol (2007) 37:1204–16. doi:10.1002/eji.200636216
28. Maggioli MF, Palmer MV, Thacker TC, Vordermeier HM, Waters WR. Characterization of effector and memory T cell subsets in the immune response to bovine tuberculosis in cattle. PLoS One (2015) 10(4):e0122571. doi:10.1371/journal.pone.0122571
29. de St Groth F. The evaluation of limiting dilution assays. J Immunol Methods (1982) 49:R11–23. doi:10.1016/0022-1759(82)90269-1
30. Conlon KC, Lugli E, Welles HC, Rosenberg SA, Fojo AT, Morris JC, et al. Redistribution, hyperproliferation, activation of natural killer cells and CD8 T cells, and cytokine production during first-in-human clinical trial of recombinant human interleukin-15 in patients with cancer. J Clin Oncol (2015) 33:74–82. doi:10.1200/JCO.2014.57.3329
31. Van Acker HH, Anguille S, Willemen Y, Van den Bergh JM, Berneman ZN, Lion E, et al. Interleukin-15 enhances the proliferation, stimulatory phenotype, and antitumor effector functions of human gamma delta T cells. J Hematol Oncol (2016) 9:101. doi:10.1186/s13045-016-0329-3
32. Hsu H, Baldwin CL, Telfer JC. The endocytosis and signaling of the gammadelta T cell coreceptor WC1 are regulated by a dileucine motif. J Immunol (2015) 194:2399–406. doi:10.4049/jimmunol.1402020
33. Carlyle JR, Mesci A, Fine JH, Chen P, Belanger S, Tai LH, et al. Evolution of the Ly49 and Nkrp1 recognition systems. Semin Immunol (2008) 20:321–30. doi:10.1016/j.smim.2008.05.004
34. Wilson MJ, Torkar M, Haude A, Milne S, Jones T, Sheer D, et al. Plasticity in the organization and sequences of human KIR/ILT gene families. Proc Natl Acad Sci U S A (2000) 97:4778–83. doi:10.1073/pnas.080588597
35. Kubota A, Kubota S, Lohwasser S, Mager DL, Takei F. Diversity of NK cell receptor repertoire in adult and neonatal mice. J Immunol (1999) 163:212–6.
36. Kabelitz D. Expression and function of toll-like receptors in T lymphocytes. Curr Opin Immunol (2007) 19:39–45. doi:10.1016/j.coi.2006.11.007
37. Valiante NM, Uhrberg M, Shilling HG, Lienert-Weidenbach K, Arnett KL, D’Andrea A, et al. Functionally and structurally distinct NK cell receptor repertoires in the peripheral blood of two human donors. Immunity (1997) 7:739–51. doi:10.1016/S1074-7613(00)80393-3
38. Anderson SK. Transcriptional regulation of NK cell receptors. Curr Top Microbiol Immunol (2006) 298:59–75.
39. Zarember KA, Godowski PJ. Tissue expression of human toll-like receptors and differential regulation of toll-like receptor mRNAs in leukocytes in response to microbes, their products, and cytokines. J Immunol (2002) 168:554–61. doi:10.4049/jimmunol.168.2.554
40. Belanger S, Tai LH, Anderson SK, Makrigiannis AP. Ly49 cluster sequence analysis in a mouse model of diabetes: an expanded repertoire of activating receptors in the NOD genome. Genes Immun (2008) 9:509–21. doi:10.1038/gene.2008.43
41. Takei F, McQueen KL, Maeda M, Wilhelm BT, Lohwasser S, Lian RH, et al. Ly49 and CD94/NKG2: developmentally regulated expression and evolution. Immunol Rev (2001) 181:90–103. doi:10.1034/j.1600-065X.2001.1810107.x
42. Li H, Pascal V, Martin MP, Carrington M, Anderson SK. Genetic control of variegated KIR gene expression: polymorphisms of the bi-directional KIR3DL1 promoter are associated with distinct frequencies of gene expression. PLoS Genet (2008) 4:e1000254. doi:10.1371/journal.pgen.1000254
43. Santourlidis S, Trompeter HI, Weinhold S, Eisermann B, Meyer KL, Wernet P, et al. Crucial role of DNA methylation in determination of clonally distributed killer cell Ig-like receptor expression patterns in NK cells. J Immunol (2002) 169:4253–61. doi:10.4049/jimmunol.169.8.4253
44. Anderson SK. Probabilistic bidirectional promoter switches: noncoding RNA takes control. Mol Ther Nucleic Acids (2014) 3:e191. doi:10.1038/mtna.2014.42
45. Pancer Z. Dynamic expression of multiple scavenger receptor cysteine-rich genes in coelomocytes of the purple sea urchin. Proc Natl Acad Sci U S A (2000) 97:13156–61. doi:10.1073/pnas.230096397
46. Mansson A, Adner M, Cardell LO. Toll-like receptors in cellular subsets of human tonsil T cells: altered expression during recurrent tonsillitis. Respir Res (2006) 7:36. doi:10.1186/1465-9921-7-36
Keywords: γδ T cells, co-receptors, WC1, T cell receptor, pattern recognition receptors
Citation: Damani-Yokota P, Telfer JC and Baldwin CL (2018) Variegated Transcription of the WC1 Hybrid PRR/Co-Receptor Genes by Individual γδ T Cells and Correlation With Pathogen Responsiveness. Front. Immunol. 9:717. doi: 10.3389/fimmu.2018.00717
Received: 13 January 2018; Accepted: 22 March 2018;
Published: 07 May 2018
Edited by:
David Vermijlen, Free University of Brussels, BelgiumReviewed by:
Domenico Mavilio, Università degli Studi di Milano, ItalyBrandon Lee Plattner, University of Guelph, Canada
Copyright: © 2018 Damani-Yokota, Telfer and Baldwin. This is an open-access article distributed under the terms of the Creative Commons Attribution License (CC BY). The use, distribution or reproduction in other forums is permitted, provided the original author(s) and the copyright owner are credited and that the original publication in this journal is cited, in accordance with accepted academic practice. No use, distribution or reproduction is permitted which does not comply with these terms.
*Correspondence: Cynthia L. Baldwin, Y2JhbGR3aW5AdW1hc3MuZWR1
 Payal Damani-Yokota
 Janice C. Telfer
 Cynthia L. Baldwin