 Antoine Costes
 Ferran Argelaguet
 Fabien Danieau
 Philippe Guillotel
 Anatole Lécuyer
95% of researchers rate our articles as excellent or good
Learn more about the work of our research integrity team to safeguard the quality of each article we publish.
Find out more
ORIGINAL RESEARCH article
Front. ICT , 13 February 2019
Sec. Human-Media Interaction
Volume 6 - 2019 | https://doi.org/10.3389/fict.2019.00001
Haptic enhancement of touchscreens usually involves vibrating motors producing limited sensations or custom mechanical actuators that are difficult to disseminate. In this paper, we propose an alternative approach called “Touchy,” where a symbolic cursor is introduced under the user's finger, to evoke various haptic properties through changes in its shape and motion. This novel metaphor enables to address four different perceptual dimensions, namely: hardness, friction, fine roughness, and macro roughness. Our metaphor comes with a set of seven visual effects that we compared with real texture samples within a user study conducted with 14 participants. Taken together our results show that Touchy is able to elicit clear and distinct haptic properties: stiffness, roughness, reliefs, stickiness, and slipperiness.
Enriching touchscreens with haptic content has become an active field called “surface haptics” (Chubb et al., 2010). A large variety of approaches have been proposed to instrument tactile screens with dedicated actuators providing various haptic feedbacks. They stimulate mechanical receptors in the hand to provide compelling haptic sensations like variable friction (Levesque et al., 2011; Mullenbach et al., 2012), relief patterns (Winfield et al., 2007; Kim et al., 2013; Saga and Raskar, 2013), or shape rendering (Jansen, 2010; Kim et al., 2014; Sinclair et al., 2014; Hausberger et al., 2017). However, the custom hardware they involve make them difficult to distribute. Pseudo-haptic feedback is an alternative approach based on the fact that haptic perception can be distorted or even overcome by another modality like vision, and thus not not absolutely depending on a physical actuator (Lecuyer et al., 2000). Most contributions in this field rely on displaying a cursor with an alteration of one of its spatial property, that expresses the simulated haptic feature (Lécuyer, 2009). For instance, stiffness, friction and mass, and surface curvature features can be evoked respectively by changes in shape, speed, and trajectory. Pseudo-haptic principles have been used for various purposes like industrial and medical virtual training (Crison et al., 2005; Bibin et al., 2008; Li et al., 2014), improving GUI performance (Baudisch et al., 2005; Mandryk et al., 2005), or compelling perceptual experiences (Ujitoko et al., 2015).
Pseudo-haptic feedback for touchscreens has also been explored by several authors (see section 2.2), but never in a co-localized manner. Ujitoko et al. (2015) underlined two challenges in applying pseudo-haptic principles to touch interactions: occlusion (the finger touching the screen hides the cursor) and decoupling (altering cursor speed breaks at some point the co-localization, and thus the illusion). Interestingly, most authors kept a cursor similar to the one of a computer mouse, without really discussing its aspect.
In this paper, we introduce “Touchy,” a novel interaction metaphor that expresses a variety of haptic features through the alteration of the motion or the shape of a cursor co-localized with the user's finger. Touchy is able to elicit various texture properties of the underlying content through seven pseudo-haptic effects. Each effect is inspired from physical models that evoke haptic properties like roughness, stiffness, or friction through the vibrations, stretches, dilatations, and compressions of the cursor. As it is purely visual and software-based, Touchy does not require any mechanical actuator, which makes it trivial to integrate on any device with a tactile screen, and especially relevant for handheld devices.
In the remainder of this paper, we present related work on texture perception and pseudo-haptic touchscreen enhancement. Then, the Touchy concept is introduced and the seven pseudo-haptic effects are detailed. Two psychophysical experiments evaluating the ability of our effects to induce specific sensations are presented and discussed. Finally, the paper ends with a general discussion and the concluding remarks.
Manifold studies investigated the dimensionality of real and artificial textures perception (for a review, see Okamoto et al., 2013). If they are generally consistent about the two main features being roughness and stiffness (which definitions are variable though), the rest of their results is quite diversified, without strong contradictions. This can be explained by the fact that these studies vary a lot in terms of stimuli choice, psychological methods, and mathematical methods (Wu et al., 2015). Bergmann Tiest and Kappers (2006) demonstrated that if many studies concluded in a 2- or 3-dimensions model, they were valid only for a quite limited range of materials and that more dimensions were required to describe the diversity of real-world textures. Kajimoto et al. (2004) proposed a taxonomy based on the four types of mechanoreceptors located in the hand: high frequency vibrations for fine roughness, low frequency vibrations for macro roughness, overall pressure for hardness, and lateral forces for friction. They called them “tactile primary colors” to underline the similarity with the 3-dimensional decomposition of color. This 4-dimensional model was confirmed, with an additional thermal dimension, by the remarkable review of Okamoto et al. (2013) who synthesized more than 40 years of research. These four different mechanical stimuli contribute to tactile perception in a complementary manner, but they are extremely challenging to render artificially altogether.
Most of applied research in haptics thus focused on producing one or two of them thanks to large variety of dedicated actuators (for a review in surface haptics, see Chouvardas and Miliou, 2005). However, orthogonal approaches could be considered: what if we can generate rich haptic sensations just through visual effects? As such, pseudo-haptic feedback (Lecuyer et al., 2000) is a good candidate for such endeavor.
Pseudo-haptic feedback was first developed to replace expensive haptic devices with passive ones (Lecuyer et al., 2000). The first contributions mostly relied on modifying the Control / Display ratio of the mouse cursor in order to generate the feeling going through a bump or a hole. Additional works explored other haptic properties such as shape for stiffness, speed for friction or mass, trajectory for slope (for a review, see Lécuyer, 2009). For instance, Lécuyer et al. (2008) compared the choice of modifying the size or the speed of a mouse cursor in order to simulate the reliefs of a texture.
About a decade later, alternative approaches were explored, like simulating stiffness by locally deforming an image being clicked (Argelaguet Sanz et al., 2013) or pressed (Punpongsanon et al., 2015). Fleureau et al. (2016) applied this technique to a digital tablet, with an additional audio feedback to simulate roughness. Nakakoji et al. (2011) proposed a variety of remote tactile interactions built on pseudo-haptic principles. Their interface was split in two parts: one for control (mostly lateral stroke), one for content display. Kokubun et al. (2014) also addressed the problem of occlusion with a separate rear touch interface. Ujitoko et al. (2015) proposed to scroll a background image with various C/D ratio to induce various sliding sensations. Most existing approaches are based on non-colocated interaction (e.g., the user actuates the cursor through a mouse). The only exception is the work of Ujitoko et al. (2015) but only the friction dimension was explored.
The goal of the present work is to provide a unified metaphor able to generate a wide variety of pseudo-haptic effects in a co-located setup (i.e., touch interactions).
Touchy enhances touchscreen interactions without the need of any mechanical actuator, through a variety of pseudo-haptics effects (see Figure 1). When the user touches the screen, a cursor appears under the finger and follows it as it strokes the screen, before disappearing on release. The cursor is a white circle about two times larger than a finger. As the finger hovers an area with haptic content, the cursor's motion and shape are altered in order to express the relevant haptic properties. For instance, the cursor might vibrate according to roughness, or deform according to stickiness (see Figure 2A).
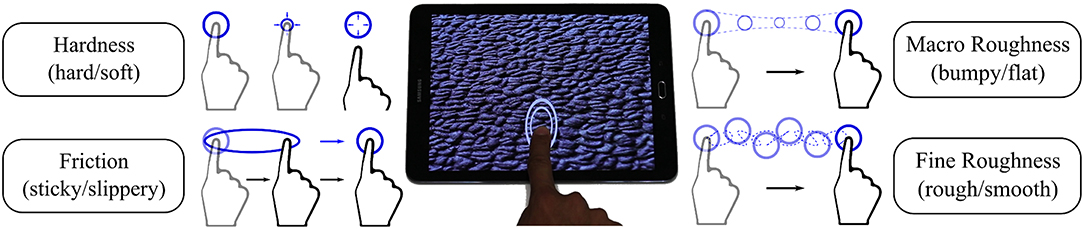
Figure 1. Touchy is a co-localized cursor for tactile displays that deforms and/or moves to evoke a variety of haptic properties, covering four different perceptual dimensions: fine roughness, macro roughness, hardness, and friction.
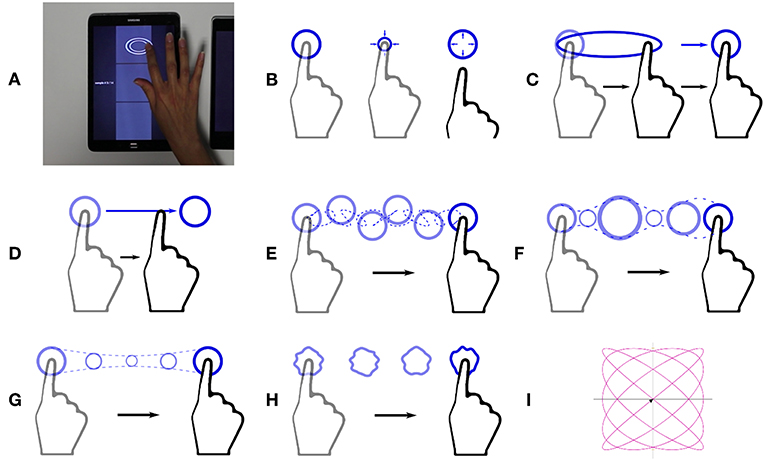
Figure 2. The seven visual effects evaluated in the study. (A) A virtual sample with the Stick effect. (B) The Compress effect evokes softness by shrinking over time. (C) The Stick effect evokes stickiness by deforming on small movements. (D) The Slide effect evokes slipperiness through velocity decoupling. (E) The Displace effect evokes fine roughness through motion vibrations. (F) The Dilate effect evokes fine roughness through size vibrations. (G) The Size effect evokes macro roughness through size changes. (H) The Encase effect evokes macro roughness through 3D shape changes. (I) The vibration pattern used for the Displace Effect.
We showcase seven different pseudo-haptic effects that address five haptic properties: stiffness, (fine) roughness, reliefs, slipperiness, and stickiness.
These five haptic properties are related to the four “tactile primary colors” (Kajimoto et al., 2004) and can be organized along the corresponding perceptual dimensions: hardness, fine roughness, macro roughness, and friction. For more details about these perceptual dimensions, we refer the reader to Okamoto et al. (2013).
In the following section, we describe the design of our effects according to the perceptual dimension it aims to stimulate.
This dimension relates to elasticity, stiffness, softness; that is, the relationship between pressure and deformation. Most touchscreens do not provide a pressure input, however Argelaguet Sanz et al. (2013) suggested to use a simple time-dependent profile as an acceptable approximation. The simulated pressure grows with time until a limit value, and decrease in the same way on release.
The Compress effect (see Figure 2B) relies on this substitution of pressure profile by a time profile. On touch, the cursor appears and immediately shrinks progressively to the target value. On release, the cursor comes back to its initial size before vanishing. The stiffness is represented by the ratio between target and initial cursor sizes.
The Friction dimension proposed by Okamoto et al. (2013) relates mainly to stickiness/slipperiness, and dryness/wetness, although being also correlated with fine roughness. Understanding the physics of friction phenomenons is still an active research topic, as their important number of parameters and non-linearities make them tricky to model in an accurate way. However, some simplistic models like the Coulomb's law have been useful in mechanical engineering for centuries.
The Stick effect (see Figure 2C) simulate dry friction according the Coulomb's law. It reproduces the two regimes of the well-known stick-slip phenomenon. In the sticking regime, the cursor stretch as if one of its extremity was fixed to the start position, while the other one follows the finger. When a given amount of deformation is reached, the effect enters to the sliding regime where the cursor just follows the finger without any alteration. The effect switches back to the sticking regime when the finger velocity drop below a given threshold. The stickiness is represented by the deformation limit between the sticking regime and the sliding regime.
The Slide effect (see Figure 2D) simulate fluid friction and induces a difference between the finger and the cursor speed. The cursor is accelerated proportionally to finger's speed, as long as they are in contact. It is also decelerated by a viscosity force opposed and proportional to its speed. The slipperiness is represented by the C/D ratio between finger speed and cursor acceleration.
In order to handle decoupling issues, the cursor is accelerated by the finger only if they are in contact, which is not intended to last long. Once they are separated, the finger does not act anymore on the cursor. However, as soon as the user releases and touches the screen again, the cursor is back under them finger. Thus, the decoupling sensation remains limited.
Fine roughness is about high frequency geometrical features of a surface, that are too small to be perceived with static contact. When stroking a surface, the vibrations occurring under the finger are the most salient and effective information to evaluate its fine roughness. These vibrations are known to be correlated to user's finger pressure and speed, however only speed responsiveness was found to be necessary for perceptual realism (Culbertson and Kuchenbecker, 2015). If the stroked material features a spatial period, it clearly dominates the vibratory spectrum, although the involved physics are still far from being understood in details (Janko et al., 2016).
These vibrations can thus be represented, as a first approximation, by a single-frequency vibration with a modulation of amplitude and/or frequency according to finger speed. For sake of simplicity, we chose to use finger displacement as phase, multiplied by the wavenumber corresponding to the simulated roughness.
The Dilate effect (see Figure 2F) applies this oscillation to the size of the cursor. When the user strokes the screen, the cursor oscillates in size.
The Displace effect (see Figure 2E), in contrast, applies roughness vibration to position. An 2D oscillatory offset is added to the cursor position to create a visual vibration under the finger. It was given by: f:x → [sin(ωx), sin(0.8ωx)] where x ∈ ℝ is finger displacement and ω ∈ ℝ is the wavenumber (see Figure 2I).
Macro roughness relates to low frequency reliefs. We used relief maps to store the macro roughness information (see Figure 3). A relief map is a monochrome image that gives, for any relative position on the haptic texture, the corresponding relief height.
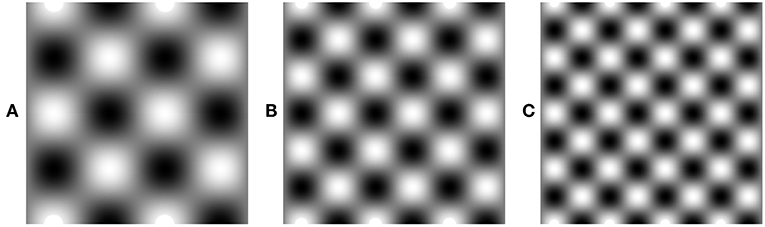
Figure 3. Relief maps used for the Size and the Encase effects. (A) Map for the L1 condition. (B) Map for the L2 condition. (C) Map for the L3 condition.
The Size effect (see Figure 2G) simulates a simple perspective effect by magnifying and diminishing cursor size proportionally to relief height on contact point.
The Encase effect (see Figure 2H), in contrast, takes the area covered by the cursor, reads the values corresponding this whole area in the relief map, and changes the 3D shape of the cursor in order to to reproduce the reliefs around the finger position.
In order to evaluate the ability of our pseudo-haptic effects to induce clear and specific haptic sensations, we designed two user studies.
The first one was intended to validate that our effects were suited for psychophysical evaluation, that is, that a variation of the given haptic property would be perceived as a comparable variation in terms of “overall intensity.” The second one investigated in details the qualitative sensations induced by each effect, by comparison with real material samples organized in a reproducible tactile chart.
Fouteen unpaid volunteers (4 females, age 28–55, mean: 41) took part in the two studies that were performed in a single session of about 45 min. All of them but one reported to be right-handed. Before participating, subjects were given an informed consent form explaining the procedure, detailing confidentiality procedures and stating their right to withdraw at any time without prejudice, in accordance with the Declaration of Helsinki. They were free to ask any questions and get answers before signing and enter into the first study. Since the studies were non invasive, a formal approval from an ethical committee was not required by national guidelines.
Visual content has a significant impact on haptic evaluation. In order to study the ability of Touchy to convey haptic information independently of any visual content, we used a uniform gray image for our virtual samples.
The Touchy effects are inspired from physical models that take one specific haptic property as an input: stiffness, fine roughness, reliefs, stickiness, or slipperiness. Three “levels” (L1, L2, L3 conditions) were defined for each of the seven effects, featuring different values of the simulated property (L1 for low value, L3 for high value). These values were subjectively chosen so that the three levels would be easy to distinguish. The 21 virtual samples were displayed on a digital tablet at the same size than the real samples on the tactile chart (about 5 × 5 cm). For the Size and Encase effects, three different relief maps with 2D sinusoidal profiles, shown in Figure 3. The L1, L2, and L3 conditions corresponded to the respective spatial periods of 2.5, 1.7, and 1.25 cm.
This study aimed to ensure that the perceived intensity of each effect was positively correlated to the three levels we designed, by testing hypothesis H1: the perceived intensity of an effect is stronger for L2 than for L1 and stronger for L3 than for L2.
We grouped our virtual samples by effect to constitute seven trials composed of the three levels of an effect arranged in a random order. During a trial, the three samples were presented simultaneously on a digital tablet. The subject was invited to explore them, then they had to sort them according to their intensity (see Figure 4). The subject was invited to perform a simple movement (touch, stroke, and release over about 2 s) to explore the virtual samples, but was left free otherwise. They were not explicitly informed about the number of effects and presentation logic.
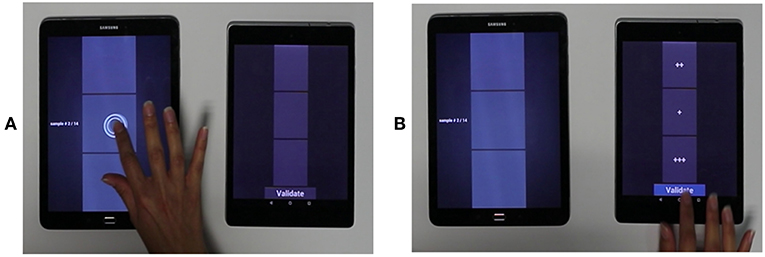
Figure 4. Sorting task between the three levels of each effect. (A) The three levels are explored. (B) The subject sorts them by intensity.
We also expected a learning effect with degraded performances for the first encounters with the effects. In order to take this into account, the whole set of seven trials was performed two times in a row, the first time being considered as a blank test to get familiar with the effects. There was no other repetition.
Table 1 shows the confusion percentage per effect across participants for the sorting task. For all effects except Size, the order was correctly identified in above 70% of the trials, which supports H1.
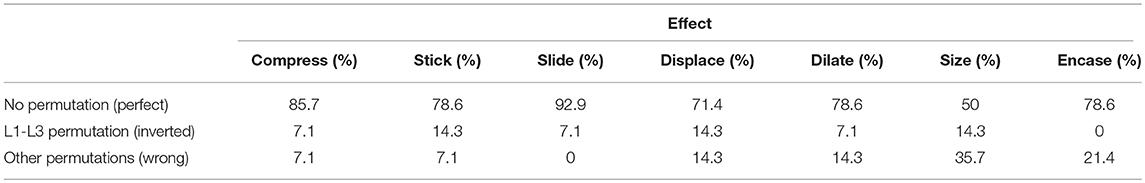
Table 1. Results for the sorting task: percentages of permutation between effects' levels.
For all effects, there was little confusion (14% or less) between L1 and L3. Summing these conditions together, the correct answer rate were of 64.3% for Size, 78.6% for Encase, and above 85% for the five other effects.
Our results support H1 for all effects except Size, which means that the subjects were able to perceive the three levels as three psychophysical intensities, as they were designed to be. Although subjects were let free to decide which stimulus was the “strongest” and which one was “weakest,” they spontaneously chose the expected order in more than seven times over ten. The worse performances were the ones of the Size and the Encase effect, which might be related to the fact that in contrast with other effects, their haptic property was stored in a map. It is likely that the exploratory movement was too quick or not controlled enough for them, as they were less salient than the five other effects that did not rely on a map but on an homogeneous property.
In this second experiment, we wanted to investigate which precise sensations were evoked by each effect. We hypothesized (H2) that each effect would elicit one specific kind of tactile percepts, and therefore that its intensity variations (N, L1–L3) would induce perceptual differences along one dimension only. For example, an increased intensity for the Compress effect will mainly result of an increased haptic sensation of softness, but similar sensations of friction, fine roughness, and macro roughness.
The qualitative evaluation of a haptic effect can be tricky to design. Spontaneous vocabulary is often poor to describe tactile sensations, and the same word can be used to describe features that are perfectly distinguishable (for instance smooth). Moreover, the direct comparison between two pseudo-haptic effects is delicate: the ability to discriminate two visual cues might not be very informative about the actual sensations provided by the two effects. Therefore, we decided to evaluate our effect in comparison with real materials rather than any other virtual stimulus. By doing so, our study focused on the ability for Touchy to provide sensible information about a virtual texture that is comparable to real texture sensations.
The 21 virtual samples described in the first evaluation were used, as well as a “neutral” sample with no effect (N condition): the cursor is displayed and follows the finger without any particular deformation or additional motion.
Besides, we conceived a tactile chart (see Figure 5) adapted from the TouchFeel Box1, which offers a variety of material samples organized by tactile descriptors. The chart was composed of four descriptors:
• Friction: from slippery (1) to sticky (5)
• Hardness: from soft (1) to hard (5)
• Fine roughness: from smooth (1) to rough (5)
• Macro roughness: from flat (1) to densely bumpy (5).
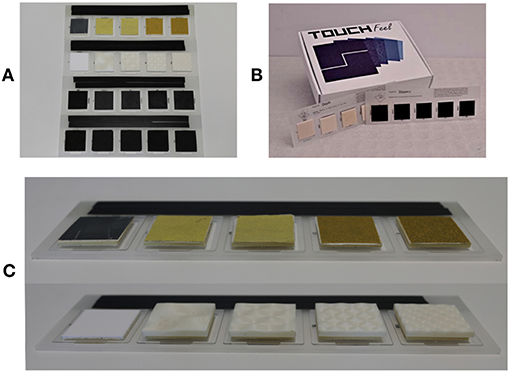
Figure 5. The tactile chart used in the experiment (A) was adapted from The TouchFeel Box (B). Sandpaper pieces and 3D printed relief profiles were used for the fine and macro roughness descriptors (C).
The friction and hardness descriptors were directly taken from the Box (Slippery and Hardness descriptors), as they matched pretty well the considered perceptual dimensions.
The fine and macro roughness descriptors, however, were customized as the closest descriptors in the Box (Roughness and Depth) were found to be non homogeneous and too far from the usual definitions in the literature. Our fine roughness descriptor was composed of five sandpaper pieces with variable grit (80, 180, 255, 360, 800). Our macro roughness descriptor was composed of four 3D-printed 2D-sinusoidal profiles with variable spatial period (5, 2.5, 1.7, 1.25 cm) and an equal maximum slope (that is, the amplitude was inversely proportional to the spatial period). In addition, one flat sample was taken from another descriptor (Braking 0) of the Box in order to get five samples going from flat to densely bumped.
The exploration of the virtual samples was similar to the first evaluation, except that only one virtual sample was presented at a time. Twenty-two different virtual samples were used: the three levels for each of the seven effects, plus the control condition N where the cursor is displayed without any pseudo-haptic modification. The experiment consisted in two randomized blocks of the twenty-two samples: one training block and one performing block. The training block allowed the subject to get familiar with the procedure; only the answer to the performing block were considered.
The subject indicated, for each descriptor of the tactile chart, which descriptor sample was the closest to the effect. The answer was forced, so that the subject had to give the four answers (going from 1 to 5) before passing to the next trial (see Figure 6).
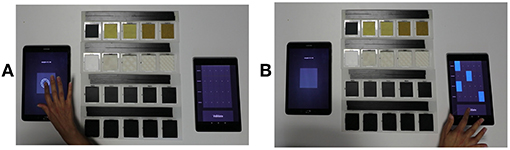
Figure 6. Evaluation of a virtual sample with the tactile chart: The subject explores the sample (A), then situate it on the chart with four answers from 1 to 5 (B).
The answer distributions are shown on Figures 7, 8. Each plot represents the answers given for a particular effect, along the four perceptual dimensions (from 1 to 5). On each plot, the responses given for the control condition N along the four perceptual dimension were added, in order to ease comparison. It is noteworthy that the control condition is the same for all effects.
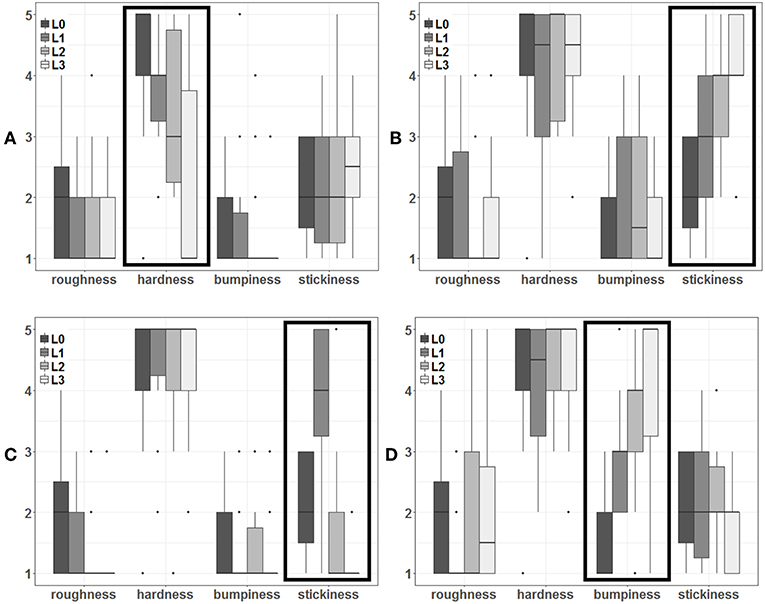
Figure 7. Evaluation distributions according to intensity conditions for the Compress (A), Stick (B), Slide (C), and Displace (D) effects. The frame indicates the perceptual dimension on which significant differences were found between conditions. The dotted frame indicates a perceptual dimension which was expected to be addressed, but did not yield to significant differences.
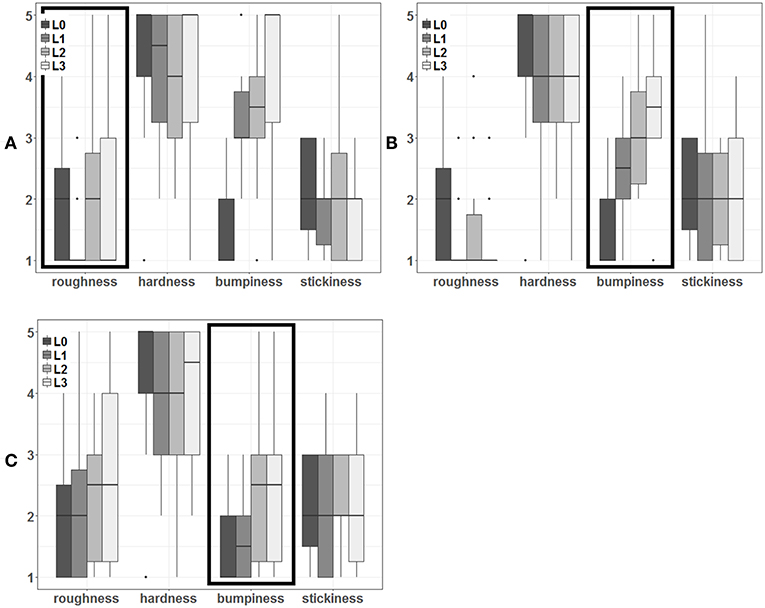
Figure 8. Evaluation distributions according to intensity conditions for the Dilate (A), Size (B), and Encase (C) effect. The frame indicates the perceptual dimension on which significant differences were found between conditions. The dotted frame indicates a perceptual dimension which was expected to be addressed, but did not yield to significant differences.
Statistical analyses were conducted separately for each one of the seven effects and each one of the four perceptual dimensions, that is, 28 analyses were led independently to evaluate the outcomes of each effect on each dimension. In each of those, a non-parametric Friedman ANOVA was performed considering the intensity of the effect as factor (four levels: N, L1, L2, L3). If significant differences between levels were found, a set of pairwise Wilcoxon tests with Holm-Bonferroni correction were performed between the L1, L2, and L3 conditions, as well as between N and the 3 other conditions. The results are summarized in Table 2.
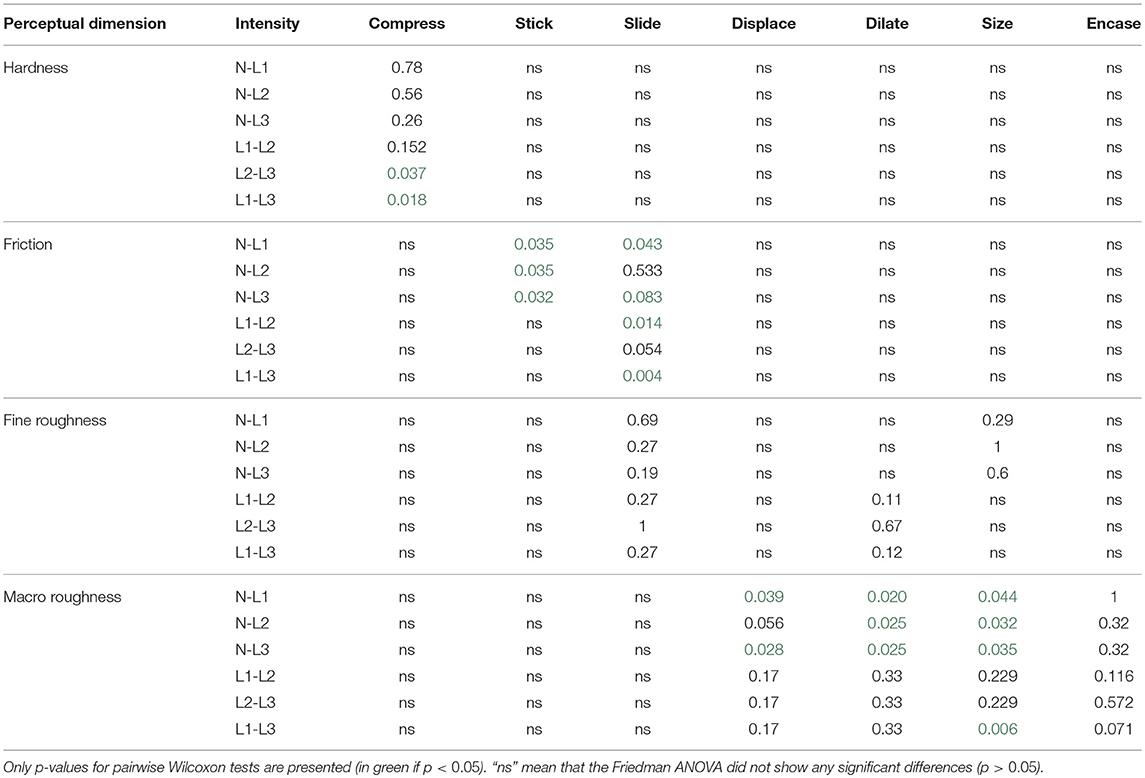
Table 2. Summary of the statistical analysis for the second experiment for each effect and perceptual dimension.
For the Compress, Slide and Size effects, significant differences were found at least between L1 and L3, regarding the perceptual dimension they addressed, and only this one. These results support H2. For the Stick, Slide, and Size effects, significant differences were found between the N condition and at least one other condition, regarding the perceptual dimension they addressed only. These results also support H2, as the effect elicits the right kind of sensations, but they reflect that the intensity range of the effect didn't match well the chart descriptor range.
It is noteworthy that for the Compress and the Slide effects, the average value decreases from L1 to L3. This was expected as the Compress effect simulates softness (as opposed to hardness) and the Slide effect simulates slipperiness (as opposed to stickiness).
The Displace and Dilate effects were found to present significant differences between N and at least two other conditions, but regarding the macro roughness dimension, instead of fine roughness. These results support H2 and show that these two effects were indeed able to evoke relief sensations, but with a perceived frequency lower than expected, resulting in a swap in qualitative judgment.
Finally, the Encase effect did not show any significant difference between condition, although the p-values were very high in all conditions except L1–L3 for macro roughness, which was the expected most favorable comparison. These results do not support H2 for the Encase effect.
Our results suggest that Touchy, through its various effects, is able to efficiently elicit different haptic sensations. The Compress, Stick, Slide, and Size effects were found to address their target perceptual dimension in a significant manner, while they had no effect along the other dimensions.
Regarding the Slide effect, the average stickiness is higher than the control condition under L1, but lower under L2 and L3. This was expected, as the C/D ratio used to accelerate the cursor was below 1 for L1, and above 1 for L2 and L3. Thus, the cursor was slowed down compared to the finger under L1, and it makes sense that it was rated as “more sticky” than the control condition. On the other hand, the cursor's motion was accelerated under L2 and L3, and it makes sense that is was rated as “less sticky.” These results show that our Slide effect is able to simulate a full range between stickiness and slipperiness.
The Displace and Dilate effects were expected to produce fine roughness sensations, but they were perceived as macro roughness effects instead. This can be explained by the fact that for the low level of the effect, the oscillation frequency was very low for slow movements. Also, the oscillation frequency was directly proportional to stroking speed, which was not realistic for low speed. Instead of the frequency, the amplitude could have been modulated by finger speed to give better results while keeping the simplicity of the model. We believe that in this case, we would have obtained significant results on the fine roughness dimension for the Displace and Dilate effect.
The Encase effect was not found to induce significant sensations. This might be explained by the relief maps used as stimuli, which do not represent realistic textures. Additional studies using more realistic maps (representing metallic meshes for instance) should be carried.
In addition to the qualitative evaluation that was conducted in our user study, our effects could be examined quantitatively. The role of each parameter could be studied more in depth, in order to identify its exact impact on haptic sensations. In particular, threshold and just-noticeable-differences could be investigated for every parameter of each effect. Given that each effect is able to simulate one particular haptic property, what range does it cover ? How many different values can be distinctly perceived ? We plan to address these issues in future studies.
Fine roughness is usually defined as what is perceived through the vibrations occurring during a stroke. When the stroked material features a predominant spatial frequency, the vibratory spectrum seems concentrated around a sort of fundamental frequency correlated to both the spatial predominant frequency and the stroking speed. The power spectral density is also correlated to stroking speed. Therefore, this phenomenon can be approximated with a mono-frequency oscillation with only two degrees of freedom: frequency and amplitude. The Displace and Dilate effects are based on this simplified model. We intend to explore the use of more sophisticated models, which might improve effect's quality and specifically elicit fine roughness sensations.
A next step in the exploration of Touchy would be to associate different effects, for instance one affecting the motion and one affecting the shape. Would it be possible to address two different dimensions at the same time independently ? If two different effects addressing the same property are used simultaneously, what is the perceptual result ? These exciting leads are to be investigated in further studies.
Several haptic databases have been made available (Culbertson et al., 2014; Strese et al., 2014) with vibration recordings of a large variety of textures. This data could be used for more sophisticated fine roughness effects. The visual provided in the databases could also be used to study the interaction between visual and pseudo-haptic content and the result of sensory conflicts.
In this paper, we have presented Touchy: a novel interaction metaphor for pseudo-haptics on touchscreens, which addresses the challenges previously identified in the literature. We proposed and implemented a set of seven pseudo-haptic effects, and conducted a user study to investigate the ability or our effects to evoke specific haptic features. All effects but one were found to elicit one particular perceptual dimension: hardness, friction, or macro roughness. Unexpectedly, the two effects addressing fine roughness evoked macro roughness instead. The combination of several effects and the interaction with visual content should be investigated in future work.
Our research center does not have an ethical committee yet, thus we made our best to follow ethical principles and used a preliminary form to ensure free and informed consent from participants. In the two studies we present, participants were first given an informed consent form (provided here as Supplementary Materials), explaining the principles and protocols of the experiment, stating clearly that their participation was entirely voluntary and that they could withdraw at any time without justification, with no prejudice. They had the time to ask whatever questions they had before signing the form and starting the experiment. The two studies consisted in manipulating tactile tablets and did not present particular health risk. Sensitive data (age and gender) were collected on separate, anonymous files. The collected results of the tasks were stored anonymously.
AC, AL, and FA conceptualized the approach and designed the effects. AC implemented the rendering, conducted the study, and drafted the manuscript. AC and FA analyzed the data. All authors approved the final version of the manuscript for submission.
The authors declare that the research was conducted in the absence of any commercial or financial relationships that could be construed as a potential conflict of interest.
The Supplementary Material for this article can be found online at: https://www.frontiersin.org/articles/10.3389/fict.2019.00001/full#supplementary-material
Argelaguet Sanz, F., Gómez Jáuregui, D. A., Marchal, M., and Lécuyer, A. (2013). Elastic images: perceiving local elasticity of images through a novel pseudo-haptic deformation effect. ACM Trans. Appl. Percept. 10, 17:1–17:14.
Baudisch, P., Cutrell, E., Hinckley, K., and Eversole, A. (2005). “Snap-and-go: helping users align objects without the modality of traditional snapping,” in Proceedings of the SIGCHI Conference on Human Factors in Computing Systems, CHI '05 (New York, NY: ACM), 301–310.
Bergmann Tiest, W. M., and Kappers, A. M. (2006). Analysis of haptic perception of materials by multidimensional scaling and physical measurements of roughness and compressibility. Acta Psychol. 121, 1–20. doi: 10.1016/j.actpsy.2005.04.005
Bibin, L., Lécuyer, A., Burkhardt, J.-M., Delbos, A., and Bonnet, M. (2008). “Sailor: a 3-d medical simulator of loco-regional anaesthesia based on desktop virtual reality and pseudo-haptic feedback,” in Proceedings of the 2008 ACM Symposium on Virtual Reality Software and Technology (Bordeaux), 97–100.
Chouvardas, V. G., and Miliou, A. N. (2005). “Tactile displays: a short overview and recent developments,” in Developments, 5th International Conference on Technology and Automation (Thessaloniki), 246–251.
Chubb, E. C., Colgate, J. E., and Peshkin, M. A. (2010). Shiverpad: a glass haptic surface that produces shear force on a bare finger. IEEE Trans. Hapt. 3, 189–198. doi: 10.1109/TOH.2010.7
Crison, F., Lecuyer, A., d'Huart, D. M., Burkhardt, J.-M., Michel, G., and Dautin, J.-L. (2005). “Virtual technical trainer: learning how to use milling machines with multi-sensory feedback in virtual reality,” in Proceedings of VR Virtual Reality, 2005 (Bonn), 139–145.
Culbertson, H., Jose, J., Delgado, L., and Kuchenbecker, K. J. (2014). The Penn Haptic Texture Toolkit for Modeling, Rendering, and Evaluating Haptic Virtual Textures. Departmental Papers (MEAM).
Culbertson, H., and Kuchenbecker, K. J. (2015). “Should haptic texture vibrations respond to user force and speed?,” in World Haptics Conference (WHC) (Evanston, IL), 106–112.
Fleureau, J., Lefevre, Y., Danieau, F., Guillotel, P., and Costes, A. (2016). “Texture rendering on a tactile surface using extended elastic images and example-based audio cues,” in International Conference on Human Haptic Sensing and Touch Enabled Computer Applications (London: Springer).
Hausberger, T., Terzer, M., Enneking, F., Jonas, Z., and Kim, Y. (2017). “Surftics-kinesthetic and tactile feedback on a touchscreen device,” in World Haptics Conference (WHC) (Munich), 472–477.
Janko, M., Primerano, R., and Visell, Y. (2016). On frictional forces between the finger and a textured surface during active touch. IEEE Trans. Haptics 9, 221–232. doi: 10.1109/TOH.2015.2507583
Jansen, Y. (2010). “Mudpad: fluid haptics for multitouch surfaces,” in CHI'10 Extended Abstracts on Human Factors in Computing Systems (Atlanta, GA), 4351–4356.
Kajimoto, H., Kawakami, N., Tachi, S., and Inami, M. (2004). Smarttouch: electric skin to touch the untouchable. IEEE Comput. Graph. Appl. 24, 36–43. doi: 10.1109/MCG.2004.1255807
Kim, S.-C., Han, B.-K., Seo, J., and Kwon, D.-S. (2014). “Haptic interaction with virtual geometry on robotic touch surface,” in SIGGRAPH Asia 2014 Emerging Technologies, SA '14 (Shenzhen), 8:1–8:3.
Kim, S.-C., Israr, A., and Poupyrev, I. (2013). “Tactile rendering of 3d features on touch surfaces,” in Proceedings of the 26th Annual ACM Symposium on User Interface Software and Technology (St. Andrews), 531–538.
Kokubun, A., Ban, Y., Narumi, T., Tanikawa, T., and Hirose, M. (2014). “Representing normal and shearing forces on the mobile device with visuo-haptic interaction and a rear touch interface,” in 2014 IEEE Haptics Symposium (HAPTICS) (Houston, TX), 415–420.
Lécuyer, A. (2009). Simulating haptic feedback using vision: a survey of research and applications of pseudo-haptic feedback. Presence 18, 39–53. doi: 10.1162/pres.18.1.39
Lécuyer, A., Burkhardt, J.-M., and Tan, C.-H. (2008). A study of the modification of the speed and size of the cursor for simulating pseudo-haptic bumps and holes. ACM Trans. Appl. Percept. 5, 14:1–14:21.
Lecuyer, A., Coquillart, S., Kheddar, A., Richard, P., and Coiffet, P. (2000). “Pseudo-haptic feedback: can isometric input devices simulate force feedback?,” in Proceedings IEEE Virtual Reality 2000 (Cat. No.00CB37048), 83–90.
Levesque, V., Oram, L., MacLean, K., Cockburn, A., Marchuk, N. D., Johnson, D., et al. (2011). “Enhancing physicality in touch interaction with programmable friction,” in Proceedings of the SIGCHI Conference on Human Factors in Computing Systems (Vancouver, BC), 2481–2490.
Li, M., Ridzuan, M. B., Sareh, S., Seneviratne, L. D., Dasgupta, P., and Althoefer, K. (2014). Pseudo-haptics for rigid tool/soft surface interaction feedback in virtual environments. Mechatronics 24, 1092–1100. doi: 10.1016/j.mechatronics.2014.07.004
Mandryk, R. L., Rodgers, M. E., and Inkpen, K. M. (2005). “Sticky widgets: pseudo-haptic widget enhancements for multi-monitor displays,” in CHI '05 Extended Abstracts on Human Factors in Computing Systems, CHI EA '05 (New York, NY: ACM), 1621–1624.
Mullenbach, J., Johnson, D., Colgate, J. E., and Peshkin, M. A. (2012). “Activepad surface haptic device,” in Haptics Symposium (HAPTICS) (Vancouver, BC), 407–414.
Nakakoji, K., Yamamoto, Y., Matsubara, N., and Koike, Y. (2011). “Tciex: an environment for designing and experiencing a variety of visuo-haptic sensory conflicts,” in Proceedings of the 3rd IEEE VR2011 Workshop on Perceptual Illusions in Virtual Environments (PIVE 2011) (Singapore), 23–26.
Okamoto, S., Nagano, H., and Yamada, Y. (2013). Psychophysical dimensions of tactile perception of textures. IEEE Trans. Haptics 6, 81–93. doi: 10.1109/TOH.2012.32
Punpongsanon, P., Iwai, D., and Sato, K. (2015). Softar: visually manipulating haptic softness perception in spatial augmented reality. IEEE Trans. Visual. Comput. Graph. 21, 1279–1288. doi: 10.1109/TVCG.2015.2459792
Saga, S., and Raskar, R. (2013). “Simultaneous geometry and texture display based on lateral force for touchscreen,” in World Haptics Conference (WHC) (Daejeon), 437–442.
Sinclair, M., Pahud, M., and Benko, H. (2014). “Touchmover 2.0-3d touchscreen with force feedback and haptic texture,” in Haptics Symposium (HAPTICS) (Houston, TX), 1–6.
Strese, M., Lee, J.-Y., Schuwerk, C., Han, Q., Kim, H.-G., and Steinbach, E. (2014). “A haptic texture database for tool-mediated texture recognition and classification,” in IEEE International Symposium on Haptic, Audio and Visual Environments and Games (HAVE), 2014 (Richardson, TX), 118–123.
Ujitoko, Y., Ban, Y., Narumi, T., Tanikawa, T., Hirota, K., and Hirose, M. (2015). “Yubi-toko: finger walking in snowy scene using pseudo-haptic technique on touchpad,” in SIGGRAPH Asia 2015 Emerging Technologies, SA '15 (New York, NY: ACM), 29:1–29:3.
Winfield, L., Glassmire, J., Colgate, J. E., and Peshkin, M. (2007). “T-pad: tactile pattern display through variable friction reduction,” in EuroHaptics Conference, 2007 and Symposium on Haptic Interfaces for Virtual Environment and Teleoperator Systems. World Haptics 2007, Second Joint (Tsukuba), 421–426.
Keywords: pseudo-haptics, touchscreen, perception, hardness, friction, roughness
Citation: Costes A, Argelaguet F, Danieau F, Guillotel P and Lécuyer A (2019) Touchy : A Visual Approach for Simulating Haptic Effects on Touchscreens. Front. ICT 6:1. doi: 10.3389/fict.2019.00001
Received: 06 July 2018; Accepted: 24 January 2019;
Published: 13 February 2019.
Edited by:
Francesco Ferrise, Polytechnic University of Milan, ItalyReviewed by:
Alan M. Wing, University of Birmingham, United KingdomCopyright © 2019 Costes, Argelaguet, Danieau, Guillotel and Lécuyer. This is an open-access article distributed under the terms of the Creative Commons Attribution License (CC BY). The use, distribution or reproduction in other forums is permitted, provided the original author(s) and the copyright owner(s) are credited and that the original publication in this journal is cited, in accordance with accepted academic practice. No use, distribution or reproduction is permitted which does not comply with these terms.
*Correspondence: Antoine Costes, YW50b2luZS5jb3N0ZXNAZ21haWwuY29t
Disclaimer: All claims expressed in this article are solely those of the authors and do not necessarily represent those of their affiliated organizations, or those of the publisher, the editors and the reviewers. Any product that may be evaluated in this article or claim that may be made by its manufacturer is not guaranteed or endorsed by the publisher.
Research integrity at Frontiers
Learn more about the work of our research integrity team to safeguard the quality of each article we publish.