 Wallace S. Lages
 Doug A. Bowman
- 1Center for Human-Computer Interaction, Virginia Tech, Blacksburg, VA, United States
- 2School of Fine Arts, Universidade Federal de Minas Gerais, Belo Horizonte, Brazil
Physical walking is consistently considered a natural and intuitive way to acquire viewpoints in a virtual environment. However, research findings also show that walking requires cognitive resources. To understand how this tradeoff affects the interaction design for virtual environments; we evaluated the performance of 32 participants, ranging from 18 to 44 years old, in a demanding visual and spatial task. Participants wearing a virtual reality (VR) headset counted features in a complex 3D structure while walking or while using a 3D interaction technique for manipulation. Our results indicate that the relative performance of the interfaces depends on the spatial ability and game experience of the participants. Participants with previous game experience but low spatial ability performed better using the manipulation technique. However, walking enabled higher performance for participants with low spatial ability and without significant game experience. These findings suggest that the optimal design choices for demanding visual tasks in VR should consider both controller experience and the spatial ability of the target users.
Introduction
Physical walking is well established as a simple and natural method for controlling the viewpoint and exploring data in many technological contexts. With large display walls, the user can walk closer to see information in more detail or step back to get an overview of the content. In virtual reality (VR), tracking systems enable users to walk to explore virtual worlds. However, since tracked space is always limited, designers often complement walking with other travel techniques. In mobile augmented reality (AR), physical locomotion is the only mode that will maintain the registration between AR constructs and the world. In addition, since it requires little to no training, walking is always welcome and sometimes preferred to controller-based navigation (Ball et al., 2007). Finally, walking can offer additional benefits, for example, it can improve distance estimation and the spatial sense of location (Ruddle et al., 2011).
Although it seems effortless, it is known that walking requires attentional resources (Lajoie et al., 1993; Yogev-Seligmann et al., 2008). Moving in space also interferes with tasks such as multiple-object tracking in VR and in the real world (Thomas and Seiffert, 2010). Even maintaining body posture can be costly enough to impact performance in memory tasks (Pellecchia, 2003; Riley et al., 2012).
In VR, walking is considered the most natural technique for traveling from one point to another (LaViola et al., 2017). However, in many applications, traveling also supports a different primary task, such as finding a correlation between disparate datasets (Donalek et al., 2014) or building a neurosurgery plan around interweaving blood vessels (Kersten-Oertel et al., 2014). If walking demands cognitive load, limiting the resources available to the user, it may not always be the best interaction choice. A deeper understanding of the issues involved in walking-based interactions can guide designers in the selection between possible alternative techniques.
In this paper, we contribute to a better understanding of the tradeoffs between walking and using controller-based interfaces in VR. While previous work exists regarding the benefits of walking in 3D navigation and also in the use of large 2D displays, little is known about its effect in visually demanding 3D tasks. This category of tasks requires users to understand complex spatial structures, and bears high relevance to scientific visualization and visual analytics in VR. With this in mind, we conducted a study to compare the accuracy of participants in two possible scenarios for an immersive visualization application: walking around the dataset vs. using a 3D interaction technique to manipulate it. Our results indicate that neither technique consistently outperforms the other. Instead, relative performance can be predicted by individual differences in spatial ability and game experience.
To summarize, the contributions of this paper consist of (i) our report on a study directly comparing walking and 3D interaction for a visual analysis task, (ii) a model for user accuracy including game experience and spatial ability, and (iii) our discussion of the implications of these findings in VR interface design.
Background and Related Work
Spatial Ability and Game Experience
Our capacity to perceive, store, and transform spatial data (spatial ability), is generally understood as composed by different factors (Carroll, 1974; Velez et al., 2005). Those factors have been assessed using psychometric tests (Carroll, 1974; Kirby and Boulter, 1999; Hogan, 2012) and also through real-world tasks like navigating in a maze (Moffat et al., 1998), remembering the position of objects in space (Piper et al., 2011), and identifying objects from projections (Kirby and Boulter, 1999). However, due to the complex and still ill-understood mechanisms involved, spatial ability factors resist a definitive categorization. Carroll (1974), for example, defines the spatial orientation factor (SO) as the ability to rotate a representation mentally, and spatial visualization (Vz) as the ability to perform the same process in combination with serial operations. On the other hand, evidence has shown that although apparently symmetrical, the ability to rotate an object mentally and to imagine oneself looking from a different perspective, might involve two different spatial abilities (Kozhevnikov and Hegarty, 2001).
People demonstrate different performance in spatial ability tasks (Wolbers and Hegarty, 2010; Mazman and Altun, 2013). This difference can be attributed to any of the mental process involved in the acquisition of visual cues, forming spatial representations, or manipulating them (Wolbers and Hegarty, 2010). One question of interest is if differences in spatial abilities can be attributed to gender. Billen (2001) found no difference on mental rotation accuracy between males and females. However, results indicated that females were faster. Piper et al. (2011) found that males were better in a spatial memory test. Hogan (2012) results using ETS psychometric tests were inconclusive, while Mazman and Altun (2013) found that males were more accurate in a perspective taking test, but found no difference in reaction times.
In a meta-analysis of 81 studies, Linn and Petersen (1985) identified that gender differences tend to favor males in both mental rotation and in spatial perception, but no difference was found in spatial visualization. Another meta-study focusing on tasks such as pointing, wayfinding, sketching, and distance estimations, uncovered mixed results (Coluccia and Louse, 2004). The author's analysis suggests that gender differences in orientation only appear when the task creates a high load of the visuo-spatial working memory (VSWM). Thus, males would perform better in studies with higher demand due to a larger VSWM. Wang and Carr (2014) reached a similar conclusion, and observed that males perform better in tasks that require holistic strategies, and that this could explain better mental rotation results reported in the literature (Levine et al., 2016). Since a more extensive discussion would fall away from the focus of this text, we refer the interested reader to the meta-studies mentioned above.
Another way to look into individual differences in spatial ability is to see whether they are correlated with experience performing similar tasks. Smith and Du'Mont (2009) examined the effect of previous game experience on spatial navigation in virtual environments. Evidence was found that perceived gaming skill and how far participants progress in a First-Person Shooter games were consistent with higher performance on the navigation task. Richardson et al. (2011), also investigated the effect of game experience in the navigation performance, also comparing virtual and real environments. Game experience was positively correlated with performance in desktop and VR, but not in the virtual world. The authors speculate that the use of a joystick in the VR condition, instead of real walking, might have caused that difference. In addition, the lack of correlation in the real environments might be related to the use of different perceptual and cognitive abilities. Some evidence points to the understanding that higher visuo-spatial skills of gamers may be come from the practice (Basak et al., 2008; Murias et al., 2016).
Walking and Data Visualization
One of the first studies looking to contrast walking and other interaction modalities was performed by Chance et al. (1998). They compared three locomotion modes: walking, using a joystick to rotate and translate, and using a joystick to translate while rotating in place. The task required participants (n = 22) to walk through a maze and indicate the direction of objects found along the way when they reached the end. They found that participants in the walking condition demonstrated better direction accuracy than the ones who only used the joystick. Peck et al. (2011) compared redirected walking with walking-in-place and a joystick interface. Participants in the real walking condition traveled shorter distances and were more accurate when pointing directions. The benefits of walking in spatial perception and navigation tasks have also been confirmed by later studies (Ruddle and Lessels, 2009; Frissen et al., 2011; Ruddle et al., 2011).
An important question, though, is whether walking can also produce benefits for tasks that do not directly involve navigation. Rädle et al. (2013) compared the effect of egocentric body movements in a task involving visual search. The study asked 24 participants to find corresponding pairs among back facing cards by moving toward one card at a time to reveal symbols in them. The authors compared spatial memory and completion time in two conditions: sitting at a desk and moving in front of the display wall with a tablet. They found that walking decreased the task completion time by 34% and found no difference in spatial memory right after the experiment. However, when testing recall after 15 min, they did find an improvement in spatial memory for the walking condition. The results seem to indicate that physical locomotion helped in the recall of item location.
Liu et al. (2014) studied the effect of physical navigation on a classification task. The task required participants to sort labeled disks into different containers on a display. In the first experiment, 12 participants performed the task by walking along a large display wall and then using a pan-and-zoom navigation technique with a mouse and standard monitor. Among other results, they found that physical walking was faster for both easy and hard tasks with small labels. The opposite was true for easy and hard tasks with large labels. However, in the analysis, the authors point out that task difficulty changed the average distance between items and containers, which may have confounded the results. In addition, since two different platforms were used, it is hard to isolate the effect of walking.
Later, Jakobsen and Hornbæk (2015) repeated the classification task conducted by Liu et al. but this time using the same hardware platform for both conditions. Similar to the original experiment, they labeled the disks and containers on the display wall and asked participants to sort them by labels. In the Move condition, participants could move freely in front of the display. In the NoMove condition, participants were contained in a predefined area of 40 cm in front of the display and used a gyroscopic mouse to pan and zoom. The authors did find that although participants (n = 10) were equally fast in tasks which did not require navigation, they were 15% slower when virtual navigation was necessary to read the labels. In both this and the original study by Liu et al., however, the task was not cognitively bounded. The completion time reflects a mixture of the time spent on search, navigation and manipulation. In our case, we used a reasonably difficult task, so that results do depend on how fast participants use the interface.
Büschel et al. (2017) evaluated user strategies in 3D data visualization using a tablet in two conditions: (a) with the view spatially mapped to the device position and, (b) using the touch surface to control an orbiting camera. They found that participants (n = 18) adopted similar strategies in both conditions by moving the camera to appropriate viewpoints. Participants deemed spatial interaction better in terms of subjective feeling of camera control, ability to accomplish the tasks and mental demand. There were no significant differences in error rates and the touch interface was faster for navigation tasks. Unfortunately, the three tasks employed required little cognitive effort, and were completed in less than 2 min.
Motion in Space
Cognition studies in the real world have revealed that vision has a deep connection to motor control and spatial processing. Kerr et al. (1985) report an experiment where spatial memory tasks were disrupted just by asking participants to maintain a difficult standing posture. Participants were asked to perform a memory task while sitting or while standing with the heel of the front foot directly ahead the toes of the back foot. Half of the participants were assigned to spatial memory tasks, while the other half performed non-spatial memory tasks. The authors found that the concurrent balance requirement reduced recall for spatial tasks but not for the non-spatial tasks.
Thomas and Seiffert (2010) studied the effect of self-motion in multiple-object tracking. The task required participants to visually track one or three moving balls in a virtual environment. The authors found that performance was impaired whenever participants moved in space. The effect was present even when participants were moved passively in a wheelchair. Although self-motion interfered with object tracking, no interference was found when participants performed a difficult non-spatial tracking task. They conclude that self-motion uses cognitive resources that could otherwise be allocated to the visual tracking task.
Overall, the literature indicates that walking can be beneficial in search and classification tasks on 2D displays. It also seems to agree that walking can benefit tasks involving spatial abilities such as 3D spatial perception and navigation. An open question is whether these effects can also be observed in other types of tasks. In addition, while some studies have investigated and quantified the interference caused by physical locomotion on other tasks, they have not examined the performance tradeoffs involving the use of walking as an interaction technique. The role of spatial ability and user experience also needs further study.
We were intrigued by the trade-offs between the benefits of walking and the cognitive load induced by walking found in prior studies. An earlier unpublished study run in our lab had also suggested that the choice of walking vs. manipulating a scientific dataset during visual analysis may have impacted users' ability to spatially analyse the data. Therefore, we decided to study how the design choice between walking and manipulation affects the performance in a 3D visualization task. In addition, we decided to investigate the role of individual differences in the results.
Overall Experimental Design
To investigate the possible tradeoffs of walking, we directly compared the performance of participants in two conditions. In the Walking condition, walking was the only way to see different parts of the dataset; in the Non-walking condition, participants would stand still and obtain different views by using a 3D tracked controller to manipulate the dataset.
Dataset and Task
In our experiments, we selected a visualization task that required participants to analyze complex tridimensional models. We were inspired by scientists and practitioners that study 3D datasets derived from Computed Tomography (CT) or Magnetic Resonance Imaging (MRI) of biological structures. The models consisted of a central spherical shape surrounded by tubular branches; a structure similar to one commonly found in the respiratory system of beetles.
The task consisted of verbally reporting if a given model had a specific number of branches connected to the central spherical surface. Instead of using data from a real CT-Scan, we designed a procedural method to generate different versions of the dataset given parameters such as total number of branches, number of connected branches, and number of branch layers. In this way, we could ensure that: (1) there was no ambiguity in the model that would require domain expertise; (2) there was no noise resulting from imperfect segmentation of the original volumetric data; and (3) that we could easily generate datasets with different levels of difficulty.
For the experiments, we generated two different groups of datasets: datasets in the Simple group had 16 branches, of which 4, 5, or 6 could be connected. Datasets in the Complex group had 30 branches, from which 11, 12, or 13 could be connected to the central sphere. For the Simple datasets, participants were asked if the model had 5 connected branches or not. For the Complex datasets, they were asked if the model had 12 connected branches or not. Each group contained an equal number of datasets whose correct answers were yes and no.
The extra (non-connected) branches in each model ensured that participants would need to change the point of view to avoid occlusion. Branch connections were made in the last step of the generation process so that that the number of connections did not change the overall look of the datasets. The synthetic model structure was evaluated by a domain expert to ensure that the model presented similar topology and challenges as the real one. Figure 1 shows an example of each type.
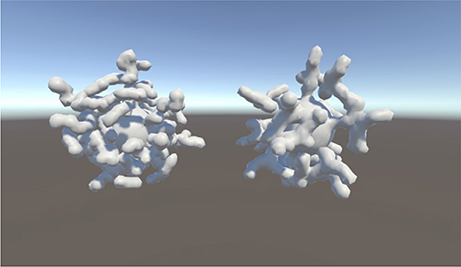
Figure 1. Examples of datasets from the Complex (Left) and Simple (Right) groups.
The final parameters of each dataset were found by trial and error. For the Simple dataset, the goal was to make sure that the task could not be solved by subtizing1 and yet did not present a very hard challenge. For the Complex dataset, we ensured that models were difficult enough to be cognitively bounded (i.e., that the time needed to answer the question correctly depended on cognitive limits rather than perceptual or motor performance). In this way, results would not depend on how fast one could walk around or rotate the dataset, but only on cognitive load.
Environment and Apparatus
The experiments were conducted in a closed room, free of distractions. We used a consumer version HTC Vive head-mounted display (HMD) and the bundled controller. The HMD has two screens, which were adjusted to a typical interpupillary distance (IPD) of 67 mm (we did not adjust the IPD individually for each participant due to mechanical problems with the HMD). Each screen has a resolution of 1080 × 1200 pixels. The horizontal field of view is 110 degrees. The HMD and controller were tracked with six degrees-of-freedom by the hybrid inertial-optical Lighthouse system. To provide freedom to the participants, the HMD was driven in both conditions by an MSI VR One backpack running Windows 10. The backpack is an integrated PC with an Intel quad-core processor, 16Gb of RAM and an nVidia GTX 1060 graphics card. Participants used the trigger button on the controller to switch between datasets and the touchpad button to grab the dataset for manipulation (grabbing was disabled during the walking condition). The software was written in Unity3D and used the SteamVR plugin. The experimenter observed the participants and monitored task execution using a remote desktop access software (TeamViewer).
We wanted to ensure that participants would walk around the dataset in the Walking condition, but we did not want them to have an unfair advantage by going inside the dataset. For this reason, we established maximum and minimum distances that users could be from the dataset. Participants in the Walking condition were free to walk or move in any way desired as long as they stayed within a delimited area. The inner radius of the walking area was 0.6 meters and the outer radius 1.5 m (Figure 2, in green). If participants moved their heads outside this area, the dataset disappeared rapidly to prevent them from obtaining extra information. Participants in the Non-walking condition were asked to choose their preferred distance inside the same area. Note that head tracking was still enabled in the Non-walking condition, but participants were asked to stand in one location.
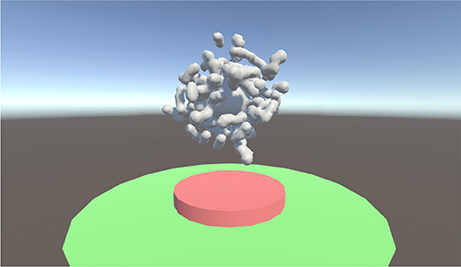
Figure 2. View of the Experimental Environment. The models appeared in the center of the red area. In the Walking condition, participants could move freely inside the green area. The dataset would disappear if users moved outside this area.
Besides the limits of the allowed area, the experimental environment only showed the limits of the tracking area and a blue/brown skybox. To improve visualization, the model had diffuse and direct lighting with self-shadows. However, no shadows were projected on the floor.
Metrics
The time/accuracy tradeoff is common in many experimental designs. If not controlled, it makes analysis and interpretation potentially complex. To avoid this tradeoff (so that our results would not be biased by individual preferences), we adopted the following procedure. Participants were asked to achieve a pre-determined number of correct answers (3 in the first experiment and 4 in the second experiment), and we measured the time they took to achieve this goal. In this way, a participant that was extra careful and spent more time per task would not be penalized when compared to another that was not as careful, but had more errors. This is similar to the metric used in many psychometric tests, and it was not necessary to negatively weight the wrong answers (since we considered the total time spent). Participants used a button on the handheld controller to control the pace of the experiment. The first press would make the dataset appear (and start the timer) and a second press would make it disappear (consequently stopping the timer).
Pilot Study
We ran a pilot study to select a Non-walking technique with good performance to compare with walking. We evaluated two techniques: Rotate and Grab (we also had a Walking condition in this study, but its purpose was only to pilot the procedure for this condition; we do not consider it further in this section).
Rotate Technique
The Rotate technique followed a manipulation metaphor. Participants could rotate the dataset by using the tracked controller as a tangible proxy for the dataset. The controller orientation was mapped to dataset orientation, allowing direct and integral control of all 3 rotational degrees of freedom. The dataset position was fixed in the center of the environment, so participants were free to hold the controller in a comfortable position. We expected that this technique would allow participants to complement the visual information with motor and kinesthetic information from the controller orientation. Clutching was not allowed.
Grab Technique
The Grab technique used a direct manipulation metaphor. Participants could use the controller to directly grab and rotate the dataset around its center. As before, the dataset position was fixed in the center of the environment and only rotated around its center. To rotate, participants could reach to any point in space (not only the points with branches) and grab the dataset by pressing the trigger button. The dataset would then follow the angular rotation of the hand around the center of the model while the button was pressed. Upon release, the dataset would stay at the new orientation. As with the previous technique, Grab allowed an integral control of all 3 rotational degrees of freedom.
Our hypothesis was that Rotate technique would offer better performance than Grab since it was more intuitive, did not require clutching and supported precision two-handed manipulation. An earlier study by Hinckley et al. (1997) supported this hypothesis; where they found that directly rotating an object via a tracked proxy was superior to a mouse-based Virtual Sphere manipulation technique.
Participants
We recruited 12 university students (9 females) from 19 to 32 (M = 24.17, SD = 3.85) years old. All the participants were screened for stereo blindness using a random dot stereogram and had corrected or normal vision. Only four participants had used VR more than twice. The experiment was approved by the Virginia Tech Institutional Review Board and all participants gave written informed consent.
Procedure
Prior to the study participants were asked to fill out a background questionnaire containing questions about age, occupation, handedness, eye correction, VR experience, and computer experience. After that, they were instructed about the experimental procedure, techniques, and experimental environment (including the physical area where the experiment took place). The experimenter then helped the participants to wear the backpack and headset. They were then asked to walk around the experiment area. After this, the experimenter would ask participants to look straight ahead and would use the height of the head, as given by the tracking system, to adjust the height where the models would appear. This ensured that the connection points on the top of the models were always visible and below eye level. Before each condition, the experimenter ran a few practice trials until participants reported being confident with the techniques, the two dataset shapes, and demonstrated to correctly understand the procedure. Between each condition, participants were given the opportunity to stop and rest for a few minutes. In both conditions, the participants were asked to choose a spot within the 0.9 m green band around the center and to stand at that location for the entire set of trials. For each technique, participants were asked to obtain three correct responses with Simple datasets and three correct responses with Complex datasets. The answer was given verbally (yes/no). We did not use a time limit, but asked participants to be as accurate and fast as possible. The presentation order of the two techniques was counterbalanced. In the end, they answered a post-experiment questionnaire, asking about their experience with the techniques and preferences.
Results
Contrary to our expectation, participants using the Rotate technique took longer to complete the task with Complex datasets (M = 580s, SD = 289) than those using the controller with the Grab technique the (M = 360s, SD = 223). Based on a Wilcoxon Signed Rank Test, the difference was significant for the Complex dataset (V = 68, p = 0.021), but not for the Simple dataset (V = 25, p = 0.301) (Wilcoxon Signed Rank Test).
Eleven participants rated the Grab technique as being “easy,” while eight said the same for the Rotate technique. Most participants deemed the Grab technique to be more accurate and the Rotate technique faster. We noticed that most successful strategies consisted of scanning trajectories that lay on the surface of a sphere. The Grab technique allows users to directly “draw” those trajectories. Thus, it provides a better mapping than controlling a surface point based on rotation. The trajectory is also more stable, since the one-to-one mapping in Rotate transforms small angular errors into larger displacements (proportional to the radius of the dataset). Additionally, Grab allows “parking” when the biomechanical limits of the hand are reached, which is not possible with Rotate. Using the latter required participants to keep their hands steady while investigating the dataset. Based on completion time, participant feedback, and the considerations above, we decided to use the Grab technique in the Non-walking condition of our main experiment.
Main Experiment
We ran a within-subjects design comparing walking and Non-walking conditions. We used the same dataset and tasks used in the pilot study (section Dataset and task).
Walking Condition
In this condition, the dataset was fixed in the center of the environment, requiring participants to walk around the dataset to obtain the desired viewpoints. However, the dataset was only visible within a green area defined on floor (Figure 2), preventing participants from walking inside the dataset or moving too far away. The controller was only used to move from one trial to the next.
Non-walking Condition
In the Non-walking condition, the participant would stand still at a chosen spot within the green area and use the controller to rotate the dataset. For this task, we selected the Grab technique, since it produced higher performance than the Rotate technique in pilot study. As before, participants could reach any point in space (not only the points with branches) and grab the dataset by pressing the trigger button. The dataset would then follow the angular rotation of the hand around the center of the model.
As before, we measured the performance for both simple and complex models. We also made sure that both conditions could be easily completed with the simple models. To complete successfully the tasks, participants needed to view the dataset from different sides. However, some viewpoints could only be obtained in the Non-walking condition (e.g., a view perpendicular to the top). We attempted to minimize this disadvantage by adjusting the height of the model based on the height of each participant, so that all connection points could be seen.
We hypothesized that participants in the Walking condition would outperform those in the Non-walking condition. We also expected that users with high spatial ability and more experience with games would perform the task more quickly.
Spatial Ability and Game Experience Measures
We collected data about two other factors that might influence the performance of the participants: spatial ability and game experience. Spatial ability can involve different skills, which can be measured by cognitive tests. Velez et al. (2005) found a positive correlation between accuracy in a visualization task and scores on the ETS (Ekstrom et al., 1976) Cube Comparison (S-2) and Paper Folding (VZ-2) Tests. The S-2 is a test where participants are asked to determine if two cubes are different, based on two different views. It has two sections with 21 questions. The VZ-2 test asks participants to select the correct result after a paper is folded five times and then punched. It consists of two parts with 10 questions. The total score was computed as the number of correct answers minus the number of wrong answers. We administered the first part of S-2 and the full VZ-2 test. The S-2 test was included as a reference, since mental rotation was used as a measure of spatial ability in a variety of earlier studies of interaction in virtual reality (Moffat et al., 1998; Laha et al., 2012; Parsons et al., 2013; Astur et al., 2016; Jang et al., 2016). According to Carroll (1974), both tests involve measuring factors related to the capacity of the visual short term memory (STM). However, the VZ-2 also captures aspects of the central executive involved in performing serial operations, which we noticed was required by our task.
Since one of the conditions required the use of a handheld input device, prior experience could also be relevant. Previous research indicates that game players have a variety of skills such as higher efficiency when switching between tasks (Shawn Green et al., 2012), enhanced attention (Dye et al., 2009), better memory (Boot et al., 2008), and better coordination (Griffith et al., 1983). Prior game experience was self-reported in the background questionnaire. Participants were asked to rate their experience on a 7-point scale ranging from 1 (Never) to 7 (Everyday) to the question: “How often do you play videogames (on computers or consoles like Xbox, Nintendo, etc.)?”
We expected that together, both the visualization score and the game experience variable would capture a large part of the individual differences important for our task. Among them, possible differences in spatial ability due to gender, handedness, and also indirect aspects of playing video game like improved attention and coordination. In addition, to reduce the error variance associated with individual differences not accounted by those covariates, we chose a within-subjects design. The presentation order was counterbalanced to prevent carry-over effects.
Participants
We recruited 37 university students. Five participants were not able to complete the tasks in both conditions in the allotted time and were excluded. The remaining participants' ages ranged from 18 to 44 (M = 26.22, SD = 6.56) years old (6 females). Two-thirds had limited experience with VR (fewer than three prior experiences). All the participants were screened for stereo blindness using a random dot stereogram and had corrected or normal vision. The experiment was approved by the Virginia Tech Institutional Review Board and all participants gave written informed consent.
Procedure
Prior to the experiment, participants were asked to complete the Paper Folding Test (ETS-VZ2), the Cube Rotation Test (ETS-S2), and a background questionnaire with demographic information (age, occupation, handedness, eye correction, VR experience, computer experience) and a specific question about gaming experience. After that, they were instructed about the experimental procedure, techniques, and experimental environment (including the physical area where the experiment took place). To minimize effects of learning, we also briefed the participants on common ways to deal with the complexity of the dataset, as observed from the first experiment. They were: looking for useful reference points to start and stop counting, dividing the dataset into parts, and counting groups of branches together. For each technique, participants were asked to obtain 4 correct responses with Simple datasets and 4 correct responses with Complex datasets. The answer was given verbally (yes/no). Participants were instructed to press the trigger button to stop the timer before answering. To avoid extending the experiment for too long, they were told there would be a time limit to complete the task: 5 min for the simple datasets and 15 min for the complex ones. The experimenter then helped the participants to wear the backpack and the headset. They were asked to walk around the experiment area to familiarize themselves with the space. After this, the experimenter would ask participants to look straight ahead and would use the height of the head, as given by the tracking system, to adjust the height where the models would appear. This ensured that the connection points on the top of the models were always below eye level. Before each condition the experimenter ran at least two trials with each dataset and checked if the participants understood the task and techniques. If they had not demonstrated a correct understanding of the procedure, one or two examples were used for training. The goal of the training was to ensure participants understood the task and were comfortable with the technology. It also helped to level out the participants prior to the beginning of the measured tasks. In the Grab condition, the participants were asked to choose a spot within the 0.9 m green band around the center and to stand at that location for the entire set of trials. Between each condition, participants were given the opportunity to stop and rest for a few minutes. The presentation order of the two techniques was counterbalanced. In the end, they answered a post-experiment questionnaire, asking about their experience with the techniques and preferences.
Results
Before fitting a regression model including the measured covariates, we performed a preliminary analysis of the results. Table 1 lists the descriptive statistics of task completion times. The mean completion time for the Simple dataset was significantly lower than the Complex one, as designed [F(1, 90) = 242, p < 0.0001] and the average completion time for both conditions was similar. A visual analysis, however, revealed that the fastest condition was not the same for every user (Figure 3). This suggested that our sample was composed of subpopulations for which the relative performance in each condition varied. A within-subjects ANOVA for the two conditions, as expected, did not reveal a significant difference between the overall means of the Walking and Non-walking conditions for each dataset.
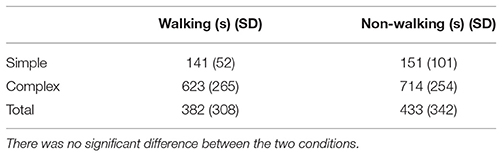
Table 1. Mean times and standard deviations for the main experiment.
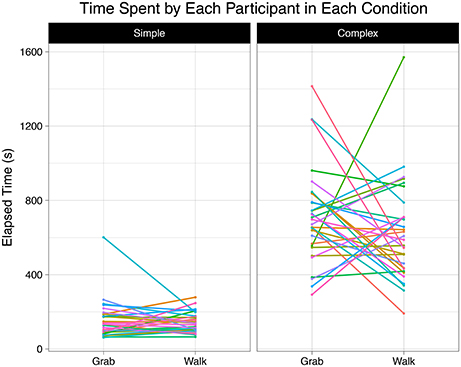
Figure 3. Task completion time for each participant in the two conditions for Simple (Left) and Complex (Right) datasets.
Following our initial hypothesis, we looked into whether prior experience and spatial ability were confounding the effect of the experimental conditions. Figure 4 shows four subsets of the original data for the complex dataset, separated according to whether participants had values higher or lower than the mean in game experience and in the spatial visualization test score (VZ-2).
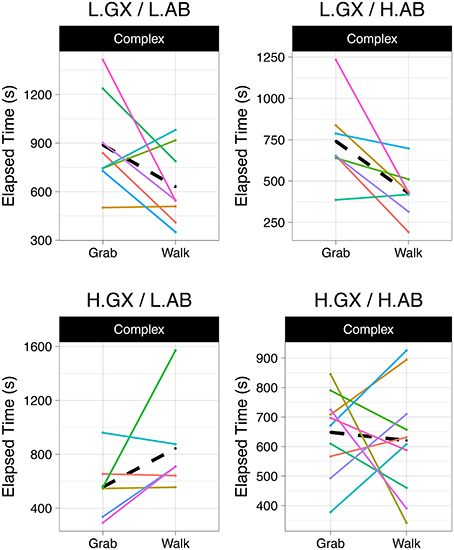
Figure 4. Participants grouped according to high (H) and low (L) scores in game experience (GX) and spatial ability (AB). Dashed lines indicate the mean tendency in the group.
Participants with high game experience and low spatial ability had better performance using the Grab technique (Figure 4, bottom left). Participants with low game experience had better performance with Walking (Figure 4, top). Participants with high game experience and high spatial ability had no clear trend. A similar result appeared when considering the S-2 score in place of VZ-2. In fact, a Spearman's test indicated a moderate positive correlation between the two (ρ = 0.51, p < 9−10). Table 2 lists the distribution of participants according to game experience and spatial ability.
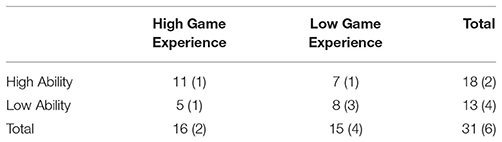
Table 2. Number of participants distributed according to the mean values of spatial ability and game experience (number of females in parenthesis).
Analysis
To analyze the data for statistical significance, we fitted two robust linear regression models: one on the time differences between Walking and Non-walking conditions and another one on walking time. We used a robust regression to avoid arbitrarily removing outliers and to avoid compromising the validity of the results by departures from the ordinary least squares assumptions (Wilcox, 2011). We used the lmrob function from the R Robustbase package (Maechler, 2017), with the default MM-regression estimate.
Our model included main effects and interactions for model complexity, game experience, and spatial ability. We checked for multicollinearity in the model by computing variance inflation factors (VIF) with the package olsrr (all factors were below 1.2). We selected the VZ-2 score as a measure of spatial ability, since it was applied in full and provided slightly higher explanatory power. The score was centralized in the median (Table 3).
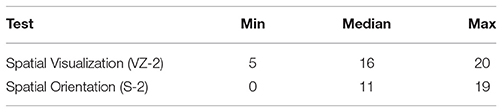
Table 3. Results of the cognitive factors tests: VZ-2 Spatial Visualization Test, S-2 Spatial Orientation Test (N = 31).
We also checked for outliers between the covariates. One observation was excluded based on robust Mahalanobis distance. A Spearman's rank test failed to reject the assumption of zero correlation between the covariates at a 0.05 significance level (p = 0.3179, ρ = 0.09). The full model also had a significantly better fit than incomplete models with only one of the covariates (robust Wald test, p < 0.05). The adjusted R2 for the final time difference model was 0.61, and the residual standard error was 105.6. The adjusted R2 for the walking time model was 0.88, and the residual standard error was 76.5. The significant terms of both models are listed in Tables 4, 5, along with the associated coefficients. Of particular interest are the interactions between spatial ability and game experience.
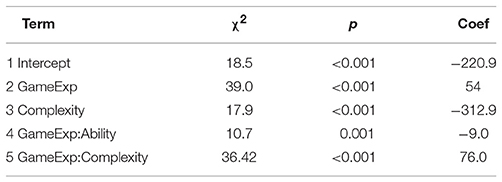
Table 4. Significant effects of the regression model for the time difference between the two conditions.
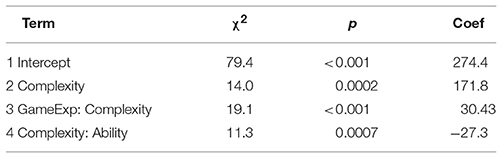
Table 5. Significant effects of the regression model for walking time.
On the time difference model, game experience has a significant positive coefficient (effect 2 in Table 4), indicating that higher levels of game experience decrease the mean completion time when using the Grab technique. The combination of high game experience and the complex dataset also favors the Grab technique (Table 4, effect 5). However, the intercept and complexity have large negative coefficients, implying that Walking is faster overall and faster with the complex dataset across all participants (Table 4, effects 1 and 3). In addition, ability and game experience combined have a negative coefficient, indicating that walking is superior to Grab for participants with higher levels of both. Figure 5 shows the time differences predicted by the model for the Complex dataset2. Points above zero indicate that the Grab technique is faster, while points below indicate that Walking was faster.
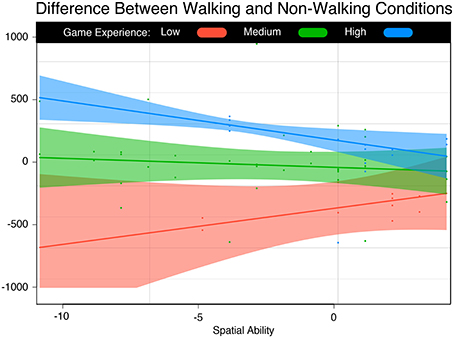
Figure 5. Time Difference Between Walking and Non-walking Conditions. Participants with low spatial ability and game experience performed better walking. Participants with low spatial ability and high game experience performed better with the controller. Users with high spatial ability tend to perform equally on both.
For participants with low game experience, walking is clearly better. However, the difference gets smaller with the increase in spatial ability. For participants with high game experience, the opposite is true: grabbing is advantageous for users with low spatial ability, but the difference reduces with increase in spatial ability. Overall, participants with high spatial ability performed approximately the same with both techniques.
Looking at the absolute time model, we see that time spent during the walking condition increases with complexity (Table 5, effects 2 and 3). However, spatial ability decreases the mean time spent walking by 27 s for each additional point. The total effect is counterbalanced by game experience which lessens the impact of spatial ability. The different resulting slopes are shown in Figure 6.
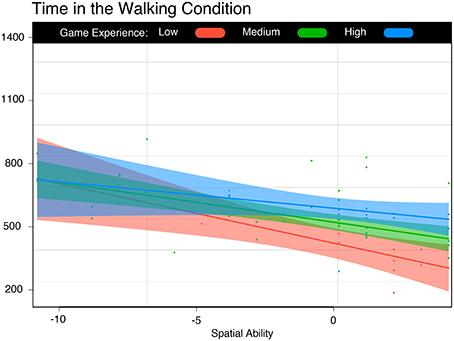
Figure 6. Time in the Walking Condition. Spatial ability improved the time of all participants, regardless of game experience.
When asked to choose between the two conditions, 64% of the participants preferred Walking. We also asked participants if they thought walking helped or interfered with the task. Approximately 80% stated that walking was helpful. When we compared their preference with the performance in both conditions we found that in only 61% of the cases did the condition with the highest performance match their preferences. We also asked participants to rate the two conditions regarding speed, comfort and on how easy it was to obtain the desired viewpoints. There was no clear preference among the participants regarding any of those characteristics.
Discussion
In this experiment, we directly compared the performance of walking and Non-walking techniques in a complex visual analysis task. Among the results, we highlight a few key findings:
1- The relative performance of interfaces based on walking and manipulation depend on individual differences. We found that the differences between Walking and Non-walking conditions can be very large (up to 40%) and that they can be explained by specific combinations of spatial ability and game experience. In some applications, looking at the behavior of specific groups of users instead of the whole population might give a more accurate picture of interface usability.
2- Walking provides significant performance advantages for users with mid/low game experience. Not everyone is acquainted with input devices or possesses the ability to easily control multiple degrees of freedom. For users who did not report practice with games, interfaces based on walking provided better performance.
3- Spatial ability is important to achieve high performance in walking-based interfaces. Spatial ability was positively correlated with faster times in the Walking condition. With high spatial ability, participants walking and grabbing had similar performance. But for users with low spatial ability and high game experience, manipulation was faster than walking.
These findings seem to indicate that, for cognitively difficult tasks, the lack of some abilities interferes with both Walking and Non-walking performance. For the Walking condition, the most important factor is spatial ability, while in the Non-walking condition, game experience is more relevant. However, since users have different abilities, we see individual tradeoffs for each technique.
Walking and Manipulation Abilities
The positive effect of spatial ability on the completion time for the Walking condition (Figure 6) likely reflects a general characteristic of the task. In our experiment, the ability to remember the starting location and the parts of the dataset that had already been counted was clearly important. Although there was no need to explicitly perform mental rotations (as in the S-2 test), higher spatial ability might help to integrate several partial viewpoints (Kozhevnikov and Hegarty, 2001). As the participant's relative position changed, it was critical to correctly differentiate whether a specific branch was a new one or the same one slightly rotated. We also noticed during the interviews, that the ability to unfold the sphere surface, perform serial operations (such as divide the model into sub-areas), and adapt the strategy to each model, was beneficial to completion time. These abilities, in turn, are very similar to the ones measured by the spatial visualization test (VZ-2).
Interestingly, the impact of spatial ability was not equal, and had a more pronounced effect in the Walking condition. One might think that the opposite should be true, since walking happens with no apparent effort, and since high spatial ability seems more useful when the user is facing a harder situation. This apparent incongruence was found in other studies and could be explained by positing that the act of walking consumes finite resources shared by whatever mechanism is responsible for updating a person's position in space (Thomas and Seiffert, 2010).
On the other hand, the benefit of higher game experience in the Non-walking condition seems clear: when users need to spend extra effort to operate the interface, they consume mental resources that could have been used to perform the task. For example, in the Rotate technique used in the pilot study, the tangible representation was spatially disjoint from the visual representation. Some participants found that this was not intuitive and that it was harder than manipulating a real object. Participants with more game experience have been trained to operate non-trivial combinations of input devices and interaction techniques, and therefore have more cognitive capacity available for the spatial task.
We also found that game experience did not significantly affect the mean time in the Walking condition. The lack of any evident impact on walking time indicates that the game experience variable is measuring skills that are distinct from those captured by the spatial ability tests. Among the skills frequently correlated with game experience (task switching, Shawn Green et al., 2012, enhanced attention, Dye et al., 2009, better working and short term memory, Boot et al., 2008, and better coordination, Griffith et al., 1983), hand-eye coordination seems to be only the one not directly related to the central executive and more likely to be developed in players of fast-paced games (Morris and Jones, 1990). Although we did not discriminate the participants by game genre and playing history, the question seemed to be enough to distinguish between players and non-players. In any case, the participants in the “player” group demonstrated superior performance in the Non-walking condition.
Our conclusion is that the mechanisms that influence performance in each condition are distinct, even though they work in concert due to the individual capacities available for each type of interaction. That is not to say that they do not interact with each other, but rather that they are qualitatively distinct. The manipulation interface is more difficult to learn, resulting in cognitive resources being divided between the interface and the task, but users with training can largely avoid this cognitive cost. Walking is an interface that almost everyone can use easily, but it still introduces a penalty on spatial resources that results in lower performance by users with low spatial ability.
Choosing the Appropriate Technique
How should designers approach the tradeoffs between walking-based and manipulation-based interfaces? An easy alternative would be to offer both options and let users choose which technique to use. We found, however, that personal preferences only matched the highest performing technique in 61% of the cases. Carefully characterizing the target user base and considering usage scenarios might be a better option. One way to identify the type of users would be to ask about gaming experience and/or apply spatial ability tests. If there is enough homogeneity, it may be possible to choose the method that offers higher average performance. If users can be trained, have high spatial ability, or are going to use the interface for a long time, it might not be worthwhile to go to the effort of providing a large tracked space for walking.
The decision also depends on the task difficulty. In our study, we were careful to separate the problems into light and heavy cognitive load. Although prior work has shown benefits of physical navigation, those experiments did not typically have very high cognitive load. In those cases, the performance is likely to depend on mobility and dexterity, factors that are less relevant when solving complex problems. The effect of increasing the task complexity is similar to reducing spatial ability: the cost of walking will appear sooner and will be more relevant.
Limitations
The task we studied was relatively straightforward, although cognitively demanding. In our case, the difficulty was mainly caused by the need to mentally keep track of the areas already visited in a complex structure. In real visualization scenarios, similar requirements are likely to appear with the addition of other concurrent demands, such as dealing with the software interface or crafting more sophisticated reasoning about the data. Most useful applications will require more than counting from one to thirteen. It would be interesting to see how more complex tasks and concurrent demands interact with spatial ability and walking.
In addition, it is also reasonable to imagine that walking itself can be challenging in some situations. A user performing a similar task at a construction site would have a much lower walking performance. Our study used a reasonably safe environment, with no distractors beyond the dataset. We expect that in complex tasks like the examples above, walking performance will be further degraded by the extra overhead on spatial cognitive processing. However further studies are needed to examine this hypothesis.
Finally, we have investigated only two of many parameters that might affect performance in visually demanding tasks. Although the model including spatial ability and game experience was able to explain much of the variance, more sophisticated models might be able to better predict the actual performance. For example, spatial memory could explain a higher percentage of the performance variation than VZ-2 test score we employed. We could also have included other covariates such as gender and handedness to further reduce variance. However, additional variables need careful consideration since they would increase the complexity of the model and increase the risk of multicollinearity. Similarly, our assessment of game experience could be improved by applying more practical tests or by using an improved questionnaire gathering details about the genres of games and playing history.
Conclusion
As walking becomes more common in AR an VR interfaces, it is increasingly important to understand the tradeoffs involved in physical locomotion. In particular, it is critical to know when it makes sense to choose walking over a more sophisticated interaction technique. In this paper, we have presented the results of a study evaluating the performance of a complex visual analysis task in two conditions: walking and manipulating. Our analysis revealed that the relative performance on this task is not consistent across individuals and depend on game experience and spatial ability. Our study further shows that walking can enable higher relative performance for users with low spatial ability and low game experience low game experience. However, users with high game experience can perform better with Non-walking interfaces, especially if they lack spatial ability. We discussed our results in the light of previous findings and argued that optimal design decisions for this tradeoff should consider the role of training and individual differences.
Ethics Statement
This study was approved and carried out in accordance with the recommendations of Virginia Tech Institutional Review Board. All subjects gave written informed consent in accordance with the Declaration of Helsinki.
Author Contributions
WL contributed to the experimental design, implementation, conducted the research, performed data analysis, and contributed to the writing. DB contributed to the experimental design, interpretation of the results and writing.
Conflict of Interest Statement
The authors declare that the research was conducted in the absence of any commercial or financial relationships that could be construed as a potential conflict of interest.
Acknowledgments
The authors gratefully acknowledge funding support from the Immersive Sciences program in the Office of Naval Research and from the Brazilian National Council for Scientific and Technological Development.
Footnotes
1. ^The rapid enumeration of a small numbers of objects. When a number of objects are flashed briefly, their number can be determined very quickly, at a glance, when the number does not exceed the subitizing limit, which is about four objects.
2. ^The plots were done using the R package visreg and include Wald 95% conditional confidence intervals. Partial residuals were also plotted to aid assessment of variability and impact of any outliers (Breheny and Burchett, 2017).
References
Astur, R. S., Purton, A. J., Zaniewski, M. J., Cimadevilla, J., and Markus, E. J. (2016). Human sex differences in solving a virtual navigation problem. Behav. Brain Res. 308, 236–243. doi: 10.1016/j.bbr.2016.04.037
Ball, R., North, C., and Bowman, D. A. (2007). “Move to improve: promoting physical navigation to increase user performance with large displays,” in Proceedings of the SIGCHI Conference on Human Factors in Computing Systems (San Jose, CA), 191–200.
Basak, C., Boot, W. R., Voss, M. W., and Kramer, A. F. (2008). Can training in a real-time strategy video game attenuate cognitive decline in older adults? Psychol. Aging 23, 765–777. doi: 10.1037/a0013494
Billen, E. (2001). “Gender differences in spatial ability within virtual reality,” in Human-Computer Interaction INTERACT'01: IFIP TC13 International Conference on Human-Computer Interaction (Tokyo).
Boot, W. R., Kramer, A. F., Simons, D. J., Fabiani, M., and Gratton, G. (2008). The effects of video game playing on attention, memory, and executive control. Acta Psychol. 129, 387–398. doi: 10.1016/j.actpsy.2008.09.005
Breheny, P., and Burchett, W. (2017). Visualization of Regression Models Using Visreg. The R Journal. Available online at: https://journal.r-project.org/archive/2017/RJ-2017-046/index.html
Büschel, W., Reipschläger, P., Langner, R., and Dachselt, R. (2017). “Investigating the use of spatial interaction for 3D data visualization on mobile devices,” in Proceedings of the 2017 ACM International Conference on Interactive Surfaces and Spaces (Brighton), 62–71.
Carroll, J. B. (1974). Psychometric Tests as Cognitive Tasks: A New'Structure of Intellect', (Princeton, NY: Educational Testing Service).
Chance, S. S., Gaunet, F., Beall, A. C., and Loomis, J. M. (1998). Locomotion mode affects the updating of objects encountered during travel: the contribution of vestibular and proprioceptive inputs to path integration. Presence Teleoperat. Virtual Environ. 7, 168–178. doi: 10.1162/105474698565659
Coluccia, E., and Louse, G. (2004). Gender differences in spatial orientation: a review. J. Environ. Psychol. 24, 329–340. doi: 10.1016/j.jenvp.2004.08.006
Donalek, C., Djorgovski, S. G., Davidoff, S., Cioc, A., Wang, A., and Longo, G. (2014). “Immersive and collaborative data visualization using virtual reality platforms,” in 2014 IEEE International Conference on Big Data (Big Data) (Washington, DC), 609–614.
Dye, M. W., Green, C. S., and Bavelier, D. (2009). The development of attention skills in action video game players. Neuropsychologia 47, 1780–1789. doi: 10.1016/j.neuropsychologia.2009.02.002
Ekstrom, R. B., French, J. W., Harman, H. H., and Dermen, D. (1976). Manual from Kit of Factor-References Cognitive Tests. Princeton, NJ.
Frissen, I., Campos, J. L., Souman, J. L., and Ernst, M. O. (2011). Integration of vestibular and proprioceptive signals for spatial updating. Exper. Brain Res. 212, 163–176. doi: 10.1007/s00221-011-2717-9
Griffith, J. L., Voloschin, P., Gibb, G. D., and Bailey, J. R. (1983). Differences in eye-hand motor coordination of video-game users and non-users. Percept. Motor Skills 57, 155–158. doi: 10.2466/pms.1983.57.1.155
Hinckley, K., Tullio, J., Pausch, R., and Proffitt, D. (1997). “Usability analysis of 3D rotation techniques,” in Proceedings of the 10th annual ACM symposium on User interface software and technology (Banff, AB: ACM), 1–10.
Hogan, T. P. (2012). Psychometric analysis of five measures of spatial ability. Percept. Motor Skills 114, 75–84. doi: 10.2466/03.04.22.PMS.114.1.75-84
Jakobsen, M. R., and Hornbæk, K. (2015). “Is moving improving?: some effects of locomotion in wall-display interaction,” in Proceedings of the 33rd Annual ACM Conference on Human Factors in Computing Systems (Seoul), 4169–4178.
Jang, S., Vitale, J. M., Jyung, R. W., and Black, J. B. (2016). Direct manipulation is better than passive viewing for learning anatomy in a three-dimensional virtual reality environment. Comput. Educ. 106, 150–165. doi: 10.1016/j.compedu.2016.12.009
Kerr, B., Condon, S. M., and McDonald, L. A. (1985). Cognitive spatial processing and the regulation of posture. J. Exp. Psychol. Hum. Percept. Perform. 11, 617–622. doi: 10.1037/0096-1523.11.5.617
Kersten-Oertel, M., Chen, S., and Collins, D. (2014). An evaluation of depth enhancing perceptual cues for vascular volume visualization in neurosurgery. IEEE Trans. Vis. Comput. Graph 20, 391–403. doi: 10.1109/TVCG.2013.240
Kirby, J. R., and Boulter, D. R. (1999). Spatial ability and transformational geometry. Eur. J. Psychol. Educ. 14:283. doi: 10.1007/BF03172970
Kozhevnikov, M., and Hegarty, M. (2001). A dissociation between object manipulation spatial ability and spatial orientation ability. Mem. Cogn. 29, 745–756. doi: 10.3758/BF03200477
Laha, B., Sensharma, K., Schiffbauer, J. D., and Bowman, D. A. (2012). Effects of immersion on visual analysis of volume data. Visual. Comput. Graphics IEEE Trans. 18, 597–606. doi: 10.1109/TVCG.2012.42
Lajoie, Y., Teasdale, N., Bard, C., and Fleury, M. (1993). Attentional demands for static and dynamic equilibrium. Exper. Brain Res. 97, 139–144. doi: 10.1007/BF00228824
LaViola, J. J. Jr., Kruijff, E., McMahan, R. P., Bowman, D., and Poupyrev, I. P. (2017). 3D User Interfaces: Theory and Practice, 2nd Edn. Boston, MA: Addison-Wesley Professional.
Levine, S. C., Foley, A., Lourenco, S., Ehrlich, S., and Ratliff, K. (2016). Sex differences in spatial cognition: advancing the conversation. Wiley Interdisc. Rev. Cogn. Sci. 7, 127–155. doi: 10.1002/wcs.1380
Linn, M. C., and Petersen, A. C. (1985). Emergence and characterization of sex differences in spatial ability: a meta-analysis. Child Develop. 56, 1479–1498. doi: 10.2307/1130467
Liu, C., Chapuis, O., Lafon, M.-B., Lecolinet, E., and Mackay, E. W. (2014). “Effects of display size and navigation type on a classification task,” in Proceedings of the 32nd Annual ACM Conference on Human Factors in Computing Systems (Toronto, CA), 4147–4156.
Maechler, M., Rousseeuw, P., Croux, C., Todorov, V., Ruckstuhl, A., Salibian-Barrera, M., et al. (2017). Robustbase: Basic Robust Statistics. Available online at: http://robustbase.r-forge.r-project.org/
Mazman, S. G., and Altun, A. (2013). Individual differences in spatial orientation performances: an eye tracking study. World J. Educ. Technol. 5, 266–280.
Moffat, S. D., Hampson, E., and Hatzipantelis, M. (1998). Navigation in a “virtual” maze: Sex differences and correlation with psychometric measures of spatial ability in humans. Evol. Hum. Behav. 19, 73–87.
Morris, N., and Jones, D. M. (1990). Memory updating in working memory: the role of the central executive. Br. J. Psychol. 81, 111–121. doi: 10.1111/j.2044-8295.1990.tb02349.x
Murias, K., Adrian, K. K., Castillejo, A. G., Liu, I., and Iaria, G. (2016). The effects of video game use on performance in a virtual navigation task. Comput. Hum. Behav. 58, 398–406. doi: 10.1016/j.chb.2016.01.020
Parsons, T. D., Courtney, C. G., Dawson, M. E., Rizzo, A. A., and Arizmendi, B. J. (2013). “Visuospatial processing and learning effects in virtual reality based mental rotation and navigational tasks,” in International Conference on Engineering Psychology and Cognitive Ergonomics (Berlin), 75–83.
Peck, T. C., Fuchs, H., and Whitton, M. C. (2011). “An evaluation of navigational ability comparing Redirected Free Exploration with Distractors to Walking-in-Place and joystick locomotio interfaces,” in Virtual Reality Conference (VR), 2011 (Singapore: IEEE). 55–62.
Pellecchia, G. L. (2003). Postural sway increases with attentional demands of concurrent cognitive task. Gait Posture 18, 29–34. doi: 10.1016/S0966-6362(02)00138-8
Piper, B. J., Acevedo, S. F., Edwards, K. R., Curtiss, A. B., McGinnis, G. J., and Raber, J. (2011). Age, sex, and handedness differentially contribute to neurospatial function on the Memory Island and Novel-Image Novel-Location tests. Physiol. Behav. 103, 513–522. doi: 10.1016/j.physbeh.2011.03.024
Rädle, R., Acevedo, S. F., Edwards, K. R., Curtiss, A. B., McGinnis, G. J., Raber, J., et al. (2013). “The effect of egocentric body movements on users' navigation performance and spatial memory in zoomable user interfaces,” in Proceedings of the 2013 ACM International Conference on Interactive Tabletops and Surfaces (Scotland), 23–32.
Riley, M. A., Mitra, S., Saunders, N., Kiefer, A. W., and Wallot, S. (2012). The interplay between posture control and memory for spatial locations. Exp. Brain Res. 217, 43–52. doi: 10.1007/s00221-011-2970-y
Richardson, A. E., Powers, M. E., and Bousquet, L. G. (2011). Video game experience predicts virtual, but not real navigation performance. Computers in Human Behavior 27, 552–560. doi: 10.1016/j.chb.2010.10.003
Ruddle, R. A., and Lessels, S. (2009). The benefits of using a walking interface to navigate virtual environments. ACM Trans. Comput. Hum. Inter. 16:5. doi: 10.1145/1502800.1502805
Ruddle, R. A., Volkova, E., and Bülthoff, H. H. (2011). Walking improves your cognitive map in environments that are large-scale and large in extent. ACM Trans. Comput. Hum. Inter. 18:10. doi: 10.1145/1970378.1970384
Shawn Green, C., Sugarman, M. A., Medford, K., Klobusicky, E., and Bavelier, D. (2012). The effect of action video game experience on task-switching. Comput. Hum. Behav. 28, 984–994. doi: 10.1016/j.chb.2011.12.020
Smith, S. P., and Du'Mont, S. (2009). “Measuring the effect of gaming experience on virtual environment navigation tasks,” in 3D User Interfaces, 2009. 3DUI 2009. IEEE Symposium (Lafayette, LA: IEEE), 3–10. doi: 10.1109/3DUI.2009.4811198
Thomas, L. E., and Seiffert, A. E. (2010). Self-motion impairs multiple-object tracking. Cognition 117, 80–86. doi: 10.1016/j.cognition.2010.07.002
Velez, M. C., Silver, D., and Tremaine, M. (2005). “Understanding visualization through spatial ability differences,” in Visualization (Minneapolis, MN: VIS 05. IEEE), 511–518.
Wang, L., and Carr, M. (2014). Working memory and strategy use contribute to gender differences in spatial ability. Educ. Psychol. 49, 261–282. doi: 10.1080/00461520.2014.960568
Wilcox, R. R. (2011). Introduction to Robust Estimation and Hypothesis Testing. San Diego, CA: Academic Press.
Wolbers, T., and Hegarty, M. (2010). What determines our navigational abilities? Trends Cogn. Sci. 14, 138–146. doi: 10.1016/j.tics.2010.01.001
Keywords: physical navigation, virtual reality, spatial cognition, 3D interaction, spatial ability
Citation: Lages WS and Bowman DA (2018) Move the Object or Move Myself? Walking vs. Manipulation for the Examination of 3D Scientific Data. Front. ICT 5:15. doi: 10.3389/fict.2018.00015
Received: 17 April 2018; Accepted: 19 June 2018;
Published: 10 July 2018.
Edited by:
Rob Lindeman, Human Interface Technology Lab New Zealand (HIT Lab NZ), New ZealandReviewed by:
Gerd Bruder, University of Central Florida, United StatesMagdalena Mendez-Lopez, Universidad de Zaragoza, Spain
Copyright © 2018 Lages and Bowman. This is an open-access article distributed under the terms of the Creative Commons Attribution License (CC BY). The use, distribution or reproduction in other forums is permitted, provided the original author(s) and the copyright owner(s) are credited and that the original publication in this journal is cited, in accordance with accepted academic practice. No use, distribution or reproduction is permitted which does not comply with these terms.
*Correspondence: Wallace S. Lages, wlages@vt.edu