 Bharat Hazari
 Vijay Mohan
- 1Lattice Analytics Pty Ltd, Melbourne, VIC, Australia
- 2Blockchain Innovation Hub, RMIT University, Melbourne, VIC, Australia
This study provides a four-good general equilibrium framework with international trade for assessing the impact of the advancement of automation and artificial intelligence (A&AI) on the welfare of a group of agents who are excluded from both owning productive assets, such as capital and land, as well as consuming digital output (digital exclusion). We show that, depending on the magnitude of the factor intensities, the accumulation of A&AI capital may negatively affect the income of the excluded group, who provide unskilled labor, or the owners of land. In doing so, we bring out the conflict of interests that may arise between the owners of A&AI capital and other groups within society, which has implications for the pressure that exists to slow down the adoption of A&AI in an economy.
1 Introduction
How will a rapid growth of automation and artificial intelligence (A&AI) affect jobs, consumption, and welfare in the future? While this question has been a topic of research in economics for a while now, the recent introduction of artificial intelligence (AI) consumer technology on the internet has pushed AI firmly into public awareness. At the forefront of the propulsion of AI into the mainstream, as it were, was the launch of ChatGPT, a user-friendly chatbot, on November 30, 2022.1 Barely 2 months after its launch, ChatGPT boasted 100 million active users in January 2023, making it by far the fastest growing internet application in history.2
AI is just one of the many new technologies that households and businesses are rapidly adopting in their various activities. Other developments such as blockchains, cryptocurrency, the metaverse, Web3, NFTs (non-fungible tokens), and DeFi (decentralized finance) are all very much a part of the lexicon now. On the one hand, AI and other technologies are transforming the business landscape as innovations are rapidly integrated into supply chains, management procedures, marketing, finance, and the development of new products; on the other hand, consumers are increasingly having to rapidly acclimatize themselves with the onslaught of new technology to make the most of the consumption possibilities that are now available.3 The main focus of this study is to examine the impact of new technology on the welfare of groups that are excluded on both sides of the market—they are excluded from owning factors of production and consuming certain goods (for reasons that we will elaborate on below).
To a large extent, the focus of past economic modeling on A&AI has been on its disruption on production. Specifically, A&AI primarily has a displacement effect as capital takes over tasks previously performed by labor (Brynjolfsson and McAfee, 2014; Aghion et al., 2017; Acemoglu and Restrepo, 2018; Acemoglu and Restrepo, 2019); on its own, the displacement effect causes a lower share of labor in national income. However, there are countervailing effects as well: first, a productivity effect arising from the cost reduction that A&AI brings, which lowers the prices of goods and services, thereby increasing the demand for all goods and labor required to produce these goods; second, a capital accumulation effect induced by the rise in rental rates following the greater use of A&AI techniques, which then raises the demand for labor; and third, an automation deepening effect that follows further improvements in A&AI and enhances the productivity effect even more (Acemoglu and Restrepo, 2019). Overall, the impact of technological advancement on employment depends on the relative magnitudes of these various effects, with demand playing an important role in the outcome (Bessen, 2019).
While the role of demand has received some attention in the literature, it has been from the point of view of how an increase in demand following a price reduction results in an expansion of labor demand to counteract the displacement effect of A&AI (Bessen, 2019). This line of thinking is very much in the spirit of a representative consumer and presumes that all agents can consume all goods, depending on their preferences and budget constraints. However, there is another aspect of the demand-side that economists by and large ignore, but which sociologists and ethnographers recognize as being of primary importance in many contexts: some groups in society may be excluded from participating in certain economic activities, including the consumption of certain goods.4 Specifically, there may exist digital exclusion, which we define as the inability of certain groups in society to use digital goods. The main contribution of this study is that it provides a framework to analyze how exclusion from the consumption of digital goods, in general, and AI, in particular, affects the welfare of the excluded groups. The standard neo-classical model assumes a representative consumer who characterizes aggregate consumption of goods and services in an economy. As such, the traditional neo-classical model cannot address consumption exclusion. Consequently, the standard model leads to a “trickle-down” outcome, where the gains from new technology and capital accumulation ultimately filter down to the lower socioeconomic groups. In the standard model with a representative agent, excluded groups’ income grows as the economy grows. The main thrust of this study is to show that this need not hold when exclusion is factored in.
Recent data collected by the International Telecommunication Union [International Telecommunication Union (ITU), 2022, 2023] on digital access in 46 least developed countries (LDCs) with an aggregate population of approximately 1.13 billion suggest that only 36% (407 million) were using the internet, with the remaining (720 million) population still offline. Overall, 34% of the global population still remains without the internet. Even within the broad category of LDCs, disparities exist. At one end of the spectrum, the first tier of countries5 has a relatively high penetration, with 60.8% of the population using the internet in 2022; at the other end, the lowest tier6 has an internet penetration of 15% on average, with countries such as Burundi bringing up the rear with only 6% of the population using the internet. Furthermore, the inequality of internet access extends to other dimensions: in terms of gender, 43% of the male population in LDCs had access to internet in 2022, while only 30% of the female population used the internet; in terms of the urban–rural divide, 52% of the urban population had internet access, with the number dropping to 28% for the rural population. Given that 64% of the LDC population remains offline, one may enquire why this is the case. Part of the problem is a coverage gap,7 which accounts for 17% of the population being unable to access a broadband signal. Disconcertingly, 47% of the population in LDCs suffers from a usage gap.8 An earlier report by International Telecommunication Union (ITU) (2021) found that, while the cost of accessing the internet and purchasing a smartphone contributed to the low internet access rates, the main factor for the low usage was, by far, a lack of awareness of what the internet is. Moreover, even among those who were using the internet, many have only rudimentary digital skills [International Telecommunication Union (ITU), 2021]. While 58% of the LDC population owned a phone, subscriptions to mobile broadband was still relatively low in 2022 (42 subscriptions per 100 individuals), suggesting that phones were still predominantly used for voice and text [International Telecommunication Union (ITU), 2023]. More extensive digital use is also limited by the fact that, in 2019, only 8% of households in LDCs owned a computer and only 53% of the aggregate population had access to electricity [International Telecommunication Union (ITU), 2021].
While the results are fairly stark for LDCs, many other developing countries in Asia and Africa have not tackled the problem of digital exclusion to any degree of satisfaction. In India, for example, Oxfam (2022) reports (in a survey conducted between 2018 and 2020) that only 20% of the entire population had the ability to operate a computer or utilize the internet. Moreover, among the poorest 20% of the population, only 2.7% had access to a computer and 8.9% had access to the internet. Indeed, the report suggests that 70% of the population had poor or no connectivity to digital services. In spite of the major advancements in communication and connectivity over the past decade, lack of access to digital services remains a genuine problem in India and is worsened by the socioeconomic disparities that exist. To quote Oxfam (2022):
“There is evidence of a palpable digital divide between the rich and the poor, the urban areas and rural areas, men and women and among different caste and religious groups. This divide mirrors the existing socioeconomic inequalities—it means that often the most marginalized groups have been the least digitalized whereas the privileged groups reap the benefits of digitalization.”
Unequal access to the internet is the first level of the digital divide (Lutz, 2019), and LDCs (and other countries as well) certainly suffer from this inequality. The second level of the digital divide refers to inequalities in skills and uses (Hargittai, 2002; Lutz, 2019), and this essentially moves the focus away from access to usage. As pointed out earlier, International Telecommunication Union (ITU) (2021) has substantial evidence of this sort of digital divide in LDCs: of the 64% of the population who do not use the internet, only 17% is accounted for the lack of access; the remainder is due to the inability or unwillingness to use the internet. Our own reference to consumption exclusion in this study relates to this second level of the digital divide, as excluded groups are unable to consume digital goods for reasons other than infrastructure constraints. As a separate issue, there may exist a third level of the digital divide which refers to unequal gains from the use of digital goods (Van Deursen and Helsper, 2015; Lutz, 2019).
Overall, a multitude of factors—low education, poverty, poor infrastructure, gender divide, geographic divide, lack of access to credit, and social exclusion—imply that a significant proportion of the global population remains excluded from the digital revolution that is currently taking place. The same factors that ensure certain sections of society are excluded from owning productive assets, such as capital and land, also result in exclusion from digital goods consumption.
When it comes to A&AI, there is a growing concern about how the developing economies will fare. Technological advancement brings with it winners and losers. In a single economy, redistributive government policies may aid in generating more inclusive growth so that inequality is not exacerbated (Korinek and Stiglitz, 2019; Korinek et al., 2021). In a global scale, some countries will win the technological race and others will lose; in such a case, it will typically be harder for winners to compensate losers (Korinek et al., 2021). The fact that A&AI will transform international trade and development is no longer in dispute. The question that arises is how best these transformations can be managed, especially in a world where global trade is important. This necessitates developing trade models that incorporate A&AI, a literature that is slowly expanding. Goldfarb and Trefler (2019) put forward the case that trade models which incorporate economies of scale and scope may be useful in pinning thoughts on how A&AI impact economies through trade. Artuc et al. (2018) use the Ricardian model to study the impact of robot adoption on North–South trade. As Korinek et al. (2021) state:
“The new era will be governed by different rules and will require a different kind of economic analysis. Just as the production functions that Ricardo used to analyze agrarian and rural economies are very different from those in the models of a manufacturing economy that dominated the mid-20th century, current economic frameworks must be adjusted and updated to think about the models that will describe the next 50 years.”
In this study, we attempt to tie all these disparate elements together. We construct a four-sector general equilibrium model that utilizes two types of capital (A&AI capital and general-purpose capital), two types of labor (skilled and unskilled), and land as factors of production. There are three main elements of the model:
(a) A&AI is fairly advanced so that it is simply a technique of production that competes with traditional techniques utilizing standard (non-intelligent) capital, which we label general-purpose capital, and labor.
(b) There is international trade so that two of the four goods are traded, while the other two are non-traded.
(c) There exists a group of agents (unskilled labor) who are excluded from both owning productive assets (capital and land) and consuming digital output.
To capture, (a) we use the production function suggested by Jones and Manuelli (1990) to generate endogenous growth, which has subsequently been adapted by Hazari et al. (2022) to model A&AI. When utilizing labor, , and capital, , as inputs, this production function is where is the maximum output from a specific combination of the two factors. The reason why the Jones–Manuelli function is particularly attractive for modeling A&AI is that one component of the production function (the part) represents a technique that utilizes only capital, which is required for automation. The second component, represents a technique of production that uses both capital and labor. The additive nature of the function then implies that these techniques are substitutes. To give the example provided in the study by Hazari et al. (2022), consider a taxi service (in the future) that has two techniques for servicing fares: using driverless cabs piloted by AI agents and the more traditional technique involving a car and driver. The two are substitutes for the purpose of providing fares and which technique is employed, and to what extent, depends on numerous factors such as the costs of inputs and the productivity of factors. Therefore, the Jones–Manuelli production is a versatile way of modeling A&AI without losing the possibility that it exists side-by-side with traditional techniques of production.
Hazari et al. (2022) consider a version of this function that has two types of capital, A&AI capital ( ) and general-purpose capital ( ), which result in a production function of the form . Here, represents the contribution to output by A&AI capital that requires no complementary labor for production activities, while captures the traditional technique of production that utilizes both labor and capital to produce output. Inherent in this formulation is the presumption that these capital stocks are exogenous. In our model, the JM function is used in one sector, which we label the “high-tech” sector and that we interpret as a composite digital good. This sector then not only uses A&AI for production but also produces the digital good that some agents in the economy are excluded from consuming. The other consuming in the model have traditional neo-classical production functions. Sectors 1 and 2 are traded goods, while sectors 3 and 4 (that use land and unskilled labor as factors) are non-traded goods. As outlined in (c) above, unskilled labor is the excluded group in our model: they do not own any productive asset apart from their labor (so they experience production exclusion) and are not able to consume the output of sector 1 (digital consumption exclusion).
Based on this modeling structure, we then examine the outcomes when A&AI becomes more prevalent, which essentially translates to an accumulation of . Our comparative static results show that, while owners of capital always gain a higher income from this change, depending on factor intensities in the non-traded sectors either the unskilled labor or the owners of land experience a fall in income. This has interesting political economy implications. If the income accruing to unskilled labor falls, the excluded group becomes worse-off. This may generate dissatisfaction with the growth of AI, leading to greater inequality between excluded and non-excluded sections of society, and thereby resulting in calls for policy intervention to reduce inequality. On the other hand, if the income of land-owners falls (and the income of excluded group rises), the opposition to the A&AI is not based on the rising inequality in the economy; rather, it arises from land owners, who are typically powerful and politically influential in developing economies, trying to preserve their income and lobbying policymakers for this purpose.
Our results provide theoretical underpinnings to the link between a digital divide and widening inequality. A report by the World Bank (2016), for example, suggests that inadequate access to digital technologies results in widening income inequality; specifically, based on labor market evidence, the report states that:
“Digital technologies can improve overall welfare and reduce poverty, but without complementary investments, they can also worsen inequality” (p. 100) … “Perhaps the biggest risk from technological change, however, is that of widening income inequality. Although technologies are becoming widespread, the economic payoffs are not. The poor almost exclusively use only mobile phones not connected to the internet. And even if they had access to the internet, they lack the skills to use it productively, with many still unable to read in the first place. Positive impacts from using digital technologies—as with other technologies in the past century—are most likely to be captured by those already better off.” (p. 118).
Indeed, the impact of digital exclusion on inequality only seems to have widened after the COVID-19 pandemic (International Monetary Fund, 2020).
Overall, the empirical earlier in this section indicates that there exists digital exclusion in a significant portion of the global population, which occurs due to a number of factors including structural inequality in access to digital technologies. The growth of digital technology, automation, and AI then has the potential impact of widening income inequality, which then increases digital exclusion. The consequence is a vicious cycle of widening digital exclusion and income inequality that feed off each other. One of the main contributions of this study is to recognize that such a vicious cycle exists and to provide a theoretical framework to organize thoughts for policymaking in this area.
The study is organized as follows: Section 2 specifies the model, while Section 3 presents the main results. Finally, Section 4 provides concluding comments.
2 A model of AI with exclusion
In this section, we present a four-good (or four-sector) trade-theoretic model for the purpose of analyzing the impact of automation and AI technology expansion (through the accumulation of A&AI capital) on the welfare of various groups in society. Overall, our modeling choices rest on a number of stylized aspects of the economic problem we would like to capture. First, to reiterate the main point of this study, we develop the model in a manner that the restriction to participate in the A&AI revolution occurs not only from the production side but also from the demand side, with some agents being excluded from consuming the output produced by A&AI capital. Thus, some unfortunate section of society faces a double-whammy of exclusion: access to both ownership of capital and land and the consumption of AI capital is out of reach for this group. In a manner similar to Kaldorian and Marxian models, this requires moving away from two traditional neo-classical assumptions: the existence of a representative agent that characterizes aggregate consumption, and the universal ownership of factors of production. In this study, we drop both of these assumptions. Second, we require a fairly versatile framework that has multiple types of labor, as some types of labor suffer from exclusion, whereas others do not. We also need multiple types of capital as some of the capital are automated while others are not automated. Third, in developing economies where exclusion is prevalent, which is very much the focus of this study, land-owners form a powerful political lobby, and agrarian incomes are an important part of national income. Our model, therefore, incorporates this group of agents by introducing land as a separate factor of production. Fourth, since trade is important for developing economies, we allow for some sectors to participate in trade, while other sectors (such as domestic household work) do not participate in trade. This necessitates multiple sectors in the economy, and we introduce four sectors in our model, which are needed to incorporate the myriad elements outlined above and ensure the existence of a concrete equilibrium for the economy. Finally, our framework assigns certain factors to different sectors. We emphasize, however, that this assignment is not unique; rather, depending on the context, one can move factors around in the model equations in different ways.
There are four goods produced in the domestic economy: and . These goods are produced using the following resources:
(a) Two types of capital: mobile general-purpose capital ( ) and sector-specific A&AI capital ( ).
(b) Two types of labor: skilled labor ( ) and unskilled labor ( ).
(c) Land ( ).
In what follows, we use the subscripts and as short-hand notation for referring to and respectively. We differentiate between traded goods ( and ) and non-traded goods ( and ). This yields a block structure for the model, which we describe in detail below.
We assume that good 1 represents a ‘high-tech’ industry, which is produced using a Jones–Manuelli (JM) production function. As outlined in Section 1, the JM production function is particularly conducive for modeling A&AI. Specifically, can be produced either using automated A&AI capital, or utilizing the more traditional techniques that combine general-purpose capital, , and skilled labor, . While could represent a number of manufacturing industries, as outlined in the introduction, for our purpose, we can think of as a composite digital sector that comprises computers, sophisticated software and virtual applications that are at the forefront of the digital revolution, including AI applications for consumers.9 The JM production function for is:
The variable represents the amount of A&AI capital used in Sector 1; other variables have similar interpretations of their subscripts. The fact that allows for A&AI production techniques is essentially why this corresponds to the technology-intensive sector in our model; consequently, we assume that is a specific factor which is used only in Sector 1. General-purpose capital, on the other hand, is assumed to be mobile between Sectors 1 and 2. The function is a standard neo-classical production function. The variable represents the general-purpose capital to skilled labor ratio in Sector 1, that is, . The parameter is a measure of the productivity of A&AI capital. Let good 1 be the numeraire. It then follows that the rate of return, accruing to equals:
Thus, the return to the specific capital is a constant equaling the parameter .
Now consider the production of . We assume that is good that is produced without A&AI capital; that is, the manufacture of requires the mobile general-purpose capital, , and skilled labor, , as shown below:
The production function for commodity is neo-classical. This represents an industry that requires a significant input of skilled workers who cannot be easily substituted by A&AI capital. To fix ideas, we suppose that good 2 is an exportable service, such as cultural and recreational services (movies and songs, for example), which requires human input that cannot easily be replaced by AI.
Both goods 1 and 2 are assumed to be traded; without loss of generality, we assume that is imported and is exported. Furthermore, we suppose that the domestic economy is a small country, which implies that the term of trade, , is exogenously given. The variables and denote the return to and , respectively. Assuming profit maximization and the existence of an interior solution, it follows that:
Sectors 1 and 2 represent the first “block” in our model in the sense that they share the mobile factors of production and ; more precisely, this is the “traded block” given that these two goods can be exported and imported.
The second block in this model is the non-traded block, which comprises goods and . These two goods are produced with the help of land and unskilled labor using neo-classical production functions:
where and for represent the allocation of unskilled labor and land to sectors 3 and 4, respectively. The variables and represent the land to unskilled labor intensities in these sectors. Typical examples of non-traded goods include household and personal services but can be generalized to include items such as agricultural products that are subjected to high transport costs or trade barriers that render them non-traded for practical purposes.
It is assumed without loss of any generality that good 3 serves as a numeraire for the non-traded block, so . Then, provides the relative price of good 4, which guides production and consumption in this block. Letting represent the wage of unskilled labor and denote the rental on land, the factor price equations for these sectors are given below (based on the assumption of profit maximization and an interior solution):
Essentially, equations (2), (4), (5), (8) and (9) capture the pricing side of the model, while equations (3), (6) and (7) capture the production side.
The price equations can also be written using variable unit input coefficients, (where and ), in the usual manner as shown below:
It is worth noting that there are two blocks in the price equations as well: the traded block is given by equations (10) and (11), and the non-traded block is given by equations (12) and (13).
Before introducing the demand-side of this model, we illustrate diagrammatically the structure of the supply-side outlined above. Let us begin with the traded block first, which is shown in Figures 1, 2. Figure 1 shows the extended Edgeworth box diagram.
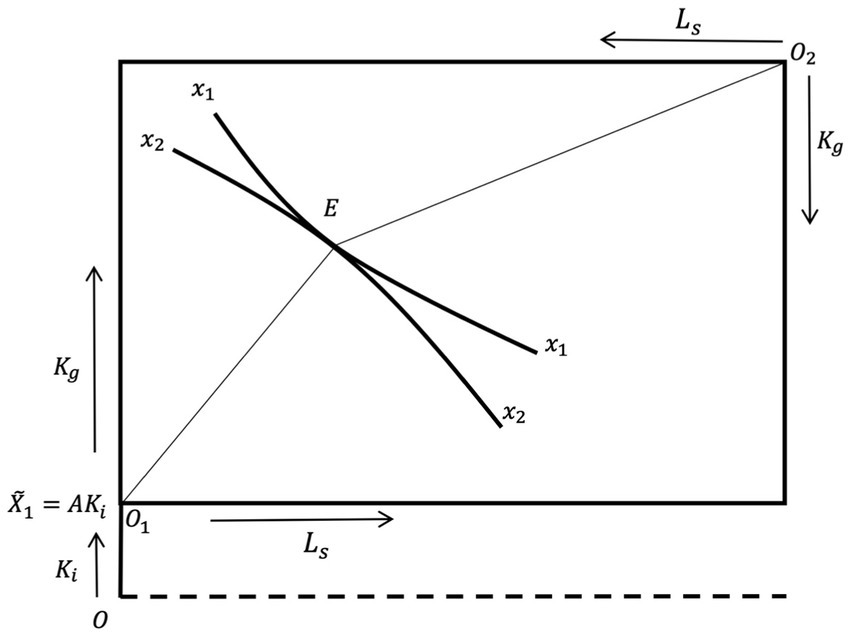
Figure 1. The Edgeworth box for the traded block.

Figure 2. Production possibilities in the traded block.
We know that part of is produced by the specific factor . This is shown by on the vertical axis. From this, we draw the Edgeworth box with factors and used in the traded block to produce and . The isoquants for and measured from the origin points and , respectively. In drawing Figure 1, we have assumed that is more capital intensive than . Given the terms of trade, , which determines the wage-rental ratio, production equilibrium occurs at the pint of tangency to the isoquants and .
In Figure 2, this is transferred to the output space. The output produced by the stock of A&AI capital utilized in Sector 1 is shown by the distance in Figure 2, which corresponds to the distance in Figure 1. This amount of is independent of commodity and factor prices. Now, starting at in Figure 2, if all endowments of and are used in the manufacture of , the total quantity of good 1 that can be produced in the economy is represented by in Figure 2, with the distance representing the output produced by and . It is evident that point corresponds to in Figure 1. As the mobile factors and are moved to Sector 2, we get the familiar bowed production possibility curve (PPC) shown by the arc . At , which corresponds to point in Figure 1, all available and have been allocated to the production of ; this maximum level of is shown by on the horizontal axis. At this level of , the economy continues to produce units of good 1 through utilizing A&AI capital alone. The overall production possibilities of the economy are shown by . However, if all available and are used for the production of , all the action will take place at the point , which lies at the corner of the box
We now turn our attention to the non-traded block. Although the system has a full equilibrium via the tâtonnement process, we will focus on outlining the intuition here. The relative price is determined endogenously from domestic supply and demand conditions. While we specify the demand equations presently, it is worthwhile to briefly outline how the non-traded block attains an equilibrium. Given the domestic demand and supply for good 4, the equilibrium price follows from the market clearing equilibrium. This price then feeds into equation (13) which, together with equation (12), determines the rental on land, , and the wages of unskilled labor, . The overall general equilibrium for the non-traded block can be visualized in the standard manner, as the point of tangency between the PPC drawn in the space and the relative price line.
We now specify the details of the demand side of the model. In contrast to standard general equilibrium analysis which assumes that all agents consume all goods, thereby allowing for aggregate preferences to be depicted using a representative agent, in this study, we assume that one section of society is not able to consume one good. Specifically, we assume that there is a group in society that is not digitally literate; in our model, this group that suffers from digital exclusion comprises unskilled workers, . We assume that the rest of the population—owners of both types of capital, land, and skilled workers—are all digitally literate and are, consequently, able to utilize good 1. In what follows, we label variables related to the digitally excluded group with the superscript “ ” and the remainder of society that is not digitally excluded with “ ”. As a result of digital exclusion, the group only consumes three goods, and the demand for these are: , and . The utility that the excluded group derives from this is On the other hand, the group consumes all four goods and has demands , and , which generates some social welfare . The demand and supply balance equations are given by (14)–(17) below:
where denotes imports of good 1.
where denotes exports of good 2.
The markets for goods 3 and 4 clear locally, hence:
As mentioned earlier, the model also has separation of factor ownership, with the group owning and . The income ( ) of owners of A&AI capital, the income ( of the owners of general-purpose capital, the income ( ) of owners of land, and the income ( ) of skilled labor are described in equations (18)–(21) below:
Here, , , , and represent the economy’s stock of these factors. Hence, the group’s aggregate income can be written as follows:
It is worth noting that we do not put restrictions on ownership of capital and land in the model other than the fact that unskilled labor is excluded from owning these assets. Within the non-excluded group, , households that supply skilled labor may own either type of capital or land. The group only owns unskilled labor, and therefore its income ( ) is the same as the income of the unskilled workers, :
Assuming factor price flexibility and an interior solution, the standard full employment conditions are given by the equations (24)–(28) below:
Finally, we complete the specification of the model with the balance of payment condition in equation (29):
3 The implications of a growth in A&AI capital
To track the impact of accumulation of A&AI capital on the welfare of various sections, we need to specify the income accruing to households from ownership of different factors of production. The equations (18)–(23) describe these incomes and are useful for tracking the manner in which parametric changes affect the distribution of income across the excluded group, , which derives the income , and the non-excluded group, , which derives income . To achieve our results, we first obtain a relation between , and . Letting denote the distributive share of factor in sector and using the ‘ ’ notation to represent proportional change, the standard manipulations of the system yield:
where . It follows that as .
Assuming we have the classical Stolper–Samuelson theorem results:
Now, suppose A&AI becomes more prevalent in the digital sector through the accumulation of . As we are dealing with a small open economy, the terms-of-trade remains constant when changes. Hence, from equation (1), it follows that:
The output of cannot change as both the skilled labor and mobile capital have not changed, and the capital intensity cannot change as prices are fixed. However, there are price effects in the non-traded good sector, as the two blocks are linked via income effects. The expressions for each factor’s income change are given below, which are derived from equations (18)–(20) and (22):
It follows from equation (34) that the income of the owners of always increases from the growth of A&AI capital, while the owners of observed that their incomes are unchanged (equation 35). In aggregate, the owners of capital do benefit from the growth in AI technology. This is not particularly surprising because they are the primary beneficiaries of the accumulation in A&AI capital. On the other hand, equation (35) implies that skilled labor does not benefit from the accumulation of ; essentially, because skilled labor works in the traded sector in our model, its returns are fixed through the small country assumption (and, moreover, there is no change in the stock of general-purpose capital in the comparative static case considered here). These outcomes are shown in Proposition 1.
Proposition 1: In a situation where skilled labor works in the traded sectors of the economy, the accumulation of A&AI capital does not alter their real income. However, owners of capital are always better off from the growth in in terms of receiving a higher income.
Equations (36) and (37)suggest that the incomes of owners of land and unskilled workers depend on the change in the rental for land ( ) and unskilled labor wages ( ); these factor prices change because of income effects that connect the traded block with the non-traded block. There are two links that we need to keep track of to evaluate these changes: one between and and the other between , and . The latter is already described in equations (30) and (31). To derive the former, we utilize the supply and demand equation for Sector 4, and the equations for changes in and to obtain are as follows:
where due to Walrasian stability. The terms are , and , respectively, the income elasticity for consuming good 4 by group , the share of A&AI income in the group income, the share of land income in the group income, and the share of skilled labor income in the group income. It follows that is always positive. This is fairly intuitive: the demand curve for good 4 shifts to the right due to income effects, and the supply curve does not change because the production possibility curve for the non-traded good sector does not change.
We are now in a position to explicitly state who gains and who loses from the accumulation of A&AI capital. From equations (30), (31), and (38), it is clear that the answer depends on the sign of , which, in turn, depends on the sign of ( ). Specifically, when , we have that and ; the reverse holds when . Equations (22) and (23) yield the following propositions.
Proposition 2: Suppose Sector 4 is more land-intensive, that is, . In this case, the growth of AI technology increases the income of land-owners and reduces the income of unskilled labor. Overall, the group is necessarily better off from the growth of AI technology. On the other hand, unskilled labor that forms the group is worse-off from the lower real income it receives.
Proposition 2 highlights that technological exclusion can lead to an increase in inequality when certain sections of society do not have access to the high-tech industry. This occurs even though no jobs are lost to the expanding AI technology and the excluded continue to be fully employed. Rather, the result is driven by the lowering of wages for unskilled labor due to the expanding high-tech sector. The logic of ‘trickle-down’ economics fails in this case even in the non-traded sector, which uses land and unskilled work as its primary inputs, the main beneficiaries of the growth in A&AI technology are the owners of land if the prices of the good that utilizes land more intensively were to rise.
Proposition 3 below shows that the outcome need not be so dire for the unskilled workers if the sector with the rise in relative prices of goods is intensive in unskilled labor.
Proposition 3: Suppose Sector 4 uses unskilled labor intensively, that is, . Then, the growth of AI technology increases the income of unskilled labor and reduces the income of the owners of land. This implies that the overall welfare impact on the group is ambiguous.
Proposition 3 suggests that it is possible that the wages of unskilled labor rise when the income effects, arising from the changes in Sector 1, result in an increase in price ( ) of the good that intensively uses unskilled labor. Trickle-down economics does work in this instance, as unskilled labor benefits in terms of higher income from the growth of the high-tech sector even though they face technological exclusion. On the other hand, we have that . The ambiguity in the overall welfare impact on the group arises from the fact that, in Proposition 3, we have and . If the fall in exceeds the rise in , we will have that . This yields the possibility of a somewhat counterintuitive outcome: the non-excluded group is actually worse-off from the advancements in AI, even though they are the owners of the new technology that is growing, they are not excluded from consuming the high-tech good and, importantly, they do not lose jobs to AI. This leads to some interesting political economy outcomes. Given that the agents who bear the brunt of the negative impact in this case – land owners – are not without political power, we can see why there may be a push by land-owners to halt advancements in AI, which provides some intuition to why vested interests may seek to block the advancement of AI technology, even when it has no employment consequences.
Finally, we can explicitly bring out the impact of consumption exclusion on this model. The primary effect of the increase in is an increase in ; however, the excluded group of unskilled workers cannot enjoy any of this increase in output. Intuitively, for any particular income and set of prices, the agents in the group will choose consumption optimally to maximize their utility. Given that they do not consume , letting and represent their optimal demands, their (aggregate) welfare can be measured through their utility level . This must necessarily be lower than their utility (given the same income and prices) if they did not have the constraint of consumption exclusion, in which case their optimal utility would be ; since the outcome in this unconstrained optimization can always set , consumption exclusion can only lead to a (weakly) worse outcome. As a result of a change in , change in utility of the group is , which does not include any change in consumption of good 1 and thereby lowers their welfare changes compared with a representative agent model, where the excluded group can consume all four goods.
4 Conclusion
Advancement in A&AI is occurring at a rapid pace, and its impact on employment, welfare, trade, and development is becoming the basis of a multidisciplinary research agenda. Using a trade-theoretic framework, we construct a stylized environment, where a specific group of society—unskilled workers—is excluded both from ownership of productive assets and the consumption of digital (high-tech) goods. While economists have largely focused on the impact of AI on employment, there is a growing concern, especially among sociologists, about how the digitally excluded population of the world will fare as AI advancements occur. Our simple model shows that the accumulation of AI capital may cause a lower income either for unskilled workers or owners of land, depending on the factor intensities in various sectors.
Our analysis has political economy implications. Specifically, if the unskilled workers are faced with a loss of income, then the main concern is the rising inequality in society and the potential for the economy to spiral into increasingly deleterious outcomes for excluded groups. Policymaking must tackle this problem. The classic policy response in this sort of circumstance is a tax-cum-subsidy scheme, where the agents who gain from a change are taxed and the proceeds are distributed to compensate those who lose out. Directly taxing the digital sector, however, can create distortions and inefficiencies of its own. One solution, then, is to tax a different sector, such as tourism, to gather revenues to subsidize the excluded groups. The rationale for this is that the tourism sector creates a distortion in the form of monopoly power in trade (Hazari and Ng, 1993; Hazari and Nowak, 2003).11 Such a distortion needs to be corrected by imposing an optimal tax (or tariff) on tourism. As an optimal tax on tourism eliminates a distortion in the economy, it leads to welfare improvement; the revenue from this tax can then be used to subsidize the reduction in digital exclusion through education and training of excluded groups. Alternatively, given that a lack of infrastructure contributes to digital exclusion (as outlined in Section 1), the tax can also be used to finance infrastructure that provides better access to digital technologies for excluded groups. On the other hand, if the brunt of the loss in income is felt by land-owners, the problem that emerges is that this group may lobby for policies that discourage advancements in AI to preserve their benefits. Moreover, the revenue from a tax-and-subsidy scheme can be used to subsidize landowners as well. The policy response of regulators to these various pressures brought about by digital exclusion is, we believe, a fruitful avenue for future research.
One of the main drawbacks of our analysis is that it presumes a particular production structure where skilled workers play a neutral role. This was achieved by assuming that skilled labor works only in the traded block and is essentially necessitated by our desire to focus on the problems faced by the excluded groups. In certain contexts, however, there may be a need to model the four sectors in different ways than what we have done here, for example, allowing unskilled workers to work in the traded sector and skilled workers to work in the non-traded sector. Our analysis provides the theoretical framework to achieve this. Moreover, there is a need to calibrate the theoretical insights into data and simulations to gain further understanding of the magnitude of various effects.
Overall, at a very broad, theoretical, level, it is becoming apparent that traditional models of trade such as the Heckscher-Ohlin model may be inadequate to examine the global trade patterns that emerge as A&AI becomes more prevalent. Our use of the Jones–Manuelli function to capture A&AI represents a continuation of the search for an appropriate theoretical structure that will prove to be useful to pin our thoughts from an international trade perspective. The Jones–Manuelli production function gained popularity in its use in the endogenous growth literature. This link between A&AI technology and endogenous growth has yet to be explored in the literature. The use of the Jones–Manuelli production function to model A&AI provides some guidance of how one may proceed to form this link theoretically.
Data availability statement
The original contributions presented in the study are included in the article/supplementary material, further inquiries can be directed to the corresponding author.
Author contributions
BH: Conceptualization, Formal analysis, and Writing – reviewing & editing. VM: Conceptualization, Formal analysis, and Writing – reviewing & editing.
Conflict of interest
The authors are employed by Lattice Analytics Pty Ltd.
Publisher’s note
All claims expressed in this article are solely those of the authors and do not necessarily represent those of their affiliated organizations, or those of the publisher, the editors and the reviewers. Any product that may be evaluated in this article, or claim that may be made by its manufacturer, is not guaranteed or endorsed by the publisher.
Footnotes
1. ^See https://openai.com/blog/chatgpt (accessed 2nd April 2023).
2. ^See https://www.reuters.com/technology/chatgpt-sets-record-fastest-growing-user-base-analyst-note-2023-02-01/. By comparison, Tik Tok took about 9 months to get to the 100 million user mark, and Instagram took more than two years (see https://www.theguardian.com/technology/2023/feb/02/chatgpt-100-million-users-open-ai-fastest-growing-app, accessed 2nd April 2023).
3. ^These technologies also pose regulatory and public policy challenges, an issue that warrants a monograph of its own and one that we do not attempt to tackle in this study.
4. ^See Silver (1994),Rodgers et al. (1995),Sen (2000), and Levitas (2005) for insights into the general ideas behind social exclusion. Burchardt et al. (2002) attempt to measure social exclusion along four dimensions: consumption, production, political engagement, and social. Hazari and Mohan (2015) use these dimensions as a basis to present a rigorous general equilibrium modeling framework for social exclusion. Their model incorporates consumption, production, and political exclusion. The model developed in this study essentially adapts the general equilibrium framework of Hazari and Mohan (2015) to the context of digital exclusion.
5. ^Bhutan, Cambodia, Djibouti, Lao P.D.R., Lesotho, Mauritania, Myanmar, Sao Tome and Principe, Senegal, and Tuvalu.
6. ^Burundi, Central African Republic, Chad, Democratic Republic of the Congo, Eritrea, Madagascar, Niger, Sierra Leone, Somalia, and South Sudan.
7. ^Coverage gap refers to a situation where access to mobile broadband is limited because the area is not covered by a mobile broadband signal.
8. ^Usage gap occurs because people are not using the Internet even though they are in an area covered by a broadband signal.
9. ^In other words, AI may be used both in the manufacture of and be available in the form of applications (such as ChatGPT) for use by consumers who purchase .
11. ^Essentially tourism results in a distortion, where DRS = DRT ≠ FRT that is, the domestic rate of transformation (DRT) in production does not equal to the foreign rate of transformation (FRT).
References
Acemoglu, D., and Restrepo, P. (2018). The race between man and machine: implications of technology for growth, factor shares, and employment. Am. Econ. Rev. 108, 1488–1542. doi: 10.1257/aer.20160696
Acemoglu, D., and Restrepo, P. (2019). “Artificial intelligence, automation and work” in The economics of artificial intelligence: An agenda. eds. A. Agarwal, J. Gans, and A. Goldfarb (Chicago: The University of Chicago Press)
Aghion, P., Jones, P. E., and Jones, C. I. (2017). “Artificial intelligence and economic growth” in The economics of artificial intelligence: An agenda. eds. A. Agarwal, J. Gans, and A. Goldfarb (Chicago: The University of Chicago Press)
Artuc, E., Bastos, P., and Rijkers, B. (2018). Robots, tasks and trade. World Bank Policy Research Working Paper, number 8674.
Bessen, J. (2019). “AI and jobs: the role of demand” in The economics of artificial intelligence: An agenda. eds. A. Agarwal, J. Gans, and A. Goldfarb (Chicago: The University of Chicago Press)
Brynjolfsson, E., and McAfee, A. (2014). The second machine age: Work, Progress, and prosperity in a time of brilliant technologies. New York: W. W. Norton & Company.
Burchardt, T., Le Grand, J., and Piachaud, D. (2002). “Degrees of exclusion: developing a dynamic multidimensional measure” in Understanding social exclusion. eds. J. Hills, et al. (Oxford: Oxford University Press)
Goldfarb, A., and Trefler, D. (2019). “Artificial intelligence and international trade” in The economics of artificial intelligence: An agenda. eds. A. Agarwal, J. Gans, and A. Goldfarb (Chicago: The University of Chicago Press)
Hargittai, E. (2002). Second-level digital divide: difference in people’s online skills. First Monday 7, 1–14.
Hazari, B., Lai, J., and Mohan, V. (2022). A note on the implications of automation and artificial intelligence for international trade. Arthaniti J. Econ. Theory Pract. 1–11. doi: 10.1177/0976747922112918
Hazari, B., and Mohan, V. (2015). Social exclusion, capital accumulation and inequality. Int. Rev. Econ. Financ. 39, 371–375. doi: 10.1016/j.iref.2015.07.004
Hazari, B., and Ng, A. (1993). An analysis of tourists’ consumption of non-traded goods and services on the welfare of the domestic consumers. Int. Rev. Finan. Econ. 2, 43–58. doi: 10.1016/1059-0560(93)90030-T
Hazari, B., and Nowak, J. J. (2003). Tourism, taxation and immiserization: a trade-theoretic analysis. Pac. Econ. Rev. 8, 279–287. doi: 10.1111/j.1468-0106.2003.00228.x
International Monetary Fund . (2020). Low internet access driving inequality. Available at: https://www.imf.org/en/Blogs/Articles/2020/06/29/low-internet-access-driving-inequality. (Accessed April 02, 2023).
International Telecommunication Union (ITU) . (2021). Connectivity in the least developed countries: status report 2021. Available at: https://www.itu.int/hub/publication/d-ldc-ictldc-2021-2021/ (accessed 2nd April, 2023).
International Telecommunication Union (ITU) . (2022). Facts and figures 2022. Available at: https://www.itu.int/itu-d/reports/statistics/facts-figures-2022/ (accessed 2nd April, 2023).
International Telecommunication Union (ITU) . (2023). Facts and figures: focus on least developed countries. Available at: https://www.itu.int/itu-d/reports/statistics/facts-figures-for-ldc/ (accessed 2nd April, 2023).
Jones, L., and Manuelli, R. (1990). A convex model of equilibrium growth: theory and policy implications. J. Polit. Econ. 98, 1008–1038. doi: 10.1086/261717
Korinek, A., Schindler, M., and Stiglitz, J. E. (2021). Technological progress, artificial intelligence, and inclusive growth. IMF Working Paper WP/21/166. Available at: https://www.imf.org/en/Publications/WP/Issues/2021/06/11/Technological-Progress-Artificial-Intelligence-and-Inclusive-Growth-460695 (accessed 2nd April, 2023).
Korinek, A., and Stiglitz, J. E. (2019). “Artificial intelligence and its implications for income distribution and unemployment” in The economics of artificial intelligence: An agenda. eds. A. Agarwal, J. Gans, and A. Goldfarb (Chicago: The University of Chicago Press)
Levitas, R. (2005). The inclusive society? Social exclusion and new labour. 2nd. Basingstoke: Palgrave Macmillan.
Lutz, C. (2019). Digital inequalities in the age of artificial; intelligence and big data. Hum. Behav. Emerg. Technol. 1, 141–148. doi: 10.1002/hbe2.140
Oxfam (2022). India Inequality Report 2022: Digital Divide. Available at: https://www.oxfamindia.org/knowledgehub/workingpaper/india-inequality-report-2022-digital-divide (accessed 2nd April, 2023).
Rodgers, G., Gore, C., and Figueiredo, J. B. (1995). Social exclusion: rhetoric, reality, responses. Geneva: International Institute for Labour Studies.
Sen, A. (2000). Social Exclusion: Concept, Application and Scrutiny. Social Development Papers No. 1, Asian Development Bank.
Silver, H. (1994). Social exclusion and social solidarity: three paradigms. Int. Labour Rev. 133, 531–578.
Van Deursen, A., and Helsper, E. (2015). “The third-level digital divide: who benefits most from being online?” in Communication and information technologies annual. eds. L. Robinson, S. R. Cotten, J. Schulz, T. M. Hale, and A. Williams (Bingley: Emerald). Availabe at: https://www.emerald.com/insight/publication/doi/10.1108/S2050-2060201510
Keywords: automation, artificial intelligence, AK production function, digital exclusion, production exclusion
Citation: Hazari B and Mohan V (2024) Exclusion and the growth of AI technology: a trade-theoretic analysis. Front. Hum. Dyn. 6:1203664. doi: 10.3389/fhumd.2024.1203664
Edited by:
Arminda Guerra, University of Lisbon, Lisbon, PortugalReviewed by:
Pramode Verma, University of Oklahoma, United StatesAngela Cristina Marques Oliveira, Polytechnic Institute of Castelo Branco, Portugal
Copyright © 2024 Hazari and Mohan. This is an open-access article distributed under the terms of the Creative Commons Attribution License (CC BY). The use, distribution or reproduction in other forums is permitted, provided the original author(s) and the copyright owner(s) are credited and that the original publication in this journal is cited, in accordance with accepted academic practice. No use, distribution or reproduction is permitted which does not comply with these terms.
*Correspondence: Vijay Mohan, dmlqYXkubW9oYW5Ab3V0bG9vay5jb20=