 Mirjam Lanzer
 Tanja Stoll
 Mark Colley
 Martin Baumann
95% of researchers rate our articles as excellent or good
Learn more about the work of our research integrity team to safeguard the quality of each article we publish.
Find out more
ORIGINAL RESEARCH article
Front. Hum. Dyn. , 13 July 2021
Sec. Digital Impacts
Volume 3 - 2021 | https://doi.org/10.3389/fhumd.2021.676667
This article is part of the Research Topic Trust, Safety and Passenger Experience in Intelligent Mobility View all 6 articles
Automated driving in urban environments not only has the potential to improve traffic flow and heighten driver comfort but also to increase traffic safety, particularly for vulnerable road users such as pedestrians. For these benefits to take effect, drivers need to trust and use automated vehicles. This decision is influenced by both system and context factors. However, it is not yet clear how these factors interact with each other, especially for automated driving in city scenarios with crossing pedestrians. Therefore, we conducted an online experiment in which participants (N = 68) experienced short automated rides from the driver’s perspective through an urban environment. In each of the presented videos, a pedestrian crossed the street in front of the automated vehicle while system and context factors were varied: 1) the crossing pedestrian’s intention was either visualized correctly (as crossing) or incorrectly (visualization missing) by the automated vehicle (system factor), 2) the pedestrian was either distracted by using a smartphone while crossing or not (context factor), and 3) the scenario was either more or less complex depending on the number of other vehicles and pedestrians being present (context factor). In situations with a system malfunction where the crossing pedestrian’s intention was not visualized, participants perceived the situation as more critical, had less trust in the automated system, and a higher willingness to take over control regardless of any context factors. However, when the system worked correctly, the crossing pedestrian’s smartphone usage came into play, especially in the less complex scenario. Participants perceived situations with a distracted pedestrian as more critical, trusted the system less, indicated a higher willingness to take over control, and were more uncertain about their decision. As this study demonstrates the influence of distracted pedestrians, more research is needed on context factors and their inclusion in the design of interfaces to keep drivers informed during automated driving in urban environments.
Automated driving has the potential to increase traffic safety (Fagnant and Kockelman, 2015), improve traffic flow (Hoogendoorn et al., 2014), reduce vehicle emissions (Stogios et al., 2019) and heighten driver comfort (Hartwich et al., 2018). However, when automated vehicles move from the highway into the cities, they face new challenges. While interaction partners on highways are limited to other motorized road users, in urban areas, automated vehicles have to interact with vulnerable road users such as pedestrians or cyclists (Holländer et al., 2021). In contrast to vehicles, pedestrians are more flexible and can, for example, move outside their designated areas or quickly change their direction by turning on the spot. This makes their behavior more difficult to predict for automated vehicles (Kooij et al., 2019). Nonetheless, especially in the city context, automated driving can greatly benefit pedestrian safety (Utriainen, 2021). When analyzing pedestrian-vehicle accidents, up to 73% of accidents could have been avoided with automated driving (Utriainen, 2021). Other researchers modeled that if all vehicles were equipped with an automatic emergency braking system, both the fatality risk and the injury risk of pedestrians could be decreased drastically by up to 87% (Haus et al., 2019). However, these advantages can only come into play when automated vehicles are understood, trusted, and used (Walch et al., 2017). Survey data from 5,000 people in over 100 countries revealed that the respondents have concerns about automated driving such as misuse, legal issues, and safety (Kyriakidis et al., 2015). A recent study by Deloitte (2021) shows that just under half of the respondents from various countries consider the technology as unsafe, and the numbers have even risen in India and China in the last years. Perceived safety and trust were shown to predict people’s intention to use an automated vehicle (Zoellick et al., 2019). As trust plays an essential role in the decision to use automation (Muir and Moray, 1996), it is relevant to know the influencing factors and how they interact with each other.
According to Lee and See (2004), factors that influence trust in automation include, among others, interface features, a person’s predisposition to trust, the perceived risk, or time constraints. System-side factors that have been shown to impact drivers’ trust are reliability (Forster et al., 2018; Li et al., 2019), transparency (Kraus et al., 2020; Kunze et al., 2019), the automated vehicle’s behavior when reaching system limits (Hergeth et al., 2015; Gold et al., 2015; Kraus et al., 2020), or the occurrence of system malfunctions (Kraft et al., 2020; Kraus et al., 2020; Seet et al., 2020). While the former can be considered in the vehicle design, malfunctions are “sudden, unpredicted errors related to a system’s reliability within its area of application” (Kraus et al., 2020, p. 718). In contrast to system limitations where the system enters conditions it was not designed for and can initiate a request to the driver to take over control, with a system malfunction, drivers have no indication that a failure may occur and, thus, cannot prepare for it. In case of a system malfunction, drivers are slower to put their hands on the wheel and need longer to take over control compared to reacting to a system limit (DeGuzman et al., 2020). Thus, system malfunctions can lead to more severe consequences compared to system limits. They also affect trust ratings which were significantly lowered by a system malfunction but not by a system limit (Lee et al., 2020). Drivers’ trust decreased temporarily after experiencing a system malfunction and recovered again after subsequent error-free interaction (Kraft et al., 2020; Kraus et al., 2020). This was demonstrated in simulator studies where the automated vehicle was either overtaking other vehicles (Kraus et al., 2020), merging onto the highway (Kraft et al., 2020) or making a left turn (Kraft et al., 2020). While these studies show the effect of a system malfunction on drivers’ trust, the driving scenarios that were used took place outside the city on the highway or rural roads. The driving simulator study conducted by Seet et al. (2020) took place in a city context but no vulnerable road users were involved. Instead, participants were driving either fully or partially automated through intersections where malfunctions consisted of the automated vehicle not decelerating properly. In fully automated driving, trust was significantly lower after experiencing a malfunction. During conditional automation, this decrease in trust did not appear after a malfunction. However, participants in this condition were able to take over control and did so significantly more often to avoid danger. Thus, system malfunctions seem to influence drivers’ trust and their takeover willingness. In our study, we want to investigate what impact system malfunctions have in an urban context where automated vehicles interact with more vulnerable road users such as pedestrians.
Besides system factors such as malfunctions, environmental factors also impact drivers’ perception, takeover behavior, and takeover performance in automated driving. However, there is much less research on these contextual factors. The criticality of the situation and the scope of action, manipulated by the number of lanes or the available time for a driver to act, are context factors that influence driver’s behavior in manual driving (Heesen et al., 2012; Stoll et al., 2020a; Stoll et al., 2020b) and takeover scenarios (Wu et al., 2019) as well as the acceptance of behavior choices of an automated vehicle (Stoll et al., 2021). With reducing the scope of action, the situation was perceived as more critical (Stoll et al., 2020b) and the acceptance of automated behavior increased (Stoll et al., 2021). When the criticality of the situation was higher, takeover time was shorter, and takeovers were more critical and unsafe, which was reflected in a shorter time to collision to the front vehicle (Wu et al., 2019). Another context factor that was explored more extensively in the literature is the complexity of the situation, which is often associated with the traffic density in a scenario. A higher traffic density in a highway scenario was rated as more complex and critical by drivers of a driving simulator study (Radlmayr et al., 2014) and also impacted their takeover performance. Participants displayed longer takeover times and a lower takeover quality (e.g., not keeping enough safety distance, acting hesitantly, or not performing control glances), resulting in more critical takeovers when the situation’s complexity was higher (i.e., more traffic) in a highway scenario (Gold et al., 2016; Scharfe et al., 2020). This, in turn, can lead to an increase in uncertainty as it “occurs where the decision-maker has to estimated or infer the probabilities of the various outcomes happening” (Beresford and Sloper, 2008, p. 15). With an increasing number of interaction partners and possible interactions, decision uncertainty among drivers might increase. While these studies show how context factors have an influence in highway scenarios, this has not been studied yet in an urban environment. As Tanshi and Söffker (2019) mentions, the complexity of a situation increases not only with the number of surrounding vehicles but also pedestrians, as more interactions are then possible.
In an urban environment, not only the number of pedestrians is relevant but also their behavior. Pedestrians signalize their intention to cross a street by standing close to the curb, looking at the oncoming traffic, or making eye contact with the driver (Sucha et al., 2017). Pedestrians’ gaze behavior seems to be particularly decisive, as in 90% of crossings, some form of attention toward oncoming traffic was present (Rasouli et al., 2017). However, there are some factors that reduce pedestrians’ gazes toward traffic, such as traveling in a group (Lanzer and Baumann, 2020; Dommes et al., 2015; Pešić et al., 2016) or using a smartphone during the crossing (Vollrath et al., 2019; Solah et al., 2016). Especially the latter has led to an increase in smartphone-related accidents among pedestrians in recent years (Nasar and Troyer, 2013; Ren et al., 2021). Between 8 (Zhou et al., 2019) and 42% (Wells et al., 2018) of pedestrians were observed to cross the street while using a smartphone depending on the country and observation site, with most studies ranging from 20 to 30% (Vollrath et al., 2019; Solah et al., 2016; Horberry et al., 2019; Thompson et al., 2013; Piazza et al., 2020; Fernandez et al., 2020). Among all smartphone-related activities, a systematic review across 14 studies found that texting has the largest effects on pedestrians’ behavior (Simmons et al., 2020). In a study by Jiang et al. (2018), only 5% of pedestrians’ gazes were directed toward the surrounding traffic area when texting on the phone while crossing at a signalized crossing. This was significantly lower compared to talking on the phone, listening to music, or being undistracted. When pedestrians are visually distracted and less observant of traffic, they do not communicate their intention clearly and the driver cannot know if the pedestrian has noticed the vehicle and will react accordingly. As automated vehicles use pedestrians’ head orientation and gazes when predicting their paths (Kooij et al., 2019), distracted pedestrians can propose a source of uncertainty. This can lead to a more critical perception of the situation and a decrease in drivers’ trust in the automated vehicle to handle the situation correctly. However, distracted pedestrians have not been examined yet from a driver’s perspective, neither in manual nor automated driving. In manual driving, video-recorded situations with pedestrians are perceived as more hazardous and critical (Finn and Bragg, 1986; Borowsky and Oron-Gilad, 2013) especially when drivers are inexperienced. For automated driving, recent studies have shown that in situations with pedestrians, drivers have a high need for information regarding the system’s behavior (Wiegand et al., 2020; Wintersberger et al., 2020). Around 70% of drivers in a thinking-aloud driving simulator study requested an explanation for the automated vehicle’s stopping behavior in a situation where a child unexpectedly ran across the street (Wiegand et al., 2020). When participants were asked to identify objects in videos of urban driving scenes that an automated vehicle should inform them about, high priority was given to pedestrians near or on the road (Wintersberger et al., 2020). When asked why, participants indicated that feedback from the automated vehicle is particularly important when predictability is low, such as when a pedestrian exhibits ambiguous behavior about whether or not they will cross a street. Furthermore, a near-miss situation between pedestrian and automated vehicle was perceived as riskiest and trust was lowest among participants compared to other urban driving scenes (Wintersberger et al., 2020). A virtual reality study by Colley et al. (2020) shows the importance of visualizing pedestrians and their intentions in crossing scenarios to the driver of an automated vehicle. When pedestrians were recognized by the automated vehicle and their intentions (crossing or not crossing the street) were visualized to the driver, the trust in the automated vehicle increased compared to a baseline where the vehicle behaved in the same way but did not visualize anything. Both the transparency of the system and the visualization mode had an influence on drivers. A system that was more transparent and used augmented reality, compared to a tablet-based visualization, was preferred by drivers and rated as reasonable and necessary (Colley et al., 2020).
In the current study, we want to examine how system and context factors influence the drivers’ decision to trust and use an automated vehicle in city scenarios with crossing pedestrians. Derived from the literature, we hypothesize that a system malfunction leads to lower trust, higher perceived criticality of the situation, and a higher willingness to take over control (H1). As for the situation’s complexity, we assume that a more complex situation leads to a higher perceived criticality and more uncertainty in the decision of whether to take over control (H2). Lastly, a distracted pedestrian who is crossing the street looking at a smartphone leads to higher perceived criticality of the situation, lower trust in the automated vehicle, and a higher willingness to take over control (H3). Since there are no studies yet on the interaction of system and context factors, this is looked at exploratively.
Overall, 68 people took part in the study. Three participants were excluded before data analysis as they were not able to watch all videos correctly due to technical issues. The remaining 65 participants consisted of 34 men and 31 women. Participants’ age ranged from 18 to 60 years (M = 28.54 years, SD = 11.24 years). Regarding the participants’ highest level of education, about half of them (49.2%) held an Abitur (German university entrance diploma), followed by around one third of participants (35.4%) holding a university degree, and the remaining 15.4% held degrees from secondary modern schools. All participants held a valid driver’s license with 39.6% possessing their license between three to five years, 29.2% between ten to twenty years, and 15.4% between five and ten years. The remaining participants held their licenses either longer than thirty years (12.3%) or less than three years (6.2%). The majority of participants (75.4%) drove at least once a week, with 24.6% driving daily. Participants drove on average 7,686.3 km during the past year (SD = 7,842.7 km) with a range from 0 to 40,000 km annually. Around one-fifth (21.5%) of participants were involved in an accident as a driver in the past five years, with one participant being injured.
Participants were recruited via University mailing lists, the Department’s participant database, and social media. In order to be able to participate, people were required to hold a valid driver’s license and be German native speakers. Participants were compensated with course credit or had the chance to win one of ten 10€ vouchers for a bookstore.
The automated vehicle displayed in this study was equipped with a system to visualize pedestrians’ intention like the one used by Colley et al. (2020). Within a radius of 35 m, every pedestrian was detected by the system and a circle was displayed above the pedestrian’s head using augmented reality (Figure 1A). To visualize the pedestrian’s intention, this circle took one of three colors when the pedestrian came within a radius of 30 m to the vehicle. The circle was colored dark blue if the pedestrian’s intention is to cross the street (Figure 1D), light blue if the pedestrian’s intention is to stay on their side of the street and not cross (Figure 1C) and yellow if the pedestrian was recognized but their intention is still unclear (Figure 1B). The proposed categorization is based on related work in intention prediction, for example, Ghori et al. (2018) propose to detect the classes crossing, stopping, starting and turning, and walking along. Newer work by Mordan et al. (2020) classifies road crossing intention either as binary or continuous (i.e., time-to-crossing). The chosen radius is based on the vision-based approach to detect pedestrians’ intentions in automated vehicles presented by Fang et al. (2017). Visualizing the intention via an AR windshield display is still technically challenging, however, numerous manufacturers and researchers are working on such technology such as Panasonic (Szymkowski, 2021). Also, using AR is based on previous research indicating the benefits of this technology (Colley et al., 2021). The scenarios in this study were created using Unity Software (Unity Technologies, 2019a) and the asset Windridge city (Unity Technologies, 2019b).
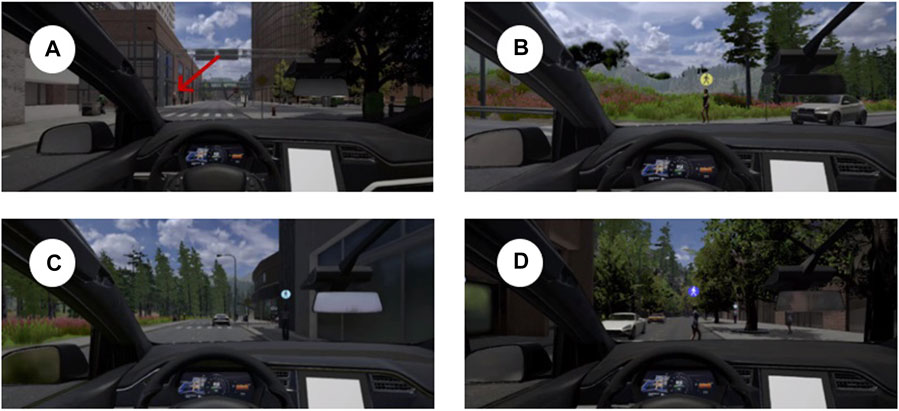
FIGURE 1. System states for visualizing pedestrians’ intention, (A) circle not colored when pedestrian is recognized but still too far away, (B) yellow circle when pedestrian is recognized but intention is unclear, (C) light blue circle when pedestrian is recognized and intention is clear: “stay,” (D) dark blue circle when pedestrian is recognized and intention is clear: “cross.”
To evaluate the impact of system and context factors on drivers’ perception and behavior, a 2 × 2 × 2 within-subjects design was used. The three independent variables were split into one system factor and two context factors. For the system factor, we manipulated whether a malfunction in the visualization of pedestrians’ intention occurred or not. The system either visualized a crossing pedestrian correctly and displayed a dark blue circle above the person’s head (Figure 2A) or a crossing pedestrian was visualized incorrectly and the circle was missing (Figure 2B). For the context factor, we manipulated whether the crossing pedestrian was distracted by looking at a smartphone (Figure 2B) or not (Figure 2A) and whether the scenario was more (Figure 2A) or less (Figure 2B) complex depending on the number of other vehicles and pedestrians being present. In the more complex scenario, the participant’s vehicle passed two vehicles in the oncoming lane before encountering the crossing pedestrian. A vehicle in the opposite lane also stopped for this pedestrian to cross. There were 15 additional pedestrians walking on both sides of the street but not crossing. In the less complex scenario, only one vehicle was driving way ahead of the participant’s vehicle, and there were no other pedestrians except for the crossing one. In both scenarios, the participant’s vehicle was driving with a speed of up to 30 km/h. As for environmental factors, both scenarios took place in daylight conditions and on a street with a slight right turn. The pedestrian crossing the street was on the right sidewalk and crossed without any supporting infrastructure, such as a crosswalk at a distance of 7.7 m from the participant’s vehicle in both scenarios. The full factorial design resulted in eight scenarios that were shown to pedestrians as approximately 20-second long video scenes from the perspective of the driver of an automated vehicle. Four additional videos that acted as filler scenarios were shown to the participants, which also included a crossing pedestrian. Simulated videos were chosen as they are a suitable tool to allow good controllability and standardization of scenarios for all participants. Videos of real or simulated traffic scenes are a commonly used method in traffic psychology (Borowsky and Oron-Gilad, 2013; Stoll et al., 2019; Wintersberger et al., 2020; Colley et al., 2021) that have shown similar results to studies in real traffic (Hughes and Cole, 1986). Compared to real-world traffic videos, simulated videos do not have privacy issues that require pixelation of pedestrian faces or complete recreation of scenes with instructed pedestrians.
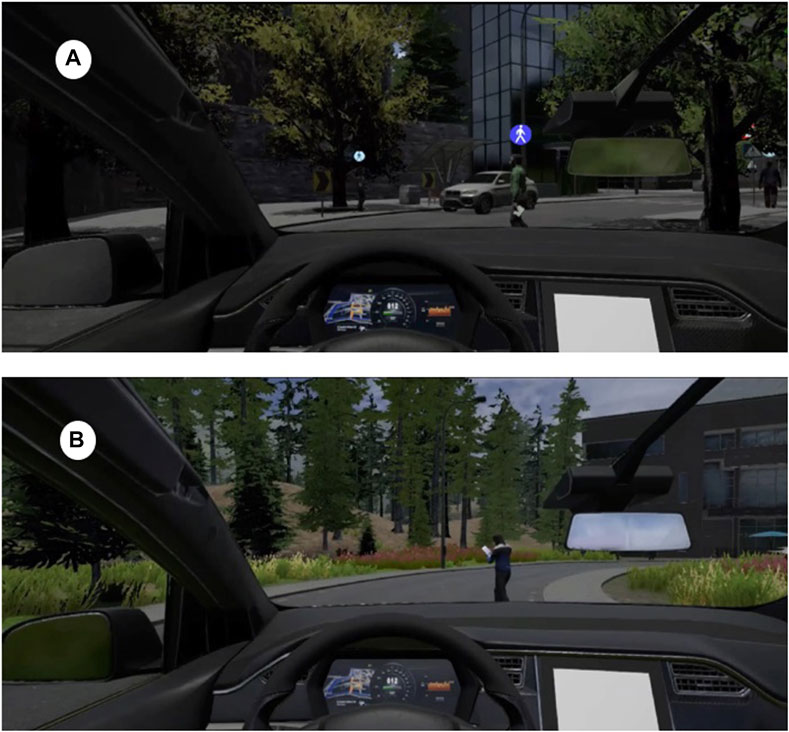
FIGURE 2. Example scenarios for the three independent variables, (A) no malfunction, system working correctly and displaying a dark blue circle above the crossing pedestrian’s head (system factor: no malfunction), the crossing pedestrians is not using a smartphone (context factor: no distraction), and other vehicles and pedestrians are present (context factor: situation complexity high) (B) malfunction of the system, no circle is displayed above the crossing pedestrian’s head (system factor: malfunction), the crossing pedestrian is using a smartphone (context factor: distraction), and no other vehicles and pedestrians are present (context factor: situation complexity low).
After each scenario, participants were asked about their willingness to take over, the certainty of their decision, the criticality of the situation, and their trust in the automated system. First, participants rated how likely they would have initiated a takeover in the presented scenario on a scale from 0 to 100% by using a slider. Afterward, they were asked how certain they were in this decision on a 10-point Likert scale ranging from “very uncertain” to “very certain”. Next, they could explain the reasoning behind their decision in an open question. They were also asked how they would have acted if they had taken over control (three response options were provided: drive slower, brake sooner, brake stronger) along with an open answer possibility. Alternatively, they could select that they would not have taken control and, therefore, would not have acted differently. After providing details about the participants’ takeover behavior, they rated the criticality of the situation on a 10-point Likert scale ranging from “not critical at all” to “very critical.” Lastly, the trust in the automated system was assessed by the German version (Kraus et al., 2020) of the Trust in Automation Scale (Jian et al., 2000). The scale consists of seven items that participants can react to on a 7-point Likert scale with two poles (1 = “do not agree at all” and 7 = “completely agree”). The complete questionnaire can be found in the Supplemental Materials.
Data was collected online using the survey platform Unipark. After being informed about the course of the study and providing informed consent, demographic data was collected. This included participants’ age, gender, usual driving behavior (frequency of driving, mileage last year, and average mileage), duration of driver’s license possession, and accident history in the past five years. Then the automated system was introduced to the participants with pictures and explanations of the visualization system for pedestrians’ intentions and a short video. It was explained that the vehicle drives automatically by taking over longitudinal and lateral control, so no intervention from the participants’ side was necessary. In addition, participants were told that the automated vehicle also has an emergency braking assistant and would brake automatically should a dangerous situation arise or an obstacle appear in front of the vehicle. Afterward, participants answered short questions to check whether they understood the system’s functions. Then, the twelve video scenes were shown in randomized order followed by the questionnaires after each video. Lastly, a German version (Vöhringer-Kuhnt and Trexler-Walde, 2009) of the Driver Behavior Questionnaire (Reason et al., 1990) was administered and participants could comment on the study and choose their preferred compensation (course credit or voucher raffle). On average, the study lasted for about 45 minutes per participant.
For each dependent variable, a three-way repeated-measures ANOVA with the factors system malfunction (yes/no), the crossing pedestrian’s smartphone use (yes/no), and the situation’s complexity (high/low) was calculated using R (version 4.0.4). Repeated-measures ANOVAs were chosen since participants answered multiple times due to the within-subjects design, the independent variables were factorial and the dependent variables were metric (Field et al., 2012). In case simple effects were needed, two-way repeated-measures ANOVAs with the factors system malfunction and pedestrian’s smartphone use were calculated for the more complex and the less complex situation separately. Then, Bonferroni-adjusted t-tests were calculated to reveal differences between two specific groups (Field et al., 2012).
Takeover willingness (Figure 3) ranged between 0 and 100, with higher values representing a higher willingness to take over. It was higher when there was a system malfunction (M = 47.01, SD = 36.02) compared to no malfunction (M = 25.73, SD = 28.98), slightly higher when the crossing pedestrian was using a smartphone (M = 38.44, SD = 34.37) compared to not (M = 34.30, SD = 34.28) and almost similar for the less (M = 36.02, SD = 34.73) and more complex (M = 36.72, SD = 34.03) scenario. Inferential analyses revealed a statistically significant three-way interaction between system malfunction, the pedestrian’s smartphone use, and the situation’s complexity [F(1,64) = 4.70, p = .034]. Thus, we analyzed the more and less complex situations separately. For the more complex situation, only the main effect of system malfunction was significant [F(1,64) = 26.13, p
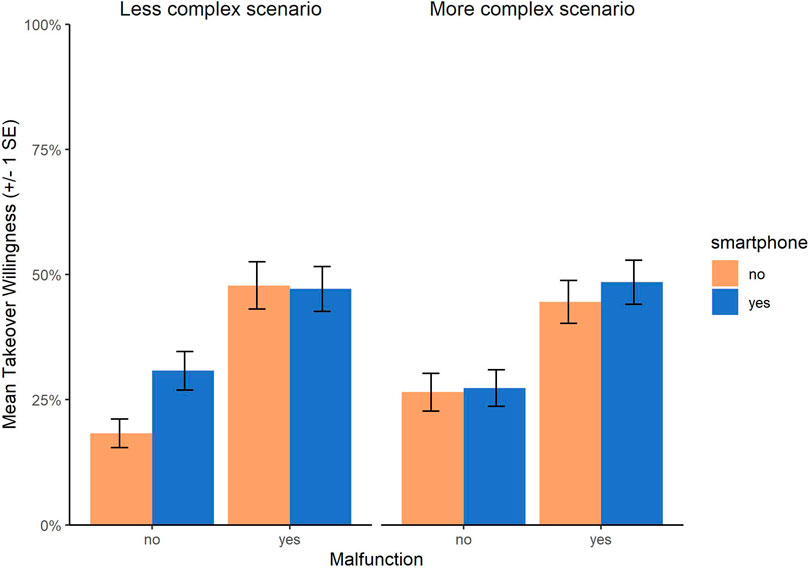
FIGURE 3. Takeover willingness by system malfunction, crossing pedestrian’s smartphone use, and scenario complexity. Error bars represent standard errors. Higher ratings represent a higher willingness to take over. For results of significance tests, see text.
Decision certainty (Figure 4) ranged between 1 and 10 with higher values corresponding to a more certain decision. Participants were slightly more uncertain when the crossing pedestrian was using a smartphone (M = 7.69, SD = 2.31) compared to not (M = 7.89, SD = 2.21). Values were almost similar for a system malfunction (M = 7.71, SD = 2.30) compared to no malfunction (M = 7.87, SD = 2.22) and for the more (M = 7.79, SD = 2.17) and less (M = 7.79, SD = 2.36) complex scenario. The three-way repeated-measures ANOVA revealed a significant two-way interaction between the pedestrian’s smartphone use and the situation’s complexity [F(1,64) = 4.90, p = .030]. Thus, we analyzed the two situations separately. For the more complex situation, there were no significant main or interaction effects. However, a significant main effect of pedestrian’s smartphone use was found in the less complex situation [F(1,64) = 4.90, p = .027]. Participants were less certain about their decision when the crossing pedestrian was using a smartphone compared to not using one.
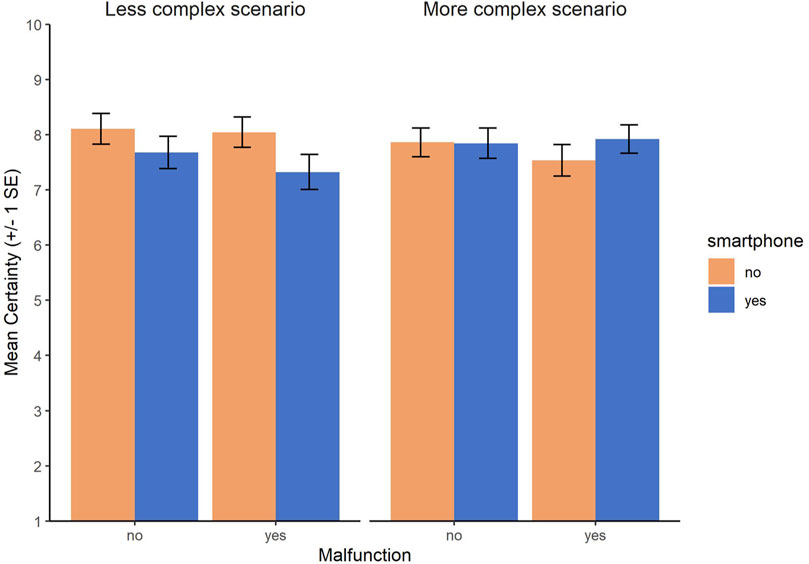
FIGURE 4. Decision certainty by system malfunction, crossing pedestrian’s smartphone use and scenario complexity. Error bars represent standard errors. Higher ratings represent a more certain decision. For results of significance tests, see text.
Participants were also asked about any alternative actions such as braking sooner or driving slower that they would perform when they would take over control. Alternatively, they could state that they would not perform a takeover. Results for takeover decision and alternative actions can be seen in Figure 5. The decision to take over control (represented by the bar plots in Figure 5) is in line with the results for takeover willingness. When a system malfunction occurred, more participants would take over control regardless of situational factors. For the less complex scenario, there was also an effect of the crossing pedestrian’s smartphone use. When the system was working correctly, participants would take over control more often when the crossing pedestrian was using a smartphone (47% takeover rate) compared to when not (20% takeover rate). With regards to alternative actions (represented by the pie charts in Figure 5), participants preferred to brake sooner in the more complex scenario regardless of the system’s functionality and the pedestrian’s smartphone usage. In the less complex scenario, alternative actions were more balanced between braking sooner, braking stronger, and driving slower. When a malfunction occurred, more participants stated that they would perform several alternative actions such as driving slower and braking sooner. Participants were also able to write down reasons for their decision for or against a takeover. When participants decided in favor of a takeover and a system malfunction occurred, the malfunction was mentioned in an average of 61.3% of answers. This ranged from 51.3% in the less complex scenario and without the crossing pedestrian using a smartphone to 73.2% in the more complex scenario and with the crossing pedestrian using a smartphone. When participants mentioned the system malfunction, they said that “the visualization was missing” [P59], “there was no dark blue circle above the pedestrian’s head” [P67] or “the symbol was not depicted by the system” [P66]. When participants decided for a takeover and the crossing pedestrian was using a smartphone, in an average of 9.9% of answers, it was mentioned that the pedestrian was distracted. This ranged from 6.7% in the less complex scenario without a malfunction to 14.6% in the less complex scenario with a malfunction. Participant 6 explained that “since the person crossing the street was looking at their smartphone, I wouldn’t be sure if the system would recognize their intention.” and participant 50 stated that “I would have taken control because it was easy to see that the individual was reading something and thus was distracted from the traffic.” Especially in the less complex scenario when the system worked correctly but the crossing pedestrian was using a smartphone, in 23.3% of answers of participants who decided to take over control, it was mentioned that the pedestrian crossed unexpectedly (average across all situations where the pedestrian was using a smartphone: 8.3%). Participant 26 explains their decision for a takeover that it was a “sudden decision of the pedestrian looking at the smartphone.” The complexity of the situation as a takeover reason was only mentioned sporadically by single individuals (overall six times) such as by participant 35: “There were a lot of pedestrians on the road, some of whom were recognized late.” or participant 52: “Unclear situation, I would probably have driven a little slower.”
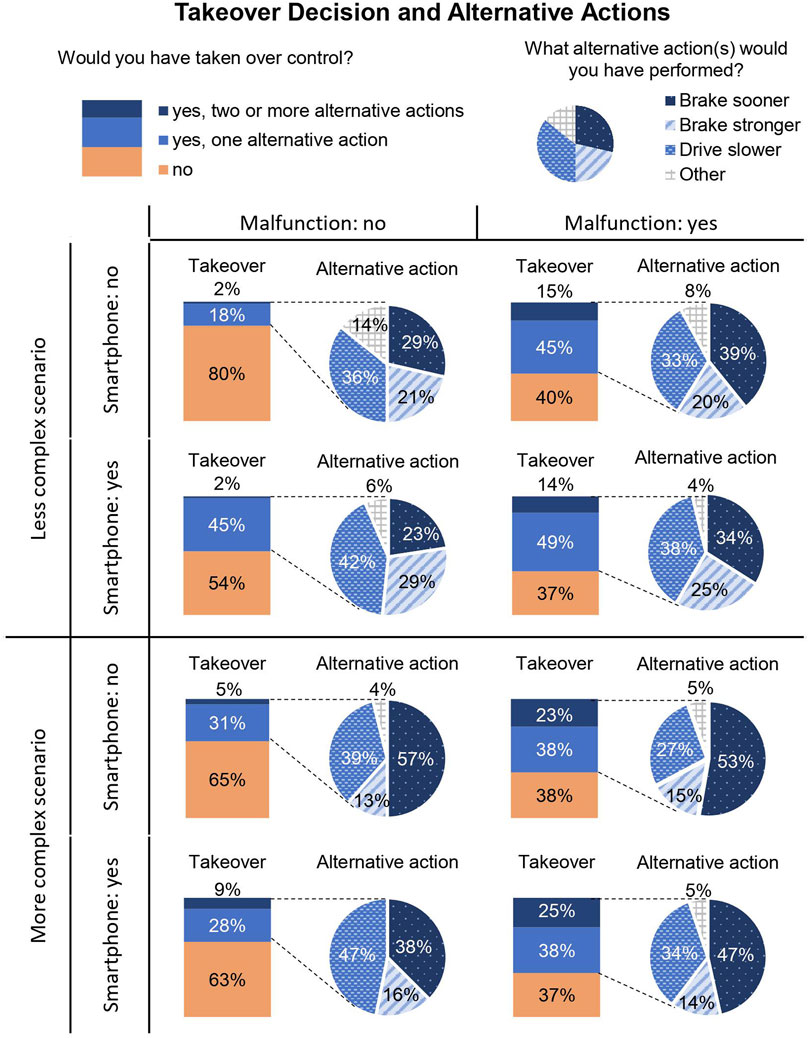
FIGURE 5. Takeover decision and alternative actions by system malfunction, crossing pedestrian’s smartphone use and scenario complexity.
The perceived criticality ratings (Figure 6) ranged from 1 to 10, with higher numbers representing a higher perceived criticality. Situations were perceived as more critical when a system malfunction occurred (M = 5.77, SD = 2.84; without malfunction: M = 4.23, SD = 2.71) and when the crossing pedestrian was using a smartphone (M = 5.14, SD = 2.93; without a smartphone: M = 4.86, SD = 2.83). Criticality ratings were almost similar for the more (M = 5.02, SD = 2.75) and less (M = 4.98, SD = 3.01) complex scenario. For inferential analyses, the three-way repeated-measures ANOVA only revealed a significant main effect of system malfunction [F(1,64) = 30.28, p
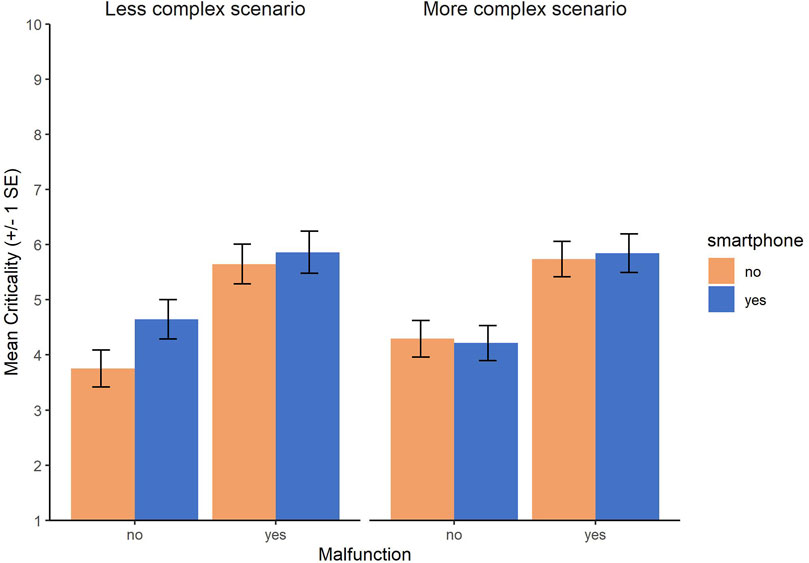
FIGURE 6. Perceived criticality by system malfunction, crossing pedestrian’s smartphone use, and scenario complexity. Error bars represent standard errors. Higher ratings represent a higher perceived criticality. For results of significance tests, see text.
The trust scale values (Figure 7) ranged from one to seven, with higher values representing higher trust. Trust was lower when a system malfunction occurred (M = 4.34, SD = 1.45) compared to no malfunction (M = 4.76, SD = 1.42). Values were almost similar when the crossing pedestrian was using a smartphone (M = 4.52, SD = 1.44) compared to no smartphone (M = 4.58, SD = 1.47) and in the more (M = 4.56, SD = 1.42) and less (M = 4.54, SD = 1.48) complex scenario. The three-way repeated-measures ANOVA revealed a significant two-way interaction between system malfunction and the pedestrian’s smartphone use [F(1,64) = 4.72, p = .034]. As the descriptive statistics indicated that the crossing pedestrian’s smartphone usage had an influence in the less but not the more complex scenario, we analyzed the two situations separately. For the more complex situation, we only found a significant main effect of system malfunction [F(1,64) = 24.06, p
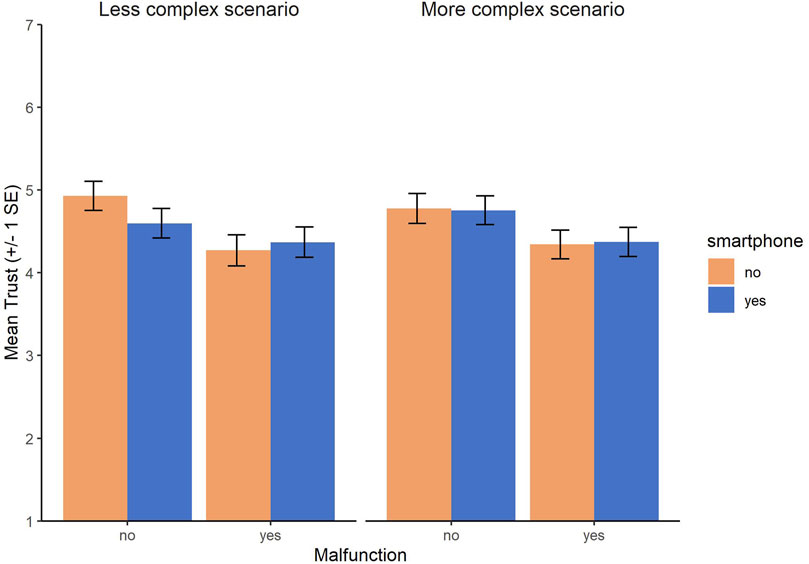
FIGURE 7. Trust by system malfunction, crossing pedestrian’s smartphone use, and scenario complexity. Error bars represent standard errors. Higher ratings represent higher trust. For results of significance tests, see text.
In this study, we examined the influence of system and context factors on drivers’ takeover willingness, decision uncertainty, perceived criticality, and trust in an automated vehicle that drove through urban environments encountering crossing pedestrians. On the system side, we varied whether a system malfunction occurred, and on the context side, we varied whether the crossing pedestrian was distracted by a smartphone and how complex the situation was depending on the number of other road users. We assumed a higher perceived criticality of the situation, lower trust in the automated vehicle, and a higher takeover willingness when a system malfunction occurred (H1) and when the crossing pedestrian used a smartphone (H3). Furthermore, we hypothesized that a more complex situation would lead to a higher perceived criticality of the situation and more decision uncertainty regarding takeover (H2). Interactions between system and context factors were considered exploratively.
A system malfunction was implemented as a visualization error regarding the crossing pedestrian. When the malfunction occurred, participants perceived the situation as more critical, had lower trust in the automated vehicle, and displayed a higher willingness to take over control, supporting H1. This is in line with previous research that shows the negative effect of a system malfunction on drivers’ trust (Kraft et al., 2020; Kraus et al., 2020) alongside a higher takeover rate (Seet et al., 2020). Compared to previous research that focused on highway scenarios, this study demonstrated a similar result pattern in an urban environment involving crossing pedestrians. A system malfunction did not affect drivers’ certainty in their decision to take over control. When a malfunction is recognized as such by drivers, this may facilitate their decision to take over control. In this study, the system malfunction was very low risk since it only consisted of a visualization error and at no point, a dangerous situation for the crossing pedestrian developed because the automated vehicle decelerated in a safe manner in all scenarios (in case of a visualization error due to the emergency brake assistant that was part of the automated vehicle). Even though this was the case, the system malfunction still had a distinct and consistent influence on drivers. With more severe malfunctions, even stronger effects can be expected.
Two context factors were varied in this study: the visual distraction of the crossing pedestrian due to a smartphone and the complexity of the situation depending on the number of other road users. The more complex situation was not generally considered to be more critical and decision certainty was not lower, thus not supporting H2. However, when comparing the more and less complex situation, results were similar regarding the system malfunction but different regarding the crossing pedestrian’s smartphone usage. While the system malfunction led to higher perceived criticality, lower trust in the automated vehicle, and a higher takeover willingness in both situation complexities, the distracted pedestrian only had an influence in the less complex situation. Here, the situation was perceived as more critical (partially supporting H3), and drivers were more uncertain in their decision whether to take over or not when the pedestrian was looking at the smartphone during the crossing. This adds to previous findings where situations involving pedestrians were generally perceived as more critical by drivers (Finn and Bragg, 1986; Borowsky and Oron-Gilad, 2013; Wintersberger et al., 2020). For takeover willingness and trust, there were significant interactions with the system malfunction. When the system did not visualize the crossing pedestrian correctly, it did not matter whether the pedestrian was visually distracted or not. However, when the system worked correctly, drivers’ trust in the automated vehicle was lower and their takeover willingness higher when the pedestrian was using a smartphone during the crossing (partially supporting H3). This means that situational factors like a visually distracted pedestrian do influence the drivers’ perception of the situation and the actions they would take. However, this influence is not uniform across other system and context factors (as stated in H3) but is more complex with interactions between these factors. Although the system worked correctly, it was trusted less to properly handle the situations with a distracted pedestrian. When drivers then decide to take over, more dangerous situations might arise than when the automated system would remain engaged. This should be considered when providing information about the automated vehicle’s behavior to drivers. In our study, information about the correct identification and classification of the distracted pedestrian’s intention seemed to be not enough for drivers since takeover willingness increased. Explanations about the system’s behavior have been shown to increase drivers’ trust (Du et al., 2019) and lower drivers’ takeover willingness (Hock et al., 2016). An explanation specifically tailored to the distraction of the pedestrian or the system’s behavior (e.g., informing drivers about a decelerating maneuver) might help in such situations and should be looked at in future work. Comparing these results to previous studies that looked at automated driving in urban environments, overall trust levels were similar to those found by Colley et al. (2020) and Wintersberger et al. (2020). These studies also used urban scenarios with crossing pedestrians but did not experimentally control for situational influencing factors. However, lower trust, and higher perceived risk were also found in an especially critical situation where the vehicle did not yield for a pedestrian who was already crossing the street (Wintersberger et al., 2020). As this study systematically varied context factors, it provides new evidence that these effects on perceived criticality and trust can be attributed to specific characteristics of the situation, such as smartphone use by a crossing pedestrian. From a pedestrian perspective, the impact of a distracted driver of an automated vehicle has already been studied. When the driver was distracted (e.g., reading a newspaper or talking on the phone), pedestrians showed a decreased willingness to cross (Lundgren et al., 2017) or felt less safe when crossing in front of the automated vehicle (Faas et al., 2021).
There are some limitations to this study. In this online experiment, we measured takeover willingness which may not necessarily reflect takeover behavior displayed in a driving simulator or real vehicle. However, there are indications that results from online studies are comparable to results from other data collection methods (Hock et al., 2019). While the decision whether to take over or not might be similar in both online and lab settings, with the present data, no conclusions can be drawn about the takeover quality or the point in time at which drivers would potentially take over. As results indicated differences in takeover willingness, future studies should look more into how takeovers would take place using methods such as VR or driving simulators that allow more interactivity between participant and automated system. In addition, real-world scenarios can be difficult to assess both for human drivers and, most likely, for algorithms as well. Coupled with imperfect visualization technology (e.g., AR), we hypothesized that there will be errors in visualizing pedestrian intention. While our assumptions were sound and we employed a systematic approach in varying the correctness of the visualization, further investigation within a real vehicle is necessary. However, since this is a safety-critical topic, more research should be done in a laboratory or driving simulator setting before it can be tested in a real world setting. Moreover, the results obtained in this study are based on subjective measurements. Future studies should include more objective measurements to strengthen the results. For instance, physical indicators such as skin conductivity and heart rate metrics could be used to measure the perceived criticality as studies have found that these are closely correlated with driver’s stress level (Healey and Picard, 2005). To better understand why the effect of the crossing pedestrian’s distraction differed in the two situation complexities, more qualitative data should be gathered. Even though participants could state a reason for their decision, they were not instructed to mention all factors that influenced them in the respective scenarios. Methods like the thinking aloud technique (Grahn et al., 2020) could help to clarify which aspects of a situation led to the participants’ decision and make the decision process more visible. Furthermore, future work should examine in more detail what information an automated vehicle should provide to drivers concerning context factors in urban environments with crossing pedestrians. Additional information regarding the distraction of the crossing pedestrian or the complexity of the situation might be helpful to reduce the perceived criticality, increase drivers’ trust, and ultimately lower takeover willingness. Explanations or other feedback could help drivers to keep the automation engaged (Hock et al., 2016) and, thus, profit from the benefits automated vehicles can have in urban environments. Lastly, this study highlights how system and context factors interact with each other. As only a limited number of these factors were considered in this study, future research should examine further system and context aspects. On the system side, this could be an incorrect visualization of pedestrians’ intentions as not crossing instead of a complete lack of visualization or varying the reliability of the visualization system depending on the number of cases it works correctly. On the context side, this could be other distractions of crossing pedestrians such as talking instead of texting on the phone, talking to others in a group, or, more generally, the interaction partner itself (e.g., a child crossing vs. an adult crossing).
Automated driving in urban areas can increase the safety of vulnerable road users when the automation is trusted and used by drivers. However, there is a lack of studies on how system and context factors influence drivers of automated vehicles, especially in scenarios with crossing pedestrians. In an online experiment, it was examined what impact a system malfunction, the situation complexity, and the visual distraction of a crossing pedestrian have on the drivers’ perceived criticality of the situation, their trust in the automated system, their takeover willingness, and the decision certainty. Regardless of context factors, a system malfunction led to higher perceived criticality, lower trust, and higher takeover willingness supporting findings from previous studies conducted in highway scenarios. A more complex situation in itself had no impact, only in combination with the visually distracted pedestrian. In the less complex situation, drivers perceived the situation to be more critical and were less certain in their decision when the crossing pedestrian was using a smartphone. Furthermore, when the system was working correctly, drivers displayed a lower trust and a higher takeover willingness in situations with distracted pedestrians. Therefore, context factors play a role in the drivers’ perception and actions and should be considered when providing information about the automated vehicle’s behavior to drivers.
The raw data supporting the conclusions of this article are available on request to the corresponding author.
Ethical review and approval was not required for the study on human participants in accordance with the local legislation and institutional requirements. The patients/participants provided their written informed consent to participate in this study.
ML, TS, and MB contributed to conception and design of the study. ML and MC were responsible for software and materials. ML performed the data collection and the statistical analysis. ML wrote the first draft of the manuscript. MB was responsible for supervision and funding acquisition. All authors contributed to manuscript revision, read, and approved the submitted version.
This work was funded by the Ministry of Science, Research, and Art Baden-Württemberg and the Ministry of Transport Baden-Württemberg within the Funding Program “Smart Mobility” (Project “INTUITIVER”).
The authors declare that the research was conducted in the absence of any commercial or financial relationships that could be construed as a potential conflict of interest.
The Supplementary Material for this article can be found online at: https://www.frontiersin.org/articles/10.3389/fhumd.2021.676667/full#supplementary-material
Beresford, B., and Sloper, P. (2008). Understanding the Dynamics of Decision-Making and Choice: A Scoping Study of Key Psychological Theories to Inform the Design and Analysis of the Panel Study. York: Social Policy Research Unit, University of York.
Borowsky, A., and Oron-Gilad, T. (2013). Exploring the Effects of Driving Experience on hazard Awareness and Risk Perception via Real-Time hazard Identification, hazard Classification, and Rating Tasks. Accid. Anal. Prev. 59, 548–565. doi:10.1016/j.aap.2013.07.008
Colley, M., Bräuner, C., Lanzer, M., Walch, M., Baumann, M., and Rukzio, E. (2020). “Effect of Visualization of Pedestrian Intention Recognition on Trust and Cognitive Load,” in 12th International Conference on Automotive User Interfaces and Interactive Vehicular Applications (New York, NY, USA: Association for Computing Machinery), 181–191. doi:10.1145/3409120.3410648
Colley, M., Eder, B., Rixen, J. O., and Rukzio, E. (2021). “Effects of Semantic Segmentation Visualization on Trust, Situation Awareness, and Cognitive Load in Highly Automated Vehicles,” in Proceedings of the 2021 CHI Conference on Human Factors in Computing Systems (New York, NY, USA: Association for Computing Machinery), 1–11. CHI ՚21. doi:10.1145/3411764.3445351
DeGuzman, C. A., Hopkins, S. A., and Donmez, B. (2020). Driver Takeover Performance and Monitoring Behavior with Driving Automation at System-Limit versus System-Malfunction Failures. Transportation Res. Rec. 2674, 140–151. doi:10.1177/0361198120912228
[Dataset] Deloitte (2021). 2020 Global Automotive Consumer Study - Is Consumer Interest in Advanced Automotive Technologies on the Move? Available at: https://www2.deloitte.com/content/dam/Deloitte/de/Documents/consumer-industrial-products/deloitte-2020-global-automotive-consumer-study-global-focus-countries (Accessed March 01 2021).
Dommes, A., Granié, M.-A., Cloutier, M.-S., Coquelet, C., and Huguenin-Richard, F. (2015). Red Light Violations by Adult Pedestrians and Other Safety-Related Behaviors at Signalized Crosswalks. Accid. Anal. Prev. 80, 67–75. doi:10.1016/j.aap.2015.04.002
Du, N., Haspiel, J., Zhang, Q., Tilbury, D., Pradhan, A. K., Yang, X. J., et al. (2019). Look Who’s Talking Now: Implications of Av’s Explanations on Driver’s Trust, Av Preference, Anxiety and Mental Workload. Transportation Res. C: Emerging Tech. 104, 428–442. doi:10.1016/j.trc.2019.05.025
Faas, S. M., Stange, V., and Baumann, M. (2021). Self-driving Vehicles and Pedestrian Interaction: Does an External Human-Machine Interface Mitigate the Threat of a Tinted Windshield or a Distracted Driver? Int. J. Human–Computer Interaction, 1–11. doi:10.1080/10447318.2021.1886483
Fagnant, D. J., and Kockelman, K. (2015). Preparing a Nation for Autonomous Vehicles: Opportunities, Barriers and Policy Recommendations. Transportation Res. A: Pol. Pract. 77, 167–181. doi:10.1016/j.tra.2015.04.003
Fang, Z., Vázquez, D., and López, A. M. (2017). On-board Detection of Pedestrian Intentions. Sensors 17, 2193. doi:10.3390/s17102193
Fernandez, C., Vicente, M. A., Carrillo, I., Guilabert, M., and Mira, J. J. (2020). Factors Influencing the Smartphone Usage Behavior of Pedestrians: Observational Study on “Spanish Smombies”. J. Med. Internet Res. 22 (8), e19350. doi:10.2196/19350
Finn, P., and Bragg, B. W. E. (1986). Perception of the Risk of an Accident by Young and Older Drivers. Accid. Anal. Prev. 18, 289–298. doi:10.1016/0001-4575(86)90043-6
Forster, Y., Kraus, J., Feinauer, S., and Baumann, M. (2018). “Calibration of Trust Expectancies in Conditionally Automated Driving by Brand, Reliability Information and Introductionary Videos: An Online Study,” in Proceedings of the 10th International Conference on Automotive User Interfaces and Interactive Vehicular Applications (New York, NY, USA: Association for Computing Machinery, 2018), AutomotiveUI ’18, 118–128. doi:10.1145/3239060.3239070
Ghori, O., Mackowiak, R., Bautista, M., Beuter, N., Drumond, L., Diego, F., et al. (2018). “Learning to Forecast Pedestrian Intention from Pose Dynamics,” in 2018 IEEE Intelligent Vehicles Symposium (IV) (IEEE), 1277–1284. doi:10.1109/IVS.2018.8500657
Gold, C., Körber, M., Hohenberger, C., Lechner, D., and Bengler, K. (2015). Trust in Automation – before and after the Experience of Take-Over Scenarios in a Highly Automated Vehicle. Proced. Manufacturing 3, 3025–3032. doi:10.1016/j.promfg.2015.07.847
Gold, C., Körber, M., Lechner, D., and Bengler, K. (2016). Taking over Control from Highly Automated Vehicles in Complex Traffic Situations: The Role of Traffic Density. Hum. Factors 58, 642–652. doi:10.1177/0018720816634226
Grahn, H., Kujala, T., Silvennoinen, J., Leppänen, A., and Saariluoma, P. (2020). Expert Drivers’ Prospective Thinking-Aloud to Enhance Automated Driving Technologies – Investigating Uncertainty and Anticipation in Traffic. Accid. Anal. Prev. 146, 105717. doi:10.1016/j.aap.2020.105717
Hartwich, F., Beggiato, M., and Krems, J. F. (2018). Driving comfort, Enjoyment and Acceptance of Automated Driving – Effects of Drivers’ Age and Driving Style Familiarity. Ergonomics 61, 1017–1032. doi:10.1080/00140139.2018.1441448
Haus, S. H., Sherony, R., and Gabler, H. C. (2019). Estimated Benefit of Automated Emergency Braking Systems for Vehicle–Pedestrian Crashes in the united states. Traffic Inj. Prev. 20, S171–S176. doi:10.1080/15389588.2019.1602729
Healey, J. A., and Picard, R. W. (2005). Detecting Stress during Real-World Driving Tasks Using Physiological Sensors. IEEE Trans. Intell. Transportation Syst. 6, 156–166. doi:10.1109/TITS.2005.848368
Heesen, M., Baumann, M., Kelsch, J., Nause, D., and Friedrich, M. (2012). “Investigation of Cooperative Driving Behaviour during Lane Change in a Multi-Driver Simulation Environment,” in Human Factors and Ergonomics Society (HFES) Europe Chapter Conference Touluse, October, 2012, Toulouse, France, 305–318.
Hergeth, S., Lorenz, L., Krems, J. F., and Toenert, L. (2015). “Effects of Take-Over Requests and Cultural Background on Automation Trust in Highly Automated Driving,” in Proceedings of the Eighth International Driving Symposium on Human Factors in Driver Assessment, Training and Vehicle Design (Salt Lake City, Utah: Public Policy Center, University of Iowa), 331–337. doi:10.17077/drivingassessment.1591
Hock, P., Babel, F., Muehl, K., Rukzio, E., and Baumann, M. (2019). “Online Experiments as a Supplement of Automated Driving Simulator Studies: A Methodological Insight,” in Proceedings of the 11th International Conference on Automotive User Interfaces and Interactive Vehicular Applications: Adjunct Proceedings (New York, NY, USA: Association for Computing Machinery), AutomotiveUI ՚19. 282–286. doi:10.1145/3349263.3351334
Hock, P., Kraus, J., Walch, M., Lang, N., and Baumann, M. (2016). “Elaborating Feedback Strategies for Maintaining Automation in Highly Automated Driving,” in Proceedings of the 8th International Conference on Automotive User Interfaces and Interactive Vehicular Applications (New York, NY, USA: Association for Computing Machinery), 105–112. Automotive’UI 16. doi:10.1145/3003715.3005414
Holländer, K., Colley, M., Rukzio, E., and Butz, A. (2021). “A Taxonomy of Vulnerable Road Users for Hci Based on a Systematic Literature Review,” in Proceedings of the 2021 CHI Conference on Human Factors in Computing Systems, 1–13. doi:10.1145/3411764.3445480
Hoogendoorn, R., van Arerm, B., and Hoogendoom, S. (2014). Automated Driving, Traffic Flow Efficiency, and Human Factors: Literature Review. Transportation Res. Rec. 2422, 113–120. doi:10.3141/2422-13
Horberry, T., Osborne, R., and Young, K. (2019). Pedestrian Smartphone Distraction: Prevalence and Potential Severity. Transportation Res. F: Traffic Psychol. Behav. 60, 515–523. doi:10.1016/j.trf.2018.11.011
Hughes, P. K., and Cole, B. L. (1986). What Attracts Attention when Driving? Ergonomics 29, 377–391. doi:10.1080/00140138608968272
Jian, J.-Y., Bisantz, A. M., and Drury, C. G. (2000). Foundations for an Empirically Determined Scale of Trust in Automated Systems. Int. J. Cogn. Ergon. 4, 53–71. doi:10.1207/S15327566IJCE040104
Jiang, K., Ling, F., Feng, Z., Ma, C., Kumfer, W., Shao, C., et al. (2018). Effects of mobile Phone Distraction on Pedestrians’ Crossing Behavior and Visual Attention Allocation at a Signalized Intersection: An Outdoor Experimental Study. Accid. Anal. Prev. 115, 170–177. doi:10.1016/j.aap.2018.03.019
Kooij, J. F. P., Flohr, F. B., Pool, E. A. I., and Gavrila, D. (2019). Context-based Path Prediction for Targets with Switching Dynamics. Int. J. Comput. Vis. 127, 239–262. doi:10.1007/s11263-018-1104-4
Kraft, A.-K., Maag, C., Cruz, M. I., Baumann, M., and Neukum, A. (2020). Effects of Explaining System Failures during Maneuver Coordination while Driving Manual or Automated. Accid. Anal. Prev. 148, 105839. doi:10.1016/j.aap.2020.105839
Kraus, J., Scholz, D., Stiegemeier, D., and Baumann, M. (2020). The More You Know: Trust Dynamics and Calibration in Highly Automated Driving and the Effects of Take-Overs, System Malfunction, and System Transparency. Hum. Factors 62, 718–736. doi:10.1177/0018720819853686
Kunze, A., Summerskill, S. J., Marshall, R., and Filtness, A. J. (2019). Automation Transparency: Implications of Uncertainty Communication for Human-Automation Interaction and Interfaces. Ergonomics 62, 245–360. doi:10.1080/00140139.2018.1547842
Kyriakidis, M., Happee, R., and de Winter, J. C. (2015). Public Opinion on Automated Driving: Results of an International Questionnaire Among 5000 Respondents. Transportation Res. Part F: Traffic Psychol. Behav. 32, 127–140. doi:10.1016/j.trf.2015.04.014
Lanzer, M., and Baumann, M. (2020). Does Crossing the Road in a Group Influence Pedestrians’ Gaze Behavior? Proc. Hum. Factors Ergon. Soc. Annu. Meet. 64, 1938–1942. doi:10.1177/1071181320641467
Lee, J., Abe, G., Sato, K., and Itoh, M. (2020). “Impacts of System Transparency and System Failure on Driver Trust during Partially Automated Driving,” in 2020 IEEE International Conference on Human-Machine Systems (ICHMS), September 7–9, 2020, Rome, Italy, 1–3. doi:10.1109/ICHMS49158.2020.9209322
Lee, J. D., and See, K. A. (2004). Trust in Automation: Designing for Appropriate reliance. Hum. Factors 46, 50–80. doi:10.1518/hfes.46.1.50_30392
Li, M., Holthausen, B. E., Stuck, R. E., and Walker, B. N. (2019). “No Risk No Trust: Investigating Perceived Risk in Highly Automated Driving,” in Proceedings of the 11th International Conference on Automotive User Interfaces and Interactive Vehicular Applications (New York, NY, USA: Association for Computing Machinery, 2019), AutomotiveUI ’19. 177–185. doi:10.1145/3342197.3344525
Lundgren, V. M., Habibovic, A., Andersson, J., Lagström, T., Nilsson, M., Sirkka, A., et al. (2017). “Will There Be New Communication Needs when Introducing Automated Vehicles to the Urban Context?,” in Advances in Human Aspects of Transportation. Editors N. A. Stanton, S. Landry, G. D. Bucchianico, and A. Vallicelli (Springer International), Advances in Intelligent Systems and Computing, 485–497. doi:10.1007/978-3-319-41682-341
Mordan, T., Cord, M., Pérez, P., and Alahi, A. (2020). Detecting 32 Pedestrian Attributes for Autonomous Vehicles. arXiv preprint arXiv:2012.02647.
Muir, B. M., and Moray, N. (1996). Trust in Automation. Part Ii. Experimental Studies of Trust and Human Intervention in a Process Control Simulation. Ergonomics 39, 429–460. doi:10.1080/00140139608964474
Nasar, J. L., and Troyer, D. (2013). Pedestrian Injuries Due to mobile Phone Use in Public Places. Accid. Anal. Prev. 57, 91–95. doi:10.1016/j.aap.2013.03.021
Pešić, D., Antić, B., Glavić, D., and Milenković, M. (2016). The Effects of mobile Phone Use on Pedestrian Crossing Behaviour at Unsignalized Intersections–Models for Predicting Unsafe Pedestrians Behaviour. Saf. Sci. 82, 1–8. doi:10.1016/j.ssci.2015.08.016
Piazza, A. J., Knowlden, A. P., Hibberd, E., Leeper, J., Paschal, A. M., and Usdan, S. (2020). Distracted mobile Device Use Among Street-Crossing College Student Pedestrians: An Observational Approach. J. Am. Coll. Health, 1–8. doi:10.1080/07448481.2020.1845182
Radlmayr, J., Gold, C., Lorenz, L., Farid, M., and Bengler, K. (2014). How Traffic Situations and Non-driving Related Tasks Affect the Take-Over Quality in Highly Automated Driving. Proc. Hum. Factors Ergon. Soc. Annu. Meet. 58, 2063–2067. doi:10.1177/1541931214581434
Rasouli, A., Kotseruba, I., and Tsotsos, J. K. (2017). “Agreeing to Cross: How Drivers and Pedestrians Communicate,” in 2017 IEEE Intelligent Vehicles Symposium (IV) (California, USA: Redondo Beach), 264–269. doi:10.1109/IVS.2017.7995730
Reason, J., Manstead, A., Stradling, S., Baxter, J., and Campbell, K. (1990). Errors and Violations on the Roads: A Real Distinction? Ergonomics 33, 1315–1332. doi:10.1080/00140139008925335
Ren, J., Chen, Y., Li, F., Xue, C., Yin, X., Peng, J., et al. (2021). Road Injuries Associated with Cellular Phone Use while Walking or Riding a Bicycle or an Electric Bicycle: A Case-Crossover Study. Am. J. Epidemiol. 190, 37–43. doi:10.1093/aje/kwaa164
Scharfe, M. S. L., Zeeb, K., and Russwinkel, N. (2020). The Impact of Situational Complexity and Familiarity on Takeover Quality in Uncritical Highly Automated Driving Scenarios. Information 11, 115. doi:10.3390/info11020115
Seet, M., Harvy, J., Bose, R., Dragomir, A., Bezerianos, A., and Thakor, N. (2020). Differential Impact of Autonomous Vehicle Malfunctions on Human Trust. IEEE Trans. Intell. Transportation Syst., 1–10. doi:10.1109/TITS.2020.3013278
Simmons, S. M., Caird, J. K., Ta, A., Sterzer, F., and Hagel, B. E. (2020). Plight of the Distracted Pedestrian: a Research Synthesis and Meta-Analysis of mobile Phone Use on Crossing Behaviour. Inj. Prev. 26, 170–176. doi:10.1136/injuryprev-2019-043426
Solah, M. S., Deros, B. M., Jawi, Z. M., Harun, N. Z., Hamzah, A., and Ariffin, A. H. (2016). The Effects of mobile Electronic Device Use in Influencing Pedestrian Crossing Behaviour. Malaysian J. Public Health Med. 16, 61–66.
Stogios, C., Kasraian, D., Roorda, M. J., and Hatzopoulou, M. (2019). Simulating Impacts of Automated Driving Behavior and Traffic Conditions on Vehicle Emissions. Transportation Res. D: Transport Environ. 76, 176–192. doi:10.1016/j.trd.2019.09.020
Stoll, T., Lanzer, M., and Baumann, M. (2020a). Situational Influencing Factors on Understanding Cooperative Actions in Automated Driving. Transportation Res. Part F: Traffic Psychol. Behav. 70, 223–234. doi:10.1016/j.trf.2020.03.006
Stoll, T., Mühl, K., and Baumann, M. (2021). Do drivers Accept Cooperative Behavior of Their Automated Vehicle on Highways? Transportation Res. Part F: Traffic Psychol. Behav. 77, 236–245. doi:10.1016/j.trf.2020.12.002
Stoll, T., Müller, F., and Baumann, M. (2019). When Cooperation Is Needed: the Effect of Spatial and Time Distance and Criticality on Willingness to Cooperate. Cogn. Technol. Work 21, 21–31. doi:10.1007/s10111-018-0523-x
Stoll, T., Weihrauch, L., and Baumann, M. (2020b). After You: Merging at Highway On-Ramps. Proc. Hum. Factors Ergon. Soc. Annu. Meet. 64, 1105–1109. doi:10.1177/1071181320641266
Sucha, M., Dostal, D., and Risser, R. (2017). Pedestrian-driver Communication and Decision Strategies at Marked Crossings. Accid. Anal. Prev. 102, 41–50. doi:10.1016/j.aap.2017.02.018
Tanshi, F., and Söffker, D. (2019). “Modeling Drivers’ Takeover Behavior Depending on the Criticality of Driving Situations and the Complexity of Secondary Tasks,” in 2019 IEEE Conference on Cognitive and Computational Aspects of Situation Management (CogSIMA), 67–73. doi:10.1109/COGSIMA.2019.8724304
Thompson, L. L., Rivara, F. P., Ayyagari, R. C., and Ebel, B. E. (2013). Impact of Social and Technological Distraction on Pedestrian Crossing Behaviour: An Observational Study. Inj. Prev. 19, 232–237. doi:10.1136/injuryprev-2012-040601
[Dataset] Unity Technologies (2019a). Unity. Available at: https://unity.com/
[Dataset] Unity Technologies (2019b). Windridge City Available at: https://assetstore.unity.com/packages/3d/environments/roadways/windridge-city-132222 (Accessed July 10, 2020).
Utriainen, R. (2021). The Potential Impacts of Automated Vehicles on Pedestrian Safety in a Four-Season Country. J. Intell. Transportation Syst. 25, 188–196. doi:10.1080/15472450.2020.1845671
Vöhringer-Kuhnt, T., and Trexler-Walde, L. (2009). Evaluation einer Kurzversion des Driver Behaviour Questionnaire. In 8. (Berlin, Germany:Berliner Werkstatt Mensch-Maschine-Systeme), 343–346.
Vollrath, M., Huemer, A. K., and Nicolai, C. (2019). Young People Use Their Smartphone All the Time–Even when Crossing the Street? IET Intell. Transport Syst. 13, 1213–1217. doi:10.1049/iet-its.2018.5548IET
Walch, M., Mühl, K., Kraus, J., Stoll, T., Baumann, M., and Weber, M. (2017). “From Car-Driver-Handovers to Cooperative Interfaces: Visions for Driver–Vehicle Interaction in Automated Driving,” in Automotive User Interfaces: Creating Interactive Experiences in the Car. Editors G. Meixner, and C. Müller (Cham: Springer International Publishing), 273–294. doi:10.1007/978-3-319-49448-7_10
Wells, H. L., McClure, L. A., Porter, B. E., and Schwebel, D. C. (2018). Distracted Pedestrian Behavior on Two Urban College Campuses. J. Community Health 43, 96–102. doi:10.1007/s10900-017-0392-x
Wiegand, G., Eiband, M., Haubelt, M., and Hussmann, H. (2020). ““i’d like an Explanation for That!”exploring Reactions to Unexpected Autonomous Driving,” in 22nd International Conference on Human-Computer Interaction with Mobile Devices and Services (New York, NY, USA: Association for Computing Machinery, 2020). MobileHCI ’20. doi:10.1145/3379503.3403554
Wintersberger, P., Nicklas, H., Martlbauer, T., Hammer, S., and Riener, A. (2020). “Explainable Automation: Personalized and Adaptive Uis to foster Trust and Understanding of Driving Automation Systems,” in 12th International Conference on Automotive User Interfaces and Interactive Vehicular Applications (New York, NY, USA:Association for Computing Machinery), 252–261. doi:10.1145/3409120.3410659
Wu, C., Wu, H., Lyu, N., and Zheng, M. (2019). Take-over Performance and Safety Analysis under Different Scenarios and Secondary Tasks in Conditionally Automated Driving. IEEE Access 7, 136924–136933. doi:10.1109/ACCESS.2019.2914864
Zhou, Z., Liu, S., Xu, W., Pu, Z., Zhang, S., and Zhou, Y. (2019). Impacts of mobile Phone Distractions on Pedestrian Crossing Behavior at Signalized Intersections: An Observational Study in China. Adv. Mech. Eng. 11 (4), 168781401984183. doi:10.1177/1687814019841838
Zoellick, J. C., Kuhlmey, A., Schenk, L., Schindel, D., and Blüher, S. (2019). Amused, Accepted, and Used? Attitudes and Emotions towards Automated Vehicles, Their Relationships, and Predictive Value for Usage Intention. Transportation Res. Part F: Traffic Psychol. Behav. 65, 68–78. doi:10.1016/j.trf.2019.07.009
Keywords: automated driving, trust, takeover, criticality, system malfunction, distracted pedestrian, smartphone, situation complexity
Citation: Lanzer M, Stoll T, Colley M and Baumann M (2021) Intelligent Mobility in the City: The Influence of System and Context Factors on Drivers’ Takeover Willingness and Trust in Automated Vehicles. Front. Hum. Dyn 3:676667. doi: 10.3389/fhumd.2021.676667
Received: 05 March 2021; Accepted: 22 June 2021;
Published: 13 July 2021.
Edited by:
Stavros Tasoudis, Technische Hochschule Ingolstadt, GermanyReviewed by:
George Yannis, National Technical University of Athens, GreeceCopyright © 2021 Lanzer, Stoll, Colley and Baumann. This is an open-access article distributed under the terms of the Creative Commons Attribution License (CC BY). The use, distribution or reproduction in other forums is permitted, provided the original author(s) and the copyright owner(s) are credited and that the original publication in this journal is cited, in accordance with accepted academic practice. No use, distribution or reproduction is permitted which does not comply with these terms.
*Correspondence: Mirjam Lanzer, bWlyamFtLmxhbnplckB1bmktdWxtLmRl
Disclaimer: All claims expressed in this article are solely those of the authors and do not necessarily represent those of their affiliated organizations, or those of the publisher, the editors and the reviewers. Any product that may be evaluated in this article or claim that may be made by its manufacturer is not guaranteed or endorsed by the publisher.
Research integrity at Frontiers
Learn more about the work of our research integrity team to safeguard the quality of each article we publish.