 Gennaro Laudato1
 Simone Scalabrino1
 Angela Rita Colavita2Quintiliano Chiacchiari3Romolo D'Orazio4Roberto Donadelli5Luca De Vito6
 Francesco Picariello6
 Ioan Tudosa6Raffaele Malatesta7Lolita Gallo7
 Rocco Oliveto1*
- 1SofTware and Knowledge Engineering Lab, University of Molise, Campobasso, Italy
- 2Azienda Sanitaria Regionale del Molise, Molise Region, Campobasso, Italy
- 3Cooperativa Servizi Sanitari, Isernia, Italy
- 4ModaImpresa srl, Miranda, Italy
- 5DISC spa, Bergamo, Italy
- 6Laboratorio di Elaborazione dei Segnali e delle Informazioni di Misura Lab, University of Sannio, Benevento, Italy
- 7Molise Region, Health Department, Campobasso, Italy
Wearable devices as medical technologies are becoming an integral part of our lives. Many research studies are dedicated to these devices and are mainly focused on providing personal analytics, measuring physical status, and acquiring physiological signals and parameters. These continuously evolving technologies play an important role in telemedicine. Telemedicine can be broadly defined as the use of advanced telecommunications technologies to support many medical activities, such as the diagnosis, the analysis of patient data, the improvement of disease management and the treatment in remote areas. In this article, we present ATTICUS (Ambient-intelligent Tele-monitoring and Telemetry for Incepting and Catering over hUman Sustainability), an innovative remote monitoring system for ambient-assisted living based on the analysis of vital and behavioral parameters. The ATTICUS system consists of two essential components: a smart wearable—in the form of a short singlet—made of innovative textile which allows the acquisition of real-time body signals, e.g., electrocardiogram (ECG), breathing wave, temperature, and a multi-level Decision Support System (DSS), a distributed software which integrates advanced machine learning methods to automatically detect anomalies. ATTICUS is capable of operating in different application scenarios. Especially, the system will support in-home and out-home monitoring, personal check-ups, and specialized check-ups. Thus, the system will positively impact the canonical medical practices allowing simultaneous and continuous monitoring of a large number of people.
1. Introduction
Healthcare is one of the most important, yet expensive, services provided by any state. According to Eurostat (2020), healthcare expenditures represent about 10% of the GDP of European states, on average. Such expenditures reach 11.3% in Germany and France. Elderly people are the category that mostly uses healthcare services, given the higher chance of requiring medical attention.
In Italy, over 80% of non-self-sufficient people living at home are over 65 (2.5M people) according to ISTAT, the Italian National Institute of Statistics (ISTAT, 2014). It is estimated that more than one-fifth of people aged 65 and over have serious functional limitations to require personal assistance in their own house (20.1%) or in residential facilities, such as nursing homes, sheltered residences, and similar (1.7%) (ISTAT, 2019). Treating elderly people and, in general, people with chronic diseases is not trivial: hospitalization may be detrimental if not necessary because it may expose such fragile people to possible infections. Yet, sometimes it is one of the few options available.
Telemedicine was born to solve such kind of problems. In general, telemedicine uses information and communication technologies to improve patient health outcomes through remote monitoring. The global market of telemedicine has grown fast in the recent years: its estimated size was 45.5 billion dollars in 2019 and the forecasts show that it will still grow (175.5 billion dollars) by 2026 (Mikulic, 2020). The main reason why telemedicine acquires more and more attention is that it is expected to significantly reduce the cost of health systems.
In this article, we present ATTICUS (Ambient-intelligent Tele-monitoring and Telemetry for Incepting and Catering over hUman Sustainability), an innovative telemedicine system. ATTICUS uses the Internet of Things (IoT) devices and machine learning to make telemedicine more effective and efficient. The patients are simply required to wear a smart wearable device (S-WEAR), i.e., a garment made with innovative fabrics (Balestrieri et al., 2019). Such a garment is equipped with an electronic device capable both of (i) acquiring data, and (ii) communicating such data to a software system that allows monitoring the health state of the patient. The S-WEAR device has several sensors that allow acquiring the ECG, the respiratory behavior, the temperature, and the galvanic skin response. Such signals allow to automatically detect a broad range of conditions, including, for example, congestive heart failure and sleep apnea.
The electronic device is constantly connected to the smartphone of the patient, which works as a gateway. It collects data via a Bluetooth Low-Energy (BLE) connection, and it forwards them to an ambient intelligence device, the S-BOX. The S-BOX device is installed at the patients' home and it is responsible for performing a first automated analysis of the data acquired by the S-WEAR. When the S-BOX is not available (e.g., the patient is not at home), the smartphone can replace it through the MyATTICUS mobile app. Such a hybrid approach allows saving the smartphone's battery when the patient is at home but still allows the patients to be constantly monitored in outdoor scenarios.
If the S-BOX device or the MyATTICUS app detect anomaly conditions, they promptly send anomaly reports to the central monitoring software, which is responsible for ultimately analyzing the data and confirming or rejecting the anomaly. Finally, ATTICUS provides a monitoring center, a facility in which several physicians both (i) proactively monitor the patients, and (ii) react to anomalies detected by ATTICUS.
The ATTICUS system is characterized by an innovative three-level Decision Support System (DSS) that constantly backs the physicians and allows them to focus only on the most relevant cases. The first level is installed in the electronic device connected to the S-WEAR, which can automatically detect a limited set of anomalies, e.g., the heart rate is too high. The second level, represented by S-BOX/MyATTICUS, uses state-of-the-art algorithms to detect a broader range of anomalies, such as heat strokes or irregular heartbeat. Finally, the third level, installed at the monitoring center, uses advanced machine-learning techniques to decide if it is necessary to notify the alarm to the physicians at the monitoring center. The results achieved in a preliminary evaluation of the single detectors used in ATTICUS DSS are very promising and indicate an overall very high accuracy.
The ATTICUS system can have a positive impact on the treatment of several medical conditions. In this article, we show two examples of how such a system may be beneficial to healthcare. First, we show how it can benefit the treatment of Congestive Hearth Failures (CHF) through PDTAs (“Percorsi Diagnostico Terapeutici Assistenziali,” i.e., Diagnostic and Therapeutic Care Pathways); then, we report some possible advancements that the ATTICUS system can imply on the home care sector.
2. Internet of Medical Things Systems
In the last decade, the investments and expectations of the healthcare community have shifted more toward the early diagnosis of diseases, the monitoring of the health status and the general quality of life of patients rather than the use of traditional medical treatments using molecules, drugs, mechanics, prosthesis, and surgery (Lmberis and Dittmar, 2007). Furthermore, healthcare providers are looking for cheaper and more responsive ways of delivering services than through large centralized institutions, e.g., hospitals, specialized healthcare centers (Lmberis and Dittmar, 2007). In this scenario, the Internet-of-Medical-Things (IoMT) paradigm plays a vital role, thanks to the spread use of innovative technologies for smart sensors, smart devices, advanced lightweight and energy effective wireless communication interfaces, and wearable devices (Vishnu et al., 2020).
Wearable devices are recognized as one of the most promising platforms for the implementation of minimally intrusive and individualized healthcare services (Lmberis and Dittmar, 2007). Healthcare wearable devices range from the most popular fitness trackers, e.g., Garmin, AppleWatch, MI Band, and so on, to the more complicated devices, such as smart clothes (Huang et al., 2019). These devices allow users to continuously monitor physiological parameters and manage their health on a personal basis, and/or doctors access to their health data for receiving personalized medical care (Huang et al., 2019).
In the literature, several IoMT systems based on wearable devices have been proposed (Di Rienzo et al., 2010; Trindade et al., 2016; Wang et al., 2019; Balestrieri et al., 2020). Di Rienzo et al. (2010) propose an IoMT system, called MagIC (“Maglietta Interattiva Computerizzata”), consisting of a vest with embedded an ECG lead sensor, a piezoresistive plethysmography sensor, and a data acquisition board with a Bluetooth transceiver. The data acquisition board sends via Bluetooth the samples related to the physiological signals to a local monitoring station, which consists of a touchscreen-based Personal Computer (PC) and shows the data to the user. The local monitoring station through an Internet connection re-transmits the acquired information to a server. The server stores the received data in a database and sends an e-mail to the cardiologists with the recorded ECG and respiration rate signals.
Another IoMT system for cardio-surveillance, based on a T-shirt, has been proposed by Trindade et al. (2016). The cardio surveillance T-shirt embeds: (i) a five-lead ECG sensor, (ii) a microcontroller with the BLE interface, and (iii) an Electrically Erasable Programmable Read-Only Memory (EEPROM) that contains the microcontroller firmware. The microcontroller acquires the data provided by the ECG sensor and stores them on a buffer. When the buffer is full, the recorded samples are sent to the smartphone via BLE interface. The acquired ECG signals are processed by the smartphone application processor for obtaining QRS and T-wave information. The acquired samples and the obtained information are transmitted by the smartphone to a healthcare center through an Internet connection.
With the spread use of IoMT systems, the pre-diagnosis and diagnosis steps, which are usually manually performed by specialized medical staff, are much complex and time-consuming. For this reason, recently, several IoMT systems based on wearable devices have been proposed to perform classification and prediction of specific diseases.
For example, Wang et al. (2019) proposed a wearable device connected to a Cloud platform that allows the automatic classification of the ECG signals for the detection of an arrhythmia. The system consists of three layers: (i) the sensing patch layer consisting of a data acquisition system for the monitoring of one lead ECG, with a BLE interface, (ii) the mobile device that communicates with the sensing patch layer via BLE and transmits the acquired data to the Cloud platform via 4G LTE connection, and (iii) the Cloud platform that performs the ECG classification and anomalies detection.
Even if the available technology is prone to be used on the field, there are yet several challenges to be addressed for improving the reliability and usability of these systems: (i) the development of IoMT systems which fuse the data provided by several sensors, e.g., inertial measurement unit, bio-impedance sensor, ECG sensor, to improve the accuracy of the acquired measurements, e.g., the automatic compensation of artifacts on the ECG signals due to the user movements (David et al., 2011a,b), (ii) the implementation of compression algorithms that reduce the amount of the data transmitted among the remote units of the distributed measurement system, and (iii) the implementation of distributed Decision Support Systems (DSSs), which process the data provided by the sensors related to the physiological parameters and the user activities, and then detect and classify anomalies for providing reliable alerts to the specialized staff. The ATTICUS system tries to overcome, as detailed in the next sections, all these limitations.
3. The ATTICUS Sytem
The objective of the ATTICUS project is the development of an intelligent hardware/software system, able to constantly monitor different users and to report any anomalies found. The anomalies reported by the system concern both the state of health of a patient detected through the measurement and automatic analysis of vital parameters, and the habits of the patient detected through the monitoring and analysis of the movements that the patient makes while carrying out their normal activities.
The ATTICUS system consists of the following elements:
• a “smart wearable” device (S-WEAR), i.e., a wearable garment made with innovative fabrics and integrated by a data acquisition system able to measure the vital parameters of the person, e.g., ECG, temperature, respiratory behavior, galvanic skin response. The S-WEAR is also equipped with an electronic device able to process and store the acquired data locally, both in an indoor and in an outdoor scenario. The acquired data is transmitted in real-time to the users' smartphone: such a device works as a gateway and it transmits—in case of need—all the relevant data to a home station or a monitoring center through a wireless connection;
• a smartphone application (MyATTICUS) that represents the gateway to which the electronic device of the S-WEAR transmits the vital data. The data is sent to the S-BOX through a background process of MyATTICUS, that is in charge of forwarding the data. MyATTICUS also replaces the S-BOX in case it is not available, e.g., the patient is outdoor. Also, to provide the same functionalities offered by S-BOX, MyATTICUS allows the user to visualize information on the status of the S-WEAR, e.g., the battery charge status;
• an “ambient intelligence” (S-BOX) device, a home station able to collect and store data coming from one or more S-WEAR devices, analyzing them in real-time using artificial intelligence algorithms. The objective of predictive analysis is to detect any anomalies in the shortest possible time (“near real-time” mode). When the S-BOX detects an anomaly, it is promptly notified to a decision support system for subsequent verification. In case of alarm confirmation, the system alerts the rescue operations center through the monitoring software, providing the signal traces—in real-time—of the sensors that produced the anomaly. The data stored on the S-BOX will be sent to the monitoring software even in the absence of critical situations to obtain a historical analysis of the monitored parameters;
• a monitoring center, a hardware/software apparatus through which specialized operators receive the anomaly warnings related to the patients and activate the rescue actions if needed;
• the monitoring software, which can be accessed by the operators at the monitoring center, provides the necessary support for effective and efficient management of any critical situations identified through the continuous monitoring of users. The monitoring software also gives the possibility for authorized users to view the patient's medical records by accessing to hematological, instrumental, and follow-up examinations performed by the patient from the time of enrollment onward;
• a decision support system (DSS), organized in three levels, able to analyze monitoring data and to report on potential critical situations (warning) or alarms through artificial intelligence techniques. The three levels of DSS differ in terms of knowledge base and predictive analysis performed. The level 1 DSS, installed directly on the electronic component of the S-WEAR, can identify only abnormal situations that will be sent to the level 2 DSS, installed either on the S-BOX of the ATTICUS system or on the MyATTICUS app. The level 2 DSS, owning a wider knowledge of the physical characteristics of the patient, can decide whether (i) to reject the warning generated by the level 1 DSS and classify it as false positive; (ii) to request the intervention of the level 3 DSS, installed at the monitoring center, to confirm or reject the warning generated by the level 1 DSS; (iii) to confirm the abnormal situation and generate an alarm to be sent directly to the monitoring software. The level 3 DSS, in possession of not only of “local” knowledge, e.g., physical characteristics of the patient, but also “global” knowledge, e.g., physical characteristics of all patients, can reject or confirm the warnings generated (directly or indirectly) by the lower level DSS, and report the presence of any alarm to the monitoring software.
As designed, the ATTICUS system can operate in different application scenarios (see Figure 1):
• in-home monitoring: S-WEAR detects the patient's vital parameters and traces the patient's position, using indoor localization techniques, and also recovers the patient's posture (lying, standing, walking, sitting). The measurement data are sent in real-time to S-BOX for storage and preliminary analysis, and, if necessary, it is forwarded to the monitoring software, using the previously described procedure and the multiple DSS levels;
• out-of-home monitoring: in the case of out-of-home monitoring, S-WEAR measures the patient's vital parameters and tracks the position using the GPS satellite tracking system. The data will then be stored locally and sent to S-BOX once back home. S-WEAR and MyATTICUS can analyze the monitored data, identify any abnormal situations and report them directly to the level 3 DSS to request a prompt intervention;
• personal check-up: for each patient, in addition to data monitoring, it will be possible to populate an electronic patient record that can be used in real-time through the monitoring software. Information on the patient's state of health will be entered, such as laboratory analysis, instrumental examinations and therapies.
• specialized check-up: a specialist physician and a monitoring manager through the monitoring system will be able to view any critical situations of each patient monitored or view the patient's medical records of the patient enrolled in ATTICUS.
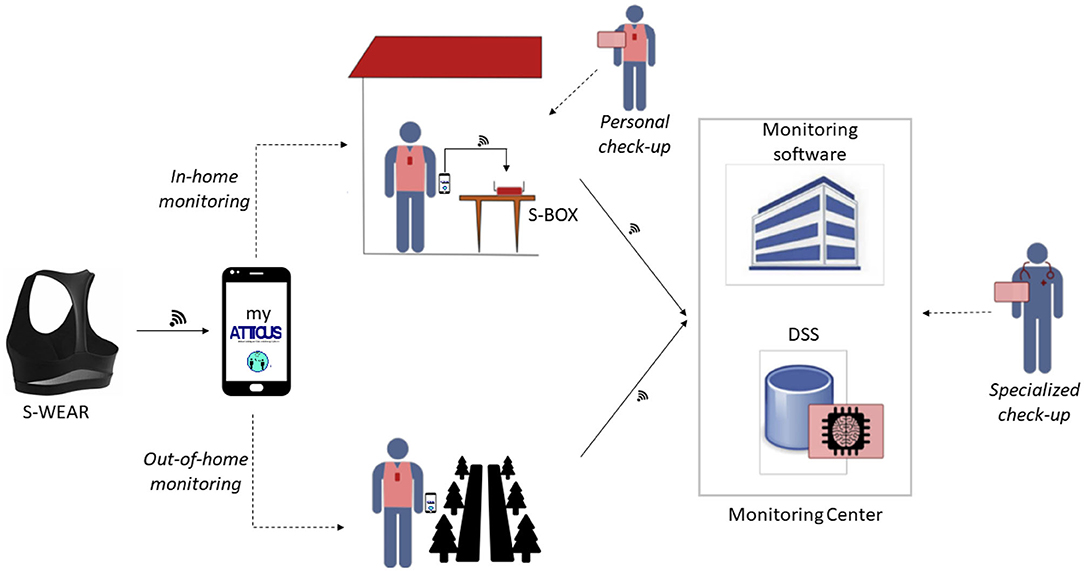
Figure 1. An overview of the ATTICUS system.
3.1. The Wearable Device
Some of the devices that can make up an IoT (Internet of Things) system are called wearable. Specifically, the phrase “wearable computing” refers to electronic systems that are directly integrated into garments and accessories to allow constant monitoring of the acquired vitals. The system, typically, consists of a Wearable Body Sensor Network (WBSN) based on intelligent fabrics (Axisa et al., 2005).
There are two basic requirements for a wearable:
• comfort: the biomedical sensors integrated into a WBSN must not be an obstacle for the user; specifically, it is desirable that the sensors are (i) small in size, to reduce weight and (ii) flexible, to adapt to the desired positions of the body for better skin contact;
• reliability of measurements: measurements made must comply with the accuracy requirements for subsequent processing and anomaly detection;
• washability: it should be possible to wash the garment using a washing machine.
One of the objectives of the ATTICUS project is to have a smart wearable which can be seen by the user as a smart second skin. With this definition, we refer to an article of clothing that can be worn 24 h per day under the usual underwear. For this reason, the wearable has to be very comfortable.
A recent study (Neves et al., 2017), which reports on the best configuration of e-textile in terms of conductivity, clearly indicates that the best performance is obtained when coating insulating textile fibers with graphene. However, other optimal configurations may be built using polyurethane and Carbon Black (CB) as an insulating and conductive layer, respectively. Based on this latter result and the presence of Carbon Black in many smart wearable devices because of its high stretchability (Seyedin et al., 2016), for the ATTICUS S-WEAR we decided to design a wearable device made of Carbon Black and polyurethane.
Another constraint that we had to face when designing the S-WEAR was the universality of the clothing item. First, it had to be the same wearable regardless of the user's gender and size. As a result, we designed a wearable that could fit every user thanks to a Velcro-based mechanical system and a unique design. We took in consideration three types of garment: t-shirt, band and bustier. This latter was the most inspiring one because it could be more easily adapted for our goal. The bustier prototype we defined is inspired by the concept of a classic sports bodice but adapted to be worn by both men and women, guaranteeing the same functionality and quality of signal acquisition. The diversity of the chest area between men and women does not allow to use a prototype whose textile part covers the entire area. For this reason, we proposed a bustier prototype in which the textile surface affecting the chest area is limited to a line of fabric that crosses its center. In this way, we also try to guarantee greater contact stability of the sensors since it is well-known that the electrodes V1 and V2 are not in stable contact with the skin because of the body structure (Tada et al., 2015).
Once acquired, the signal needs to be transported to the electronic unit attached to the wearable. To this aim, it is necessary to insert a conductive channel between the electrode and the terminal point, where the acquired signal must be conveyed. As suggested by Tada et al. (2015), we decided to install a snap button onto the textile electrode to allow the transport of the acquired signals through common copper wires.
Figure 2 shows the preliminary prototype of the ATTICUS S-WEAR; in a further version of the prototype, instead, the wires will be covered with a dedicated fabric layer as reported in Figure 3.
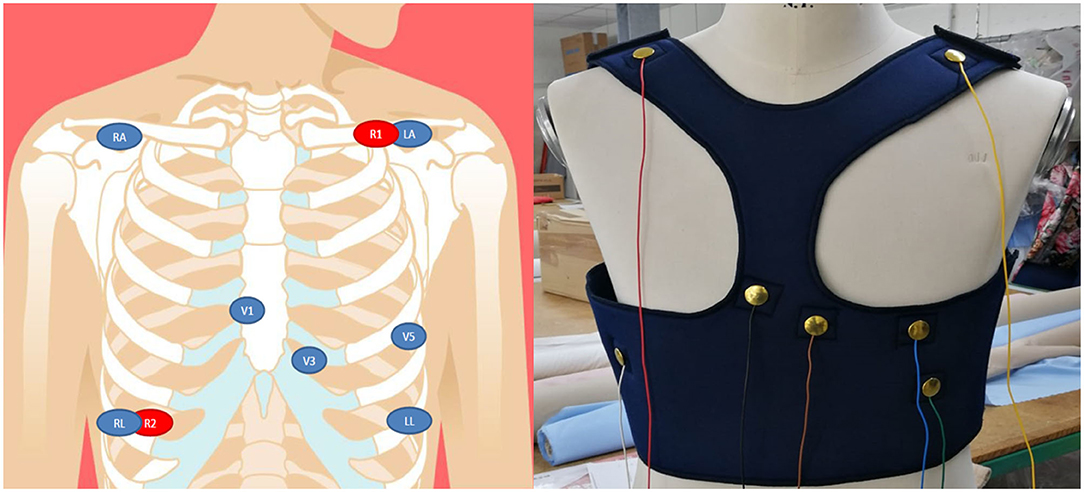
Figure 2. On the left, the design for the positions of the biomedical sensors for the ECG and respiration; on the right, the frontal view of the first prototype of the ATTICUS S-WEAR.
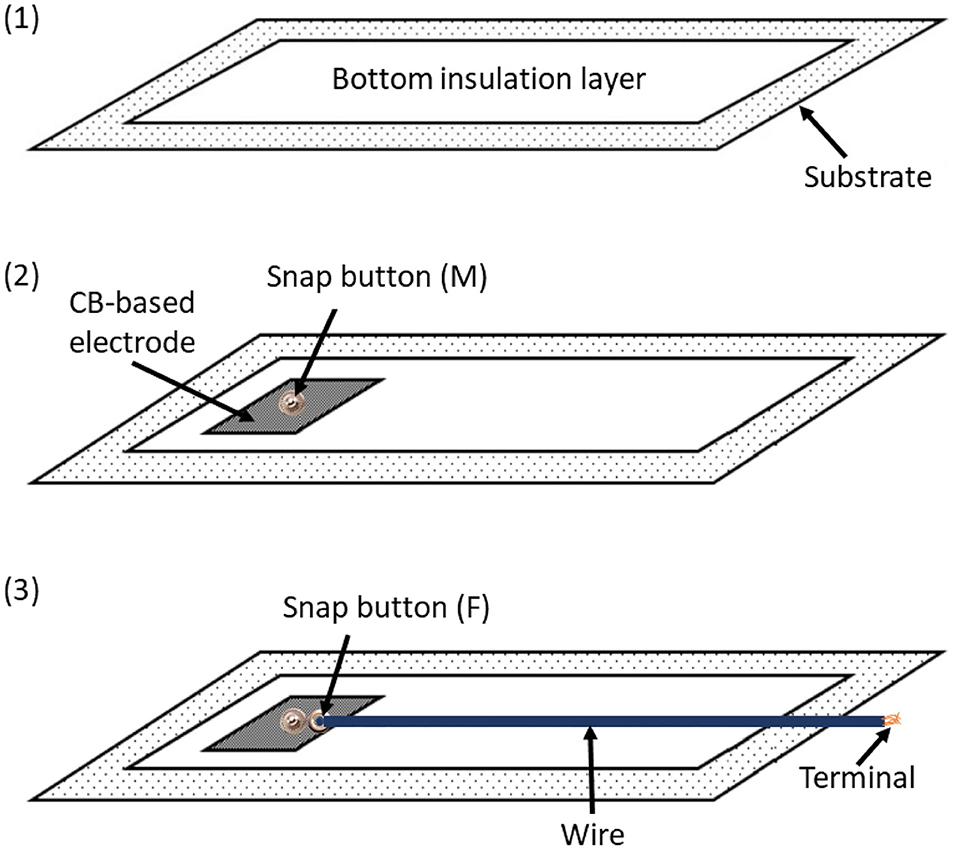
Figure 3. The coupling between conductive and insulating materials designed for the ATTICUS S-WEAR: (1) the bottom insulation layer, (2) the male snap button immersed into the CB-based electrode, (3) the female snap button linked by a common wire to the terminal for the electronic unit. The wire is covered by insulating material.
The adopted solution allows to completely remove the electronic unit as well as all the related wires. This makes the S-WEAR completely washable: it is sufficient to detach the electronic device to wash the wearable since the snap button is completely waterproof.
For what concerns the biomedical signal to be acquired, S-WEAR allows real-time monitoring of the following biomedical signals:
• multiple-lead ECG signals are acquired through the precordial electrodes arranged in the intercostal areas V1, V3, V5 with respect to the neutral (LL or RL). Also, other recordings are acquired through the RA and LA electrodes with respect to neutral (LL or RL). Further, leads are obtained digitally, through the evaluation of differential available ECG recordings;
• the body impedance, for the acquisition of the respiratory signal is acquired through the R1 and R2 electrodes, which will act both as current drivers and terminals to detect any potential variations;
• the galvanic skin response is acquired through the use of a sensor installed on the textile surface in contact with the back;
• the temperature is acquired through the use of a temperature sensor installed on the textile surface in contact with the hip;
• the dynamics is acquired through an inertial sensor integrated into the electronic component.
To allow these acquisitions, we chose an electrode configuration shown on the left side of Figure 2.
3.2. The Electronic Component
In this section, the electronic component of the ATTICUS system is presented. The architecture of ATTICUS data acquisition module is depicted in Figure 4. The main system component is a microcontroller which is responsible for: (i) On/Off state of the power distribution network, (ii) battery state-of-charge monitoring, (iii) data communication using wireless and wired interfaces, (iv) local data storage on flash/SD memories, (v) information acquisition from the available sensors, and (vi) drive/acquire of the data from the analog front-end part of the biosignals circuitry.
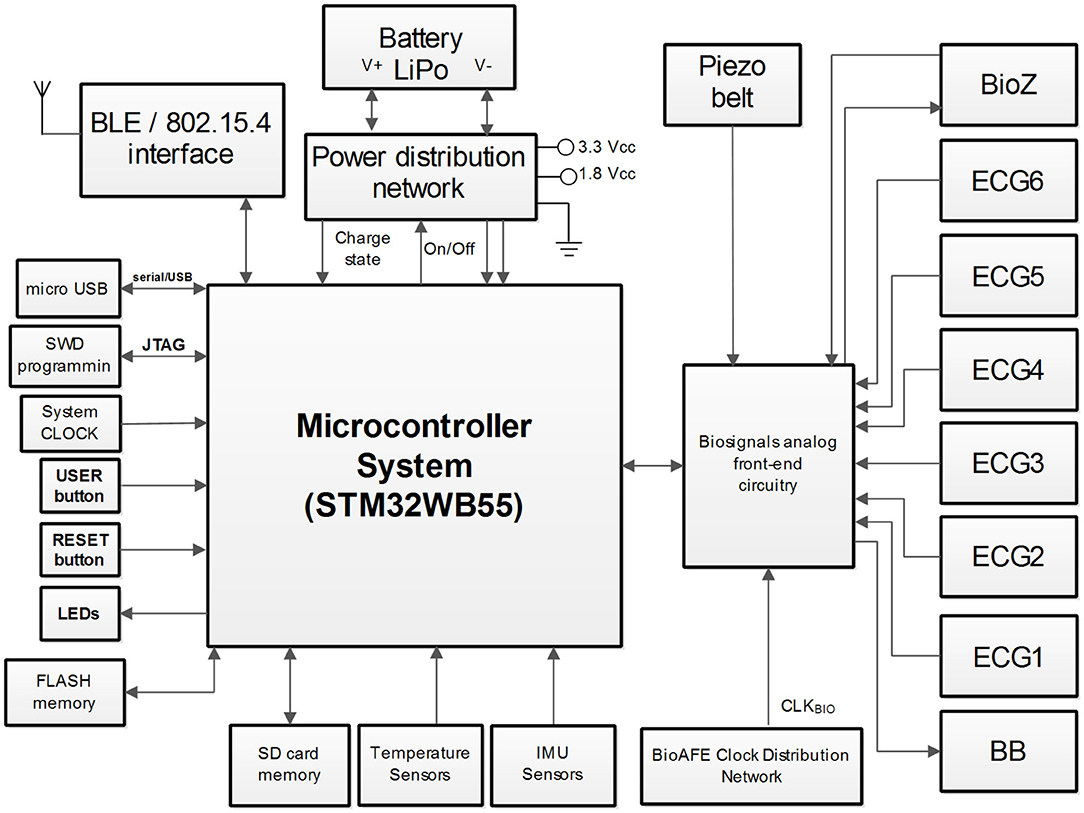
Figure 4. The architecture of ATTICUS data acquisition module.
In the following, each subsystem component and its role in ATTICUS data acquisition module is shortly described:
• microcontroller: is a System-on-Chip (SoC) based ARM architecture from ST Microelectronics, the STM32WB55, having incorporated the BLE wireless transmission interface. The implemented firmware disposes of software routines to drive and command all the peripherals of the ATTICUS data acquisition module. The microcontroller implements several software routines for ECG signal enhancement and also for ECG signal compression (Picariello et al., 2021);
• Power Distribution Network (PDN): is a circuit responsible with the voltage regulation [i.e., coming from a rechargeable Lithium Polymer (LiPo) battery] to the 3.3 and 1.8 Vcc, voltages required by the ATTICUS data acquisition subsystems. Moreover, the PDN is also responsible to monitor the state-of-charge or state-of-discharge of the LiPo battery. The user can enable/disable the power delivery from the PDN by driving the USER button. The microcontroller is driving the PDN by I/O pins and it measures the battery voltage according to the implemented firmware routines;
• micro USB communication: is a subsystem component responsible with the wired data communication to a master device (e.g., personal computer) and for LiPO battery charging. For these tasks, the dedicate USB interface of the microcontroller is used and the voltage rails of the micro USB connector are linked to the PDN;
• LEDs: are three components having the red, green, and blue colors, which are used to define the battery status and the ATTICUS data acquisition module working state. The states of LEDs, On/Off are driven by I/O lines from the microcontroller;
• memories: are available for storage, with two options, the FLASH based chip and the SD card. The ATTICUS firmware can write on these memories various parameters regarding the working state of the data acquisition module and the acquired biosignals from the patient. The memories communicate with the microcontroller using the SPI interface;
• temperature sensors: are used to measure the body temperature of the monitored patient/user. There are two types of temperature sensors, the TMP117 one which has ±0.1°C accurate digital temperature sensing, and the LMT70 which is an analog one, featuring ±0.05°C of sensing accuracy. The analog signals supplied by these sensors are acquired using the 12-bit ADC which is available on the microcontroller. The TMP117 is sending its data to the microcontroller through I2C interface;
• Inertial Measurement Unit (IMU) sensors: used in ATTICUS are responsible to report the body's specific force, angular rate, and orientation, using a combination of accelerometers, gyroscopes, and magnetometers. The evaluated chips are: (i) the LSM6DS3 sensor, containing a triaxial accelerometer and a triaxial gyroscope and the LIS3MDL triaxial magnetometer, which communicates via I2C with the microcontroller, and (ii) the BMX160 which is a 9-axis sensor that provides precise acceleration and angular rate (gyroscopic) and geomagnetic measurements;
• biosignals analog front-end circuitry: which is a dedicated electronic circuit comprising multiple chips for biosignals acquisition. For the ATTICUS data acquisition module, the ECG and bioimpedance measurements are performed by using the Maxim Integrated chips technology. Thus, the MAX30000 family disposes of ultra-low power consumption, single-channel integrated biopotential chips [e.g., MAX30001 for ECG and Bio-Impedance (BioZ) analog front-end and MAX30003 for ECG analog front-end]. According to the ATTICUS data acquisition module reported in Figure 4, one MAX30001 and five MAX30003 chips were used to develop a custom analog front-end circuitry which communicates via SPI interface with the microcontroller unit to deliver the ECG and BioZ signals. To obtain a respiration wave directly from thoracic expansion/contraction, a piezoresistive belt sensor type was chosen to be integrated into ATTICUS data acquisition module. This belt delivers an analog signal which varies in time according to the respiration rate of the monitored subject. Before be delivered the signal to the ADC of the microcontroller, an analog signal processing for enhancement of its features is performed by an analog front-end circuitry.
A preliminary Printed Circuit Board (PCB) was developed for the ATTICUS data acquisition module. In Figure 5, an overview of the top and bottom layers of the developed PCB are depicted.
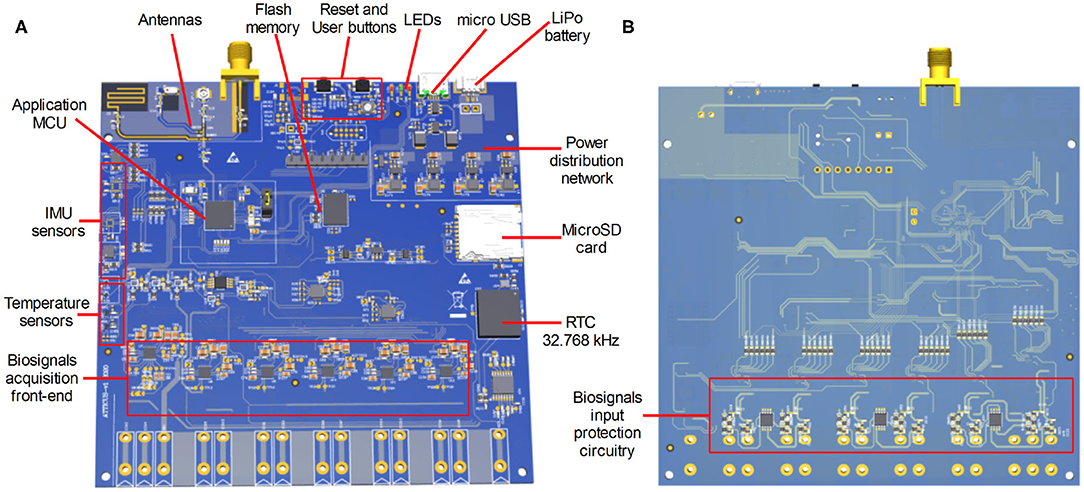
Figure 5. The first PCB evaluation board developed for ATTICUS data acquisition module: (A) the top side of the PCB, and (B) the bottom side of the PCB.
3.3. The Monitoring Software
In this section, we describe the monitoring software, the main tool that physicians at the monitoring center use to take care of the patients. The users of such system are the following:
• Administrator: is the person who manages the monitoring center, i.e., the user accounts and the warehouse of the monitoring kits;
• Monitoring Manager: has the same roles as the Specialist Doctor but she is also the only user who can enrol the patient in ATTICUS;
• Specialist Doctor: is the figure who can interact with the Assisted person both directly and through the monitoring software for the management of dangerous situations and not only. She must have the necessary skills to manage abnormal situations raised by the ATTICUS system. After accurately visualizing the patient's clinical conditions (e.g., ECG, breathing, vital parameters), she decides whether to confirm or cancel a received alarm. Also, she will be able to view and update the patient's medical records, follow up, add and/or modify instrumental and hematochemical examinations and, if necessary, modify and/or add a therapy assigned to the patient. The ATTICUS system will allow the practitioner to view real-time monitoring of the patient even if no alarm has been generated;
• Nurse (or Healthcare Operator): is the actor who will follow the patient during the home care phase. For each patient, the healthcare worker will be able to compile a report on the patient's health conditions during the periodic home visit and will be able to view and add any hematochemical, instrumental examinations performed by the patient. This information will enrich the patient's medical records and can be accessed not only by the health care worker who compiled the report but also by the specialist doctor and the monitoring manager assigned to the patient;
• Caregiver: is the person who supports a patient during the monitoring phase and helps them using the system correctly. Specifically, a caregiver can be either a family member of the patient or a nurse.
It is worth noting that the patient, i.e., the person who wears the S-WEAR device and is enrolled in the ATTICUS program, who is a key figure of the ATTICUS system, is not a user of the monitoring software, i.e., they do not directly interact with it.
Some of the main functionalities provided by the monitoring software are:
• warning and alarm management: the monitoring system provides a service for receiving and storing any alarms and warnings sent by monitoring devices (S-WEAR, S-BOX, and MyATTICUS). The monitoring system periodically checks for new alarms and warnings received so that it can notify the physician or monitoring manager when there are alarms to be handled;
• setting-up monitoring in alarm condition: after an alarm is notified and managed by the specialist physician or by the monitoring manager, the monitoring system shows to the latter the vital parameters monitored in real-time, including the geolocation of the patient. The enabled user can then discard or confirm the alarm; in the latter case, after confirming the alarm, the user can request the interruption of the data stream at any time;
• real-time monitoring request: the specialist doctors may use the monitoring system to require the activation of real-time data monitoring of a patient for whom it wishes to receive information (see Figure 6). In this case, the user cannot geolocalize the patient. The functionality has both the purpose of verifying the correct functioning of monitoring devices (prevention of malfunctions) and the possibility to verify the health status of a patient;
• monitoring kit management: the monitoring system gives to the Administrator the possibility to (i) insert a new monitoring kit, (ii) replace a monitoring kit, (iii) view the list of monitoring kits present and, from the latter, provide the operations of monitoring kit detail, (iv) modify monitoring kit, and (v) delete monitoring kit;
• home assistance: the monitoring system gives the possibility to the caregivers and to the nurses to manage the home care for the only patients for whom such an intervention is required. In this section of the system, the authorized user can fill in a new form, according to the home care assigned to the patient, or load hematochemical and instrumental examinations of a single patient.
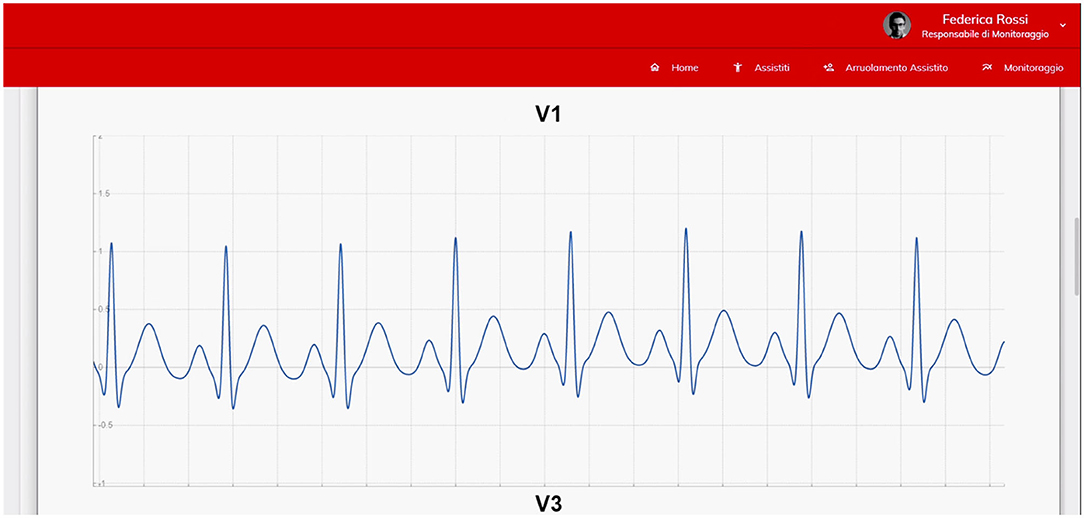
Figure 6. The real-time monitoring feature of the monitoring software.
3.4. The Decision Support System
This section describes the Decision Support System (DSS) distributed across the several layers of ATTICUS system. This is the component in charge of automatically analyzing the vitals and generating anomaly reports to the operator of the monitoring center. As already reported, the DSS is divided in level 1, installed on the S-WEAR, level 2, installed on the S-BOX/MyATTICUS app, and level 3, installed in the monitoring center.
The decision support system that is part of the monitoring center (DSS level 3) receives the information of the patients in case of possible anomalies and, through advanced automatic learning algorithms, verifies if a critical situation is present or not. The data received from the level 3 DSS can come from either the level 2 or the level 1 DSSs if they find any anomalies and raise a warning.
The ATTICUS components will have a different interaction depending on the usage scenario. Especially, we distinguish two scenarios: in-home monitoring and out-of-home monitoring. In the case of indoor monitoring, direct interaction will occur between S-WEAR and S-BOX. In detail, when the level 1 DSS (S-WEAR) identifies potential anomalous situations, it will send data to the level 2 DSS (S-BOX) which, in turn, will be able to analyze the data in real-time and send all the necessary information to the level 3 DSS. If the level 2 DSS is confident enough of the detection, it can send a confirmed anomaly (alarm) directly to the monitoring system, bypassing the level 3 DSS. The S-BOX will store all data received from MyATTICUS to have a history of the patient's data for possible analysis on the monitored parameters, as well as giving the possibility to the specialist physician and the monitoring manager to consult the data.
In the case of outdoor monitoring, the S-BOX will not be available. In this case, the MyATTICUS app will replace such a device and will perform all the anomaly analyses directly on the smartphone, which is more than capable of achieving this goal. If a possible anomaly is detected from the monitoring data, MyATTICUS will communicate with the DSS Level 3 or directly with the monitoring system in case of alarms, similarly to the S-BOX device. When the user returns home and can communicate with the S-BOX again, the data saved on the smartphone will be transferred to the S-BOX.
In ATTICUS, the exchange of data mainly depends on whether or not there are any anomalies. Under normal conditions, real-time data will be only stored on the smartphone or the S-BOX. Such devices will, in turn, send summary data to the monitoring software system every hour. Such summaries will include aggregate data about the patient's vitals. In alarm situations, instead, a data streaming process will start and real-time data will be sent to the level 3 DSS (in case of warning) or the monitoring system (in case of alarm).
To overcome any communication problems between S-WEAR and intermediate devices (S-BOX and smartphones), the S-WEAR will be equipped with a GSM module that will take care of direct communication via a data connection with the level 3 DSS in case of emergency.
When an alarm arrives at the operators at the monitoring center, its status can become either “canceled” or “confirmed,” depending on the feedback from the medical specialist or the monitoring manager. The preliminary analyses performed at level 1 and level 2 DSSs reduce the amount of data to be sent to level 3 DSS. Moreover, they allow to avoid (i) the presence of a single point of failure and (ii) the overload of the level 3 DSS. In the first case, if the level 3 DSS is offline for a while, medical specialists would have many anomaly warnings to analyze and many false positives could prevent them from analyzing the actual major anomalies; in the second case, there could be a possible delay in the confirmation of the alarm which could, in turn, be fatal for some types of anomalies. A scheme that summarizes the above interactions is depicted in Figure 7.
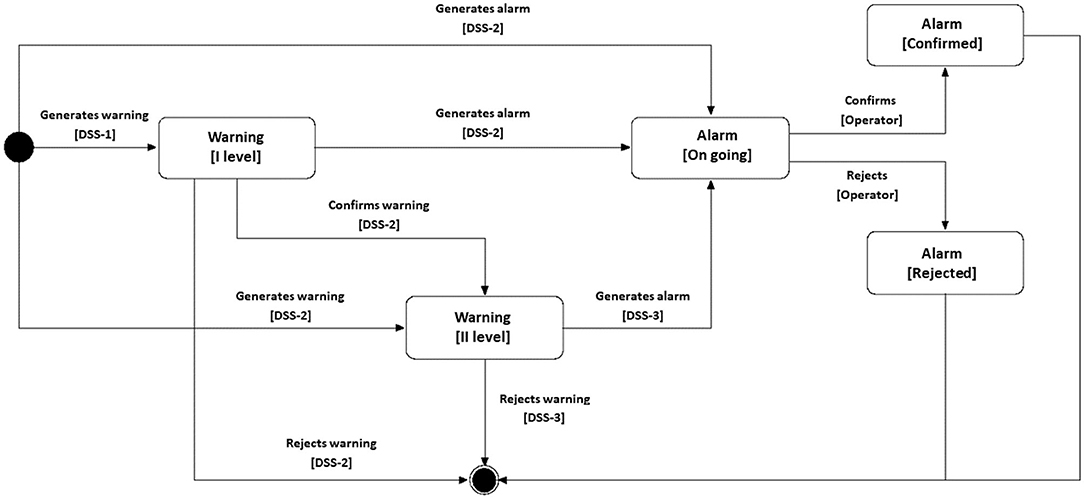
Figure 7. A scheme that resumes all the possible interactions between the three levels of DSS.
Depending on the type of vitals, the distributed DSS implemented in the ATTICUS system has been designed for detecting several anomalies. We describe below all the anomalies that the ATTICUS system can detect based on the signals taken into account.
3.4.1. ECG Monitoring
Although there has been a substantial reduction in cardiovascular mortality over the past 40–50 years, the most common cause of natural death in developed nations remain cardiovascular diseases (Huikuri et al., 2001). Arrhythmia, for example, is a disorder that affects the regularity of the heart rhythm, by observing too fast or too slow rhythm. Arrhythmia can be categorized into two types: atrial and ventricular. The latter may be particularly dangerous: Without continuous monitoring and the right attention, ventricular arrhythmia can lead to sudden cardiac arrest (Elhaj et al., 2016).
Atrial Fibrillation (AF) is another example of very common and dangerous arrhythmia that affects millions of people worldwide (Ball et al., 2013). The numbers say that in the United Kingdom, in 1995, nearly 534,000 people contracted the disease (Stewart et al., 2004). In 2010, the estimated number of men and women suffering from atrial fibrillation worldwide was 20.9 and 12.6 million, respectively. Also, the incidence was higher in developed countries, such as Europe and the United States. It is expected that—by 2030—the number of AF patients will be between 14 and 17 million in Europe alone (Kirchhof et al., 2016). Another important factor is that this condition is very expensive: in fact, the direct cost of healthcare for AF patients was about 655 million in 2000, equal to 0.97% of the total expenditure of the UK National Health System (Stewart et al., 2004); in the United States it has been estimated that the medical cost caused by AF is 26 billion per year (January et al., 2014). Most of the cost of healthcare for AF patients is due to hospitalization and home care. Also, some analyses indicate that the prevalence of the disease is expected to more than double in the next 50 years, along with the ageing population (Misayaka et al., 2006).
Ventricular tachycardia (VT) is another critical cardiovascular diseases that occur more frequently in the context of a structurally abnormal heart (Sirichand et al., 2017). It is not said, however, that ventricular arrhythmias can also occur in individuals who do not have any apparent heart disease, with abnormal structure. These cases are called idiopathic VT cases and represent 10% of all VT diagnoses (Brooks and Burgess, 1988). Sirichand et al. (2017) showed that the overall incidence of idiopathic VT, by age and gender, among people aged 18 years and older is 51.9 per 100,000. This rate is however lower than the incidence of atrial fibrillation and other common cardiovascular disorders, including myocardial infarction (Roger et al., 2002) and heart failure (Gerber et al., 2015). Unlike the latter two, however, the incidence of idiopathic VT seems to be increasing and may vary depending on age group and gender (Sirichand et al., 2017).
Numerous disorders—functional and structural—can weaken the ventricles and the fraction of blood expelled. These conditions can lead to heart failure (Holzapfel and Ogden, 2014). Worldwide, nearly 26 million people suffer from congestive heart failure (Ponikowski et al., 2014).
While the ECG signal can allow detecting several types of anomalies, in the ATTICUS system we focused the attention on the automatic detection of bradycardia, tachycardia, atrial fibrillation (AF), ventricular tachycardia (VT), ventricular extrasystole (VE). Also, we have designed automatic algorithms for the detection of ST-segment depression and elevation, bundle branch block (BBB), Atrial Premature Beats (APB), Premature Ventricular Contractions (PVC), and Congestive Heart Failure (CHF). Table 1 describes all the automatic methods expected to be embedded in the final version of the DSS of ATTICUS.
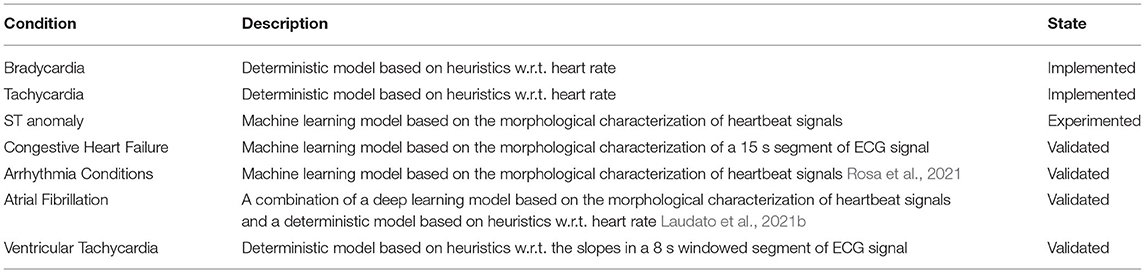
Table 1. Approaches integrated in ATTICUS for the detection of hearth-related anomalies.
The Bradycardia and Tachycardia detectors are based on a heuristic to be evaluated with respect to the monitored heart rate, while for the identification of ST anomalies we implemented an approach based on machine learning technique. The proposed approach preposed the ECG according to the guidelines provided by Maglaveras et al. (1998) and extract features for the classification in ST anomaly or normal rhythm using ECG features also exploited in related work (Zhao and Zhang, 2005; Leonarduzzi et al., 2010; Li and Zhou, 2016).
Also for the detection of congestive heart failure and arrhythmia conditions we implemented specific approaches based on machine learning techniques that exploit features extracted from the ECG. For instance, for the detection of arrhythmia conditions we extracted from the ECG the following features: (i) energy of maximal overlap discrete wavelet transform, (ii) Autoregressive Model, (iii) Multifractal Wavelet leader, (iv) Fast Fourier Transform, and (v) statistical RR interval descriptors (Rosa et al., 2021).
For what concerns the detection of Atrial Fibrillation, we designed an approach aims at simulating as much as possible the doctor behavior during the detection of AF episodes (Laudato et al., 2021b). Especially, the proposed approach first analyzes the morphology of the heartbeat to identify the absence of p-wave and then confirms the anomaly by checking the presence of an arrhythmia. The components involved in the algorithm are two: one integrating a LSTM Recurrent Neural Network (RNN) for the morphological analysis and the second integrating an entropy-based heuristic for the rhythm analyzer (Laudato et al., 2021b).
As for the automatic detection of Ventricular Tachycardia, we integrated into ATTICUS the approach proposed by Mohammad-Taheri et al. (2016). The rationale behind this method is to be found in the morphologic nature of a Ventricular Tachycardia episode, which exhibits sudden and close sign changes in the electrocardiographic signal. The slopes of the ECG signal are small in value and vary uniformly as the signal progresses over time, except for QRS complexes where an abrupt change is observed. However, there are many signal variations in VT episodes and their slopes change permanently over time. This suggests the use of slopes as a discriminative feature for cardiac arrhythmia detection. In ATTICUS we empirically fine-tuned the number of slopes that provide the best overall accuracy of the method.
3.4.2. Breathing Monitoring
As for the monitoring of the respiratory activity, the ATTICUS system supports both the identification of tachypneas and bradypneas.
Particular attention is given to the identification of Obstructive Sleep Apnea (OSA), a common medical condition characterized by an abnormal collapse of the pharyngeal airways during sleep, which causes repeated awakenings from sleep. A key feature of OSA is that patients make persistent efforts against the occluded upper airway to breathing. Efforts that contribute substantially to disturbed sleep. OSA manifests itself clinically through severe snoring, breathing pauses and excessive daytime sleepiness. OSA is associated with a wide range of health consequences (Redline and Strohl, 1998), the most common of which is excessive daytime sleepiness, which can be mild or severe enough to interfere with work. Also, OSA is associated with cognitive abnormalities (Engleman and Douglas, 1993; Engleman et al., 2000) and emotional disorders, such as depression (Day et al., 1999). OSA also appears to be associated with increased morbidity and mortality. He et al. (1988) observed that about 40% of patients with severe OSA died within 8 years of diagnosis.
Table 2 summaries the characteristics of the detectors integrated into ATTICUS for the detection of breath-related anomalies.
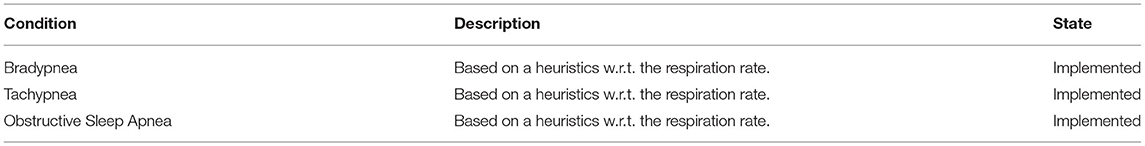
Table 2. Approaches integrated in ATTICUS for the detection of breath-related anomalies.
3.4.3. Inertial and Geographical Signals
As part of the monitoring of the patient's dynamics, the ATTICUS system provides support for the identification of falls and the tracking of the individual's position. According to the World Health Organization (WHO), falls are the second leading cause of death from accidental or involuntary injuries worldwide, after road accidents. The WHO official data state that every year, globally, more than 600,000 individuals die from falls and about 37 million falls are severe enough to require medical attention. Also, more than 80% of fall-related deaths occur in low and middle-income countries1, while in all regions of the world, mortality rates are higher among adults over 60 years of age and more than a third of elderly people fall once or more a year (Noury, 2002; Heinrich et al., 2010).
Table 3 reports on the detectors aimed at identifying inertial- and geographical-based anomalies.
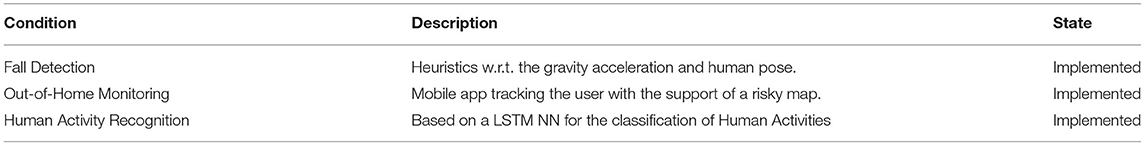
Table 3. Approaches integrated in ATTICUS for the detection of inertial- and geographical-related anomalies.
3.4.4. Temperature Monitoring
About temperature monitoring, in addition to the identification of febrile states, the ATTICUS system provides support for the identification of so-called heat stroke. Heatstroke is the result of a “failure” of the thermoregulation mechanisms to meet heat stress, which can lead to a rise in body temperature causing dysfunction and damage to organs (Hifumi et al., 2018). Risk factors in healthy subjects include environmental factors, salt and water depletion, infection, fever after immunization, lack of acclimatization, obesity, fatigue, and consumption of drugs that suppress sweating (Bezruchka, 2017). Among the individuals most affected by heatstroke are young and elderly, due to relatively poor temperature regulation in such individuals, especially during heatwaves. The mortality rate of heat stroke is variable and depends on the timing of a-posterior treatment of the disease. When treatment is rapid and effectively reduces internal temperature, mortality in young and healthy patients is minimal. In the context of effective delayed treatment and significant comorbidity, mortality can reach 70% (da Silva and Frontera, 2017).
Table 4 reports on the detectors aimed at identifying body temperature-based anomalies.
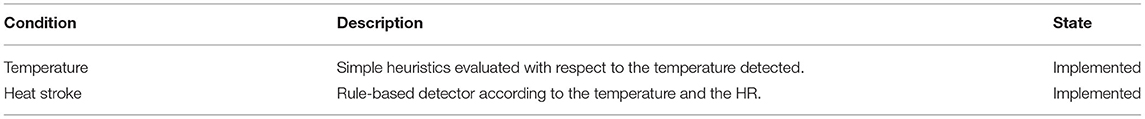
Table 4. Approaches integrated in ATTICUS for the detection of temperature-related anomalies.
3.4.5. Epidermic Monitoring
Epidermal monitoring in ATTICUS is exploited to offer an estimate of the patient's stress. The stress detector of ATTICUS implements an approach based on Galvanic Skin Response (GSR) proposed by Koldijk et al. (2016). GSR is considered, in fact, one of the best predictors for this condition. Stress is how the human body responds to any kind of question or threat, releasing specific stress hormones, including adrenaline and cortisol, which awaken the body to “face” an emergency action (Alić et al., 2016). Among the tangible responses, which the body can put into action, there is a more accelerated heartbeat, contracting muscles, increased blood pressure, accelerated breathing and senses that become more acute (Smith et al., 2013). Among the physiological parameters that can be used for stress detection are: GSR, heart rate and respiratory rate (Monajati et al., 2012). The common experience of feeling “stressed” mainly refers to a scenario in which the variation of some of the key systems of the human body occurs. For example, under stress conditions, an increase in cortisol, sympathetic activity and pro-inflammatory cytokines but also a decline in parasympathetic activity can be observed. Sleep deprivation is a frequent result of being “stressed.” This produces an allostatic overload that can have deleterious consequences (McEwen, 2006, 2007). The effects of this condition include elevated evening cortisol, insulin and blood glucose, high blood pressure, reduced parasympathetic activity and high levels of pro-inflammatory cytokines, as well as the intestinal hormone which increases appetite (McEwen, 2008).
3.4.6. Behavioral Monitoring
Knowing the habits of the users is an important factor to predict anomalous situations that occurred beyond the vitals monitored. To understand this importance, let us consider the following scenario. Vincent uses ATTICUS. One day, after taking a shower (without wearing the smart wearable), he slips in the tub and hits his head. The S-BOX, detecting the anomaly due to too much time spent in the shower (i.e., without the S-WEAR) sends a report to the operations center, which acts accordingly.
The DSS of ATTICUS embeds algorithms able to detect the following anomalies in the patients' habits, that we also summarize in Table 5:
• Removed wearable: If the patient does not wear the device for a long period, while in the past he/she never did this, the DSS can warn the physicians. The fact that the wearable is removed is sensed directly by the electronic component. Indeed, the ECG sensor we decided to integrate allows to keep track of the lead-off event, i.e., the case in which a specific textile sensor is not in contact to the body. When this condition is verified for all the electrodes, the wearable is considered as removed.
• Awake in anomalous periods: The DSS can detect cases in which the patient awakes during hours in which he/she is usually sleeping (e.g., during the night), possibly because he/she is feeling sick. To automatically detect the sleep of an ATTICUS user, we use an algorithm based on the work proposed by Palotti et al. (2019).
• Outdoor in anomalous periods and/or locations: The DSS detects if the patient is not at home at anomalous hours (e.g., during the night) or for anomalously long periods. This can help to detect cases in which, for example, elderly patients with dementia get lost. Also, thanks to a risky map2 ATTICUS can detect whether the monitored person is in a risky area that he/she usually does not frequent.
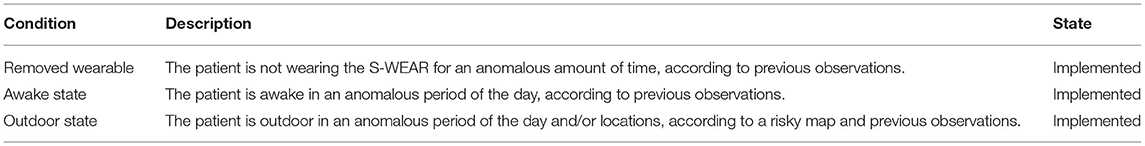
Table 5. Approaches integrated in ATTICUS for the detection of behavior-related anomalies.
4. Accuracy of the DSS
The ATTICUS system is currently under experimentation. However, we already validated some of the approaches we use in the ATTICUS DSS using the datasets available in the literature. We report in this section the experiments conducted for the detection of Atrial Fibrillation, Ventricular Tachycardia, Congestive Heart Failure, and four types of Arrhythmia conditions. Table 6 summaries the accuracy achieved by the different detectors.
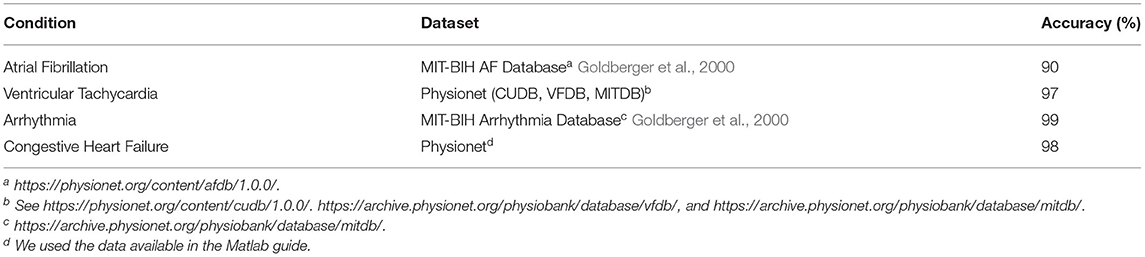
Table 6. Experimental results of the detectors fully validated in ATTICUS.
4.1. Automatic Detection of Atrial Fibrillation
The AF detector of ATTICUS (Laudato et al., 2021b) has been validated on two well-known public data sets: the Atrial Fibrillation and the Normal Sinus Rhythm Databases (Goldberger et al., 2000). We have considered the following basic classification metrics: True Positives (TP) for the beats labeled as AF and classified as AF, False Positives (FP) for the beats labeled as no-AF and classified as AF, True Negatives (TN) for the beats labeled as no-AF and classified as no-AF and False Negatives (FN) for the beats labeled as AF and classified as no-AF. We also analyze the results in terms of sensitivity, specificity, and accuracy, three widely used metrics for evaluating the classification effectiveness. We compared the proposed approach with two very accurate baselines: the approach proposed by Zhou et al. (2015), which focused on only RRI (RR Intervals) analysis, and MORPHYTHM (Laudato et al., 2020a), which uses a combination of morphological and rhythmic information. The results are expressed according to clusters of people, with a common ECG morphology (Laudato et al., 2021b). For Cluster 1, the ATTICUS detector outperforms both the baselines, by keeping a comparable specificity and better sensitivity and accuracy. For Cluster 2, instead, the ATTICUS detector provides significantly higher sensitivity with slightly lower specificity and accuracy, while for Cluster 3 the ATTICUS detector presents a significant loss, mostly in terms of sensitivity and accuracy. This difference in classification accuracy could be due to the nature of the ATTICUS detector: the morphological analyzer might be very suited for the recordings acquired from the patients in cluster 1.
4.2. Automatic Detection of Ventricular Tachycardia
The experimentation for the detection of Ventricular Tachycardia (VT) was carried out using the Physionet databases. ECGs with normal sinus rhythms were extracted from the MIT-BIH Normal Sinus Rhythm database, while ECGs with ventricular tachycardia rhythms were extracted from the following databases: (i) MIT-BIH arrhythmia database, (ii) MIT-BIH malignant ventricular arrhythmia, and (iii) CU ventricular tachyarrhythmia (Goldberger et al., 2000). All rhythms longer than 8 s, annotated as ventricular tachycardia, were selected, yielding a total of 16 patients, 380 8-s windows for a total of 3,040 s of ECG. To balance the dataset, 21 random 8-s windows were selected for all patients within the MIT-BIH Normal Sinus Rhythm database to obtain a total of 378 windows for a total of 3,024 s of ECG, and thus have a fair division of the data set. To keep a patient-independent validation scheme, we experimented the algorithm by using a leave one person out cross-validation. Also, for the identification of the best threshold for the number of slopes, we experimented 250 possible values. From this analysis, we noted that the threshold that optimally discriminates normal rhythms from ventricular tachycardia rhythms turns out to be 91. By experimenting the value 91 as threshold, we obtained 96.9% of Sensitivity, 97.8% of Specificity, and 97.3% of Accuracy. With respect to the threshold used in the original paper by Mohammad-Taheri et al. (2016), we obtained an improvement of 0.8% in terms of accuracy (96.5 vs. 97.3%).
4.3. Automatic Detection of Arrhythmia Conditions
The experimentation of this detector was conducted using the MIT-BIH arrhythmia (Goldberger et al., 2000), a state-of-the-art database commonly used as a reference dataset for arrhythmia identification in literature. It is composed of 48 ECG ambulatory recordings, where cardiologists provided annotations at heartbeat level. This procedure generated about 110,000 labeled digital signals. The recordings with paced beats were omitted from the analysis according to a consolidated protocol on this database (Xu et al., 2018). The experiment was therefore performed on the remaining 44 recordings. Five types of beat annotations were taken into account: normal beats, left and right bundle branch blocks, atrial premature beats, and premature ventricular contractions. Considering the average of the overall metrics, the detector of arrhythmia outperforms the state of the art baseline method (Pandey and Janghel, 2020) in terms of sensitivity, specificity, precision, and F1 score. In particular—with regards to the sensitivity and F1 score—the improvement is >2 and 1%, respectively.
4.4. Automatic Detection of Congestive Heart Failure
The congestive heart failure (CHF) detector of ATTICUS has experimented on a database containing 16,524 ECG segments: 3,060 segments contained congestive heart failure, 9,792 contained arrhythmia conditions, and 3,672 were normal. Before proceeding to the training of a model, we carried out an analysis of the features to select only the most informative ones. To this end, we first eliminated the features that correlated >0.9 with at least another feature. As a further features analysis step, we selected features according to importance weights using a tree classifier as an estimator. The importance of the features is calculated as the contribution of a feature to maximize the division criterion used by the algorithm, also defined as the minimization of the impurity of the child nodes, i.e., the Gini impurity (Breiman et al., 1984).
This procedure resulted in a dataset consisting of a subset of 52 descriptors compared to the initial generation. The accuracy of the proposed approach was studied under varying application of:
• An instance sampling technique between SMOTE (Chawla et al., 2002) (which mainly creates an oversampling of the minority class by generating synthetic examples) and Tomek's links (Tomek et al., 1976).
• Several machine learning models, including Random Forest (Ho, 1998) and Multi-layer Perceptron
• A standardization technique, depending on the type of classifier used. For example, we used standardization with Support Vector Machine and min-max scaling with Random Forest (Pal and Mitra, 1992).
The best results were obtained with ECG segments 15 s long, applying SMOTE, normalizing the data through the min-max scaler, and choosing a Random Forest model. The classification results have shown high effectiveness for the CHF class, with 93% precision and 98% recall. The overall accuracy of the model obtained is equal to 98%.
5. The Impact of the ATTICUS System
We focus on the two areas from which the ATTICUS system will most likely benefit the most, i.e., the treatment of congestive heart failure in the Italian health system through the so-called PDTAs (“Percorsi Diagnostico Terapeutici Assistenziali,” i.e., Diagnostic and Therapeutic Care Pathways), and the home care for elderly people.
5.1. Support to the PDTAs
The Congestive Heart Failure (CHF) is a chronic disease with a significant clinical impact: in Italy, about 600K people are currently diagnosed with CHF and it is estimated that about 0.3–2% of the population suffer from it. CHF is the second death cause in Italy, mostly because of the relatively high mortality, ranging between 19 and 30%, depending on the health condition of the patient: this means that the survival rate is lower than myocardial infarction and even of some kinds of malignancies (Maggioni et al., 2014).
The PDTAs were introduced to handle CHF and other similar conditions with an approach that requires the involvement of hospitals only for the acute phases to reduce the costs and improve the quality of the treatment for the patients that require immediate attention. For example, PDTAs could provide that, when the patient's condition is stable, she should be under the outpatient care of a Chronic Care Model team.
According to the data provided by the Italian Ministry of Health in 2010, the Molise region (the second smallest region in Italy) had the highest hospitalization rate in Italy for the elder people (between 65 and 84 years old), with 8.1 hospitalizations per 1,000 inhabitants: this means that such a region had the highest cost per inhabitant for the National Health System. Such a cost is about the triple compared to the best performing region (i.e., Valle d'Aosta). This is particularly unfavourable since the ageing of the population will most likely make this problem even more relevant shortly. There is a big room for improvement, mostly in the Molise region, for the implementation of PDTAs.
The ATTICUS system could be of paramount importance for achieving this goal. ATTICUS can be used for patients affected by CHF in their stable state: the system could constantly monitor the disease and rapidly alert the physicians when anomaly situations are met. Using the ATTICUS system would increase the confidence of physicians in avoiding hospitalization when not necessary, i.e., in their acute phases. Also, the collateral effect would be increased effectiveness of the treatment: when a patient has an unexpected acute phase when he/she is at home (i.e., during a presumed stable phase), the probability of rescue would increase drastically. The system, indeed, would be able to promptly notify the physicians, who would, in turn, call an ambulance on behalf of the patient.
5.2. Support to the Home Care
According to some estimates, in 2030 there will be 8 million elderly people with at least one serious chronic disease in Italy. Such a large slice of the population is also the most prone to require medical attention. While hospitalization is an option, most of the times it is not an ideal one if it is not strictly required. Also, when patients suffer from chronic diseases, the option is not viable at all since it would result in an overloading of health facilities.
The concept of home care is based on the need to avoid such a scenario. People in need of care, when possible, no longer have to go to the hospital. Specialized operators can intervene earlier at home, and hospitalization can be done only when necessary. This allows both (i) to streamline the flow of patients who arrive at the hospital, and (ii) to heal elderly people more effectively by reducing the stress and the possible risks caused from moving such patients to a different facility.
Italy, and, in particular, the Molise region, have a fragmented territorial conformation, with many small perched and isolated centers, among which it is often difficult to move. A centralized health system has difficulty providing care in these conditions.
The world of home care has changed over time, it has had to deal with the reality of things, with unexpected events and complex conditions. The data acquired by CoopCSS show that, compared to 2017, there was an increase by 3.2% of Integrated Home Care (ADI). Besides, the COVID-19 pandemic played a catalytic role by accelerating a process that had already begun years ago, with the crisis of the classic methods of health intervention: indeed, the pandemic has forced us to avoid hospitalization whenever possible to reduce the risk of infection for the people most prone to get a severe form of the disease. The limit of the health system is that it turned toward repairing the damage caused by the disease instead of supervising the protection of health in its socio-structural dimension. For this reason, home care goes in the direction of building primary care from below.
The ATTICUS system finds an ideal application in the context of home care: automatically monitoring the health parameters allows to predict the arrival of a possible emergency, when this is preceded by changes in the monitored parameters. In this way, the caregivers and the physicians can be warned and they can promptly intervene. Besides this application, the ATTICUS system can help the operators to understand if a non-drug treatment is working for a specific patient by constantly monitoring their health parameters.
It is worth noting that, in such a context, the contact between operator and patient is of paramount importance: as previously mentioned, most of the patients are elderly people alone, sick, and not self-sufficient: such people often joyfully wait for an operator, not only to receive care or treatment but also to establish human contact. Contrary to what could be thought, the continuous monitoring provided by the ATTICUS system goes exactly in this direction. Such a system, indeed, is not designed to fully replace the caregivers, but rather to allow them to focus more on the human aspects of the intervention by offloading the monitoring and analytical aspects.
6. Pitfalls and Lessons Learned
During the development of the ATTICUS system, we faced and needed to solve several problems. In this section, we provide some details about the typical difficulties that can be found while developing a telemonitoring system, such as ATTICUS, the solutions we found, and the lessons we learned.
6.1. Garment Design
As already described, we took into account three prototypes of smart wearable:
• T-shirt: a prototype version of the ATTICUS wearable inspired by the textile surface of a classic t-shirt;
• Band: this prototype is represented by a band that crosses completely the body perimeter, approximately at the chest height;
• Bustier: this wearable prototype is inspired by the t-shirt concept but adaptable to human bodies, regardless of gender. It is an adapted undershirt: short in length (the surface does not reach waist height) and with the textile surface—intended for pecs—represented by a thin line of fabric that crosses the center of the chest area.
We initially considered a T-shirt prototype, which was the most intuitive choice. T-shirt prototypes have the advantage of exploiting a large surface on which to implant the textile electrodes. Unfortunately, they do not guarantee the same fabric-skin grip depending on the gender of the person wearing the garment. Women could have a less stable skin-electrode contact due to their chest area, reducing the adaptability of the garment. A possible solution would have been not to have a unisex model, but to design and produce different models. This solution, however, would have required to maintain two different products, with possibly different electrode configurations, and higher production costs. On the other hand, the band prototype allows for uniformity between genders, as it can be placed at the end of the sternum. However, the small surface area of such a model would not give the possibility to perform monitoring of a wide range of biomedical sensors, including bioimpedance sensors for respiration. For these reasons we decided to use a bustier prototype, inspired by the concept of a classic sports bodice, but adapted so that it can be worn by both men and women, ensuring the same functionality and acquisition quality. Specifically, the designed prototype simulates a kind of second smart skin: the bustier acts as an additional layer of skin. By this concept, we mean a garment that allows the wearing of undershirts (to men) and bras (to women). From this perspective, the chosen bustier represents a compromise between electrode integration surface and homogeneity of use between genders.
Lesson Learned 1. The most intuitive and commonly accepted cloth design is not necessarily the most appropriate one as a smart wearable. Also, there might be important trade-offs even for the choice of the garment type, and it is important to carefully evaluate them.
6.2. Conductive Materials
As for the conductive materials required to capture the biomedical signals, we experimented with the potential of carbon black as a conductive material in textile electrode application. We noticed that carbon black electrodes do not fully adhere to the skin when the bustier is worn: it takes some time for the carbon black to adhere better to the skin, but this time is shorter if a light layer of sweat is available on the skin of the person being monitored. While this made us consider to switch to a different material, our tests showed that, despite such a problem, carbon black was still the best option in our context. However, we had to deal with the fact that the initial transient, generated by the carbon black, affects the quality and accuracy of the signals acquired at an early stage of monitoring. When the adherence increases, electrocardiographic signals show an improvement in terms of shape and noise.
Lesson Learned 2. When using carbon black as a textile electrode, it is necessary to make sure that the hardware devices that capture the signal wait ~30 min before registering the ECG signal acquisition to reduce the initial noise due to the low adherence. To reduce this lag, stimulating the users' sweating through the use of specific materials for the wearable could be an option.
6.3. Signal Acquisition Noise
The acquisition of biomedical signals can be very noisy in some circumstances. Most of the artifacts in the acquired signals were due to the movements of the user (Movement Artifact, MA), to the Electrode Motion (EM) and Baseline Wander (BW) (Apandi et al., 2020). This is an open problem that still needs to be solved in the literature, and for which we had no solution. At the moment, we are studying automatic algorithms to recognize such disturbs and we plan to use human activity recognition (HAR) methods as a multi-variate analysis in such a context. For example, if a motion artifact and simultaneously a running activity are detected, the episode can be handled accordingly.
Lesson Learned 3. Disturbs may strongly impact on the quality of signals acquired and, therefore, of the automated predictions. To face such a pitfall, we are studying automatic algorithms to recognize such kinds of noise, and we will test HAR for multi-variate analysis.
6.4. Handling Big Data
Real-time continuous monitoring requires a huge exchange of data: our sensors generate ~900 MB of data per hour for each patient. Also, ECG signals need to be acquired and represented with high accuracy to ensure accurate signal analysis. Therefore, parameters, such as the sampling rate and the accuracy of the electrocardiographic can not be sacrificed to reduce the amount of data exchange. This involves the generation of a signal with considerable weight. ATTICUS is composed of a battery-powered wearable device and a distributed automatic analysis system for the medical decision support: large signals impact both the wireless transmission and the occupied server-side memory. We face this pitfall mostly by using a multi-level DSS: we only send detailed data to the server when the local DSSs detect possible issues, to reduce the amount of exchanged data. However, this strategy does not completely fix the issue since all the data still need to be sent from the wearable device to the S-BOX device. For this reason, we are embedding in the software a technique of compressive sensing (CS) (Picariello et al., 2021). The reconstruction phase from the compressed samples usually involves complex algorithms with a relatively high computational cost that should be able to guarantee the signal integrity by keeping clinically relevant features (Da Poian et al., 2017). This cost is balanced by the very small payload of the wirelessly transmitted data provided by the wearable device that performs data compression. In general, the CS methods require low computational effort for the compression, which is performed on the wearable device, and high computational effort for the reconstruction, which is usually performed on a more powerful device (a dedicated device, in our case). First attempts in the definition of approaches for information retrieval in compressed ECG have been proposed in Laudato et al. (2020b, 2021a).
Lesson Learned 4. Telemedicine systems that require the acquisition of the ECG signal from many leads do not scale easily because of the large amount of data they need to handle. It is important to reduce the amount of data sent to the server that should be memorized. A solution is sending data only in possibly anomalous conditions, by using local DSSs. We are testing the use of a compressive sensing algorithm and specific detectors to be applied directly onto compressed data.
7. Conclusion
We presented ATTICUS, an innovative telemedicine system based on the Internet-of-Medical-Things paradigm. ATTICUS is a complex system composed of several modules. An innovative wearable device (S-WEAR) allows monitoring the patients' vitals through several sensors placed on the garment. An ambient intelligence system (S-BOX) and an app (MyATTICUS) constantly monitor the vitals and raise warnings or alarms when anomaly situations arise. Finally, a monitoring software, used at a monitoring center by physicians and other operators, allows such professionals to manually intervene both reactively—in case of an emergency—or proactively—to monitor the health status of their patients.
The core of the ATTICUS system is represented by a distributed Decision Support System (DSS), which allows to automatically detect several anomaly situations at three levels: electronic device on the S-WEAR (level 1), S-BOX—for indoor—and MyATTICUS—for outdoor—(level 2), and monitoring center (level 3). This allows to avoid the bottleneck of a single DSS and to optimize the resource consumption (e.g., battery).
The ATTICUS system can have a very positive impact both for the treatment of chronic diseases (such as cardiac heart failure), and for the home care of elderly people in general.
Data Availability Statement
The original contributions presented in the study are included in the article/supplementary material, further inquiries can be directed to the corresponding author/s.
Author Contributions
LG was the project coordinator. RO was the scientific coordinator, while RM was the team leader of the ATTICUS project. GL, SS, AC, QC, RD'O, RD, LD, FP, and IT contributed to the design and the implementation of the ATTICUS system. All authors contributed to the article and approved the submitted version.
Funding
The authors were supported by the project PON-ARS01_00860 titled Ambient-intelligent Tele-monitoring and Telemetry for Incepting and Catering over hUman Sustainability—ATTICUS funded by the Italian Ministry of Education and Research—RNA/COR 576347.
Conflict of Interest
QC, RD'O, and RD were employed by the company CSS, Moda Impresa, and DISC, respectively.
The authors declare that this study received funding from Italian Ministry of Education and Research. The funder was not involved in the study design, collection, analysis, interpretation of data, the writing of this article or the decision to submit it for publication.
Footnotes
1. ^https://www.who.int/en/news-room/fact-sheets/detail/falls
2. ^A map reporting risky areas, such as railroad tracks, ravines, riverbanks, or lakes.
References
Alić, B., Sejdinović, D., Gurbeta, L., and Badnjevic, A. (2016). “Classification of stress recognition using artificial neural network,” in 2016 5th Mediterranean Conference on Embedded Computing (MECO) (Bar: IEEE), 297–300. doi: 10.1109/MECO.2016.7525765
Apandi, Z. F. M., Ikeura, R., Hayakawa, S., and Tsutsumi, S. (2020). An analysis of the effects of noisy electrocardiogram signal on heartbeat detection performance. Bioengineering 7:53. doi: 10.3390/bioengineering7020053
Axisa, F., Schmitt, P., Gehin, C., Delhomme, G., McAdams, E., and Dittmar, A. (2005). Flexible technologies and smart clothing for citizen medicine, home healthcare, and disease prevention. IEEE Trans. Inform. Technol. Biomed. 9, 325–336. doi: 10.1109/TITB.2005.854505
Balestrieri, E., Boldi, F., Colavita, A. R., De Vito, L., Laudato, G., Oliveto, R., et al. (2019). “The architecture of an innovative smart t-shirt based on the internet of medical things paradigm,” in 2019 IEEE International Symposium on Medical Measurements and Applications (MeMeA), 1–6. doi: 10.1109/MeMeA.2019.8802143
Balestrieri, E., Daponte, P., de Vito, L., Picariello, F., Rapuano, S., and Tudosa, I. (2020). A Wi-Fi internet-of-things prototype for ECG monitoring by exploiting a novel compressed sensing method. Acta IMEKO. Istanbul 9, 38–45. doi: 10.21014/acta_imeko.v9i2.787
Ball, J., Carrington, M., McMurray, J., and Stewart, S. (2013). Atrial fibrillation: profile and burden of an evolving epidemic in the 21st century. Int. J. Cardiol. 167, 1807–1824. doi: 10.1016/j.ijcard.2012.12.093
Bezruchka, S. (2017). “Disequilibrium: jet lag, motion sickness, cold exposure, and heat illness,” in The Travel and Tropical Medicine Manual (Elsevier), 121–137. doi: 10.1016/B978-0-323-37506-1.00009-X
Breiman, L., Friedman, J., Stone, C. J., and Olshen, R. A. (1984). Classification and Regression Trees. CRC Press.
Brooks, R., and Burgess, J. (1988). Idiopathic ventricular tachycardia. A review. Medicine 67, 271–294. doi: 10.1097/00005792-198809000-00001
Chawla, N. V., Bowyer, K. W., Hall, L. O., and Kegelmeyer, W. P. (2002). Smote: synthetic minority over-sampling technique. J. Artif. Intell. Res. 16, 321–357. doi: 10.1613/jair.953
Da Poian, G., Rozell, C. J., Bernardini, R., Rinaldo, R., and Clifford, G. D. (2017). Matched filtering for heart rate estimation on compressive sensing ECG measurements. IEEE Trans. Biomed. Eng. 65, 1349–1358. doi: 10.1109/TBME.2017.2752422
da Silva, I., and Frontera, J. (2017). Neurologic complications of acute environmental injuries. Handb. Clin. Neurol. 141, 685–704. doi: 10.1016/B978-0-444-63599-0.00037-5
David, V., Adochiei, N., Adochiei, F., and Tudosa, I. (2011a). “ECG waves and features extraction using wavelet multi-resolution analysis,” in 2011 E-Health and Bioengineering Conference (EHB) (Iasi), 1–4.
David, V., Adochiei, N., and Tudosa, I. (2011b). Methods of electromagnetic interference reduction in electrocardiographic signal acquisition. Environ. Eng. Manage. J. 10, 553–559. doi: 10.30638/eemj.2011.077
Day, R., Gerhardstein, R., Lumley, A., Roth, T., and Rosenthal, L. (1999). The behavioral morbidity of obstructive sleep apnea. Prog. Cardiovasc. Dis. 41, 341–354. doi: 10.1053/pcad.1999.0410341
Di Rienzo, M., Meriggi, P., Rizzo, F., Castiglioni, P., Lombardi, C., Ferratini, M., et al. (2010). Textile technology for the vital signs monitoring in telemedicine and extreme environments. IEEE Trans. Inform. Technol. Biomed. 14, 711–717. doi: 10.1109/TITB.2010.2048921
Elhaj, F. A., Salim, N., Harris, A. R., Swee, T. T., and Ahmed, T. (2016). Arrhythmia recognition and classification using combined linear and nonlinear features of ECG signals. Comput. Methods Prog. Biomed. 127, 52–63. doi: 10.1016/j.cmpb.2015.12.024
Engleman, H., and Douglas, N. (1993). Cognitive effects and daytime sleepiness. Sleep. 16(8 Suppl):S79
Engleman, H., Kingshott, R., Martin, S., and Douglas, N. (2000). Cognitive function in the sleep apnea/hypopnea syndrome (SAHS). Sleep 23, S102–S108.
Eurostat (2020). Healthcare Expenditure Statistics. Available online at: https://ec.europa.eu/eurostat/statistics-explained/index.php/Healthcare_expenditure_statistics#Healthcare_expenditure (accessed Sepember 30, 2020).
Gerber, Y., Weston, S., Redfield, M., Chamberlain, A., Manemann, S., Jiang, R., et al. (2015). A contemporary appraisal of the heart failure epidemic in olmsted county, minnesota 2000 to 2010. JAMA Intern. Med. 175, 996–1004. doi: 10.1001/jamainternmed.2015.0924
Goldberger, A. L., Amaral, L. A., Glass, L., Hausdorff, J. M., Ivanov, P. C., Mark, R. G., et al. (2000). Physiobank, physiotoolkit, and physionet: components of a new research resource for complex physiologic signals. Circulation 101, e215–e220. doi: 10.1161/01.CIR.101.23.e215
He, J., Kryger, M., Zorick, F., Conway, W., and Roth, T. (1988). Mortality and apnea index in obstructive sleep apnea: experience in 385 male patients. Chest 94, 9–14. doi: 10.1378/chest.94.1.9
Heinrich, S., Rapp, K., Rissmann, U., Becker, C., and König, H. (2010). Cost of falls in old age: a systematic review. Osteoporos. Int. 21, 891–902. doi: 10.1007/s00198-009-1100-1
Hifumi, T., Kondo, Y., Shimizu, K., and Miyake, Y. (2018). Heat stroke. J. Intens. Care 6:30. doi: 10.1186/s40560-018-0298-4
Ho, T. K. (1998). The random subspace method for constructing decision forests. IEEE Trans. Pattern Anal. Mach. Intell. 20, 832–844. doi: 10.1109/34.709601
Holzapfel, G., and Ogden, R. (2014). Biomechanics of Soft Tissue in Cardiovascular Systems, Vol. 441. Springer.
Huang, P., Lin, C., Wang, Y., and Hsieh, H. (2019). “Development of health care system based on wearable devices,” in 2019 Prognostics and System Health Management Conference (PHM-Paris), 249–252. doi: 10.1109/PHM-Paris.2019.00049
Huikuri, H., Castellanos, A., and Myerburg, R. (2001). Sudden death due to cardiac arrhythmias. N. Engl. J. Med. 345, 1473–1482. doi: 10.1056/NEJMra000650
ISTAT (2014). I Presidi Residenziali Socio-Assistenziali e Socio-Sanitari. Available online at: https://www.istat.it/it/files//2014/12/Presidi-socio-sanitari-assistenziali_2012.pdf (accessed Sepember 30, 2020).
ISTAT (2019). Demografia in Cifre. Available online at: http://demo.istat.it/pop2019/index.html (accessed Sepember 30, 2020).
January, C., Wann, L., Alpert, J., Calkins, H., Cigarroa, J., Cleveland, J., et al. (2014). 2014 AHA/ACC/HRS guideline for the management of patients with atrial fibrillation: a report of the american college of cardiology/american heart association task force on practice guidelines and the heart rhythm society. J. Am. Coll. Cardiol. 64, e1–e76. doi: 10.1161/CIR.0000000000000041
Kirchhof, P., Benussi, S., Kotecha, D., Ahlsson, A., Atar, D., Casadei, B., et al. (2016). 2016 ESC guidelines for the management of atrial fibrillation developed in collaboration with eacts. Eur. J. Cardiothorac. Surg. 50, e1–e88. doi: 10.1093/ejcts/ezw313
Koldijk, S., Neerincx, M. A., and Kraaij, W. (2016). Detecting work stress in offices by combining unobtrusive sensors. IEEE Trans. Affect. Comput. 9, 227–239. doi: 10.1109/TAFFC.2016.2610975
Laudato, G., Boldi, F., Colavita, A. R., Rosa, G., Scalabrino, S., Torchitti, P., et al. (2020a). “Combining rhythmic and morphological ECG features for automatic detection of atrial fibrillation,” in HEALTHINF (Valletta), 156–165. doi: 10.5220/0008982301560165
Laudato, G., Oliveto, R., Scalabrino, S., Colavita, A. R., De Vito, L., Picariello, F., et al. (2020b). “Identification of r-peak occurrences in compressed ECG signals,” in 2020 IEEE International Symposium on Medical Measurements and Applications (MeMeA) (La Valletta: IEEE), 1–6. doi: 10.1109/MeMeA49120.2020.9137207
Laudato, G., Picariello, F., Scalabrino, S., Tudosa, I., De Vito, L., and Oliveto, R. (2021a). “Morphological classification of heartbeats in compressed ECG,” in HEALTHINF (Bari). doi: 10.5220/0010236003860393
Laudato, G., Rosa, G., Capobianco, G., Colavita, A., Forno, A. D., Divino, F., et al. (2021b). “Simulating the doctor's behaviour: identification of atrial fibrillation through combined analysis of heart rate and beat morphology,” in DataScienceBook-2020 (Data Science and Big Data Analytics in Smart Environments).
Leonarduzzi, R. F., Schlotthauer, G., and Torres, M. E. (2010). “Wavelet leader based multifractal analysis of heart rate variability during myocardial ischaemia,” in 2010 Annual International Conference of the IEEE Engineering in Medicine and Biology (Buenos Aires: IEEE), 110–113. doi: 10.1109/IEMBS.2010.5626091
Li, T., and Zhou, M. (2016). ECG classification using wavelet packet entropy and random forests. Entropy 18:285. doi: 10.3390/e18080285
Lmberis, A., and Dittmar, A. (2007). Advanced wearable health systems and applications–research and development efforts in the european union. IEEE Eng. Med. Biol. Mag. 26, 29–33. doi: 10.1109/MEMB.2007.364926
Maggioni, A., Rossi, E., Cinconze, E., Rielli, R., De Rosa, M., and Martini, N. (2014). Characteristics, cost and outcomes of patients hospitalized for heart failure (HHF): analysis of a community database of nearly 3,000,000 subjects. Eur. J. Heart Failure 16:91.
Maglaveras, N., Stamkopoulos, T., Pappas, C., and Strintzis, M. G. (1998). An adaptive backpropagation neural network for real-time ischemia episodes detection: development and performance analysis using the european ST-T database. IEEE Trans. Biomed. Eng. 45, 805–813. doi: 10.1109/10.686788
McEwen, B. (2006). Sleep deprivation as a neurobiologic and physiologic stressor: allostasis and allostatic load. Metabolism 55, S20–S23. doi: 10.1016/j.metabol.2006.07.008
McEwen, B. (2007). Physiology and neurobiology of stress and adaptation: central role of the brain. Physiol. Rev. 87, 873–904. doi: 10.1152/physrev.00041.2006
McEwen, B. (2008). Central effects of stress hormones in health and disease: understanding the protective and damaging effects of stress and stress mediators. Eur. J. Pharmacol. 583, 174–185. doi: 10.1016/j.ejphar.2007.11.071
Mikulic, M. (2020). Global Telemedicine Market Size in 2019 and a Forecast for 2026. Available online at: https://www.statista.com/statistics/671374/global-telemedicine-market-size/ (accessed Sepember 30, 2020).
Misayaka, Y., Barnes, M., Gersh, B., Cha, S., Bailey, K., Abhayaratna, W., et al. (2006). Secular trends in incidence of atrial fibrillation in Olmsted county Minnesota 1980 to 2000 and implications on the projection for future prevalence. Circulation 114, 119–125. doi: 10.1161/CIRCULATIONAHA.105.595140
Mohammad-Taheri, S., Shirazi, M. M., and Rafiezade, A. (2016). “Slope analysis based methods for detection of ventricular fibrillation and ventricular tachycardia,” in 24th Iranian Conference on Electrical Engineering (ICEE) (Shiraz), 1100–1103. doi: 10.1109/IranianCEE.2016.7585685
Monajati, M., Abbasi, S., Shabaninia, F., and Shamekhi, S. (2012). Emotions states recognition based on physiological parameters by employing of fuzzy-adaptive resonance theory. Int. J. Intell. Sci. 2, 166–175. doi: 10.4236/ijis.2012.224022
Neves, A., Rodrigues, D., De Sanctis, A., Alonso, E., Pereira, M., Amaral, V., et al. (2017). Towards conductive textiles: coating polymeric fibres with graphene. Sci. Rep. 7:4250. doi: 10.1038/s41598-017-04453-7
Noury, N. (2002). “A smart sensor for the remote follow up of activity and fall detection of the elderly,” in 2nd Annual International IEEE-EMBS Special Topic Conference on Microtechnologies in Medicine and Biology. Proceedings (Cat. No. 02EX578) (IEEE), 314–317. doi: 10.1109/MMB.2002.1002337
Pal, S. K., and Mitra, S. (1992). Multilayer Perceptron, Fuzzy Sets, Classifiaction Pal et al. (1992) is part of the old Transactions on Neural Networks. IEEE J.
Palotti, J., Mall, R., Aupetit, M., Rueschman, M., Singh, M., Sathyanarayana, A., et al. (2019). Benchmark on a large cohort for sleep-wake classification with machine learning techniques. NPJ Digit. Med. 2:50. doi: 10.1038/s41746-019-0126-9
Pandey, S. K., and Janghel, R. R. (2020). “Automatic arrhythmia recognition from electrocardiogram signals using different feature methods with long short-term memory network model,” in Signal, Image and Video Processing, 1–9. doi: 10.1007/s11760-020-01666-8
Picariello, F., Iadarola, G., Balestrieri, E., Tudosa, I., and De Vito, L. (2021). A novel compressive sampling method for ECG wearable measurement systems. Measurement 167:108259. doi: 10.1016/j.measurement.2020.108259
Ponikowski, P., Anker, S., AlHabib, K., Cowie, M., Force, T., Hu, S., Jaarsma, T., Krum, H., Rastogi, V., and Rohde, L. others (2014). Heart failure: preventing disease and death worldwide. ESC Heart Failure 1, 4–25. doi: 10.1002/ehf2.12005
Redline, S., and Strohl, K. (1998). Recognition and consequences of obstructive sleep apnea hypopnea syndrome. Clin. Chest Med. 19, 1–19. doi: 10.1016/S0272-5231(05)70428-7
Roger, V., Jacobsen, S., Weston, S., Goraya, T., Killian, J., Reeder, G., et al. (2002). Trends in the incidence and survival of patients with hospitalized myocardial infarction, olmsted county, minnesota 1979 to 1994. Ann. Intern. Med. 136, 341–348. doi: 10.7326/0003-4819-136-5-200203050-00005
Rosa, G., Laudato, G., Colavita, A. R., Scalabrino, S., and Oliveto, R. (2021). “Automatic real-time beat-to-beat detection of arrhythmia conditions,” in HEALTHINF (Wien). doi: 10.5220/0010267902120222
Seyedin, S., Razal, J., Innis, P., and Wallace, G. (2016). A facile approach to spinning multifunctional conductive elastomer fibres with nanocarbon fillers. Smart Mater. Struct. 25:035015. doi: 10.1088/0964-1726/25/3/035015
Sirichand, S., Killu, A., Padmanabhan, D., Hodge, D., Chamberlain, A., Brady, P., Kapa, S., and Noseworthy, P. others (2017). Incidence of idiopathic ventricular arrhythmias: a population-based study. Circ. Arrhyth. Electrophysiol. 10:e004662. doi: 10.1161/CIRCEP.116.004662
Smith, M., Segal, R., and Segal, J. (2013). Stress Symptoms, Signs & Causes: Effects of Stress Overload. HelpGuide.org.
Stewart, S., Murphy, N., Walker, A., McGuire, A., and McMurray, J. (2004). Cost of an emerging epidemic: an economic analysis of atrial fibrillation in the UK. Heart 90, 286–292. doi: 10.1136/hrt.2002.008748
Tada, Y., Amano, Y., Sato, T., Saito, S., and Inoue, M. (2015). A smart shirt made with conductive ink and conductive foam for the measurement of electrocardiogram signals with unipolar precordial leads. Fibers 3, 463–477. doi: 10.3390/fib3040463
Trindade, I., Silva, J., Miguel, R., Pereira, M., Lucas, J., Oliveira, L., et al. (2016). Design and evaluation of novel textile wearable systems for the surveillance of vital signals. Sensors 16:1573. doi: 10.3390/s16101573
Vishnu, S., Ramson, S. R. J., and Jegan, R. (2020). “Internet of medical things (IoMT)–an overview,” in 2020 5th International Conference on Devices, Circuits and Systems (ICDCS) (Coimbatore), 101–104. doi: 10.1109/ICDCS48716.2020.243558
Wang, C., Qin, Y., Jin, H., Kim, I., Granados Vergara, J. D., Dong, C., et al. (2019). A low power cardiovascular healthcare system with cross-layer optimization from sensing patch to cloud platform. IEEE Trans. Biomed. Circuits Syst. 13, 314–329. doi: 10.1109/TBCAS.2019.2892334
Xu, S. S., Mak, M. W., and Cheung, C. C. (2018). Towards end-to-end ECG classification with raw signal extraction and deep neural networks. IEEE J. Biomed. Health Inform. 23, 1574–1584. doi: 10.1109/JBHI.2018.2871510
Zhao, Q., and Zhang, L. (2005). “ECG feature extraction and classification using wavelet transform and support vector machines,” in 2005 International Conference on Neural Networks and Brain, Vol. 2 (IEEE), 1089–1092. doi: 10.1109/ICNNB.2005.1614807
Keywords: wearable devices, telemedicine, decision support system, machine learning, monitoring system
Citation: Laudato G, Scalabrino S, Colavita AR, Chiacchiari Q, D'Orazio R, Donadelli R, De Vito L, Picariello F, Tudosa I, Malatesta R, Gallo L and Oliveto R (2021) ATTICUS: Ambient-Intelligent Tele-monitoring and Telemetry for Incepting and Catering Over hUman Sustainability. Front. Hum. Dyn. 3:614309. doi: 10.3389/fhumd.2021.614309
Received: 05 October 2020; Accepted: 29 March 2021;
Published: 20 May 2021.
Edited by:
Robert Alexander, IBM, United StatesReviewed by:
Derek Reilly, Dalhousie University, CanadaAlessandra Agostini, University of Milano-Bicocca, Italy
Copyright © 2021 Laudato, Scalabrino, Colavita, Chiacchiari, D'Orazio, Donadelli, De Vito, Picariello, Tudosa, Malatesta, Gallo and Oliveto. This is an open-access article distributed under the terms of the Creative Commons Attribution License (CC BY). The use, distribution or reproduction in other forums is permitted, provided the original author(s) and the copyright owner(s) are credited and that the original publication in this journal is cited, in accordance with accepted academic practice. No use, distribution or reproduction is permitted which does not comply with these terms.
*Correspondence: Rocco Oliveto, cm9jY28ub2xpdmV0b0B1bmltb2wuaXQ=