 Elena Keller
 Willings Botha
 Georgina M. Chambers
- Centre for Big Data Research in Health & National Perinatal Epidemiology and Statistics Unit, UNSW Sydney, Sydney, NSW, Australia
Background: Using traditional health technology assessment (HTA) outcome metrics, such as quality-adjusted life-years, to assess fertility treatments raises considerable methodological challenges because the objective of fertility treatments is to create new life rather than extend, save, or improve health-related quality of life.
Objective: The aim of this study was to develop a novel cost-benefit framework to assess value for money of publicly funded IVF treatment; to determine the number of cost-beneficial treatment cycles for women of different ages; and to perform an incremental cost-benefit analysis from a taxpayer perspective.
Methods: We developed a Markov model to determine the net monetary benefit (NMB) of IVF treatment by female age and number of cycles performed. IVF treatment outcomes were monetized using taxpayers' willingness-to-pay values derived from a discrete choice experiment (DCE). Using the current funding environment as the comparator, we performed an incremental analysis of only funding cost-beneficial cycles. Similar outputs to cost-effectiveness analyses were generated, including net-benefit acceptability curves and cost-benefit planes. We created an interactive online app to provide a detailed and transparent presentation of the results.
Results: The results suggest that at least five publicly funded IVF cycles are cost-beneficial in women aged <42 years. Cost-benefit planes suggest a strong taxpayer preference for restricting funding to cost-beneficial cycles over current funding arrangements in Australia from an economic perspective.
Conclusions: The provision of fertility treatment is valued highly by taxpayers. This novel cost-benefit method overcomes several challenges of conventional cost-effectiveness methods and provides an exemplar for incorporating DCE results into HTA. The results offer new evidence to inform discussions about treatment funding arrangements.
1. Introduction
Infertility affects one in eight couples (1) and >180 million people worldwide representing an increasing public health problem (2). The value of the global market for fertility treatments is estimated to reach US$27 billion in 2026 (3). The major contributory factors include a trend to later childbearing and, thus, an increase in age-related infertility, as well as an increase in the prevalence of infertility due to medical conditions such as obesity and reducing sperm counts (4–6).
1.1. Fertility treatments and public funding
Infertility causes significant personal suffering for couples, including long-term sadness, interruption to life plans, a sense of loss of meaning, and stigmatization (2, 7). Fertility treatments allow many of these couples to conceive. Various treatment options are available, of which in vitro fertilization (IVF) is most common with >2 million IVF cycles performed globally each year (8). At a global level, there is arguably no other medical intervention that displays such varying government and third-party funding arrangements as IVF (9), including significant variation in the eligibility criteria and maximum number of publicly financed treatment cycles (10–16). In the latest survey of assisted reproductive technology (ART) practices and policies undertaken in 2019 by the International Federation of Fertility Societies, less than half (47%) of reporting countries provided any type of financial support for ART. This compared to 64% in the previous survey conducted in 2016. Moreover, only 20% of reporting countries offered full reimbursement for ART services (17). For instance, there is no public funding for ART in the United States, although several states have insurance mandates for partial cover (18). In the United Kingdom, the National Institute for Health and Care Excellence recommends three full IVF cycles for women aged <40 years or one full cycle for women aged 40–42 years (19). While there is no limit on the number of IVF treatment cycles subsidized under the Australian universal health insurance scheme, called Medicare (20), only partial funding is available, meaning couples are still faced with substantial out-of-pocket costs.
1.2. Inadequacy of traditional health technology assessment methods
Arguably, the reason for such variation in funding arrangements is the lack of an adequate metric in economic evaluation that reflects the value that society places on fertility treatment (21). Although some research has been done on the comparative cost-effectiveness of various fertility treatments (22–28), there is no evidence on whether the provision of subsidized treatment provides good value for money.
Traditional health technology assessment (HTA) outcome metrics, which focus on health-related quality of life, such as cost per quality-adjusted life-years (QALYs) or disability-adjusted life-years (DALYs), are debatably inadequate when used for fertility treatments (21, 29, 30). Quality-adjusted life-years and DALYs were designed for, and thus are best suited to, measuring changes in health-related quality of life for already existing lives with utility weights derived from societal preferences for different health states (31). They are thus conceptually different to measuring the value gained through the future conception of a baby. Unlike most other types of medical care, fertility treatment is judged by its ability to create life rather than extend, save, or improve health-related quality of life. Therefore, the use of QALYs as outcome measure is limited to measuring the maternal and/or paternal health-related quality of life gains (e.g., prevention of psychological suffering resulting from involuntary childlessness). This only captures a component of the utility/disutility associated with fertility treatment, much of which is associated with non-health outcomes reflecting achieving life goals. Essentially, by undergoing fertility treatment individuals are buying hope to have a child and the potential to create a meaningful life, rather than improving health or avoiding disease (21, 30, 32, 33). The challenges of using QALYs to value fertility treatment are highlighted by a review of cost-effectiveness analyses for fertility treatments (34) that showed that only one of 14 studies employed QALYs. Contrastingly, using QALYs in the context of perinatal interventions (e.g., perinatal screening) is appropriate because the decision is about avoiding diseases in a life that has already been conceived (pregnancy or newborn) or is assumed to be conceived in the future (prenatal in prospective parents). Methodological challenges in economic evaluations of fertility treatments have been extensively highlighted in the literature (21, 29, 35). Cost-benefit analysis (CBA) which measures value in monetary units, is an alternative among existing HTA techniques that might be better equipped for an economic evaluation of therapies that create life, such as IVF treatment (29, 30), and potentially overcomes the challenge of incorporating non-health-related benefits. Cost-benefit analysis allows incorporation of willingness-to-pay (WTP) values to capture the value associated with a health intervention and holistically reflects the health and non-health preferences of relevant stakeholders.
1.3. Cost-benefit analysis framework
The basis of CBA methods is that goods and services – or fertility treatments in this case – should only be provided if doing so is profitable, that is the monetary value of the benefits exceeds the cost of achieving those benefits. In the context of IVF treatment, the decision-rule would be to provide treatment only when the benefits (e.g., a live birth) outweigh the costs of providing IVF, that is when the net monetary benefit (NMB) is positive. A taxpayer (general population) perspective was chosen because Australian taxpayers fund the majority of the cost of IVF through the universal health insurance scheme, Medicare, with no restriction on female age or number of cycles. Furthermore, the WTP for a statistical baby from an ex-ante taxpayer perspective would be less biased than from an ex-post patient perspective, with many patients willing to subject themselves to significant financial stress in the hope of having a child (36–38).
The success rates of fertility treatment generally decline with a woman's age (39–43), duration of infertility (41), and number of previously failed attempts (39). This implies that (1) expected costs of providing IVF treatment will outweigh expected benefits at some point and, therefore, suggests that there is a maximum number of cost-beneficial treatment cycles; (2) fertility treatment is less cost-beneficial in older compared to younger women, i.e., a smaller number of cycles would provide good value for money. Only two studies have undertaken a form of CBA for fertility treatment but did not account for age or number of cycles performed (44, 45).
Despite McIntosh (46) outlining hypothetically how to incorporate discrete choice experiment (DCE) results into a CBA framework and how to create outputs that are similar to cost-effectiveness analyses (CEAs) such as net-benefit acceptability curves, we are aware of only two studies that have attempted to incorporate DCE results into a CBA framework. One study compared WTP values for perinatal services with the costs (47), while another study (48) generated cost-benefit planes for a CBA alongside a randomized controlled trial in the context of dental primary care. The disconnect between the proliferation in DCEs and their minimal use in HTA is an area of growing research need (49–52).
1.4. Objectives
The aims of this study were to develop a CBA framework that uses DCE results to conduct an economic evaluation of IVF treatment and to determine the NMB stratified by female age and number of treatment cycles from a taxpayer perspective. An additional objective was to conduct an incremental CBA similar to traditional HTA methods using the current public funding arrangement in Australia as the comparator.
2. Materials and methods
2.1. Model structure
A Markov decision analytic model (Figure 1) was constructed from a taxpayer (i.e., general population) perspective including all clinically and economically relevant stages of IVF treatment. This means the key outcomes possible from treatment initiation to live birth or unsuccessful treatment were represented. A fresh IVF cycle (Supplementary Figure S1, Appendix A) was represented by controlled ovarian stimulation (COS), followed by oocyte pick-up (OPU) procedure. Oocyte pick-up is followed by egg fertilization to create an embryo, and then a fresh embryo transfer or a freeze-all embryo cycle. A thaw cycle (Supplementary Figure S2, Appendix A) was represented by thawing of embryos, and frozen/thaw embryo transfer or failure of the thaw resulting in no embryos being viable. At each stage of the fresh or thaw cycle the cycle could be discontinued for medical or non-medical reasons. Both a fresh and thaw cycle could result in a live birth (singleton or multiple birth) or a “failed cycle” including no clinical pregnancy, miscarriage, or stillbirth. We defined a Markov cycle as one fresh or thaw cycle (i.e., a maximum of one embryo transfer procedure), and a complete cycle as all fresh and thaw cycles resulting from one OPU procedure.
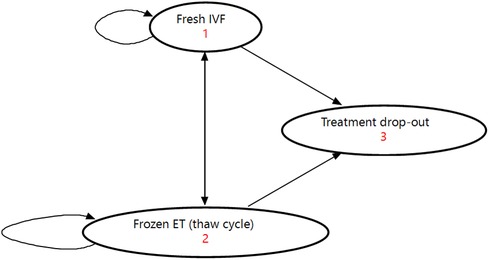
Figure 1. Illustration of Markov model used for analysis. ET, embryo transfer; IVF, in vitro fertilization.
We constructed ten age-specific models for the following female age groups: <30, 30–31, 32–33, 34–35, 36–37, 38–39, 40–41, 42–43, 44–45, and >45 years.
The treatment pathways were defined using Markov health states representing cumulative numbers and types of IVF cycles (including IVF with fresh and frozen embryo transfer). Correspondingly, the length of Markov cycles was defined as one IVF cycle. The model was restricted to a time horizon of 20 Markov cycles, a maximum of eight complete IVF cycles, and a maximum of four live births per woman, meaning the model was terminated once one or more of these conditions were met. This model time horizon was chosen for the following reasons: (1) Twenty Markov cycles would allow up to 20 embryo transfers (i.e., fresh and thaw cycles) and, thus, should not pose a significant restriction. Currently women undertaking ART treatment in Australia undergo two cycles, on average, with approximately 11% of women undergoing four or more fresh and/or thaw cycles (53). (2) Due to the comprehensive data required for the model and the small number of women undergoing more than eight complete IVF treatment cycles, we limited the time horizon to a maximum of eight complete cycles. In comparison, cost-effectiveness analyses of IVF treatment generally only include up to 3–4 cycles (34). (3) The number of live births was restricted to a maximum of four given that it is highly unlikely women will undergo further fertility treatment and given that, currently, 99% of families with children have ≤4 children (54). No discounting was applied because the perspective of the analysis is the costs incurred and the benefits obtained over a one-year period, hence discounting was inconsequential. Permanent treatment drop-out (meaning women do not return for further IVF cycles) was defined as the absorbing state. The outcome was defined as a live birth of at least one child, which was subsequently monetized for the CBA.
2.2. Utilization of IVF treatment
We populated the model with data on initiated autologous IVF cycles undertaken in Australia between 2014 and 2018 (i.e., the most recent years with available data). We only included data for women commencing IVF treatment between 2014 and 2016 to allow for sufficient follow-up time and undergoing multiple cycles. We excluded data for cycles with <30 women per complete cycle and age group. In affected age groups (44–45 and >45-year-old women) we only analyzed the model up to the last complete cycle with data for ≥30 women (up to the seventh complete cycle in 44–45-year-old women and the third complete cycle in >45-year-old women). The proportion of women reaching each stage of the model was applied to a population of 100,000 women in each age group during model analysis.
2.3. Data sources
2.3.1. Costs
Given the taxpayer (general population) perspective specified by the DCE, we included direct healthcare costs funded through Australia's national health insurance scheme, Medicare. Information on treatment costs was obtained from previous analyses of fertility treatment costs (55) together with a survey of tariffs charged by Australian fertility clinics. Direct costs comprised Medicare Benefits Schedule and Pharmaceutical Benefits Scheme expenditure. In line with the DCE, patient out-of-pocket payments were not considered in the model. In addition, we included indirect costs resulting from increased health risks of multiple births compared to singleton infants (55). These indirect costs were measured in terms of the government-funded hospital costs for the infants in their first year of life. All costs are expressed in undiscounted 2020 Australian dollars [2020 purchasing power parity: AU$1 = US$0.71 (56)].
To derive the average costs per taxpayer for each stage of treatment within the model (i.e., each node in Supplementary Figures S1 and S2, Appendix A), we divided each cost item (e.g., government rebate for COS) by 320.25, the average number of taxpayers funding each complete fertility treatment cycle in Australia (14,288,292 taxpayers in financial year 2017–2018 (57) divided by 44,616 complete fertility treatment cycles conducted in 2018 in Australia (58)). This approach allowed us to explore the impact of (1) the number of taxpayers as well as (2) the number of complete fertility treatment cycles conducted annually in Australia on the CBA results in sensitivity analyses.
2.3.2. Live births
Transition probabilities, which include treatment discontinuation and success rates, were sourced from the Australian and New Zealand Assisted Reproduction Database (ANZARD). ANZARD is a clinical registry of IVF cycles performed by all Australian fertility clinics and complete ascertainment is assumed (58). Data from the ANZARD 2014–2018 Australian cohort provided live-birth rates by age group for women with successive IVF cycles which was critical for informing the CBA. Consistent with previous literature (22), we defined a live birth as the birth of at least one live-born baby >20 weeks of gestational age and surviving for ≥28 days. Furthermore, we counted live births as birth events, meaning a multiple live birth was counted as a single live-birth event.
2.3.3. Monetary value of a baby
The WTP per taxpayer for a live birth can be defined similarly to the value of a statistical life as the WTP for a marginal increase in the chance of having a baby – also called the value of a statistical baby (VSB) (30). The literature on VSB estimates is limited with only one study from 1994 reporting estimates as part of a feasibility study (59). Instead, to derive the VSB, we used WTP values for fertility treatment attributes that were elicited using a stated-preference DCE among Australian taxpayers (60, 61). In this DCE, participants were asked to choose between fertility treatment programs described by seven attributes/characteristics, thereby trading off additional annual tax payments against higher treatment success rates among other characteristics. The taxpayer perspective was chosen because it reflects the healthcare payer HTA perspective. More details regarding the design and analysis of the DCE can be found in Supplementary Appendix B. Botha, Donnolley (61) estimated taxpayer's WTP for a 1% increase in the treatment live-birth rate to be $2.23 in additional tax contributions, meaning the taxpayer VSB would be $223 in additional tax contributions, which captures taxpayers' valuation for parental health and non-health benefits as well as for the potential to form a family and achieve life goals. Similar to the value of a statistical life, this VSB represents the WTP for a marginal increase in the treatment live-birth rate, rather than the WTP for an identified life.
2.4. Model analysis
Given that the probability of a live birth after fertility treatment in women using their own eggs depends predominately on female age, and the number of available embryos for transfer (39, 40, 62), we used Monte Carlo simulation (i.e., microsimulation), instead of a cohort analysis, to analyze the model. Microsimulation tracks single patients with specific characteristics through the Markov model, thereby determining their outcomes and associated costs. Numerous patients (base-case: n = 100,000 per age group) were simulated and the average cost and benefit values for these patients have then been compared.
To calculate the average costs per taxpayer per complete IVF cycle by age, we multiplied the proportion of women reaching each stage of the Markov model with the corresponding average cost per taxpayer for the different types of partial and complete cycles of IVF treatment and summed all costs by age group and cycle.
We then calculated the average age- and cycle-specific cost per taxpayer and live birth as the average costs per taxpayer per complete cycle by age divided by the age- and cycle-specific live-birth rate. The main outcome measure of the CBA was the NMB for each age group and cycle [Equation (1)]. It was calculated as the WTP per taxpayer for a live birth (VSB) minus the average age- and cycle-specific cost per taxpayer and live birth.
Equation 1: Calculation of the net monetary benefit (NMB).
We performed all analyses from two perspectives: (1) We only considered women in each complete cycle who reached OPU in the Markov model, meaning that all women dropping out of treatment prior to undergoing OPU and their associated costs were excluded from the analysis. This scenario is often considered by decision-makers, reflects funding limits based on the number of OPUs, and was our primary analysis. (2) We considered all women initiating a treatment cycle (i.e., undergoing COS), meaning that all 100,000 patients simulated as well as their costs were considered. This scenario is a better reflection of the funding required for the provision of IVF as it also accounts for sunk costs attributed to women dropping out of treatment prior to OPU. This scenario reflects funding limits based on the number of initiated cycles.
We determined the number of treatment cycles that provide good value for money according to taxpayer preferences as the number of cycles with a positive NMB.
2.5. Sensitivity analyses
2.5.1. One-way sensitivity analyses
We explored the uncertainty around the VSB, the number of fertility treatment cycles conducted annually, and the number of taxpayers in one-way sensitivity analyses (Table 1) as these are the input parameters assumed to be most uncertain and, hence, to potentially have the biggest impact on results. The number of fertility treatment cycles conducted annually and the number of taxpayers are relevant parameters as they jointly determine the average cost per taxpayer for a treatment cycle which is then compared to the taxpayer VSB. In other words, the marginal value per extra baby per taxpayer is constant, but the average cost per taxpayer per cycle is determined by the number of cycles performed and the number of taxpayers in a country. For instance, average costs per treatment cycle per taxpayer are reduced by half if the number of taxpayers in a country is held constant but the number of fertility treatment cycles performed is halved, and this would lead to a more favorable comparison against the taxpayer VSB and, thus, a higher NMB. Results were visualized using tornado plots. In addition, we conducted threshold analyses: Holding all other parameters (including treatment costs and transition probabilities) fixed, we calculated the threshold (1) VSB, (2) number of complete fertility treatment cycles conducted annually, and (3) number of taxpayers in Australia beyond which treatment in each age group and cycle does not provide good value for money.
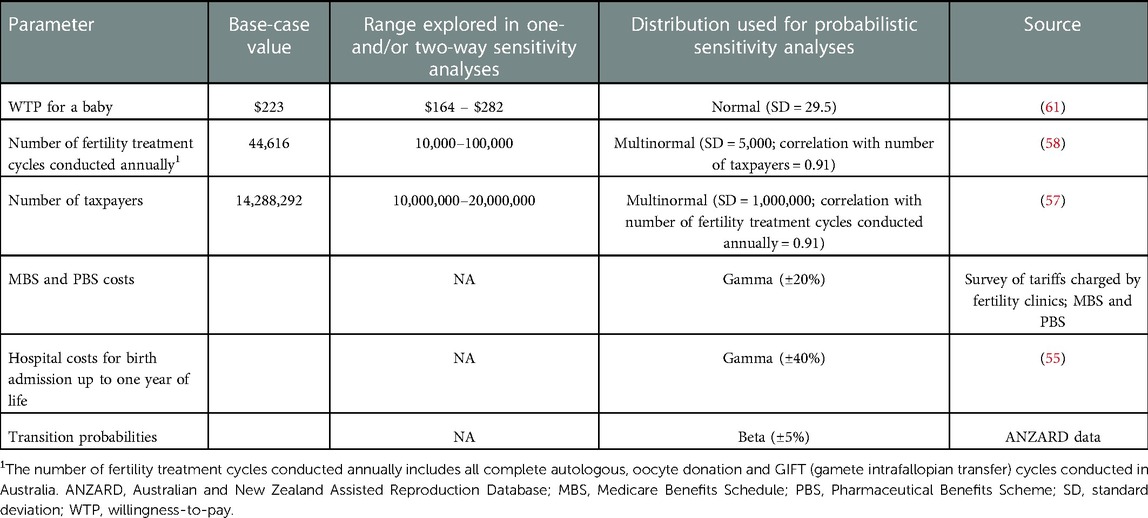
Table 1. Input parameters for the cost-benefit analysis of IVF treatment from a taxpayer perspective in Australia.
2.5.2. Two-way sensitivity analyses
The number of taxpayers and the number of fertility treatment cycles conducted annually in Australia historically had a strong positive correlation with a correlation coefficient of 91.21% based on data from 2005 to 2018 (57, 58, 63–88). Consequently, with an increase in the number of taxpayers, which likely means an increase in the number of reproductive-aged women, the number of fertility treatment cycles conducted annually tends to go up and they jointly determine the average costs of fertility treatment provision per taxpayer. In two-way sensitivity analyses we determined the number of cost-beneficial cycles by age for each combination of the number of taxpayers (range: 10–20 million) and fertility treatment cycles conducted annually (range: 10,000–100,000). Results were presented using area charts.
2.5.3. Probabilistic sensitivity analyses (PSA)
In PSA a probability distribution was used to quantify the uncertainty around relevant parameters (Table 1). We also used a correlation coefficient of 91.21% between the annual number of fertility treatment cycles and the number of taxpayers to define a multinormal distribution. To conduct the PSA, we performed 1,000 iterations of simultaneously simulating 1,000 women in the model. The results were used to construct net-benefit acceptability curves which visualize the probability of a scenario providing good value for money (46) and to estimate 95% confidence intervals (CI) around the base-case results using a percentile approach (89).
2.6. Incremental analyses
To support the results of the base-case and sensitivity analyses, we conducted an incremental analysis using the current funding environment as the comparator (additional details in Supplementary Appendix C). This allowed us to construct incremental cost-benefit ratios (ICBR) plotted in a cost-benefit plane following the approach outlined in McIntosh (46). We defined the comparator as funding the current “package” of fertility treatment in Australia, which is characterized by providing funding for an unlimited number of cycles in all age groups. To facilitate the analysis, we derived the costs and benefits per taxpayer of an average cycle in this package according to Equation (2). Using utilization data for 2018 (based on ANZARD) to determine the proportion of cycles stratified by age group and complete cycle, we calculated the sum of proportionate costs and benefits per taxpayer in each cycle and age group. For instance, if a first complete cycle in <30-year-old women costs $30 per taxpayer and 1% of all cycles conducted annually represent first complete cycles in this age group, then we would consider $0.30 ($30 × 1%) in the calculation for the costs of an average cycle in the current package. The other summands are calculated equivalently and represent the costs in all other cycles and age groups. The calculation for the benefits of an average cycle in the current package is equivalent.
Equation 2: Calculation of the costs per taxpayer for an average cycle in the current package of fertility treatment.
The “policy intervention” which we compared to the current funding arrangement was defined as funding the number of cycles that were deemed cost-beneficial stratified by age in the CBA. To determine the sum of age- and cycle-specific proportionate costs and benefits per taxpayer in the policy intervention we used the same utilization data. Prior to determining the proportion of cycles stratified by age group and complete cycle, we excluded any complete cycles that were not found to provide good value. Otherwise, calculations were equivalent.
Finally, we determined incremental costs and incremental benefits as the difference in average costs and benefits per taxpayer, respectively, between the policy intervention and the current package of fertility treatment.
2.7. Cost-effectiveness analysis
For comparison with economic evaluations of fertility treatment, including IVF treatment, reported in the literature, we performed an additional cost-effectiveness analysis of IVF treatment based on the same Markov model structure as for the CBA. Outcomes are reported as (1) cost per live birth, and (2) cost per QALY gained. Detailed methodology and results are provided in Supplementary Appendix D.
2.8. Online app
In addition to results presented within the manuscript and appendix, we created an interactive online app [https://elenakeller.shinyapps.io/CBA_IVF_Treatment/] with additional tables and figures, including:
• Summary statistics by age group and complete cycle for base-case analyses
• Tornado plots and threshold graphs for one-way sensitivity analyses
• Area charts for two-way sensitivity analyses
• Net-benefit acceptability curves for PSA
• Incremental cost-benefit planes for incremental analyses
This allowed us to provide our findings in a transparent, accessible way, and has several advantages over providing tables and figures as part of the appendix: (1) Given the complexity of our CBA, we generated >250 figures. The online app allows readers to choose the scenario (per OPU or per initiated cycle), age group, and complete cycle (e.g., first complete cycle) for which they would like to see the corresponding results. By changing the scenario, age group, and/or complete cycle, readers can directly observe the impact of these changes on the outcome measures and can more easily determine general trends. (2) Outcome measures such as the NMB varied substantially between age groups, particularly between women aged <42 and ≥42 years. If plotting all age groups in one figure, data from younger age groups is compressed to the degree that differences between age groups become indiscernible. In contrast, in the online app, axes can be adjusted using a slider to select the range of interest. (3) Responsive labels for single data points in figures provide exact values of outcome measures, whereas in an appendix this level of detail would not be possible.
Examples of all tables and figures are provided in Supplementary Appendix E for the 38–39-year-old age group.
Ethics approval was obtained from the University of New South Wales, Sydney (HC16983). The study has been performed in accordance with the ethical standards of the Declaration of Helsinki. All analyses were performed using TreeAge software version 2021, R1 (90) and R version 4.0.3 (91).
3. Results
3.1. Base-case analyses
Average live-birth rates per woman after up to eight complete cycles as well as the number of women with one, two, three and four live births in total are displayed by age group in Table 2. Additionally, Figure 2 illustrates treatment outcomes stratified by complete cycle for 38–39-year-old women as an example. Due to high treatment drop-out rates in each cycle <1% of women proceeded to an eighth complete cycle in this age group.
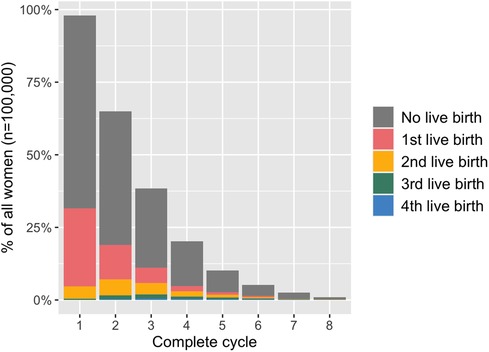
Figure 2. Treatment outcomes in 38-39-year-old women stratified by complete cycle. The height of the bar indicates the proportion of all women (n = 100,000) who started each complete cycle (as defined by undergoing an oocyte pick-up procedure).
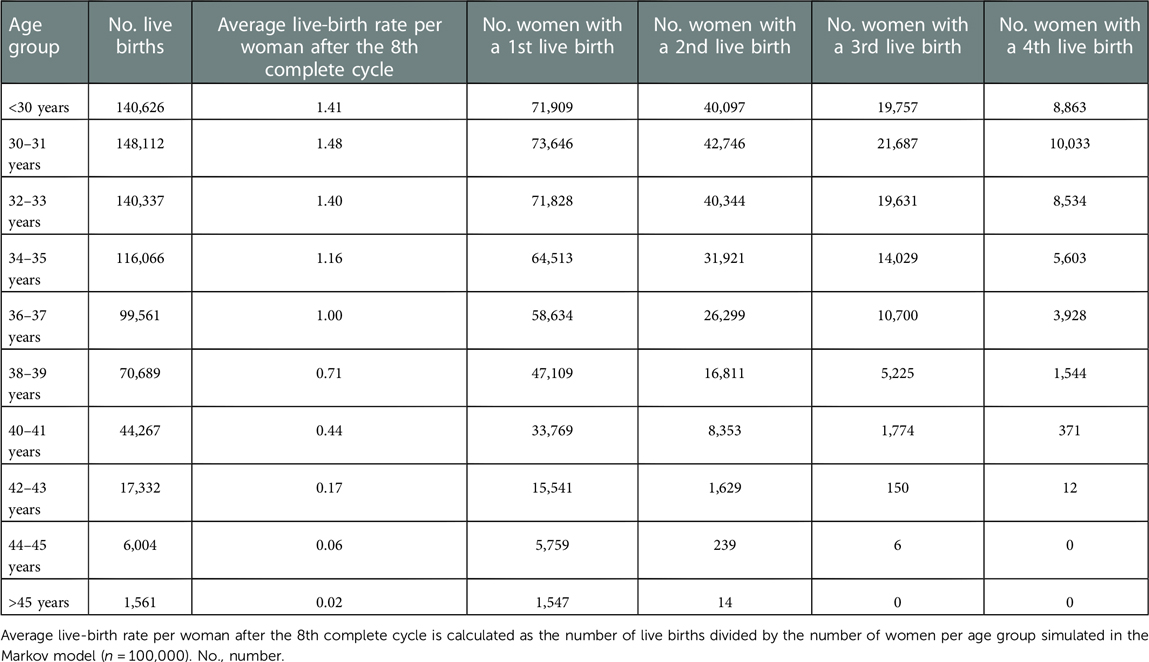
Table 2. Cumulative live-birth rates and number of women with live births by age group for the base-case analysis.
Results for both scenarios considered (per OPU and per initiated cycle) were similar, hence, we only report on the main analysis (i.e., per OPU). Table 3 provides base-case results for 38–39-year-old women as an example. We refer readers to the online app for additional tables and figures (Figure 3). The example results show the decrease in the number of women starting a cycle (from 97,953 to 1,011) as well as the decreasing trend in the cycle-specific live-birth rate over successive cycles (from 0.32 to 0.09 live births per cycle). Generally, the lower the cycle-specific live-birth rate, the higher the average costs per taxpayer and live birth, and the smaller the NMB. In 38–39-year-old women, the NMB tended to decrease over successive cycles and it turned negative in the eighth complete cycle, meaning seven complete IVF cycles were cost-beneficial.
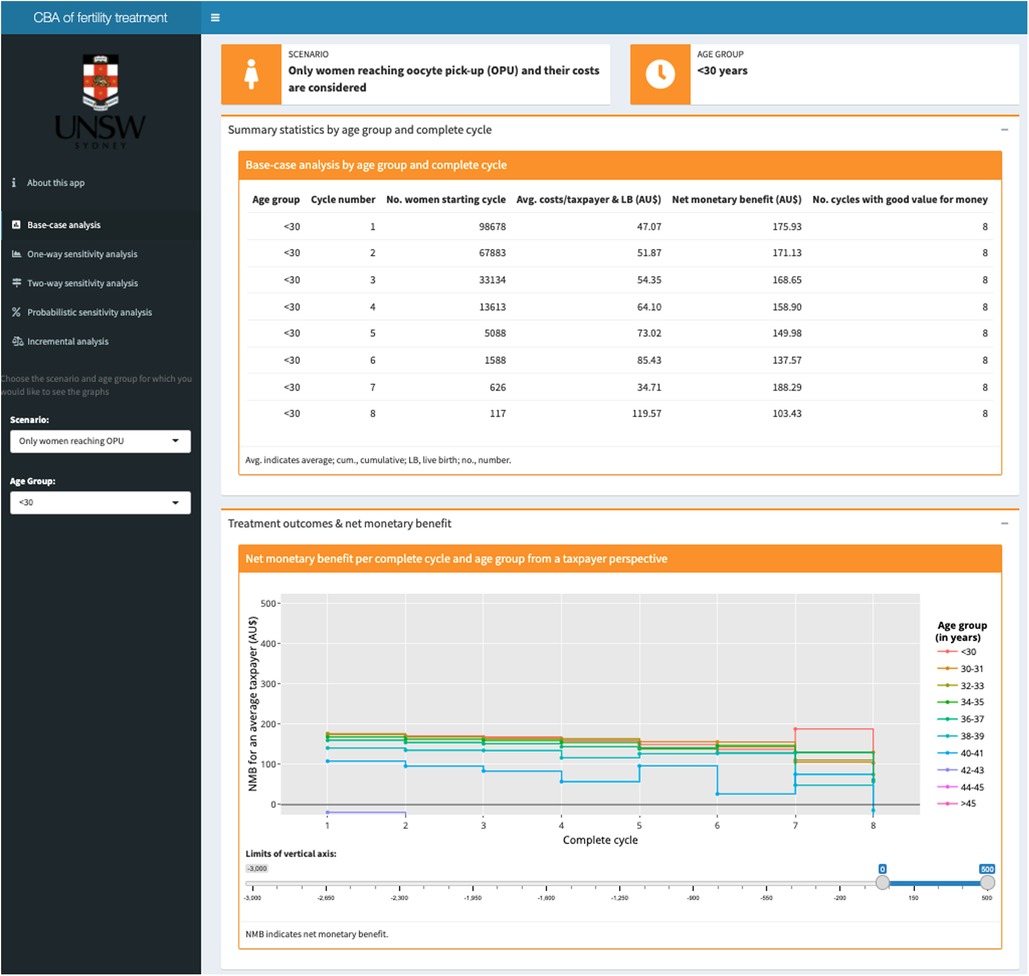
Figure 3. Screenshot of the base-case analysis results page in the interactive online app showing (1) a table with summary statistics at the top; and (2) a graph plotting the net monetary benefit across all cycles by age group at the bottom. Based on the selection in the dark grey panel on the left for the (1) scenario (per OPU or per initiated cycle) and (2) age group, tables and figures are automatically updated.
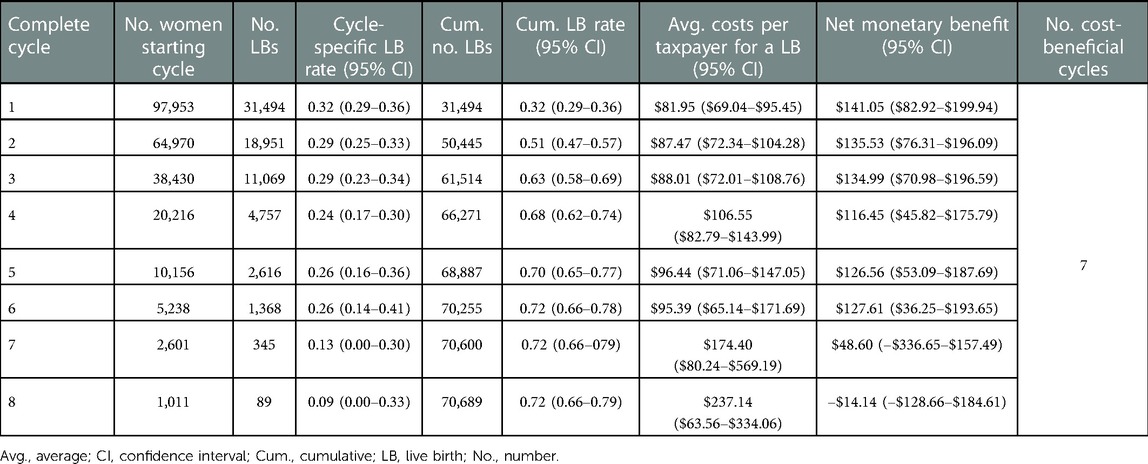
Table 3. Summary statistics for the base-case analysis of the cost-benefit analysis in 38–39-year-old women in the scenario where only women reaching oocyte pick-up and their costs were considered.
Looking at all age groups, as expected, less treatment cycles provided good value for money in older age groups given that cycle-specific live-birth rates were lower. While in women aged <42 years seven or more complete treatment cycles provided good value for money, no cycles provided good value in women aged ≥42 years. Cycles that were identified as cost-beneficial had a NMB ranging from $27 (sixth complete cycle in 40–41-year-olds; 95% CI: –$312.84-$131.60) to $188 per taxpayer (seventh complete cycle in <30-year-olds; 95% CI: $123.78-$244.57). In contrast, for women ≥42 years, treatment costs per taxpayer and live birth were as high as $2,481 whereas each taxpayer only derived an average benefit of $223 per live birth, leading to a net monetary loss of up to $2,258.
3.2. Sensitivity analyses
One-way sensitivity analyses show that, generally, variability in the number of fertility treatment cycles conducted annually had the biggest impact on the NMB. This is because the average number of taxpayers funding one fertility treatment cycle, when holding the number of taxpayers constant, changed dramatically (143–1,429 taxpayers/cycle) over the range of values explored. Therefore, compared to the base case, the NMB increased (decreased) with fewer (more) fertility treatment cycles conducted annually, and the impact tended to increase over successive cycles and with increasing age (i.e., as costs per live birth increase).
Figure 4 shows the threshold values of the number of complete fertility treatment cycles conducted annually in Australia beyond which treatment cycles did not provide good value for money stratified by age group. It reflects the maximum number of cycles conducted annually where IVF cycles were cost-beneficial. In contrast, any number of cycles beyond the threshold value would raise the costs per taxpayer and live birth above the taxpayer VSB, leading to a negative NMB. If <100,000 cycles were conducted annually in Australia, three or more complete treatment cycles provided good value for money in women aged <40 years. For treatment cycles in women ≥42 years to become cost-beneficial, the annual number of complete cycles conducted in Australia had to be <41,073.
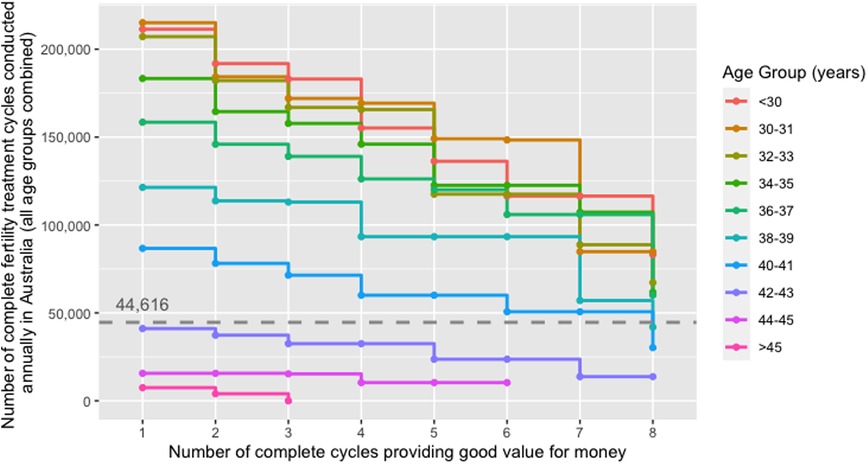
Figure 4. Threshold number of complete fertility treatment cycles conducted annually in Australia beyond which treatment cycles did not provide good value for money from a taxpayer perspective stratified by age group; scenario where only those women who reached the oocyte pick-up procedure were considered. The dashed line indicates the number of complete fertility treatment cycles conducted in the baseline year (i.e., 44,616 complete fertility treatment cycles in 2018). The threshold values for the number of complete fertility treatment cycles conducted annually represent the maximum number of cycles that can be conducted annually in order for the cycle in the respective age group to be cost-beneficial when holding all other parameters constant (e.g., IVF treatment costs, live-birth rates).
Two-way sensitivity analyses indicate that up to six complete cycles were cost-beneficial in younger age groups (<38 years) if more than twice as many fertility treatment cycles were conducted than in the base year 2018 and if, simultaneously, the number of taxpayers was at the lower threshold of 10 million.
The PSA suggested a < 50% chance that treatment cycles in women aged ≥42 years provided good value for money at the base-case VSB of $223. In contrast, > 50% and >75% of iterations for women <42 years had a positive NMB for seven or more and five or more complete cycles, respectively, indicating that fertility treatment in these age groups was likely cost-beneficial. Figure 5 provides an example net-benefit acceptability curve for 38–39-year-old women which clearly shows the high probability of six complete IVF cycles being cost-beneficial in this age group at a VSB of $223 per taxpayer.
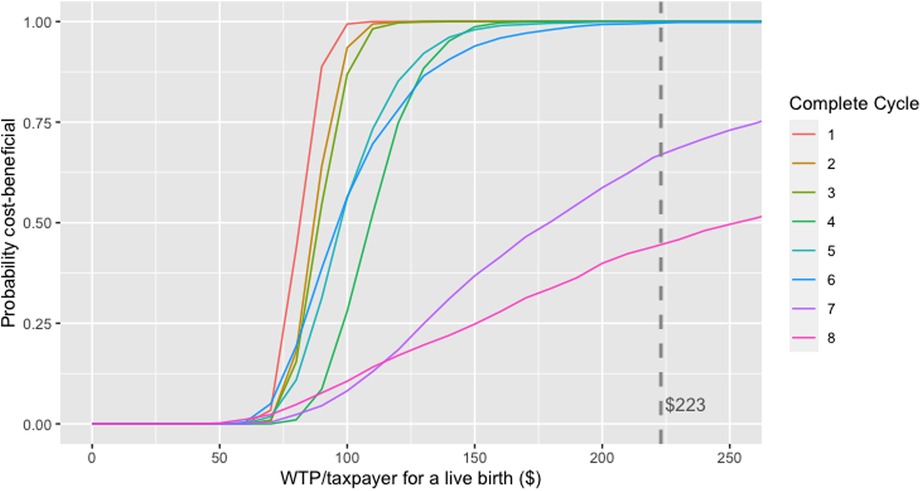
Figure 5. Net-benefit acceptability curve generated from the probabilistic sensitivity analysis in 38–39-year-old women in the scenario where only women reaching oocyte pick-up and their costs were considered.
3.3. Incremental analyses
Cost-benefit planes (Figure 6) show a preference for the policy intervention package over the current package of fertility treatment as incremental benefits (approximately $5-$15 per taxpayer) significantly outweighed incremental costs (approximately $0.25-$1.50 per taxpayer) in most model iterations (Supplementary Appendix C explains why the current package was preferred in a small number of model iterations). Generally, for age groups in which most/all cycles were found to be cost-beneficial, there was a positive incremental benefit that came at an additional cost. However, the incremental benefits mostly outweighed additional costs as evidenced by the mass of points below the red line indicating equal incremental costs and benefits. In contrast, in age groups where most/all cycles were found not to be cost-beneficial and, hence, were not funded in the policy intervention package, there were cost savings (negative incremental costs) but taxpayers also missed out on the benefits associated with births in these cycles (negative incremental benefits). Again, most points were located below the red line, meaning cost savings outweighed forgone benefits.
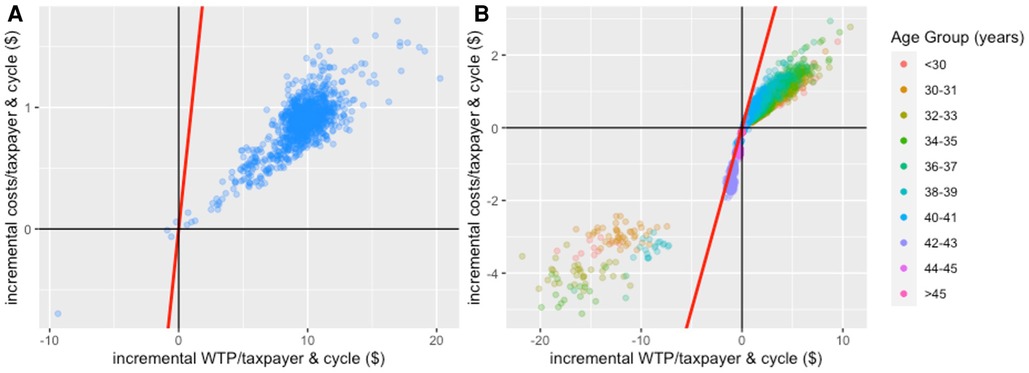
Figure 6. Cost-benefit planes for IVF treatment comparing the intervention package of fertility treatment (i.e., only funding cost-beneficial treatment cycles) to the current package of fertility treatment (comparator) based on the analysis that only considers costs and benefits of women reaching OPU. Panel (A): cost-benefit plane for the aggregated analysis; Panel (B): cost-benefit plane for the age-stratified analysis. The red line indicates points of indifference (i.e., where incremental costs equal incremental benefits). In Panel (B), 1.51% of observations are to the left of the red line in the lower left quadrant: 1.0% of observations in <30-year-old women; 4.4% in 30–31-year-old women; 3.2% in 32–33-year-old women; 1.5% in 34–35-year-old women; 0.3% in 36–37-year-old women; 1.9% in 38–39-year-old women; 0.6% in 40–41-year-old women; 2.2% in 42–43-year-old women; 0% in 44–45-year-old women; 0% in >45-year-old women. These points indicate observations where the current package of fertility treatment would be preferred over the policy intervention package. It is due to a limitation of our approach and Supplementary Appendix C provides a more detailed explanation.
4. Discussion
We conducted one of the first CBAs that used DCE results in an economic evaluation using the exemplar of publicly funded IVF treatment in Australia. We found a > 75% likelihood that five or more complete IVF treatment cycles provide good value for money in women aged <42 years. Due to significantly lower live-birth rates in older women (≥42 years) the provision of IVF treatment is unlikely cost-beneficial with average costs per taxpayer and live birth exceeding the base-case VSB of $223 in >50% of model iterations in the PSA. Our incremental analysis, using the status quo of unrestricted partial funding for IVF treatment in Australia as the comparator, suggests that only funding cost-beneficial treatment cycles is preferred from an economic perspective. However, healthcare funding decisions should be based on a broader set of criteria than simply economic arguments with decision-makers also considering and weighting effectiveness, safety, and equity concerns (92, 93). Our evidence provides important information on benefits relative to costs of fertility treatment for women of different age by reporting the number of cost-beneficial treatment cycles from a taxpayer (i.e., general population) perspective. Therefore, our results can help inform the debate about public and third-party funding arrangements for IVF.
Given the dominance of a CEA framework in HTA, we presented results in a similar way to common CEA outputs. This will facilitate understanding and likely increases acceptance of our findings in the field with the aim of the evidence being considered in policy and funding decisions. This is important because a CEA framework and traditional outcome metrics such as QALYs are inadequate to assess fertility treatment. While CEAs can inform the comparative cost-effectiveness of different types of fertility treatment or treatment regimens (25, 94), they are ill-suited to provide evidence on the value for money of such treatments. We addressed this gap in the literature by performing the first detailed CBA of IVF treatment, which provides important evidence on the number of cycles stratified by age that provide good value from a taxpayer perspective. While fertility treatment was the focus of our study, the methods developed are applicable to other areas of healthcare, and especially for analyses from a taxpayer perspective. A recent government report informing National Health Service (NHS) funding in the United Kingdom (48) demonstrated the feasibility of applying the methods developed theoretically by McIntosh (46), including creating cost-benefit planes and net-benefit acceptability curves. We extended this framework in three important ways: First, our approach shows how WTP values in terms of taxpayer contributions, derived from a DCE, can be incorporated into a CBA to provide evidence on the value for money of government spending from a taxpayer perspective. Second, we explored a complex mix of treatment cycles across age groups with different cost and benefit estimates per taxpayer and developed an approach to combine these into a single measure to use in incremental analyses. Third, we developed an interactive online app to visualize our results on an easy-to-use dashboard. This allows someone without programming skills to explore the results and enhances transparency by providing a comprehensive set of figures as well as detailed labels for data points.
The traditional cost-effectiveness analysis using QALYs and a WTP threshold of $50,000 (95, 96) indicates that the number of cycles representing good value decreases continuously with age, from 7 cycles in women aged <30 years to 1 cycle in women aged 38–39 years and no cycles providing good value in women aged ≥40 years. While it is not possible to directly compare the results with the CBA due to methodological differences, this comparison supports the argument that QALYs provide a narrower measure of benefits compared to the CBA/VSB. Furthermore, the cost-effectiveness results are not generally in line with current funding arrangements of IVF in most countries which provide funding for multiple cycles until at least 40 years of age.
4.1. Limitations
The use of a taxpayer perspective required that we consider current utilization (i.e., number of fertility treatment cycles performed within baseline year) and number of taxpayers in Australia within our analyses. This limits the generalizability of our results to other countries and contexts who would need to use their own treatment utilization rates and number of taxpayers to assess value for money. However, we explored the impact of both factors extensively in sensitivity analyses: While the NMB and number of cost-beneficial cycles changes significantly depending on the number of taxpayers and cycles performed annually in some age groups, our main conclusions are relatively stable at the extremes of number of cycles and taxpayers.
A second limitation is that fertility treatment can incur additional costs not considered in our analyses such as costs associated with side effects (e.g., ovarian hyperstimulation syndrome) or unsuccessful treatment (e.g., miscarriage, stillbirth). Incorporating these additional costs is expected to reduce the NMB of treatment cycles but is unlikely to significantly change our main conclusions. This is because our NMB estimates for cost-beneficial cycles are >$25 per taxpayer and approximately 80% of clinical pregnancies result in a live birth while severe side effects such as ovarian hyperstimulation syndrome are now extremely rare (58).
Lastly, we were not able to take into account any deadweight loss that inevitably results from taxation of individuals or businesses (97). Our analyses only account for the contributions of an average taxpayer to fund IVF treatment as well as the benefits associated with successful treatment.
5. Conclusion
This study uses DCE results in an economic evaluation framework for fertility treatment. The provision of fertility treatment is valued highly by taxpayers and at least five publicly funded treatment cycles seem to provide good value for money in most age groups. The CBA method provides a novel approach to incorporating WTP values in HTA and the results can help inform discussions about treatment funding arrangements.
Data availability statement
The data analyzed in this study is subject to the following licenses/restrictions: The datasets analyzed for this study are not publicly available due to ethical restrictions. Aggregated data is published via an accompanying online app. Requests to access these datasets should be directed to Elena Keller, e.keller@unsw.edu.au.
Ethics statement
The studies involving human participants were reviewed and approved by the University of New South Wales, Sydney (HC16983). The patients/participants provided their written informed consent to participate in this study.
Author contributions
EK and GMC contributed to the conception and design of the study. Data analysis and development of the online app were performed by EK. EK, WB and GMC contributed to the interpretation of the data. The first draft of the manuscript was written by EK, and all authors commented on the previous versions of the manuscript. All authors contributed to the article and approved the submitted version.
Funding
This work was supported by the Australian National Health and Medical Research Council under Grant APP1104543; and a scholarship from the University of New South Wales School of Women's and Children's Health. The funding agreement ensured the authors' independence in designing the study, interpreting the data, writing, and publishing the report.
Acknowledgments
The authors acknowledge Mark Hanly, University of New South Wales Sydney, for his help in publishing the interactive online app that visualizes the results of this cost-benefit analysis.
Conflict of interest
GMC declares being an International Committee for Monitoring Assisted Reproductive Technologies (ICMART) Regional Representative. The Fertility Society of Australia and New Zealand provides funding for the University of New South Wales (UNSW), Sydney, to manage the Australia and New Zealand Assisted Reproduction Database (ANZARD). GMC is the Data Custodian of ANZARD and an employee of UNSW. EK and WB declare that the research was conducted in the absence of any commercial or financial relationships that could be construed as a potential conflict of interest.
Publisher's note
All claims expressed in this article are solely those of the authors and do not necessarily represent those of their affiliated organizations, or those of the publisher, the editors and the reviewers. Any product that may be evaluated in this article, or claim that may be made by its manufacturer, is not guaranteed or endorsed by the publisher.
Supplementary material
The Supplementary Material for this article can be found online at: https://www.frontiersin.org/articles/10.3389/fgwh.2023.971553/full#supplementary-material.
References
1. National Center for Health Statistics. National survey of family growth: Key statistics from the national survey of family growth - I listing. Atlanta, GA: Centers for Disease Control and Prevention (CDC) (2019). Available at: https://www.cdc.gov/nchs/nsfg/key_statistics/i_2015-2017.htm#infertility (updated November 8, 2019–July 6, 2021).
2. Inhorn MC, Patrizio P. Infertility around the globe: new thinking on gender, reproductive technologies and global movements in the 21st century. Hum Reprod Update. (2015) 21(4):411–26. doi: 10.1093/humupd/dmv016
3. Sumant O, Joshi K. Fertility services market by procedure (IVF with ICSI, IUI, IVF without ICSI, surrogacy, and others) and service (fresh non-donor, frozen non-donor, egg & embryo banking, fresh donor, and frozen donor): global opportunity analysis and industry forecast, 2019–2026. Portland, Oregon: Allied Market Research (2019). LI_184557.
4. Homan GF, Davies M, Norman R. The impact of lifestyle factors on reproductive performance in the general population and those undergoing infertility treatment: a review. Hum Reprod Update. (2007) 13(3):209–23. doi: 10.1093/humupd/dml056
5. Tough S, Tofflemire K, Benzies K, Fraser-Lee N, Newburn-Cook C. Factors influencing childbearing decisions and knowledge of perinatal risks among Canadian men and women. Matern Child Health J. (2007) 11(2):189–98. doi: 10.1007/s10995-006-0156-1
6. Levine H, Jørgensen N, Martino-Andrade A, Mendiola J, Weksler-Derri D, Mindlis I, et al. Temporal trends in sperm count: a systematic review and meta-regression analysis. Hum Reprod Update. (2017) 23(6):646–59. doi: 10.1093/humupd/dmx022
7. Luk BH-K, Loke AY. The impact of infertility on the psychological well-being, marital relationships, sexual relationships, and quality of life of couples: a systematic review. J Sex Marital Ther. (2015) 41(6):610–25. doi: 10.1080/0092623X.2014.958789
8. Banker M, Dyer S, Chambers GM, Ishihara O, Kupka M, de Mouzon J, et al. International Committee for Monitoring Assisted Reproductive Technologies (ICMART): world report on assisted reproductive technologies, 2013. Fertil Steril. (2021) 116(3):741–56. doi: 10.1016/j.fertnstert.2021.03.039
9. Chambers GM, Keller E, Choi S, Khalaf Y, Crawford S, Botha W, et al. Funding and public reporting strategies for reducing multiple pregnancy from fertility treatments. Fertil Steril. (2020) 114(4):715–21. doi: 10.1016/j.fertnstert.2020.08.1405
10. Berg Brigham K, Cadier B, Chevreul K. The diversity of regulation and public financing of IVF in Europe and its impact on utilization. Hum Reprod. (2013) 28(3):666–75. doi: 10.1093/humrep/des418
11. Fertility Europe, European Society of Human Reproduction and Embryology. A policy audit on fertility: analysis of 9 EU countries: March 2017. Brussels: Fertility Europe, European Society for Human Reproduction and Embryology (2017).
12. Bundesministerium für Gesundheit und Frauen. Wir möchten ein Baby: Information über Kostenübernahme für medizinisch unterstützte Fortpflanzung durch den IVF-Fonds. Vienna: Bundesministerium für Gesundheit und Frauen (2017).
13. International Federation of Fertility Societies. IFFS surveillance 2016. Global Reproductive Health. (2016) 1:e1. doi: 10.1097/GRH.0000000000000001
14. Australian Government Department of Health. Medicare Benefits Schedule Book: operating from 1 August 2019. Canberra: Commonwealth of Australia (2019).
15. Northern Region Fertility Service (NRFS). Detail on eligibility for publicly funded fertility services. Auckland: Northland District Health Board, Waitemata District Health Board, Auckland District Health Board, Counties Manukau Health (2018).
16. Auckland District Health Board National Women's Health. Our Services: Fertility: Public Funding Auckland: National Women's Health (2019). Available at: https://nationalwomenshealth.adhb.govt.nz/our-services/fertility/public-funding/ (December 6, 2019).
17. International Federation of Fertility Societies. IFFS Surveillance 2019: Global Trends in Reproductive Policy and Practice, 8th ed. (2019). Available at: https://www.Iffsreproduction.Org/Page/Surveillance (Accessed June 2020).
18. Hornstein MD. State of the ART: assisted reproductive technologies in the United States. Reprod Sci. (2016) 23(12):1630–3. doi: 10.1177/1933719116667227
19. National Institute for Health and Care Excellence (NICE). Fertility problems: assessment and treatment: clinical guideline. London: NICE (2021).
20. Assisted Reproductive Technologies Review Committee. Report of the independent review of assisted reproductive technologies. Canberra: Australian Government Department of Health and Aged Care (2006).
21. Devlin N, Parkin D. Funding fertility: issues in the allocation and distribution of resources to assisted reproduction technologies. Hum Fertil. (2003) 6:S2–6. doi: 10.1080/1464770312331369153
22. Chambers GM, Ho MT, Sullivan EA. Assisted reproductive technology treatment costs of a live birth: an age-stratified cost-outcome study of treatment in Australia. Med J Aust. (2006) 184(4):155–8. doi: 10.5694/j.1326-5377.2006.tb00174.x
23. Tjon-Kon-Fat RI, Bensdorp AJ, Bossuyt PMM, Koks C, Oosterhuis GJE, Hoek A, et al. Is IVF - served two different ways - more cost-effective than IUI with controlled ovarian hyperstimulation? Hum Reprod. (2015) 30(10):2331–9. doi: 10.1093/humrep/dev193
24. Moolenaar LM, Nahuis MJ, Hompes PG, van der Veen F, Mol BWJ. Cost-effectiveness of treatment strategies in women with PCOS who do not conceive after six cycles of clomiphene citrate. Reprod Biomed Online. (2014) 28(5):606–13. doi: 10.1016/j.rbmo.2014.01.014
25. Bordewijk EM, Weiss N, Hompes PG, van der Veen F, Mol BW, Van Wely M. Cost-effectiveness of gonadotrophins compared to clomiphene citrate in anovulatory women who had not conceived after six ovulatory cycles with clomiphene citrate. Fertil Steril. (2017) 108(3):e13–4. doi: 10.1016/j.fertnstert.2017.07.054
26. Chambers GM, Sullivan EA, Ishihara O, Chapman MG, Adamson GD. The economic impact of assisted reproductive technology: a review of selected developed countries. Fertil Steril. (2009) 91(6):2281–94. doi: 10.1016/j.fertnstert.2009.04.029
27. Murugappan G, Ohno MS, Lathi RB. Cost-effectiveness analysis of preimplantation genetic screening and in vitro fertilization versus expectant management in patients with unexplained recurrent pregnancy loss. Fertil Steril. (2015) 103(5):1215–20. doi: 10.1016/j.fertnstert.2015.02.012
28. Karvir HV, Elashoff M, Miller BT, Gutmann JN, Arredondo F, Copperman AB, et al. Rapid progression to IVF with single embryo transfer as the standard of care for infertility: results from a multi-center cost-effectiveness study. Fertil Steril. (2015) 103(2):e26. doi: 10.1016/j.fertnstert.2014.12.046
29. Botha W. Methodological challenges in economic evaluations of fertility treatments. Fertil Steril. (2018). Available at: https://www.fertstertdialog.com/posts/31494-botha-consider-this
30. Keller E, Chambers GM. Valuing infertility treatment: why QALYs are inadequate, and an alternative approach to cost-effectiveness thresholds. Front Med Technol. (2022) 4:1053719. doi: 10.3389/fmedt.2022.1053719
31. Devlin NJ, Shah KK, Feng Y, Mulhern B, van Hout B. Valuing health-related quality of life: an EQ-5D-5L value set for England. Health Econ. (2018) 27(1):7–22. doi: 10.1002/hec.3564
32. Glover L, McLellan A, Weaver SM. What does having a fertility problem mean to couples? J Reprod Infant Psychol. (2009) 27(4):401–18. doi: 10.1080/02646830903190896
33. Mohr S, Koch L. Transforming social contracts: the social and cultural history of IVF in Denmark. Reprod Biomed Soc Online. (2016) 2:88–96. doi: 10.1016/j.rbms.2016.09.001
34. Goldhaber-Fiebert JD, Brandeau ML. Evaluating cost-effectiveness of interventions that affect fertility and childbearing: how health effects are measured matters. Med Decis Making. (2015) 35(7):818–46. doi: 10.1177/0272989X15583845
35. ESHRE Capri Workshop Group, Baird DT, Barri PN, Bhattacharya S, Devroey P, Evers JLH, et al. Economic aspects of infertility care: a challenge for researchers and clinicians. Hum Reprod. (2015) 30(10):2243–8. doi: 10.1093/humrep/dev163
36. Keller E, Botha W, Chambers GM. What features of fertility treatment do patients value? Price elasticity and willingness-to-pay values from a discrete choice experiment. Appl Health Econ Health Policy. (2023) 21:91–107. doi: 10.1007/s40258-022-00764-7
37. Klitzman R. How much is a child worth? Providers’ and patients’ views and responses concerning ethical and policy challenges in paying for ART. PLoS One. (2017) 12(2):e0171939. doi: 10.1371/journal.pone.0171939
38. Redshaw M, Hockley C, Davidson LL. A qualitative study of the experience of treatment for infertility among women who successfully became pregnant. Hum Reprod. (2006) 22(1):295–304. doi: 10.1093/humrep/del344
39. Chambers GM, Paul RC, Harris K, Fitzgerald O, Boothroyd CV, Rombauts L, et al. Assisted reproductive technology in Australia and New Zealand: cumulative live birth rates as measures of success. Med J Aust. (2017) 207(3):114–8. doi: 10.5694/mja16.01435
40. O’Brien YM, Ryan M, Martyn F, Wingfield MB. A retrospective study of the effect of increasing age on success rates of assisted reproductive technology. International Journal of Gynecology & Obstetrics. (2017) 138(1):42–6. doi: 10.1002/ijgo.12156
41. van Loendersloot LL, van Wely M, Limpens J, Bossuyt PMM, Repping S, van der Veen F. Predictive factors in in vitro fertilization (IVF): a systematic review and meta-analysis. Hum Reprod Update. (2010) 16(6):577–89. doi: 10.1093/humupd/dmq015
42. Cabry R, Merviel P, Hazout A, Belloc S, Dalleac A, Copin H, et al. Management of infertility in women over 40. Maturitas. (2014) 78(1):17–21. doi: 10.1016/j.maturitas.2014.02.014
43. Zhang Z, Zhu L-L, Jiang H-S, Chen H, Chen Y, Dai Y-T. Predictors of pregnancy outcome for infertile couples attending IVF and ICSI programmes. Andrologia. (2016) 48(9):962–9. doi: 10.1111/and.12525
44. Darvishi A, Goudarzi R, Zadeh VH, Barouni M. Cost-benefit analysis of IUI and IVF based on willingness to pay approach; case study: Iran. PLoS One. (2020) 15(7):e0231584. doi: 10.1371/journal.pone.0231584
45. Spiegel U, Gonen LD, Templeman J. Economic implications of in vitro fertilization using willingness to pay. J Public Health (Bangkok). (2013) 21(6):535–57. doi: 10.1007/s10389-013-0582-7
46. McIntosh E. Using discrete choice experiments within a cost-benefit analysis framework: some considerations. PharmacoEconomics. (2006) 24(9):855–68. doi: 10.2165/00019053-200624090-00004
47. Van Der Pol M, Shiell A, Au F, Jonhston D, Tough S. Eliciting individual preferences for health care: a case study of perinatal care. Health Expect. (2010) 13(1):4–12. doi: 10.1111/j.1369-7625.2009.00551.x
48. Ramsay C, Clarkson J, Duncan A, Lamont T, Heasman P, Boyers D, et al. Improving the quality of dentistry (IQuaD): a cluster factorial randomised controlled trial comparing the effectiveness and cost-benefit of oral hygiene advice and/or periodontal instrumentation with routine care for the prevention and management of periodontal disease in dentate adults attending dental primary care. Health Technol Assess (Rockv). (2018) 22(38). doi: 10.3310/hta22380
49. Mott DJ. Incorporating quantitative patient preference data into healthcare decision making processes: is hta falling behind? Patient. (2018) 11(3):249–52. doi: 10.1007/s40271-018-0305-9
50. sLenny A, Flint I, Longworth L. Pns203 use of discrete choice experiments to inform HTA decision making. Value Health. (2019) 22:S795. doi: 10.1016/j.jval.2019.09.2103
51. Vass CM, Payne K. Using discrete choice experiments to inform the benefit-risk assessment of medicines: are we ready yet? PharmacoEconomics. (2017) 35(9):859–66. doi: 10.1007/s40273-017-0518-0
52. Soekhai V, de Bekker-Grob EW, Ellis AR, Vass CM. Discrete choice experiments in health economics: past, present and future. PharmacoEconomics. (2019) 37(2):201–26. doi: 10.1007/s40273-018-0734-2
53. Newman JE, Paul RC, Chambers GM. Assisted reproductive technology in Australia and New Zealand 2020. Sydney: National Perinatal Epidemiology and Statistics Unit, the University of New South Wales (2022).
54. [Dataset] Australian Bureau of Statistics. Census Tablebuilder: Census of Population and Housing, 2016: Selected Family Characteristics (2016). Available at: https://guest.censusdata.abs.gov.au/webapi/jsf/tableView/tableView.xhtml
55. Chambers GM, Hoang VP, Lee E, Hansen M, Sullivan EA, Bower C, et al. Hospital costs of multiple-birth and singleton-birth children during the first 5 years of life and the role of assisted reproductive technology. JAMA Pediatr. (2014) 168(11):1045–53. doi: 10.1001/jamapediatrics.2014.1357
56. Organisation for Economic Co-operation and Development (OECD). Purchasing Power Parities (PPP) (Indicator) Paris: OECD (2022). Available at: https://data.oecd.org/conversion/purchasing-power-parities-ppp.htm#indicator-chart (January 15, 2022).
57. Australian Taxation Office. Taxation Statistics 2017–2018: Snapshot Canberra: Commonwealth of Australia (2020). Available at: https://www.ato.gov.au/About-ATO/Research-and-statistics/In-detail/Taxation-statistics/Taxation-statistics—previous-editions/Taxation-statistics-2017-18/?anchor=alltaxreturns#alltaxreturns (updated July 17, 2020–March 29, 2021).
58. Newman JE, Paul RC, Chambers GM. Assisted reproductive technology in Australia and New Zealand 2018. Sydney: National Perinatal Epidemiology and Statistics Unit (2020).
59. Neumann PJ, Johannesson M. The willingness to pay for in vitro fertilization: a pilot study using contingent valuation. Med Care. (1994) 32(7):686–99. doi: 10.1097/00005650-199407000-00003
60. Botha W, Donnolley N, Shanahan M, Chambers GM. Assessment of the societal and individual preferences for fertility treatment in Australia: study protocol for stated preference discrete choice experiments. BMJ Open. (2018) 8:e020509. doi: 10.1136/bmjopen-2017-020509
61. Botha W, Donnolley N, Shanahan M, Norman RJ, Chambers GM. Societal preferences for fertility treatment in Australia: a stated preference discrete choice experiment. J Med Econ. (2019) 22(1):95–107. doi: 10.1080/13696998.2018.1549055
62. Law YJ, Zhang N, Kolibianakis EM, Costello MF, Keller E, Chambers GM, et al. Is there an optimal number of oocytes retrieved at which live birth rates or cumulative live birth rates per aspiration are maximized after ART? A systematic review. Reprod Biomed Online. (2021) 42(1):83–104. doi: 10.1016/j.rbmo.2020.10.008
63. Wang YA, Dean J, Sullivan EA. Assisted reproduction technology in Australia and New Zealand 2005. Sydney: Australian Institute of Health and Welfare (2007).
64. Wang YA, Dean J, Badgery-Parker T, Sullivan EA. Assisted reproduction technology in Australia and New Zealand 2006. Sydney: Australian Institute of Health and Welfare (2008).
65. Wang YA, Chambers GM, Dieng M, Sullivan EA. Assisted reproductive technology in Australia and New Zealand 2007. Canberra: Australian Institute of Health and Welfare (2009).
66. Wang YA, Chambers GM, Sullivan EA. Assisted reproductive technology in Australia and New Zealand 2008. Canberra: Australian Institute of Health and Welfare (2010).
67. Wang YA, Macaldowie A, Hayward I, Chambers GM, Sullivan EA. Assisted reproductive technology in Australia and New Zealand 2009. Canberra: Australian Institute of Health and Welfare (2011).
68. Macaldowie A, Wang YA, Chambers GM, Sullivan EA. Assisted reproductive technology in Australia and New Zealand 2010. Canberra: Australian Institute of Health and Welfare (2012).
69. Macaldowie A, Wang YA, Chambers GM, Sullivan EA. Assisted reproductive technology in Australia and New Zealand 2011. Sydney: National Perinatal Epidemiology and Statistics Unit, The University of New South Wales (2013).
70. Macaldowie A, Wang YA, Chughtai AA, Chambers GM. Assisted reproductive technology in Australia and New Zealand 2012. Sydney: National Perinatal Epidemiology and Statistics Unit, The University of New South Wales (2014).
71. Macaldowie A, Lee E, Chambers GM. Assisted reproductive technology in Australia and New Zealand 2013. Sydney: National Perinatal Epidemiology and Statistics Unit, The University of New South Wales (2015).
72. Harris K, Fitzgerald O, Paul RC, Macaldowie A, Lee E, Chambers GM. Assisted reproductive technology in Australia and New Zealand 2014. Sydney: National Perinatal Epidemiology and Statistics Unit, The University of New South Wales (2016).
73. Fitzgerald O, Harris K, Paul RC, Chambers GM. Assisted reproductive technology in Australia and New Zealand 2015. Sydney: National Perinatal Epidemiology and Statistics Unit, The University of New South Wales (2017).
74. Fitzgerald O, Paul RC, Harris K, Chambers GM. Assisted reproductive technology in Australia and New Zealand 2016. Sydney: National Perinatal Epidemiology and Statistics Unit, The University of New South Wales (2018).
75. Newman JE, Fitzgerald O, Paul RC, Chambers GM. Assisted reproductive technology in Australia and New Zealand 2017. Sydney: National Perinatal Epidemiology and Statistics Unit (2019).
76. Australian Taxation Office. Taxation statistics 2004-05: a summary of income tax returns for the 2004-05 income year and other reported tax information for the 2005-06 financial year. Canberra: Commonwealth of Australia (2007).
77. Australian Taxation Office. Taxation statistics 2005-06: a summary of tax returns for the 2005-06 income year and other reported tax information for the 2006-07 financial year. Canberra: Commonwealth of Australia (2008).
78. Australian Taxation Office. Taxation statistics 2006-07: a summary of tax returns for the 2006-07 income year and other reported tax information for the 2007-08 financial year. Canberra: Commonwealth of Australia (2009).
79. Australian Taxation Office. Taxation statistics 2007-08: a summary of tax returns for the 2007-08 income year and other reported tax information for the 2008-09 financial year. Canberra: Commonwealth of Australia (2010).
80. Australian Taxation Office. Taxation statistics 2008-09: a summary of tax returns for the 2008-09 income year and other reported tax information for the 2009-10 financial year. Canberra: Commonwealth of Australia (2011).
81. Australian Taxation Office. Taxation statistics 2009-10: a summary of tax returns for the 2009-10 income year and other reported tax information for the 2010-11 financial year. Canberra: Australian Taxation Office for the Commonwealth of Australia (2012).
82. Australian Taxation Office. Taxation statistics 2010-11: a summary of tax returns for the 2010-11 income year and other reported tax information for the 2011-12 financial year. Canberra: Australian Taxation Office for the Commonwealth of Australia (2013).
83. Australian Taxation Office. Taxation Statistics 2011-2012: Individuals Tables Canberra: Commonwealth of Australia (2020). Available at: https://www.ato.gov.au/About-ATO/Research-and-statistics/In-detail/Taxation-statistics/Taxation-statistics—previous-editions/Taxation-statistics-2011-12/?anchor=Individualstables#Individualstables (updated September 24, 2020–March 29, 2021).
84. Australian Taxation Office. Taxation Statistics 2012-2013: Individuals Tables Canberra: Commonwealth of Australia (2020). Available at: https://www.ato.gov.au/About-ATO/Research-and-statistics/In-detail/Taxation-statistics/Taxation-statistics—previous-editions/Taxation-statistics-2012-13/?anchor=Individualstables#Individualstables (updated September 24, 2020–March 29, 2021).
85. Australian Taxation Office. Taxation Statistics 2013-2014: Individuals Canberra: Commonwealth of Australia (2020). Available at: https://www.ato.gov.au/About-ATO/Research-and-statistics/In-detail/Taxation-statistics/Taxation-statistics—previous-editions/Taxation-statistics-2013-14/?anchor=Individuals#Individuals (updated September 24, 2020–March 29, 2021).
86. Australian Taxation Office. Taxation Statistics 2014-2015: Individuals Canberra: Commonwealth of Australia (2020). Available at: https://www.ato.gov.au/About-ATO/Research-and-statistics/In-detail/Taxation-statistics/Taxation-statistics—previous-editions/Taxation-statistics-2014-15/?anchor=Individuals#Individuals (updated September 24, 2020–March 29, 2021).
87. Australian Taxation Office. Taxation Statistics 2015-2016: Individuals Canberra: Commonwealth of Australia (2020). Available at: https://www.ato.gov.au/About-ATO/Research-and-statistics/In-detail/Taxation-statistics/Taxation-statistics—previous-editions/Taxation-statistics-2015-16/?anchor=info1#info1 (updated September 24, 2020–March 29, 2021).
88. Australian Taxation Office. Taxation Statistics 2016-2017: Snapshot Canberra: Commonwealth of Australia (2020). Available at: https://www.ato.gov.au/About-ATO/Research-and-statistics/In-detail/Taxation-statistics/Taxation-statistics—previous-editions/Taxation-statistics-2016-17/?anchor=alltaxreturns#alltaxreturns (updated September 24, 2020–March 29, 2021).
89. Briggs AH, Wonderling DE, Mooney CZ. Pulling cost-effectiveness analysis up by its bootstraps: a non-parametric approach to confidence interval estimation. Health Econ. (1997) 6(4):327–40. doi: 10.1002/(SICI)1099-1050(199707)6:4%3C327::AID-HEC282%3E3.0.CO;2-W
91. R Core Team. R: a language and environment for statistical computing. 4.0.3 ed. Vienna, Austria: R Foundation for Statistical Computing (2020).
92. Marsh K, Lanitis T, Neasham D, Orfanos P, Caro J. Assessing the value of healthcare interventions using multi-criteria decision analysis: a review of the literature. PharmacoEconomics. (2014) 32(4):345–65. doi: 10.1007/s40273-014-0135-0
93. Diaby V, Goeree R, Hoch J, Siebert U. Multi-criteria decision analysis for health technology assessment in Canada: insights from an expert panel discussion. Expert Rev Pharmacoecon Outcomes Res. (2015) 15(1):13–9. doi: 10.1586/14737167.2015.965155
94. Bordewijk EM, Weiss NS, Nahuis MJ, Bayram N, van Hooff MHA, Boks DES, et al. Gonadotrophins versus clomiphene citrate with or without IUI in women with normogonadotropic anovulation and clomiphene failure: a cost-effectiveness analysis. Hum Reprod. (2019) 34(2):276–84. doi: 10.1093/humrep/dey359
95. Wang S, Gum D, Merlin T. Comparing the ICERs in medicine reimbursement submissions to NICE and PBAC—does the presence of an explicit threshold affect the ICER proposed? Value Health. (2018) 21(8):938–43. doi: 10.1016/j.jval.2018.01.017
96. Lowe A, Dyson S. New therapies for advanced cancers: can our society afford them? Is it ethical to deny patients access to them? In: Actuaries institute 2013 actuaries summit, Sydney. Sydney: Institute of Actuaries of Australia (2013). p. 1–16.
Keywords: cost-benefit analysis (CBA), IVF treatment, value of a statistical baby (VSB), health technology assessment (HTA), Markov model, willingness-to-pay (WTP), discrete choice experiment (DCE)
Citation: Keller E, Botha W and Chambers GM (2023) Does in vitro fertilization (IVF) treatment provide good value for money? A cost-benefit analysis. Front. Glob. Womens Health 4:971553. doi: 10.3389/fgwh.2023.971553
Received: 17 June 2022; Accepted: 30 January 2023;
Published: 1 March 2023.
Edited by:
Anju Devianee Keetharuth, The University of Sheffield, United KingdomReviewed by:
Dwayne Boyers, University of Aberdeen, United KingdomAli Darvishi, Tehran University of Medical Sciences, Iran
© 2023 Keller, Botha and Chambers. This is an open-access article distributed under the terms of the Creative Commons Attribution License (CC BY). The use, distribution or reproduction in other forums is permitted, provided the original author(s) and the copyright owner(s) are credited and that the original publication in this journal is cited, in accordance with accepted academic practice. No use, distribution or reproduction is permitted which does not comply with these terms.
*Correspondence: Elena Keller e.keller@unsw.edu.au
Specialty Section: This article was submitted to Quality of Life, a section of the journal Frontiers in Global Women's Health