 Lijia Liu1†
 Yuxuan Huang
 Qian Wang
- 1School of Recreation and Community Sport, Capital University of Physical Education and Sports, Beijing, China
- 2Department of Neuroscience in the Behavioral Sciences, Duke University and Duke Kunshan University, Suzhou, Jiangsu, China
- 3Taizhou Hospital of Zhejiang Province, Wenzhou Medical University, Luqiao, China
- 4Department of Neurology, The First Hospital of Tsinghua University, Beijing, China
Injuries to the spinal cord nervous system often result in permanent loss of sensory, motor, and autonomic functions. Accurately identifying the cellular state of spinal cord nerves is extremely important and could facilitate the development of new therapeutic and rehabilitative strategies. Existing experimental techniques for identifying the development of spinal cord nerves are both labor-intensive and costly. In this study, we developed a machine learning predictor, ScnML, for predicting subpopulations of spinal cord nerve cells as well as identifying marker genes. The prediction performance of ScnML was evaluated on the training dataset with an accuracy of 94.33%. Based on XGBoost, ScnML on the test dataset achieved 94.08% 94.24%, 94.26%, and 94.24% accuracies with precision, recall, and F1-measure scores, respectively. Importantly, ScnML identified new significant genes through model interpretation and biological landscape analysis. ScnML can be a powerful tool for predicting the status of spinal cord neuronal cells, revealing potential specific biomarkers quickly and efficiently, and providing crucial insights for precision medicine and rehabilitation recovery.
Introduction
The spinal cord nerves are the primary regulators of a wide range of motor behaviors in animals, which cover a range of fine motor actions from basic fight or flight responses to complex social interactions (Liau et al., 2023a). When the spinal nerves are abnormal, the patient quickly enters a phase known as “spinal shock,” which can lead to permanent loss of motor, sensory, and autonomic functions (Li et al., 2022). Spinal cord injury (SCI) is a traumatic neurological disorder, especially lower thoracic and cervical spine lesions causing paraplegia and quadriplegia (Alizadeh et al., 2019). A detailed understanding of spinal cord nerves provides important implications for the future development of more precise clinical treatments or guided exercise training to promote functional recovery after SCI, as well as for the conduct of pathophysiologic research (Fu et al., 2016; Alizadeh et al., 2019).
With the development of single-cell sequencing technique (Xiong et al., 2020; Xiong et al., 2022), we can explore the cellular composition of spinal nerves at high resolution. For example, Liau et al. (2023b) used scRNA sequencing to resolve the heterogeneity of mouse spinal motor neurons and discovered a diverse code of neuropeptide to characterize putative motor pool identities. Based on single-cell RNA sequencing (scRNA-seq) technique, Wang T. et al. (2023) resolved the cellular heterogeneity of orthopedic diseases, including spinal cord injury (SCI), related to their development, as well as their functions and potential molecular mechanisms. Cao et al. (2022) utilized single-cell RNA sequencing (scRNA-seq) to comprehensively depict the cellular diversity of the spinal cord, deeply reveal the dynamic changes of cells and molecules in the microenvironment, and elucidate the intercellular communication between the normal and injured states of the spinal cord, which provides a powerful tool for the study of the molecular mechanisms of traumatic spinal cord injury. Delile et al. (2019) used single-cell mRNA sequencing to resolve developmental maps of the cervical and thoracic regions of the neural tube in mice on embryonic days 9.5–13.5, revealing mechanisms of neuronal specification and providing direct insights into spinal cord cell classification.
Despite the fact that previous research techniques are quite mature, there are time-consuming and laborious problems in mining marker genes and identifying cell subpopulations using manual methods. Therefore, there is an urgent need to develop a computational method to assist researchers in efficiently identifying cellular subpopulations and deeply exploring their potential marker genes.
To overcome these challenges, we introduced a computational framework, called ScnML, designed to identify biomarkers of cell subpopulations within the spinal cord neuronal and to predict cellular developmental stages. The framework is shown in Figure 1. In order to obtain the optimal predictive model, we used a strategy that combines feature selection and incremental feature selection (IFS) (Wang et al., 2021a) in four basic classification methods: K-Nearest Neighbors (KNN), extreme Gradient Boosting (XGBoost) (Chen and Guestrin, 2016), Support Vector Machine (SVM) (Cortes and Vapnik, 1995; Zhang et al., 2024), and Random Forest (RF) (Al-Allak et al., 2013). Given the importance of interpretability and robustness, we chose the XGBoost algorithm to build the computational model. We validated the model using a test set and achieved an accuracy of 94.04%. By performing biological analysis of the optimal genes, we identified potential marker genes that may assist biologists in gaining a deeper insight into the diversity present within spinal cord neuronal.
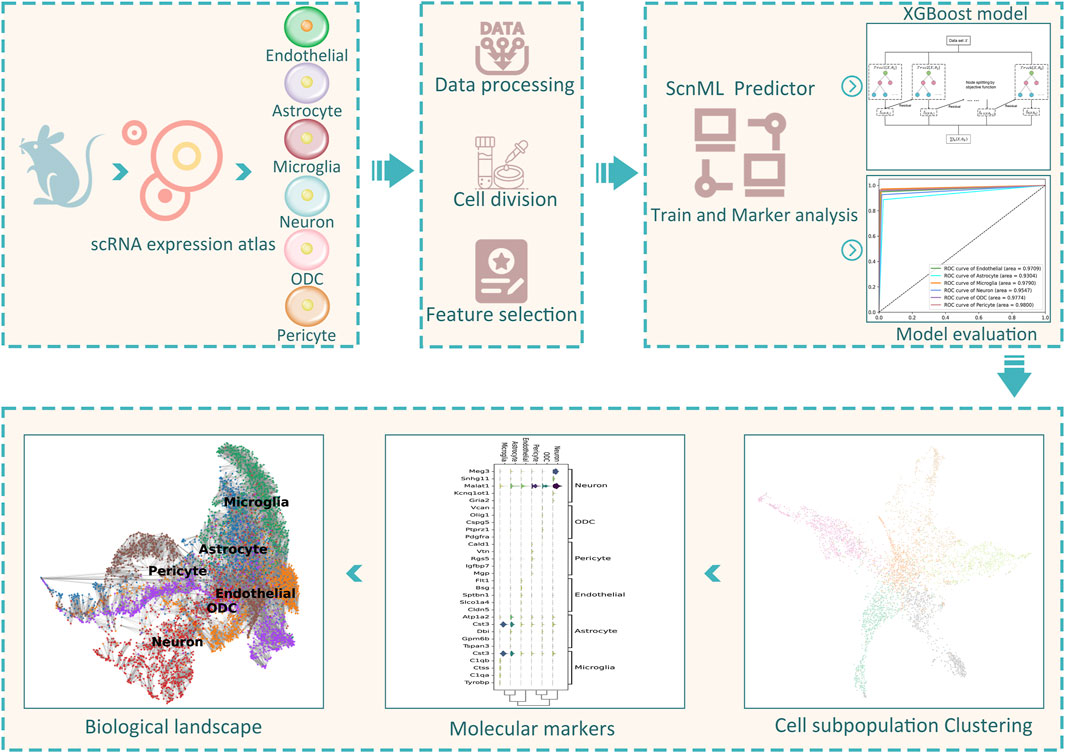
Figure 1. The workflow of constructing ScnML.
Identification of significant genes by ScnML
To identify significant genes associated with spinal cord neuronal cell subpopulations, we used three feature selection methods (Mutual Information Coefficient: MIC, Coefficient of Variation Squared: CV2, and Principal Component Analysis: PCA) to assess the significance of 27,998 genes and ranked them according to their contribution values. Genes with importance scores less than or equal to zero were excluded. Next, the machine learning models were combined with IFS to determine the optimal subset of genes (Figures 2A–C). Machine learning models (SVM, RFC, XGBoost, and KNN) were trained using single-cell gene expression matrices (Normalized of raw read count) as input features, based on five-fold cross-validation.
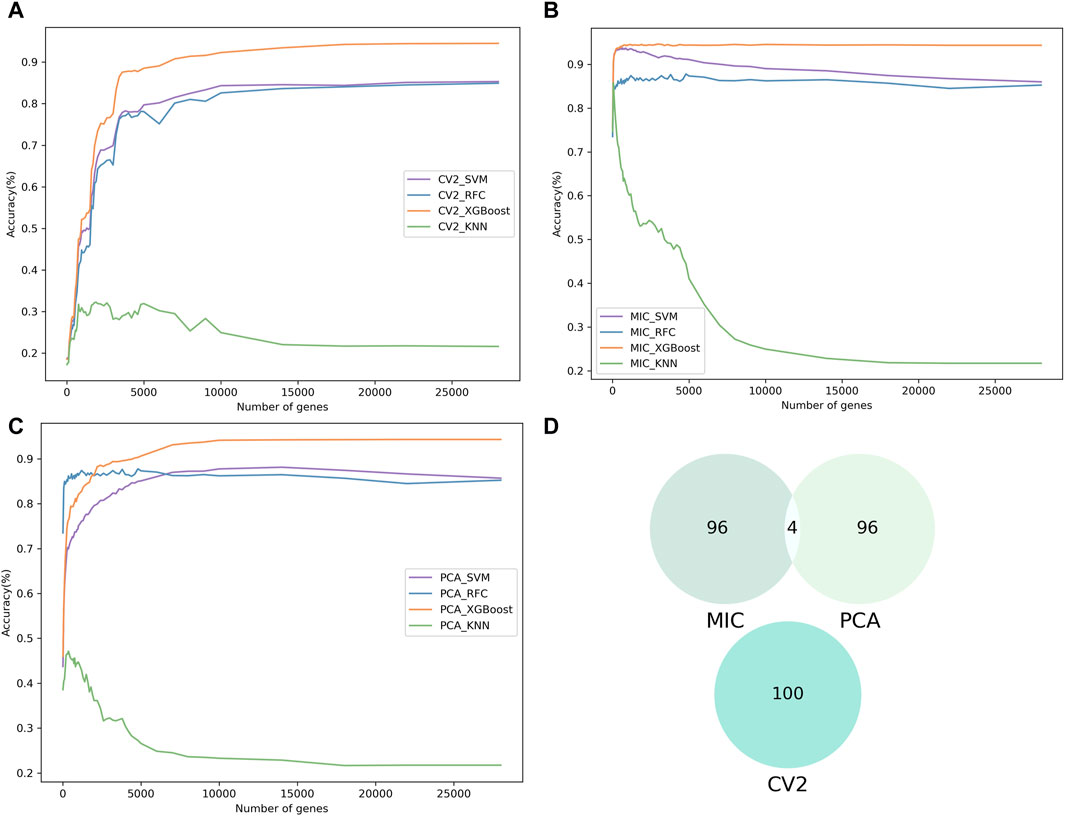
Figure 2. The results of feature selection. (A–C) Show the incremental feature selection (IFS) curves illustrating the prediction performance of the three feature selection methods (CV2, MIC and PCA) with four different classifiers for different gene subsets. (D) Comparative Venn diagram of the top 100 genes in MIC, CV2 and PCA.
The results from the training dataset showed that MIC combination with XGBoost (ScnML), achieved the optimal prediction performance by using the first 210 genes, with an accuracy of 94.33% (Table 1). Based on the 210 best genes, ScnML also achieved the best performance on the test dataset, with accuracy, precision, recall, and F1_metrics of 94.08%, 94.24%, 94.26%, and 94.24%, respectively (Table 2). It is notable that the four machine learning models, when combined with PCA, also yielded superior predictive performance. To avoid feature selection methods having the same scoring preferences, we compared the top 100 genes scored by the three feature selection methods. As observed from Figure 2D, there is almost no intersection among the top 100 genes selected by MIC, CV2, and PCA, demonstrating the effectiveness of each feature selection method.

Table 1. Performance evaluation of different feature selection combined with machine learning schemes (Train dataset).

Table 2. Performance evaluation of different feature selection combined with machine learning schemes (Test dataset).
Performance of ScnML on the test dataset
To further validate the robustness of the model, receiver operating characteristic (ROC) curves and confusion matrices were used to evaluate the prediction performance of ScnML. We observe that the AUC of the ScnML model is 0.96 (Figure 3A). The confusion matrix validates the predictive performance of the model for each type of spinal cord neural subpopulation, and the low misclassification rate demonstrates the robustness of the model (Figure 3B). In addition, Uniform Manifold Approximation and Projection (UMAP) of 6,000 single cells revealed that the overall performance of the 210 marker genes was significantly better than that of all genes (Figures 3C, D). In particular, the samples from different categories were almost blended together in the clustering process that exploited all genes (Figure 3C). However, employing the 210 optimal genes generates a distinct distribution of cell subpopulations, demonstrating clear clustering findings (Figure 3D). We also performed heat map clustering analysis on the ScnML gene set and obtained excellent clustering results, demonstrating the advantages of machine learning (Supplementary Figure S1).
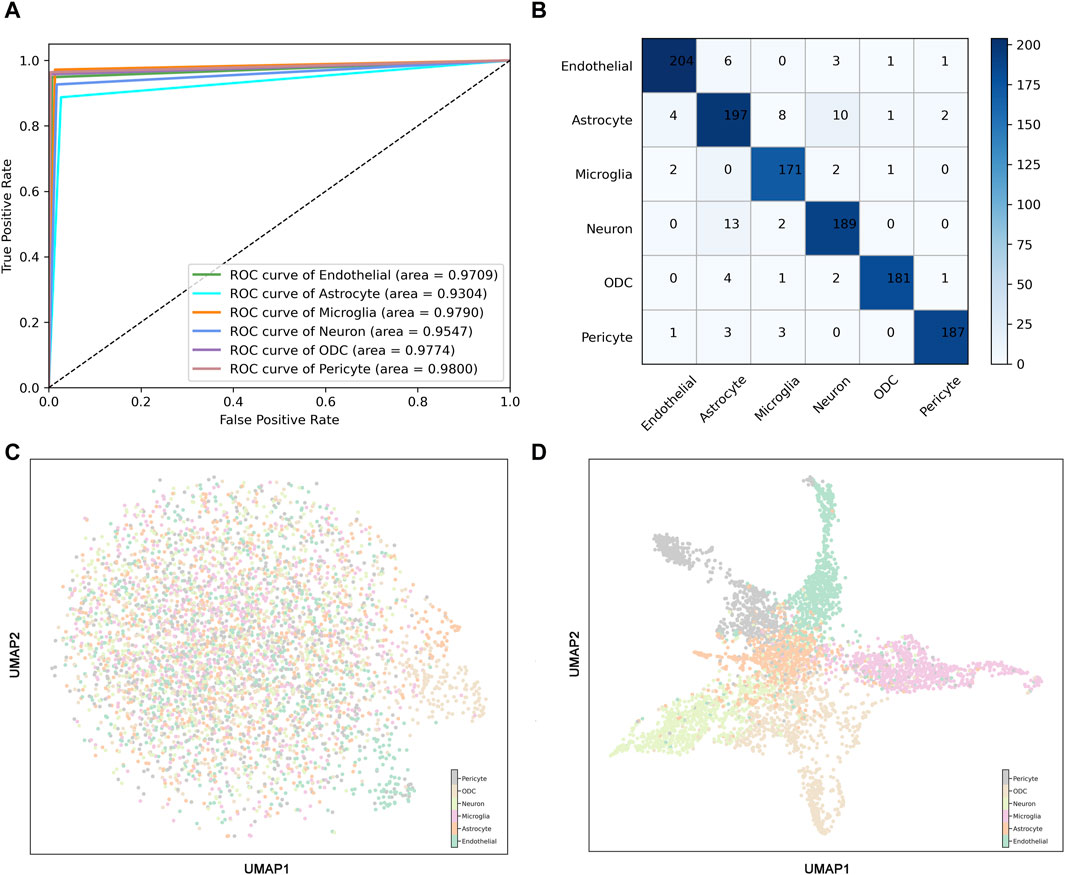
Figure 3. Predictive performance of ScnML. (A) The Receiver Operating Characteristic (ROC) curves for the ScnML model evaluated on the training dataset. (B) Confusion matrix for ScnML, used to assess the predictive performance of the model for each cell subpopulation classification. (C) UMAP shows clustering performance for six spinal cord nervous cell subpopulations at all gene set levels. (D) UMAP shows clustering performance for six spinal cord nervous cell subpopulations at ScnML gene set levels.
Gene function analysis
We performed functional enrichment analysis of the ScnML gene set to explore biological processes related to sci pathophysiology and potential recovery mechanisms. The analysis revealed significant enrichment in genes associated with axon ensheathment, myelination, and the ensheathment of neurons, highlighting the pivotal role of myelin repair and axonal regeneration post-injury (Franklin and Ffrench-Constant, 2008; Lee et al., 2012) (Supplementary Figure S2). Additionally, processes such as glial cell differentiation and gliogenesis were prominently featured, underscoring the importance of glial responses in scar formation and neural tissue remodeling (Sofroniew, 2009). Importantly, our findings also suggest that the regulation of cell-substrate adhesion and leukocyte migration, including myeloid cells, as key components in the inflammatory response and subsequent healing processes (Supplementary Figures S3, S4). The modulation of cell adhesion dynamics is particularly critical, as it influences axonal growth and neural cell interaction with the extracellular matrix, which are essential for effective nerve repair (Zhu et al., 2015).
Expression analysis of the ScnML gene set
In addition, we explored the representation of the 210 marker genes in the biological landscape. We identified potential marker genes such as Atp1a2, which is highly expressed in astrocytes; C1qa and Ly86, which are specifically expressed in microglia; and Vtn, which characterizes a subpopulation of endothelial cells (Figure 4A). These genes have been verifiably reported. Furthermore, the use of multiple genes to characterize cellular subpopulations improves accuracy. For instance, Meg3, Snhg11, and Malat1 ensure the identification of neuron subpopulations; Atp1a2, Cst3, and Dbi are highly expressed in astrocytes; and Cst3, C1qb, and Ctss exhibit high expression levels in microglia (Figure 4B).
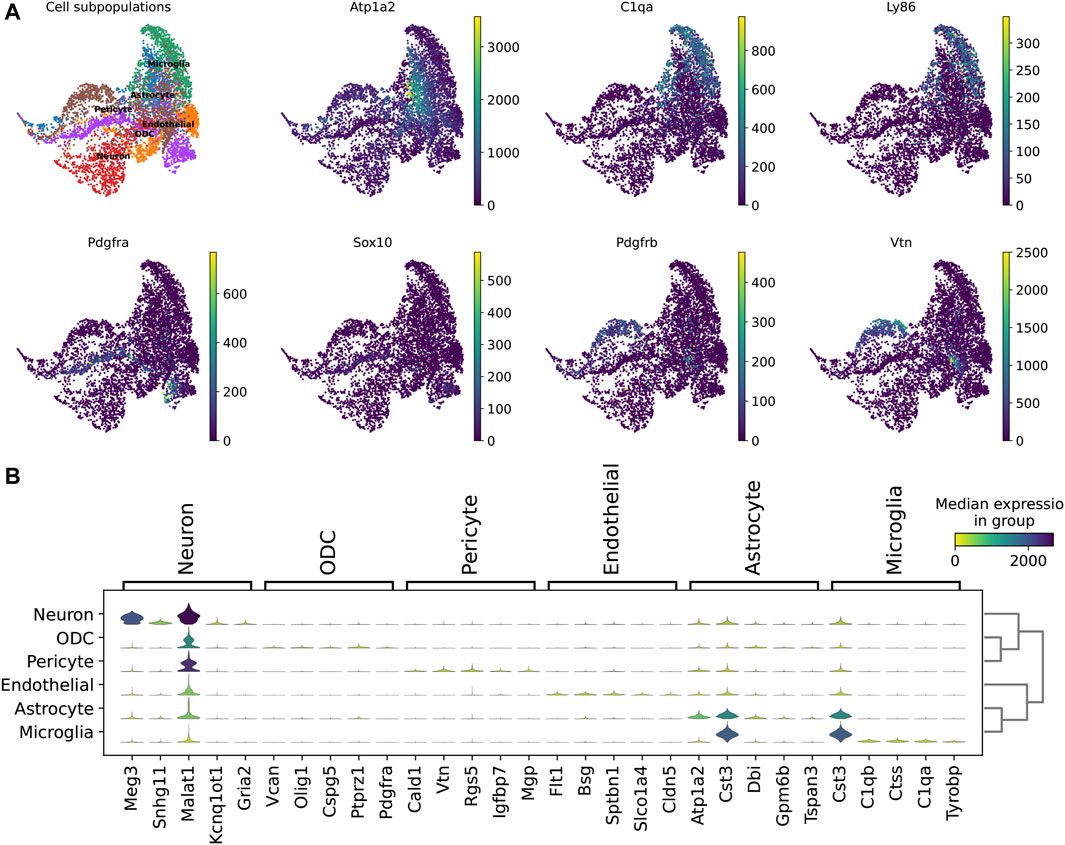
Figure 4. Computational analysis of ScnML gene set. (A) UMAP shows reported marker genes for spinal cord neuronal cell subpopulations. (B) Violin plot shows potential marker genes for subpopulations of spinal cord nerve cells.
We analyzed single-cell expression profiles containing all genes and separately, the 210 genes, as the basis for constructing a partition-based graph abstraction (PAGA) to describe the spinal cord neuronal cell bioscape. Both displayed the same topological structure, such as a tight association between microglia and astrocytes, indicating that ScnML screened for key molecular markers and removed redundant information (Figures 5A, B). We utilized Scanpy to compare the expression levels of the top 20 genes in each cell subpopulation with their expression levels in the other five clusters. For example, the expression levels of Cst3, Dbi, and Malat1 in the astrocyte subpopulation were each higher than the combined totals from the remaining five cellular subpopulations. In the neuron cell subpopulation, Meg3, Snhg11, and Malat1 showed high levels of expression, suggesting their potential as marker genes (Figure 5C and Supplementary Table S1). These results indicate that ScnML possesses irreplaceable advantages in processing scRNA-seq data without relying on prior biological knowledge.
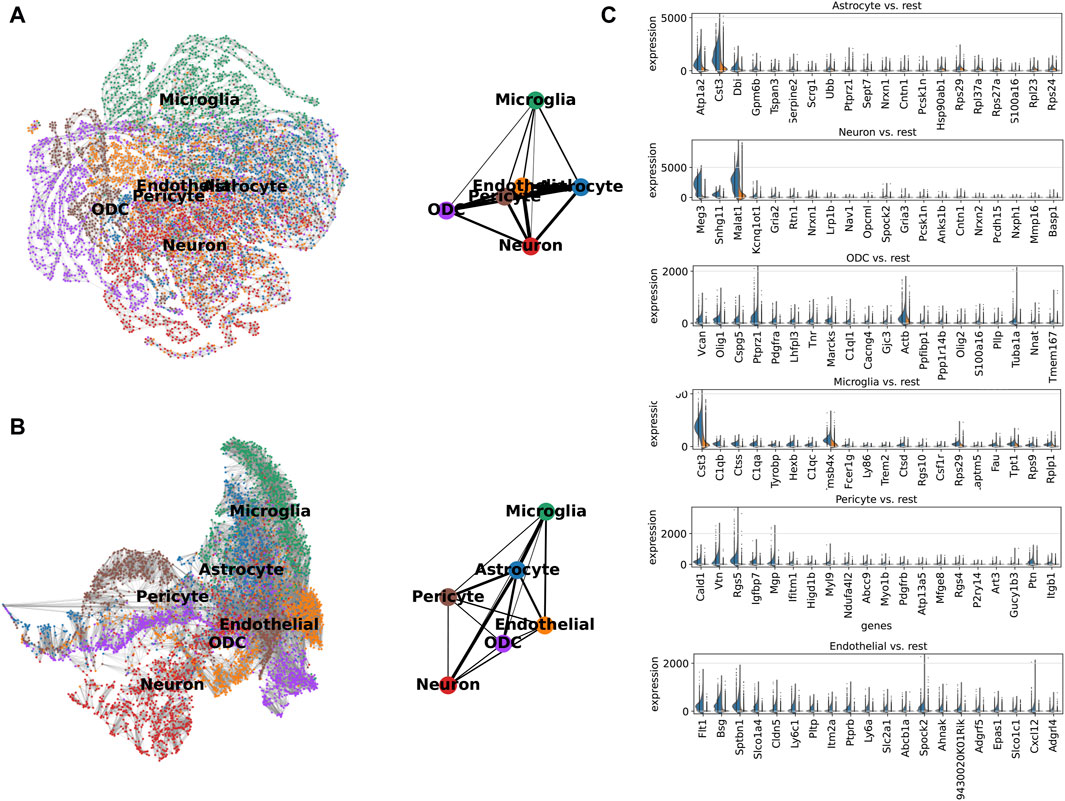
Figure 5. (A, B) Expression trajectory analysis of 210 marker genes (downward) and all genes (upward) of spinal cord nerve cell subpopulations colored by cell type using PAGA. The thicker the line, the closer the cell connection. (C) Comparison of marker genes selected by ScnML (210 marker genes) using split violin plots. The expression level of marker genes in specific cells is shown on the left (Blue), and the total expression level in the remaining five cell types is shown on the right (Orange).
Conclusion
Single-cell sequencing technology has been extensively used in both basic science research and the clinical setting, promoting the exploration of cellular differentiation and molecular heterogeneity. In this research, we designed and developed a machine learning-based predictive model, ScnML, for predicting spinal cord nerve cell subpopulations. ScnML addresses the computational inefficiencies and overfitting problems caused by high-dimensional feature spaces, thereby improving the model’s prediction accuracy and robustness. Results from an independent dataset show that ScnML outperformed other methods, achieving an accuracy of 94.08% and a ROC of 0.96. More significantly, through the analysis of the ScnML model, we have successfully identified a set of key genes that can be utilized as reliable biomarkers for spinal cord neuronal cell subpopulations. This discovery provides an important molecular tool for deeper comprehension of spinal cord nerve cells’ intricacies, with far-reaching impacts on future neurobiology research.
Methods
Dataset construction and preprocessing
The single-cell transcriptome dataset of crush-injured adult mouse spinal cord that support the findings of this study are available in figshare with the identifier (https://doi.org/10.6084/m9.figshare.17702045) (Li et al., 2022). Based on the same processing method used by Liu et al. the raw sequence data were aligned to the mm10 (Ensembl 84) reference genome and cell numbers and unique molecular identifiers (UMIs) were estimated using CellRanger (3.1.0). The 6,000 single-cell transcriptome samples were used to classify six spinal cord injury cell subpopulations, including Endothelial, Astrocyte, Microglia, Neuron, Oligodendrocyte (ODC), and Pericyte cells. These single-cell transcriptome samples were randomly divided into a 4800-sample training set and a 2200-sample testing set with a ratio of 7:3. To construct a stringent and robust benchmark dataset, we applied a filtration criterion, excluding genes with unique feature counts of zero or less. This process yielded a final set of 27,998 genes, each expressed in at least one of the 6,000 cells surveyed.
Mutual information coefficient
The Mutual Information Coefficient (MIC) is predicated on the idea that the presence of a relationship between two variables allows for the construction of a grid that effectively partitions their scatter plot, encapsulating the essence of their interaction. To enable equitable comparisons across grids of different sizes, the mutual information values derived from these partitions are normalized. This normalization ensures a consistent framework for evaluating the strength and complexity of relationships between variables, irrespective of their scale or the intricacy of their association (Zhou et al., 2004; Reshef et al., 2011; Albanese et al., 2012).
Where
Biological analysis
We performed an extensive analysis to assess the represent capability of 210 marker genes in identifying cell subpopulations. The clustering analyses were performed using the Scanpy software (version 1.9.1), and default parameters were used for all analyses (Wolf et al., 2018). Partition-based graph abstraction (PAGA) was also implemented via Scanpy, while uniform manifold approximation and projection (UMAP) visualizations were generated using the umap-learn Python package (version 0.3.9), with parameters set to default values. Furthermore, functional enrichment analysis was executed employing the enrichGO function from the clusterProfiler package (version 4.6.2).
eXtreme Gradient Boosting
eXtreme Gradient Boosting (XGBoost) is a highly sophisticated and efficient machine learning algorithm that has gained widespread recognition for its performance in various predictive modeling competitions (Chen and Guestrin, 2016; Wang et al., 2023b). XGBoost has gained prominence for its efficiency and effectiveness in various predictive modeling competitions. It operates by constructing a series of decision trees in a sequential manner, where each subsequent tree aims to correct the errors of its predecessors. This approach enables the model to learn complex patterns in the data, enhancing its predictive accuracy. One of the key strengths of XGBoost is its ability to handle large datasets with speed and precision, making it an ideal choice for our study. In addition, compared to models such as KNN and SVM, XGBoost provides a direct way to evaluate the importance of each input variable.
Model evaluation
The four classic metrics were used to quantify the performance of model predictions, including Accuracy, Recall, Precision, and F1_measure, defined as (Fu et al., 2019; Wang et al., 2021b; Joshi et al., 2021; Liang et al., 2021; Wang et al., 2023c; Liu et al., 2023; Qian et al., 2023):
Where
Data availability statement
The original contributions presented in the study are included in the article/Supplementary Material, further inquiries can be directed to the corresponding authors.
Ethics statement
Ethical approval was not required for the study involving animals in accordance with the local legislation and institutional requirements because All data used in this study are from public databases.
Author contributions
LL: Writing–original draft. YH: Writing–original draft, Data curation, Formal Analysis. YZ: Formal Analysis, Writing–original draft, Validation. YL: Writing–original draft, Data curation. SM: Writing–original draft, Project administration. QW: Project administration, Writing–original draft.
Funding
The authors declare that no financial support was received for the research, authorship, and/or publication of this article.
Conflict of interest
The authors declare that the research was conducted in the absence of any commercial or financial relationships that could be construed as a potential conflict of interest.
Publisher’s note
All claims expressed in this article are solely those of the authors and do not necessarily represent those of their affiliated organizations, or those of the publisher, the editors and the reviewers. Any product that may be evaluated in this article, or claim that may be made by its manufacturer, is not guaranteed or endorsed by the publisher.
Supplementary material
The Supplementary Material for this article can be found online at: https://www.frontiersin.org/articles/10.3389/fgene.2024.1413484/full#supplementary-material
References
Al-Allak, A., Bertelli, G., and Lewis, P. (2013). Random forests: the new generation of machine learning algorithms to predict survival in breast cancer. Brit J. Surg. 100, 47. doi:10.1016/j.ijsu.2013.06.112
Albanese, D., Filosi, M., Visintainer, R., Riccadonna, S., Jurman, G., and Furlanello, C. (2012). Minerva and minepy: a C engine for the MINE suite and its R, Python and MATLAB wrappers. Bioinformatics 29 (3), 407–408. doi:10.1093/bioinformatics/bts707
Alizadeh, A., Dyck, S. M., and Karimi-Abdolrezaee, S. (2019). Traumatic spinal cord injury: an overview of pathophysiology, models and acute injury mechanisms. Front. Neurol. 10, 282. doi:10.3389/fneur.2019.00282
Cao, Y., Zhu, S., Yu, B., and Yao, C. (2022). Single-cell RNA sequencing for traumatic spinal cord injury. FASEB J. 36 (12), e22656. doi:10.1096/fj.202200943R
Chen, T. Q., and Guestrin, C. (2016). “XGBoost: a scalable tree boosting system,” in Kdd'16: proceedings of the 22nd acm sigkdd international conference on knowledge discovery and data mining, 785–794. doi:10.1145/2939672.2939785
Cortes, C., and Vapnik, V. (1995). Support-vector networks. Mach. Learn. 20 (3), 273–297. doi:10.1007/bf00994018
Delile, J., Rayon, T., Melchionda, M., Edwards, A., Briscoe, J., and Sagner, A. (2019). Single cell transcriptomics reveals spatial and temporal dynamics of gene expression in the developing mouse spinal cord. Development 146 (12), dev173807. doi:10.1242/dev.173807
Franklin, R. J., and Ffrench-Constant, C. (2008). Remyelination in the CNS: from biology to therapy. Nat. Rev. Neurosci. 9 (11), 839–855. doi:10.1038/nrn2480
Fu, J., Wang, H., Deng, L., and Li, J. (2016). Exercise training promotes functional recovery after spinal cord injury. Neural Plast. 2016, 4039580. doi:10.1155/2016/4039580
Fu, X., Zhu, W., Cai, L., Liao, B., Peng, L., Chen, Y., et al. (2019). Improved pre-miRNAs identification through mutual information of pre-miRNA sequences and structures. Front. Genet. 10, 119. doi:10.3389/fgene.2019.00119
Joshi, P., Masilamani, V., and Ramesh, R. (2021). An ensembled SVM based approach for predicting adverse drug reactions. Curr. Bioinforma. 16 (3), 422–432. doi:10.2174/1574893615999200707141420
Lee, Y., Morrison, B. M., Li, Y., Lengacher, S., Farah, M. H., Hoffman, P. N., et al. (2012). Oligodendroglia metabolically support axons and contribute to neurodegeneration. Nature 487 (7408), 443–448. doi:10.1038/nature11314
Li, C., Wu, Z., Zhou, L., Shao, J., Hu, X., Xu, W., et al. (2022). Temporal and spatial cellular and molecular pathological alterations with single-cell resolution in the adult spinal cord after injury. Signal Transduct. Target Ther. 7 (1), 65. doi:10.1038/s41392-022-00885-4
Liang, P. F., Zheng, L., Long, C. S., Yang, W. R. T., Yang, L., and Zuo, Y. C. (2021). HelPredictor models single-cell transcriptome to predict human embryo lineage allocation. Brief. Bioinform 22 (6), bbab196. doi:10.1093/bib/bbab196
Liau, E. S., Jin, S., Chen, Y. C., Liu, W. S., Calon, M., Nedelec, S., et al. (2023a). Single-cell transcriptomic analysis reveals diversity within mammalian spinal motor neurons. Nat. Commun. 14 (1), 46. doi:10.1038/s41467-022-35574-x
Liau, E. S., Jin, S. Q., Chen, Y. C., Liu, W. S., Calon, M., Nedelec, S., et al. (2023b). Single-cell transcriptomic analysis reveals diversity within mammalian spinal motor neurons. Nat. Commun. 14 (1), 46. doi:10.1038/s41467-022-35574-x
Liu, M. Z., Zhou, J., Xi, QLMG, Liang, Y. C., Li, H. C., Liang, P. F., et al. (2023). A computational framework of routine test data for the cost-effective chronic disease prediction. Brief. Bioinform 24 (2), bbad054. doi:10.1093/bib/bbad054
Qian, Y., Ding, Y., Zou, Q., and Guo, F. (2023). Multi-view kernel sparse representation for identification of membrane protein types. Ieee-Acm Trans. Comput. Biol. Bioinforma. 20 (2), 1234–1245. doi:10.1109/TCBB.2022.3191325
Reshef, D. N., Reshef, Y. A., Finucane, H. K., Grossman, S. R., Mcvean, G., Turnbaugh, P. J., et al. (2011). Detecting novel associations in large data sets. Science 334, 1518–1524. doi:10.1126/science.1205438
Sofroniew, M. V. (2009). Molecular dissection of reactive astrogliosis and glial scar formation. Trends Neurosci. 32 (12), 638–647. doi:10.1016/j.tins.2009.08.002
Wang, H., Liang, P., Zheng, L., Long, C., Li, H., and Zuo, Y. (2021a). eHSCPr discriminating the cell identity involved in endothelial to hematopoietic transition. Bioinformatics 37 (15), 2157–2164. doi:10.1093/bioinformatics/btab071
Wang, H., Lin, Y. N., Yan, S., Hong, J. P., Tan, J. R., Chen, Y. Q., et al. (2023c). NRTPredictor: identifying rice root cell state in single-cell RNA-seq via ensemble learning. Plant Methods 19 (1), 119. doi:10.1186/s13007-023-01092-0
Wang, H., Xi, Q., Liang, P., Zheng, L., Hong, Y., and Zuo, Y. (2021b). IHEC_RAAC: a online platform for identifying human enzyme classes via reduced amino acid cluster strategy. Amino Acids 53 (2), 239–251. doi:10.1007/s00726-021-02941-9
Wang, H., Zhang, Z. Y., Li, H. C., Li, J. Z., Li, H. S., Liu, M. Z., et al. (2023b). A cost-effective machine learning-based method for preeclampsia risk assessment and driver genes discovery. Cell Biosci. 13 (1), 41. doi:10.1186/s13578-023-00991-y
Wang, T., Wang, L., Zhang, L., Long, Y., Zhang, Y., and Hou, Z. (2023a). Single-cell RNA sequencing in orthopedic research. Bone Res. 11 (1), 10. doi:10.1038/s41413-023-00245-0
Wolf, F. A., Angerer, P., and Theis, F. J. (2018). SCANPY: large-scale single-cell gene expression data analysis. Genome Biol. 19 (1), 15. doi:10.1186/s13059-017-1382-0
Xiong, Z., Li, M., Yang, F., Ma, Y., Sang, J., Li, R., et al. (2020). EWAS Data Hub: a resource of DNA methylation array data and metadata. Nucleic Acids Res. 48 (D1), D890–D895. doi:10.1093/nar/gkz840
Xiong, Z., Yang, F., Li, M., Ma, Y., Zhao, W., Wang, G., et al. (2022). EWAS Open Platform: integrated data, knowledge and toolkit for epigenome-wide association study. Nucleic Acids Res. 50 (D1), D1004–D1009. doi:10.1093/nar/gkab972
Zeng, X., Zhang, X., and Zou, Q. (2016). Integrative approaches for predicting microRNA function and prioritizing disease-related microRNA using biological interaction networks. Brief. Bioinform 17 (2), 193–203. doi:10.1093/bib/bbv033
Zhang, X., Noah, J. A., Singh, R., Mcpartland, J. C., and Hirsch, J. (2024). Support vector machine prediction of individual Autism Diagnostic Observation Schedule (ADOS) scores based on neural responses during live eye-to-eye contact. Sci. Rep-Uk 14 (1), 3232. doi:10.1038/s41598-024-53942-z
Zhou, X., Wang, X., Dougherty, E., Russ, D., and Suh, E. (2004). Gene clustering based on clusterwide mutual information. J. Comput. Biol. 11 (1), 147–161. doi:10.1089/106652704773416939
Zhu, Y., Soderblom, C., Trojanowsky, M., Lee, D. H., and Lee, J. K. (2015). Fibronectin matrix assembly after spinal cord injury. J. Neurotrauma 32 (15), 1158–1167. doi:10.1089/neu.2014.3703
Keywords: machine learning, spinal cord nervous, ScRNA-seq, marker genes, cell subpopulations
Citation: Liu L, Huang Y, Zheng Y, Liao Y, Ma S and Wang Q (2024) ScnML models single-cell transcriptome to predict spinal cord neuronal cell status. Front. Genet. 15:1413484. doi: 10.3389/fgene.2024.1413484
Received: 07 April 2024; Accepted: 20 May 2024;
Published: 04 June 2024.
Edited by:
Zhuang Xiong, Fuzhou University, ChinaCopyright © 2024 Liu, Huang, Zheng, Liao, Ma and Wang. This is an open-access article distributed under the terms of the Creative Commons Attribution License (CC BY). The use, distribution or reproduction in other forums is permitted, provided the original author(s) and the copyright owner(s) are credited and that the original publication in this journal is cited, in accordance with accepted academic practice. No use, distribution or reproduction is permitted which does not comply with these terms.
*Correspondence: Qian Wang, d2FuZ3FpYW4zMkBob3RtYWlsLmNvbQ==; Siyuan Ma, bWFzaXl1YW5AY3VwZXMuZWR1LmNu
†These authors have contributed equally to this work