
95% of researchers rate our articles as excellent or good
Learn more about the work of our research integrity team to safeguard the quality of each article we publish.
Find out more
ORIGINAL RESEARCH article
Front. Genet. , 18 June 2024
Sec. Cancer Genetics and Oncogenomics
Volume 15 - 2024 | https://doi.org/10.3389/fgene.2024.1410145
This article is part of the Research Topic Enhancing Precision Immunotherapy: Leveraging Deep Learning and Cancer Genomics for Molecular Innovations and Clinical Applications View all 4 articles
 Ying Zhang1,2†
 Yinghui Wang1†Wenyan Zhang3Shaojie Feng4
 Yuanxin Xing2Tianjiao Wang1Nana Huang5
 Ka Li6*
 Aijun Zhang1*
Background: Osteosarcoma (OS) is highly malignant and prone to local infiltration and distant metastasis. Due to the poor outcomes of OS patients, the study aimed to identify differentially expressed genes (DEGs) in OS and explore their role in the carcinogenesis and progression of OS.
Methods: RNA sequencing was performed to identify DEGs in OS. The functions of the DEGs in OS were investigated using bioinformatics analysis, and DEG expression was verified using RT-qPCR and Western blotting. The role of SLC25A4 was evaluated using gene set enrichment analysis (GSEA) and then investigated using functional assays in OS cells.
Results: In all, 8353 DEGs were screened. GO and KEGG enrichment analyses indicated these DEGs showed strong enrichment in the calcium signaling pathway and pathways in cancer. Moreover, the Kaplan-Meier survival analysis showed ten hub genes were related to the outcomes of OS patients. Both SLC25A4 transcript and protein expression were significantly reduced in OS, and GSEA suggested that SLC25A4 was associated with cell cycle, apoptosis and inflammation. SLC25A4-overexpressing OS cells exhibited suppressed proliferation, migration, invasion and enhanced apoptosis.
Conclusion: SLC25A4 was found to be significantly downregulated in OS patients, which was associated with poor prognosis. Modulation of SLC25A4 expression levels may be beneficial in OS treatment.
Osteosarcoma (OS) is an aggressive malignancy of bone tissues, most common in children and adolescents. (Beird et al., 2022). The incidence of OS peaks around puberty, with an overall incidence of 3.8 per 1,000,000 people, with males slightly outnumbering females. (Zarghooni et al., 2023). OS mostly occurs in the extremities, especially in the distal femur, proximal tibia, and proximal fibula. (Kansara et al., 2014). In recent years, neoadjuvant chemotherapy for patients with limited OS has proved to be very effective; however, the prognosis for patients with distant metastases and recurrence remains dismal, with an average 5-year survival rate of about 20%. (Lillo Osuna et al., 2019; Ji et al., 2024). Although combination therapies including chemotherapy, radiotherapy and immunotherapy have been increasingly used in cancer treatment in recent years, the prognosis for patients with early metastasis and recurrent tumors is still not optimistic. (Wu et al., 2024). The survival outcomes of patients can be improved by early surveillance and diagnosis of tumors. (Villani et al., 2016). In recent years, screening for genetic changes has led to the identification of DEGs and functional pathways involved in tumor development, providing a biological basis for early diagnosis and treatment strategies. (Wang et al., 2022; Zhang et al., 2022).
The ADP/ATP transporter protein, adenine nucleotide translocator 1 (ANT1) is encoded by the solute carrier family 25 member 4 (SLC25A4) gene. The SLC25A4 gene is located on the subterminal region of chromosome 4q and is highly expressed mainly in skeletal muscles, brain, and heart tissues. (Cimadamore-Werthein et al., 2023). ANT1 regulates mitochondrial energy metabolism, which facilitates the exchange of ADP and ATP between the cytoplasm and the mitochondrial matrix. (Kunji et al., 2020). Therefore, any defect in or dysfunction of the ANT1 protein can cause severe impairment of mitochondrial energy metabolism, with different degrees of impact on tissues or cells. (Kunji and Ruprecht, 2020). On the other hand, ANT1 takes part in the regulation of programmed cell death as part of the mitochondrial permeability transition pore (mPTP). (Vial et al., 2020). Dysregulation of pathways associated with programmed cell death plays a key role in cancer development and treatment resistance; therefore, reduced levels of ANT1 expression may contribute to disruptions in tumor cell apoptosis. (Brown and Attardi, 2005). A study on rhabdomyosarcoma showed that reduced ANT1 expression could affect mitochondrial function and was involved in tumor cell metabolism and death pathways, leading to tumorigenesis, which indicated that ANT1 might be a therapeutic target for rhabdomyosarcoma. (Vial et al., 2020). OS and rhabdomyosarcoma are both sarcomas; however, whether the expression levels of ANT1 influence the development of OS is yet unknown.
Herein, we identified predictors that influenced the prognosis of patients with OS and clarified their roles in OS development. The RNA-sequencing data from human OS tissues and nearby non-cancerous tissues was analyzed to identify DEGs, and we explored the expression level of SLC25A4 in OS and the effect of changes in its expression level on OS cell proliferation, invasion, migration, and apoptosis.
The four OS tissue specimens along with their adjacent non-cancerous tissues used for RNA sequencing were taken from the primary tumor sites of patients diagnosed with OS by Qilu Hospital of Shandong University, and their clinical chart information was shown in Table 1. All participants provided written informed consent, and the study received ethical approval from the review board of the participating institution.
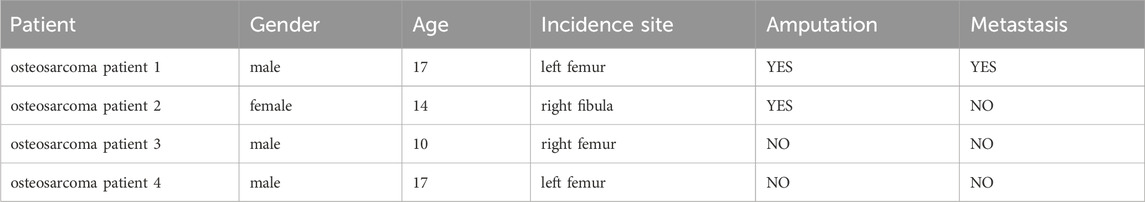
Table 1. De-identified clinical data of osteosarcoma patients.
TRIzol (Accurate Biology, Hunan, China) was utilized for RNA isolation and purification of the samples. Subsequently, NanoDrop ND-1000 (NanoDrop, Wilmington, DE, USA) was employed to perform quality control on the total RNA in terms of quantity and purity. The mRNA containing PolyA (polyadenylate) was specifically captured via Dynabeads Oligo (dT) beads (Thermo Fisher, CA, USA), which underwent two series of purification. To fragment the captured transcript under high-temperature conditions (94°C for 5–7 min), we used the NEBNext® Magnesium RNA Fragmentation Module (NEB, cat. E6150, USA). Following this step, cDNA synthesis from the fragmented RNA was carried out using Invitrogen SuperScript™ II Reverse Transcriptase (CA, USA). The second strand cDNA synthesis involved DNA polymerase I along with RNase H and DNTP in a buffer solution; terminal repair and poly(A) were also performed. Magnetic beads were then utilized to screen and purify fragments based on their sizes. UDG enzyme digestion followed by PCR assay yielded double-stranded DNAs with a fragment size of 300bp ± 50bp. Finally, LC-Bio Technologies (Hangzhou) Co., Ltd conducted sequencing and data analysis while R package edgeR or DESeq2 analyzed significant differences among the samples.
DEGs were identified by comparing gene expression levels between OS tissues and adjacent non-cancerous tissues based on the criteria of |log fold-change (FC)| >1 .00 and p-value <0 .05. Venn diagrams were generated to determine DEGs that overlapped among the four pairs of specimens (http://bioinformatics.psb.ugent.be/webtools/Venn/). Additionally, heatmaps, histograms, and volcano plots were used to visualize gene expression levels in OS tissues versus adjacent non-cancerous tissues.
The functions of the DEGs were explored using Gene Ontology (GO), a bioinformatics resource that provides information on biological process (BP), cellular component (CC), and molecular function (MF). In addition, the Kyoto Encyclopedia of Genes and Genomes (KEGG) was utilized for the identification of interactions and response networks involving DEGs.
The Search Tool for the Retrieval of Interacting Genes (STRING) database was utilized to analyze PPIs among the DEGs. STRING provides valuable information on protein interactions, including confidence scores, protein domains, and 3D structures. To identify key molecules involved in the tumorigenesis and development of OS, a PPI network was generated with STRING and was visualized with Cytoscape software, a tool specifically designed for PPI network visualization. We used the MCODE plugin to identify DEGs with high node scores and strong connectivity within the network. Additionally, we employed the Cytohubba plugin to identify hub genes using various topological analysis algorithms.
To elucidate the prognostic performance of the identified hub genes, we conducted survival analysis using the Kaplan-Meier (KM) method. OS samples from the GEO, TCGA, and EGA databases were classified into elevated or reduced expression cohorts according to the median expression of the hub genes. Subsequently, overall survival (OS) and recurrence-free survival (RFS) curves were plotted along with hazard ratio (HR) and 95% confidence interval (CI) calculations to assess associations between hub gene expression profiles and patient outcomes.
Total RNA was obtained from exponentially growing cells with TRIzol (Invitrogen, Carlsbad, CA, USA). The cDNA synthesis was performed with the Evo M-MLV RT Mix Kit with gDNA Clean using RT-qPCR Ver.2 from Accurate Biotechnology (Hunan) Co., Ltd (ChangSha, China). The primer sequences can be found in Table 2. Each sample underwent three replicate runs of RT-qPCR via SYBR Green Premix Pro Taq HS RT-qPCR kit [Accurate Biotechnology (Hunan) Co., Ltd (ChangSha, China)] on a LightCycler 96 instrument (Roche, Basel, Switzerland). GAPDH served as the endogenous control for normalization and the relative gene expression were computed utilizing the 2−ΔΔCT formula.
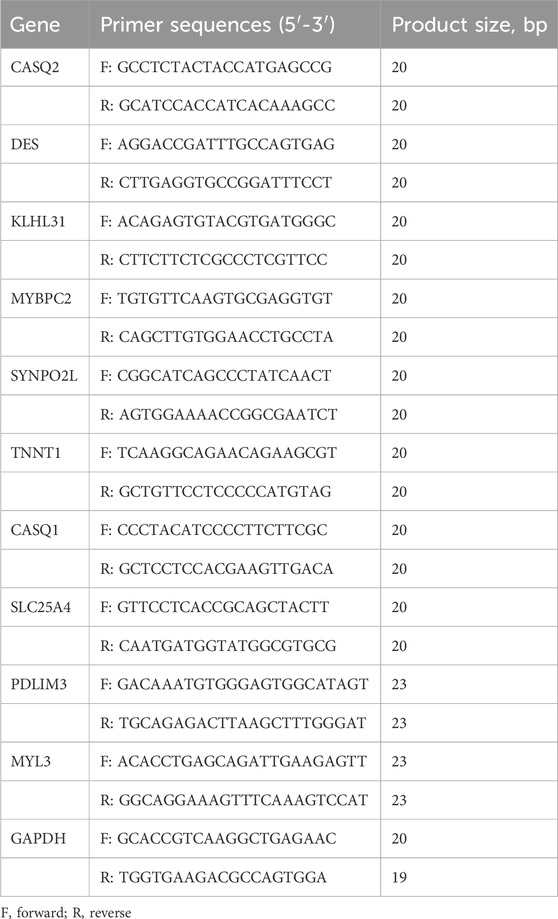
Table 2. Primer sequences used for reverse transcription-quantitative PCR.
Protein samples were prepared from collected cells and subjected to SDS gel electrophoresis before being transferred onto nitrocellulose membranes, which were then blocked at room temperature (RT) for 2 h in 5% skim milk, before overnight incubation with primary antibodies obtained from ImmunoWay Biotechnology Company (Plano, TX, USA). Subsequently, they underwent three washes with Tween 20 in Tris-buffered saline (TBST) before a 1–2 h incubation at RT in secondary antibodies. After an additional three washes of the membranes, chemiluminescence reagents were used to visualize protein expression levels. The following antibodies were used:anti-β-actin (1:10000; Proteintech, 66009-1-Ig); anti-Vinculin (1:10000; Abways, CY5164); anti-SLC25A4 (1:1000; ABclonal, A15027); anti-CASQ1 (1:1000; ABclonal, A19640); anti-CASQ2 (1:2000; Proteintech, 18422-1-AP).
The cancer genomic atlas (TCGA) database, known for its comprehensive functionalities such as analyzing differential expression, survival rates, correlations, and identifying similar genes, was utilized to assess hub gene profiles in several tumor tissues and their matched healthy tissues based on patient data.
The HPA database offers valuable information regarding the distribution of proteins within different cancer types based on cellular and histopathological characteristics. This resource was employed for bioinformatics data mining purposes to present confocal images showcasing the cellular localization of hub genes.
To explore genetic alterations, mutations, and associated prognosis related to SLC25A4, we utilized the cBioPortal for Cancer Genomics (http://cbioportal.org). This web resource allows for multidimensional analysis and visualization of genomics data alongside clinical features from diverse cancer samples. For our study, we chose the whole genome pan-cancer analysis (ICGC/TCGA, Nature 2020). We obtained information about copy number variations (CNVs) in hub genes found in both cancerous tissues and cell lines.
Transcriptional data from GSE238110 was downloaded and the subjects were divided into elevated and reduced expression cohorts according to the median SLC25A4 contents, and then the inter-cohort differences were assessed by limma. Next, we employed GSEA to identify the DEG-associated signaling networks that are significant between the elevated- and reduced-SLC25A4 expression cohorts. (Subramanian et al., 2005).
The human OS cell lines MG-63, HOS, and Saos-2 were purchased from Genechem Co., Ltd (Shanghai, China), Procell Life Science & Technology Co., Ltd. (Wuhan, China), and BOSTER Biological Technology Co., Ltd (Wuhan, China), respectively. The human osteoblast cell line hFOB1.19 was obtained from the Institute of Biochemistry and Cell Biology, Chinese Academy of Sciences (Shanghai, China). MEM (Procell, Wuhan, China) was used for HOS and MG-63 cell culture, and McCoy’s 5A medium (BOSTER, Wuhan, China) was used for the culture of Saos-2 cells. Moreover, DMEM/F12 medium (Gibco, MA, USA) was employed for the hFOB1.19 cell culture. All media contained 10% fetal bovine serum (FBS, Gibco) and were grown in an atmosphere containing 5% CO2. OS cells were maintained at 37°C, while the hFOB1.19 cells were cultured at 34°C. Transient transfection of siRNA (RiboBio, Guangzhou, China), plasmids and the control was conducted with Lipofectamine 2000 (Invitrogen) following the provided directions. Both RT–qPCR and Western blotting were used to verify the transfection efficiency.
CCK-8 assays (Yeasen Biotechnology, Shanghai, China) were used to assess the proliferation of OS cells. HOS and MG-63 cells (1 × 10⁵ per well) were seeded in 96-well plates and incubated for 24, 48, 72, 96, or 120 h. CCK-8 solution (10 μL per well) was then added and incubated at 37°C for 1 h. Absorbances at 450 nm were read in an Epoch microplate spectrophotometer (SpectraMax i3x).
Cell proliferation rates were assessed by the Cell Light™ EdU Apollo567 In Vitro Kit (RiboBio). Briefly, cells cultured in 96-well plates were transfected for 48 h. Next, EdU (50 μM) was added to the cells and incubated (2 h, 37°C). The cells were then fixed in 4% formaldehyde for 0.5 h, followed by incubation with glycine (2 mg/mL) for 5 min and a 10-min cell permeabilization with 0.5% Triton X-100, before washing in PBS, incubation with the Apollo reaction cocktail for 30 min incubation, and washed twice with 0.5% Triton X-100. The cells were then stained with Hoechst 33342 for 30 min and evaluated under fluorescence microscopy (Olympus, Japan).
After transfection, cells were plated into 6-well plates and grown to 100% confluency. Wounds were operated with 200 μL tips in the middle of the wells, rinsed three times using PBS, and then the medium was changed with serum-free medium immediately. Image capture utilized an inverted phase-contrast microscope (OLYMPUS, Japan) at 0 h and 24 h, respectively.
Transwell chambers (8 µm pore size; Corning, NY, USA) were used to examine migration and invasion in OS cells. Cells (1 × 10) were placed in the top chamber which was precoated with 50 µL 1:8 diluted Matrigel (Corning) (to test invasion) or not (to test migration). Cells in the top chamber were in 200 µL of serum-free culture medium whereas cells in the bottom chamber were cultured in medium with 10% FBS. Following 37 °C incubation for 24 h, the cells in the lower chamber were fixed with 4% paraformaldehyde followed by staining with crystal violet for 1 h at RT. Cell numbers in five randomly selected fields were recorded. All the above experiments were repeated three times.
Apoptosis was assessed in treated OS cells after staining with Annexin V-FITC/PI. After cell precipitation and resuspension, the cells were exposed to 5 μL Annexin V-FITC and 10 μL PI Staining solution, and incubated in the dark at RT for 10–15 min. Then, samples were resuspended in 400 μL 1×Binding Buffer, placed on ice, and evaluated by flow cytometry (BD LSRFortessa) within 1 h.
All data were statistically analyzed using GraphPad Prism eight software. Analysis of the differences between the two groups was determined by Student’s t-test. A p-value of <0.05 was considered statistically significant.
In this study, we combined RNA sequencing, bioinformatics, and experimental results for multilevel verification of the identification of key genes in OS. The study design is shown in Figure 1. The RNA-sequencing results of OS and adjacent non-cancerous tissues were analyzed and DEGs were identified using the criteria of |Log2 FC| >1 and p-value <0.05 (Figure 2A). A total of 8353 DEGs were identified between OS and normal tissues, of which 5,056 were upregulated and 3,297 were downregulated (Supplementary Figure S1). There were 4,706 DEGs in OS 1, including 3,348 upregulated and 1358 downregulated genes. In all, 4,173 DEGs were identified in OS 2, of which 2,819 were upregulated and 1354 were downregulated. Additionally, 5,228 DEGs were identified in OS 3, including 3,642 upregulated and 1586 downregulated genes, while 5,662 DEGs were found in OS 4, with 4,207 upregulated and 1455 downregulated (Figure 2B). The top 100 DEGs were visualized using a heatmap, with red color indicating upregulation and blue downregulation (Figure 2C). The Venn diagrams showed that among the top 100 DEGs, there were 81 genes that were common to the four pairs of specimens (Figure 2D).
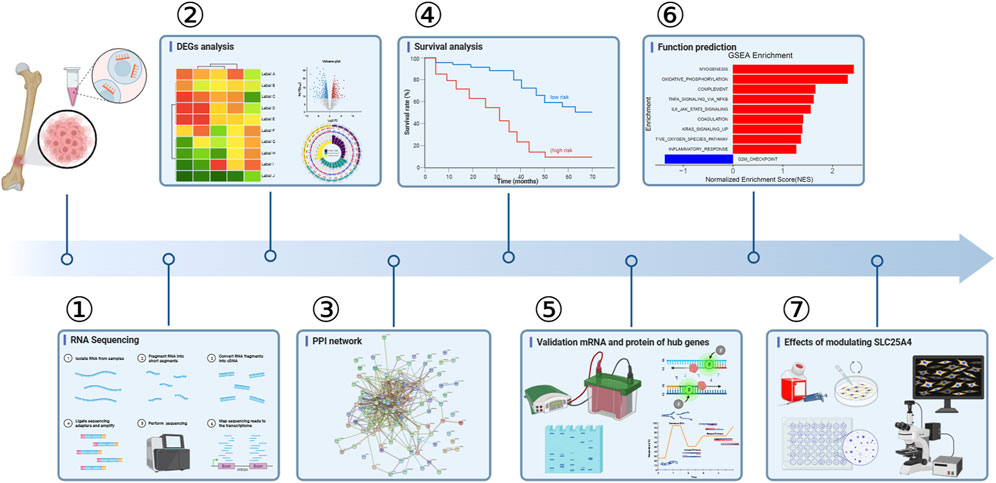
Figure 1. Design of the study. DEGs, differentially expressed genes; PPI, protein-protein interaction.
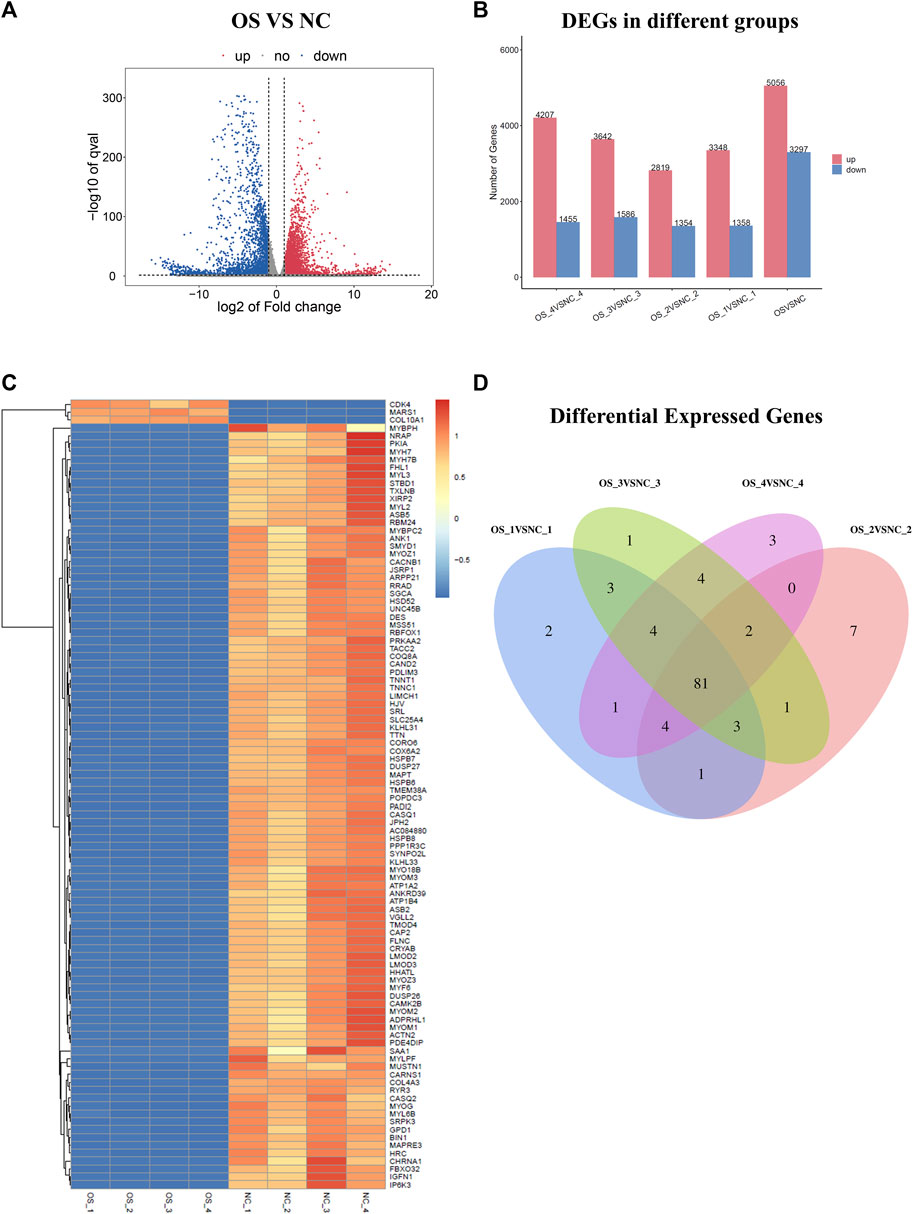
Figure 2. Identification of DEGs in osteosarcoma. (A) Volcano plots of DEG distribution. (B) DEG distribution in four pairs of tissues. (C) Heatmap of the top 100 DEGs. (D) Venn diagram showing the intersection of four pairs of tissues. Red and blue colors represent upregulated and downregulated DEGs, respectively. DEGs, differentially expressed genes.
The biological roles of DEGs in OS tumorigenesis and metastasis were explored using KEGG and GO enrichment analyses. The BP, CC, and MF were analyzed using GO enrichment analyses (Figure 3A; Table 3). In BP analysis, DEGs showed predominant enrichment in muscle contraction, cell adhesion, and muscle filament sliding (Figure 3B). The CC analysis indicated that the DEGs played a role in Z disc, collagen-containing extracellular matrix, and sarcoplasmic reticulum (Figure 3C). Moreover, the MF analysis revealed that the DEGs showed major contribution in protein interaction, extracellular matrix structural component, and actin-binding (Figure 3D). KEGG network enrichment assessment revealed that most DEGs contributed to the calcium, cancer-related, Rap1 and PI3K-Akt networks (Figure 3E; Table 4). The above results indicated that these DEGs were potential regulators of OS initiation and progression.
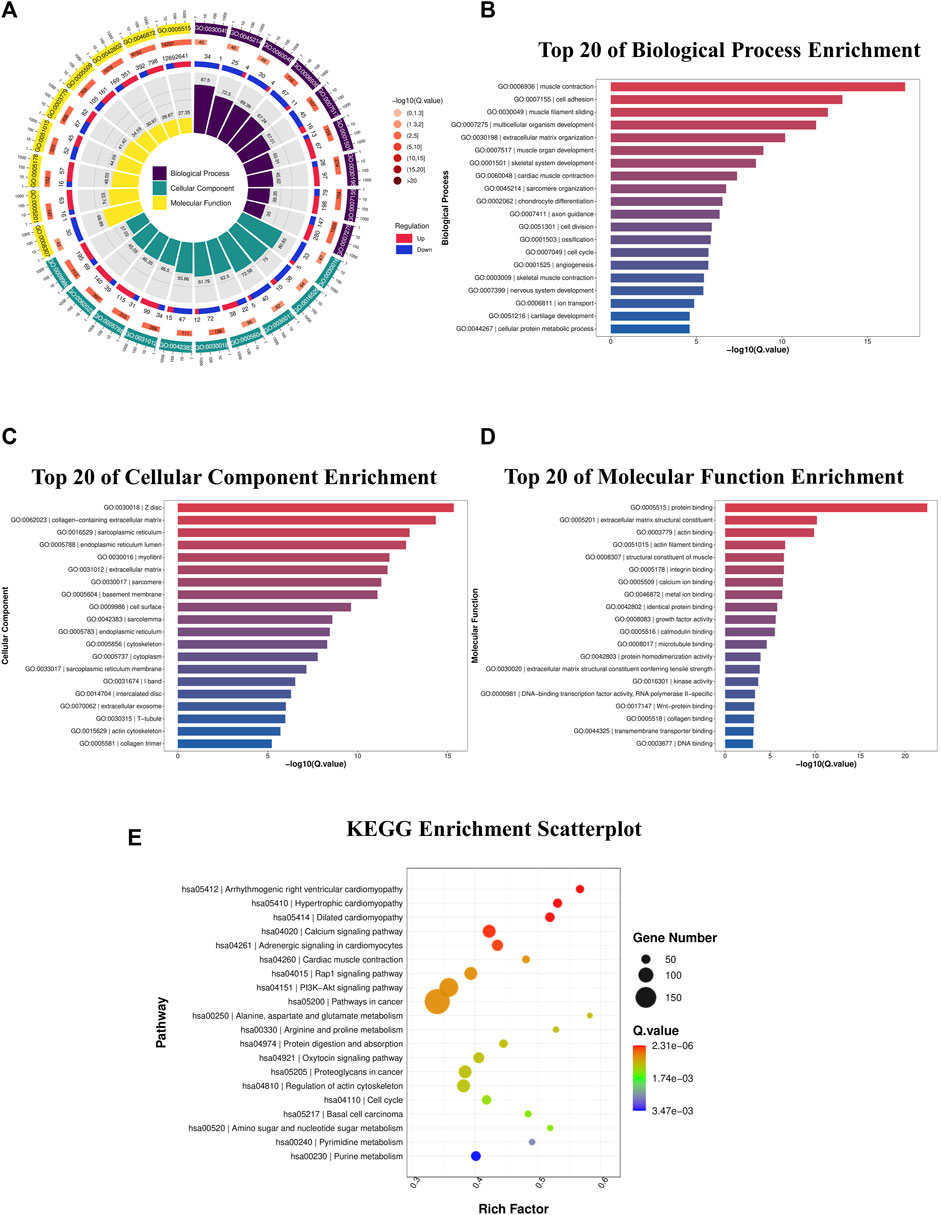
Figure 3. DEG functional enrichment analysis. (A) DEG GO enrichment assessment in the BP, CC, and MF categories. (B) Top 20 enriched BPs. (C) Top 20 enriched CCs. (D) Top 20 enriched MFs. (E) DEG KEGG pathway enrichment assessment. DEGs, differentially expressed genes; GO, Gene Ontology; BP, biological process; CC, cellular component; MF, molecular function; KEGG, Kyoto Encyclopedia of Genes and Genomes.
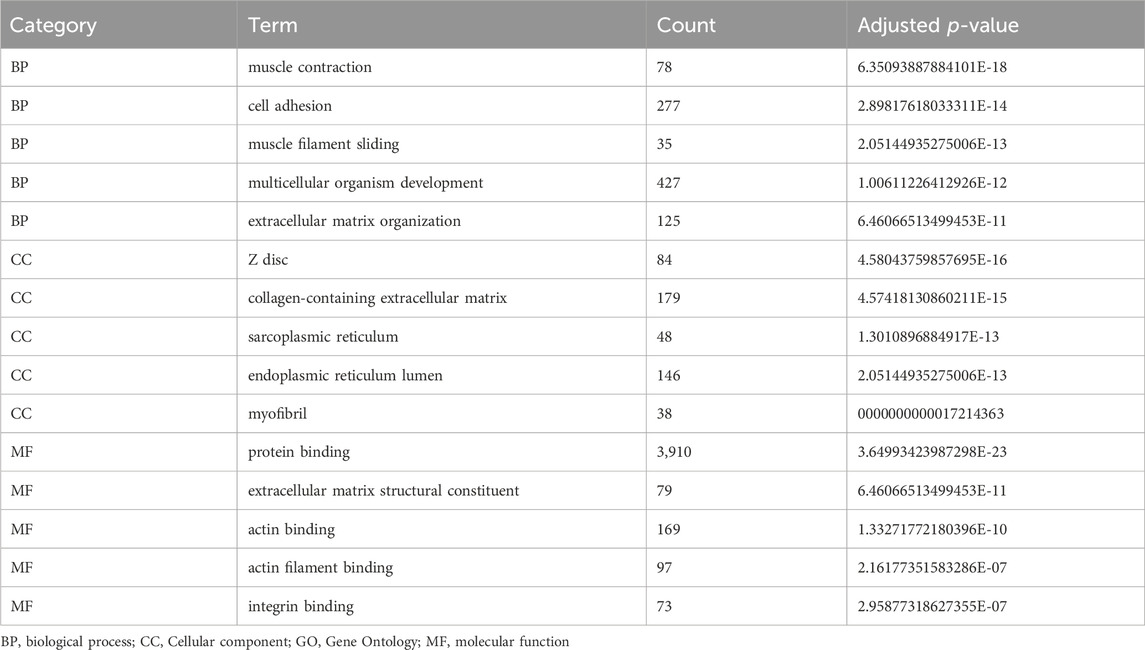
Table 3. Top 15 enriched GO terms of DEGs.
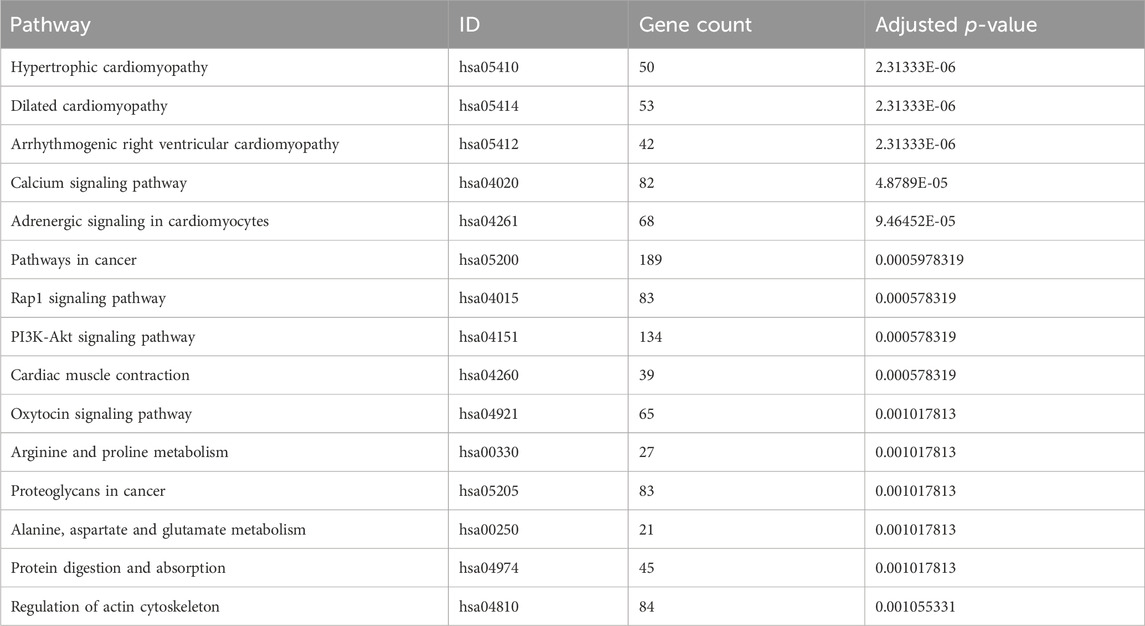
Table 4. Top 15 enriched KEGG pathway terms of DEGs.
The interactions among the DEGs were further explored via the STRING database. A PPI of three upregulated and 94 downregulated genes was constructed; this consisted of 97 nodes and 377 edges (Figure 4A). Various algorithms for topological analysis, including MCC, DMNC, MNC, degree, EPC, bottleNeck, EcCentricity, closeness, radiality, and betweenness, were used to predict and identify key nodes in the PPI network using Cytohubba. This led to the identification of 50 top genes (Figure 4B). The interactions between these genes were then evaluated, identifying 22 hub genes, including SLC25A4, ACTN2, TTN, MYL3, MYH7, MYOM2, MYOZ1, UNC45B, SYNPO2L, KLHL31, MYLPF, NRAP, CASQ1, PDLIM3, MYL6B, FLNC, MYH7B, MYO18B, SRL, TXLNB, MYOZ3, and HSPB7 (Figure 4C; Supplementary Figure S2). Hub genes were recognized via the MCODE plugin in Cytoscape, with the most important module containing 16 hub genes (Figure 4D). Among them, seven genes coincided with the hub genes in the Cytohubba plugin (Figure 4E).
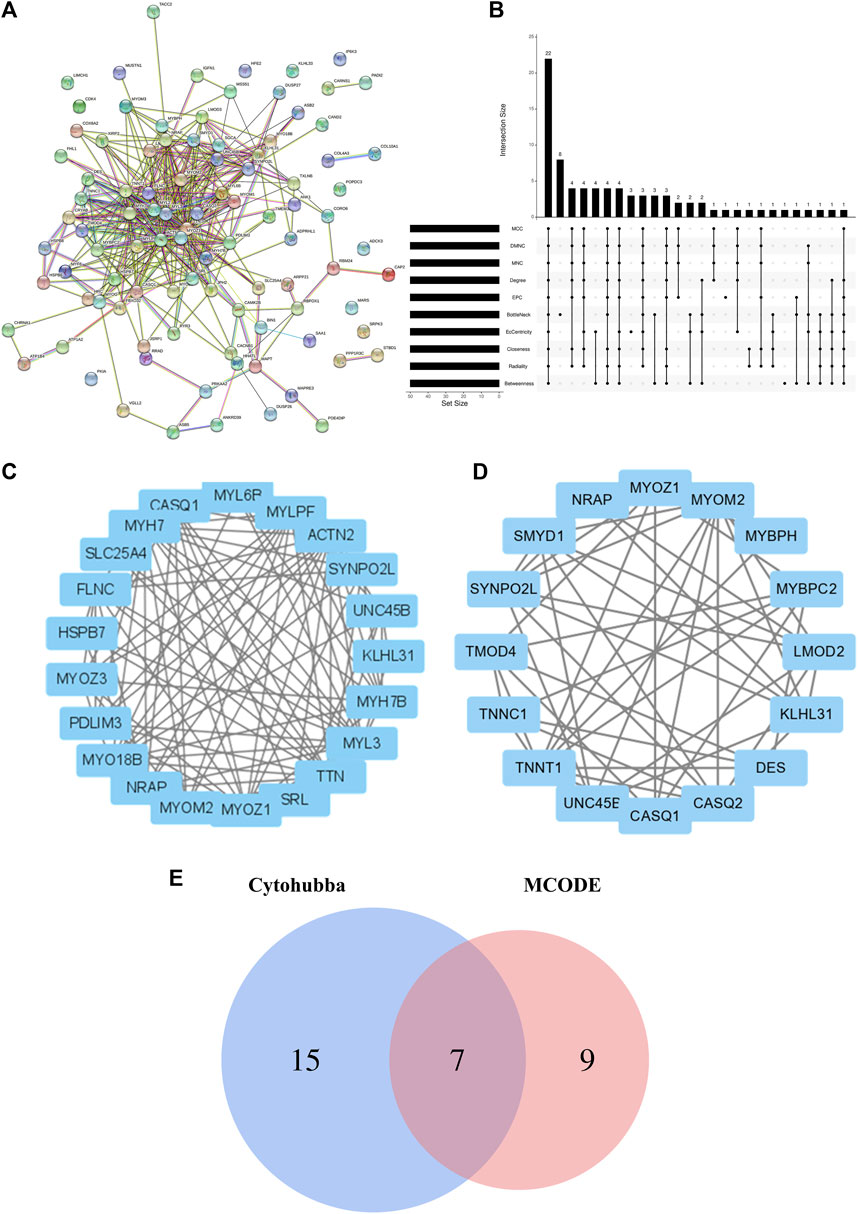
Figure 4. Construction of the PPI network, evaluation of important modules, and identification of hub genes. (A) Whole PPI betwork. (B) Hub genes identified via intersection of 50 genes from 10 algorithms using Cytohubba, namely, MCC, DMNC, MNC, Degree, EPC, BottleNeck, EcCentricity, Closeness, Radiality, and Betweenness. (C) Hub genes identified by Cytohubba. (D) Module 1 PPI netowrk. (E) Venn diagram showing the intersection of 22 common genes using Cytohubba and genes within the most significant module. PPI, protein-protein interaction.
K-M survival curves were used to confirm the associations between the hub genes and OS patient survival outcomes (Figure 5; Supplementary Figure S3). The findings showed that increased expression of CASQ1 (HR = 0.63 [0.42–0.94], p = 0.024), CASQ2 (HR = 0.45 [0.3–0.69], p = 0.00017), DES (HR = 0.53 [0.33–0.84], p = 0.0064), PDLIM3 (HR = 0.62 [0.4–0.95], p = 0.026), and SLC25A4 (HR = 0.56 [0.34–0.92], p = 0.02) had better overall survival, while those with higher expression of KLHL31 (HR = 1.68 [1.1–2.58], p = 0.016), MYBPC2 (HR = 1.7 [1.14–2.54], p = 0.008), SYNPO2L (HR = 1.9 [1.12–3.21], p = 0.015), TNNT1 (HR = 1.71 [1.11–2.64], p = 0.015), and MYL3 (HR = 1.5 [1.01–2.23], p = 0.044) had worse overall survival (Figure 5). The abbreviations, full names, and functions of these 10 genes are provided in Supplementary Table S1. In conclusion, these results suggested that the expression of these genes can be indicative of prognosis in OS patients and might act as significant prognostic biomarkers for OS patients.
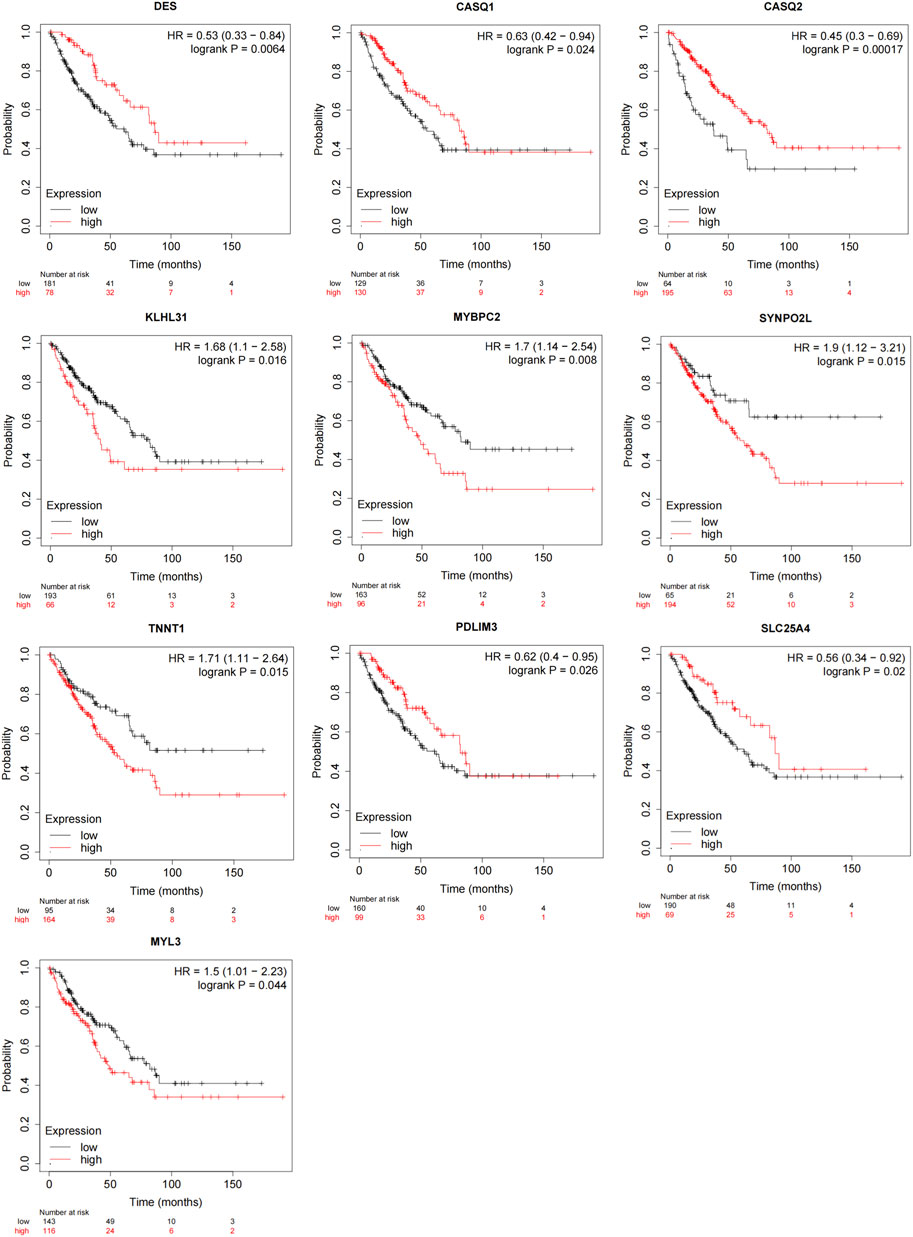
Figure 5. Prognostic assessment of hub genes via the Kaplan-Meier plotter. Changes in DES, CASQ1, CASQ2, KLHL31, MYBPC2, SYNPO2L, TNNT1, PDLIM3, SLC25A4, and MYL3 genes were intimately linked to OS patient overall survival (p < 0.05).
Table 5 showed the transcript profiles of the ten genes obtained by RNA sequencing. Differences among hub gene transcript expressions in OS were further explored by RT-qPCR. The results showed that DES, CASQ1, CASQ2, MYBPC2, SYNPO2L, TNNT1, SLC25A4, and MYL3 had reduced expression in OS tissues, which consistent with our RNA sequencing results. Whereas PDLIM3 and KLHL31 were significantly upregulated at the expression levels in OS tissues (p < 0.05; Figure 6A). Moreover, we also validated the ten gene expression profiles in OS cell lines. Expression levels of CASQ1, CASQ2, SLC25A4, and TNNT1 were significantly lower in all human OS cells, including MG-63, HOS, and Saos-2, relative to the human fetal osteoblast cell line (hFOB1.19) (Figure 6B). Furthermore, their contents in OS and normal tissues were also demonstrated with TCGA. The expression levels of CASQ1, CASQ2, and SLC25A4 were downregulated in OS, and these results corroborated with the RT-qPCR data (Supplementary Figure S4A). In addition to the expression levels of mRNA, the hub gene protein expressions in hFOB1.19, MG-63, HOS, and Saos-2 cells were further verified using Western blot. We revealed that the SLC25A4 protein expression in MG-63, HOS, and Saos-2 were lower relative to hFOB1.19, while the CASQ1 and CASQ2 protein contents did not decrease significantly (Figure 6C; Supplementary Figure S4B). Then, we validated the expression levels of SLC25A4 in four paired OS samples with adjacent normal tissues. Based on these findings, SLC25A4 was strongly diminished among the tumor group (Figure 6D).
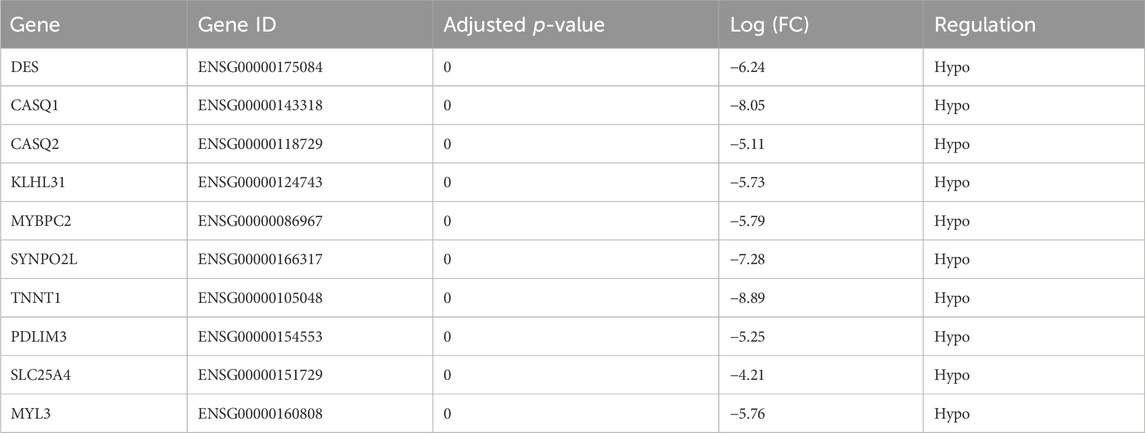
Table 5. Differential expression of hub genes between osteosarcoma tissues and adjacent non-cancerous tissues.
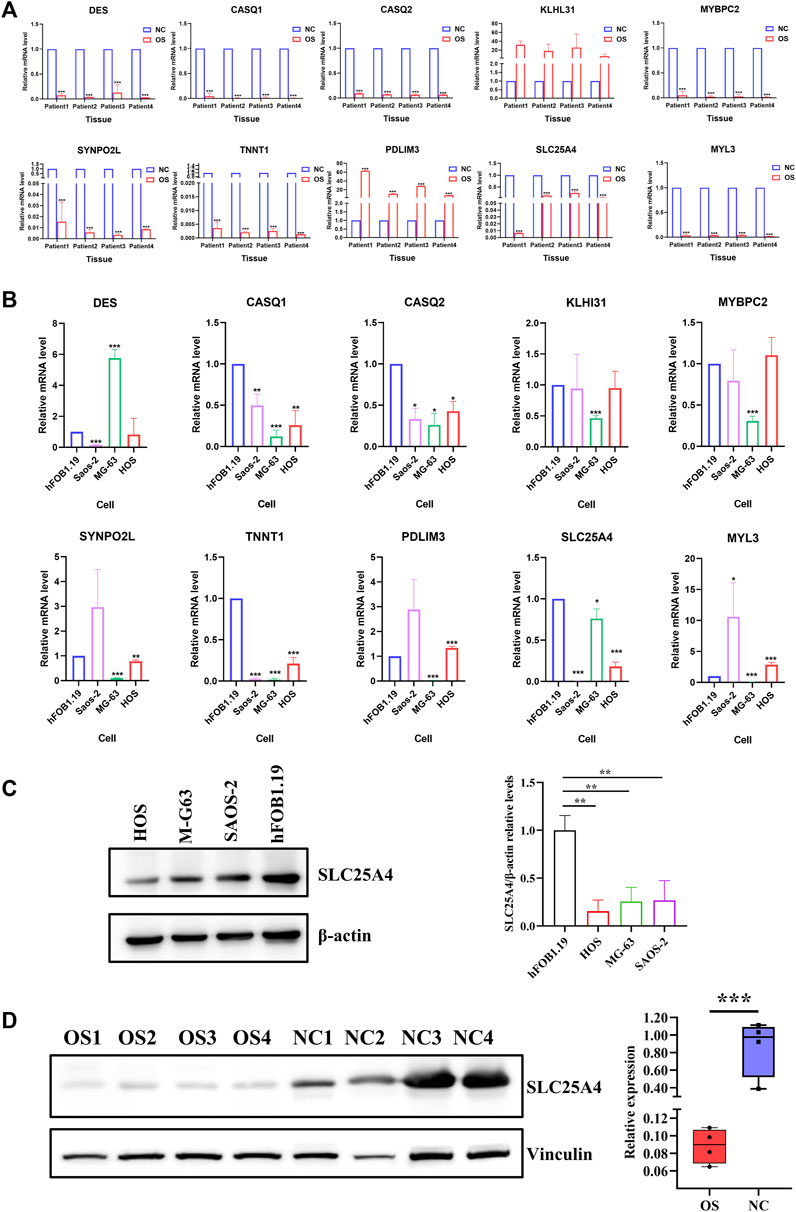
Figure 6. Hub gene transcript and protein expressions in OS. (A) Transcript levels of DES, CASQ1, CASQ2, KLHL31, MYBPC2, SYNPO2L, TNNT1, PDLIM3, SLC25A4, and MYL3 in OS tissues relative to surrounding non-cancerous tissues were verified using real-time qPCR. (B) mRNA expression levels of DES, CASQ1, CASQ2, KLHL31, MYBPC2, SYNPO2L, TNNT1, PDLIM3, SLC25A4, and MYL3 in human OS cell lines (MG-63, HOS, and Saos-2) compared to human fetal osteoblast cell line (hFOB1.19) were verified using real-time qPCR. (C) Basal expression of SLC25A4 in OS cells and normal cell line HFOB examined by Western blot. (D) Results of Western blot on SLC25A4 expression in OS tissues compared to surrounding healthy tissues. n ≥ 3, *p < 0.05, **p < 0.01, ***p < 0.001.
SLC25A4 expression in pan-cancer was then explored, which indicated a decrease in the SLC25A4 expression in most tumors (Figure 7A). As the functions of proteins are often determined by their subcellular localization, the subcellular localization of SLC25A4 in OS was explored using the HPA database. The confocal images revealed that SLC25A4 was present in the mitochondria (Figure 7B). Whole genome pan-cancer analysis (ICGC/TCGA, Nature 2020) was performed to identify the genetic alterations and mutations in SLC25A4 via the cBioPortal database. The frequencies of SLC25A4 mutations in pan-cancer were 3%, and they were typically missense mutation, splice mutation, truncating mutation, amplification, and deep deletion (Figure 7C). Moreover, the frequencies of SLC25A4 mutations were significantly higher in OS patients, accounting for 5.71% (Figure 7D). The data also suggested that the overall SLC25A4-mutated patient survival was worse relative to those with no mutations, indicating that the genetic alterations in SLC25A4 genes was significantly associated with the prognosis of OS patients (Figure 7E). To further elucidate SLC25A4 significance in OS, we employed GSEA to screen the leading 10 networks that showed enrichment in the elevated- and reduced-SLC25A4 expression cohort (Figure 7F). GSEA showed that the high expression of SLC25A4 may potentially mediate certain inflammation, apoptosis and immune-related pathways, such as Oxidative Phosphorylation, TNFα Signaling Via NFκB, IL6/JAK2/STAT3 Signaling. On the other hand, the low expression of SLC25A4 was enriched in the G2M checkpoint, suggesting a possible association with cell proliferation. Therefore, GSEA revealed that SLC25A4 was associated with cell cycle, apoptosis, immune response, cell proliferation and inflammation. In order to further explore the functionality of this molecule, we conducted molecular basic experiments.
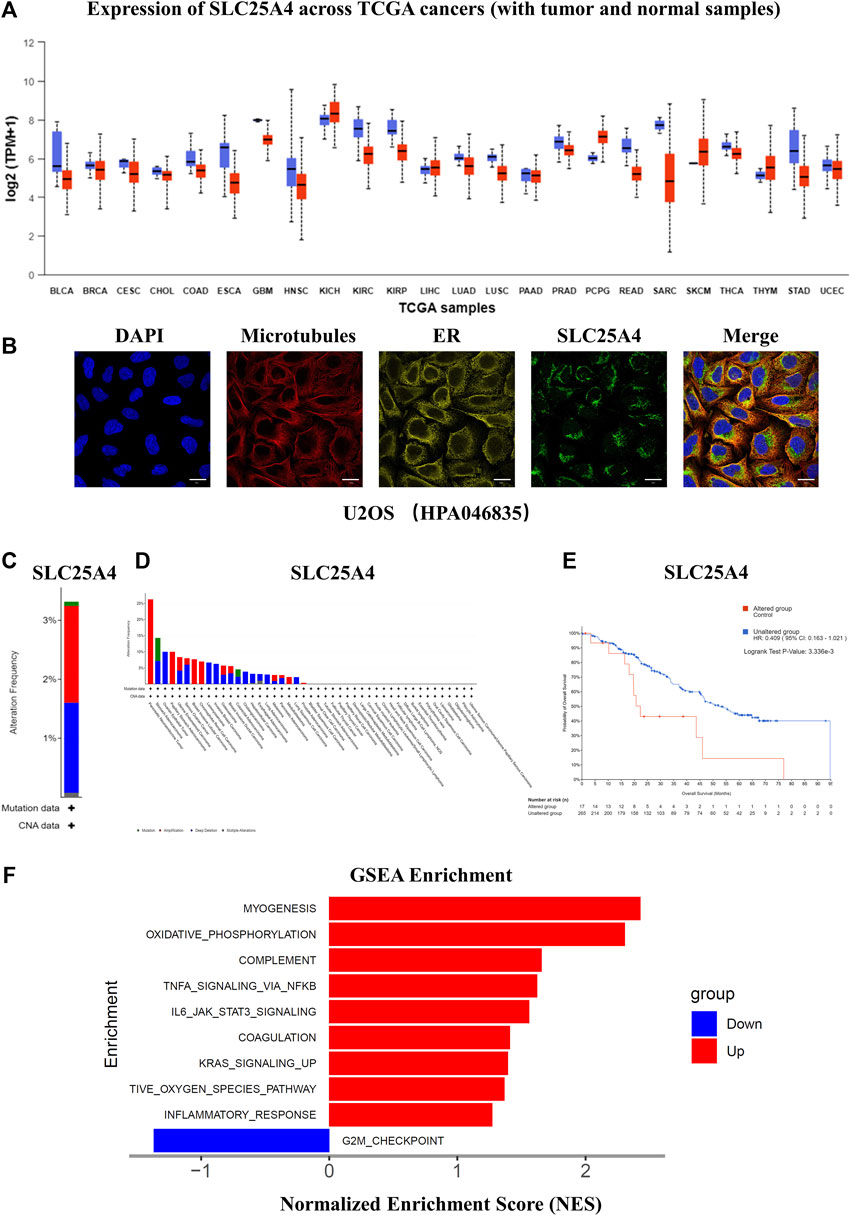
Figure 7. Expression of SLC25A4 in different cancers and function of the SLC25A4 in the OS. (A) Expression of SLC25A4 across TCGA cancers. (B) The confocal images of the cellular localization of SLC25A4 in U2OS cells (scale bar: 20 µm). (C) Genetic alterations and mutations of SLC25A4 in pan-cancer. (D) Genetic alterations and mutations of SLC25A4 in OS. (E) Genetic alterations and mutations in SLC25A4 were strongly associated with overall survival (p < 0.05). (F) Functional and Pathway Enrichment Analysis of SLC25A4 by GSEA.
In order to investigate the effects of SLC25A4 knockdown on OS, the HOS and MG-63 cells were selected to establish the SLC25A4 knockdown cells. Small interfering (si) RNAs, targeting SLC25A4 and negative control siRNA (siNC) synthesized by RiboBio were transfected into HOS and MG-63 cells. RT-qPCR and Western blot assessments were performed to verify the effects of SLC25A4 knockdown. Based on our results, siSLC25A4-3 exhibited the optimal knockdown effects (Figures 8A,B). Therefore, siSLC25A4-3 was selected for subsequent experiments to validate the effects of SLC25A4 knockdown on OS.
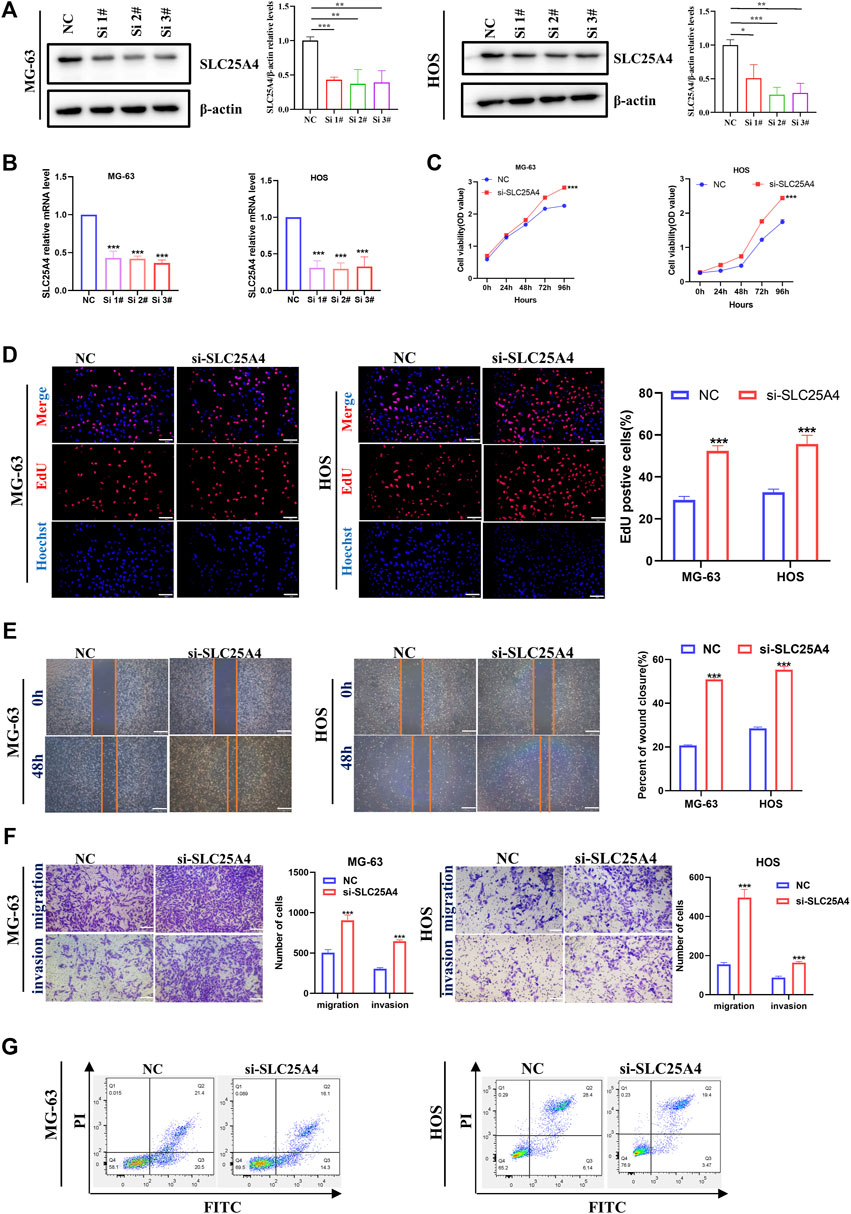
Figure 8. Influences of SLC25A4 deficiency on OS cell proliferation, migration, invasion and apoptosis. Verification of transfection efficiency of siRNAs by Western blot (A) and RT-qPCR (B). CCK-8 (C) and EdU (D) revealed that SLC25A4 knockdown significantly accelerated OS cell proliferation (scale bar: 100 µm). (E) Wound healing assessment revealed that the SLC25A4-deficient migratory cells were considerably more than siNC groups (scale bar: 500 µm). (F) Transwell assessment revealed that SLC25A4 deficiency strongly accelerated OS cell migration and invasion (scale bar: 200 µm). (G) SLC25A4 knockdown inhibited apoptosis rate of HOS. n ≥ 3, *p < 0.05, **p < 0.01, ***p < 0.001.
First, we explored the SLC25A4 knockdown-mediated effect on OS cell proliferation. CCK-8 assay was used to evaluate OS cell proliferation, which showed that the SLC25A4 knockdown cell growth rate, including both HOS and MG-63 cells, was significantly increased (Figure 8C). Furthermore, consistent with the CCK-8 data, EdU assessment showed that the downregulation of SLC25A4 expression significantly increased the proliferation rates of HOS and MG-63 cells (Figure 8D). Together, these findings indicated that SLC25A4 deficiency could enhance the proliferative ability of HOS and MG-63 cells.
Given the importance of migratory and invasive features of tumor cells in tumor development and metastasis, wound healing and Transwell assessments were next conducted on SLC25A4 knockdown cells. The wound healing assay revealed that SLC25A4 knockdown enhanced the HOS and MG-63 cell migration (Figure 8E). Furthermore, the Transwell assay, which can be used to explore both cell migration and cell invasion, revealed that SLC25A4 knockdown predominantly promoted the migration and invasion abilities of HOS and MG-63 cells, which were related to the metastasis of OS (Figure 8F).
ANT1, as a component of mPTP, was closely associated with apoptosis; therefore, its effect on OS cell apoptosis was assessed via flow cytometry. Knockdown of SLC25A4 decreased the overall apoptosis rates of HOS and MG-63 cells (Figure 8G).
Since SLC25A4 knockdown played an inhibitory role in tumorigenesis and progression of OS, we further investigated whether SLC25A4 overexpression might have the opposite effect. The SLC25A4-overexpressing plasmid was used to upregulate SLC25A4 expression in HOS and MG-63 cells. SLC25A4 overexpression efficiency was verified using RT-qPCR and Western blot (Figures 9A,B).
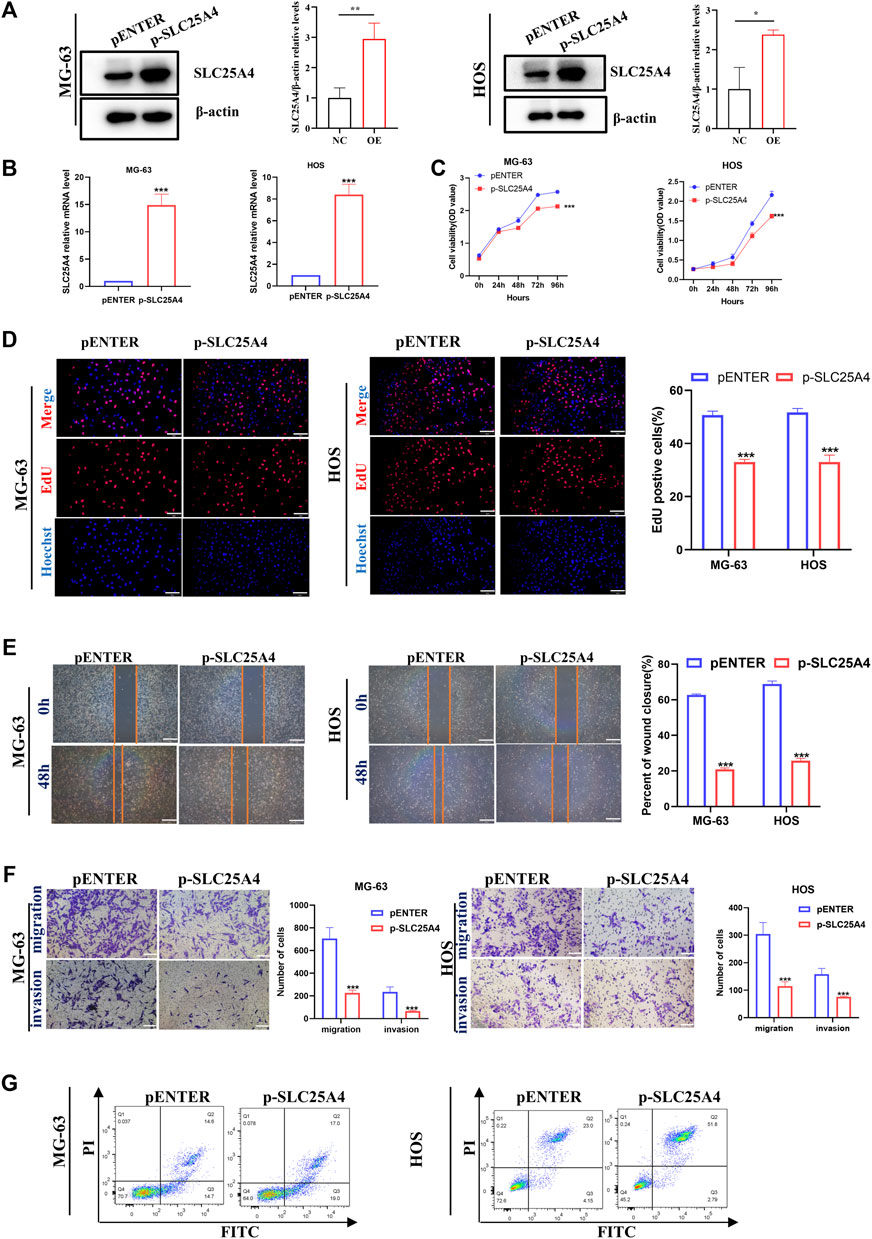
Figure 9. Influences of SLC25A4 overexpression on OS cell proliferation, migration, invasion and apoptosis. Verification of transfection efficiency of plasmid by Western blot (A) and RT-qPCR (B). CCK-8 (C) and EdU (D) revealed that SLC25A4 overexpression significantly inhibited proliferation of OS cells (scale bar: 100 µm). (E) Wound healing assessment revealed that the SLC25A4-overexpressed migratory cells were considerably less compared to siNC groups (scale bar: 500 µm). (F) Transwell assessment revealed that SLC25A4 overexpression significantly suppressed OS cell migration and invasion (scale bar: 200 µm). (G) SLC25A4 overexpression promoted apoptosis rate of HOS. n ≥ 3, *p < 0.05, **p < 0.01, ***p < 0.001.
SLC25A4 expression-mediated regulation of OS cell proliferation, migration and invasion was investigated by constructing SLC25A4-overexpressing HOS and MG-63 cells. After the overexpression of SLC25A4, HOS and MG-63 cells showed a dominant inhibition of proliferation ability, which was confirmed using CCK-8 and EdU assays (Figures 9C,D). From the perspective of cell migration, wound healing assay confirmed that elevated SLC25A4 expression levels impaired the migration ability of OS cells (Figure 9E). Additionally, the Transwell assay showed that SLC25A4 overexpression strongly suppressed OS cell migratory and invasive abilities (Figure 9F); moreover, flow cytometry revealed that the overexpression of SLC25A4 significantly accelerated HOS and MG-63 cell apoptosis, confirming the promise of SLC25A4 as a potential therapeutic target for OS (Figure 9G).
OS is a highly lethal tumor with a high incidence in children and adolescents. (Heng et al., 2024). Despite advances in the treatment of OS, including surgery and chemotherapy, overall patient survival has not improved significantly due to the unclear molecular mechanisms associated with OS tumorigenesis. Therefore, OS contributes significantly to cancer-associated mortality in children and adolescents. (Lin et al., 2017). As established biomarkers play a major role in the diagnosis and prognosis of patients, multiple investigations have been conducted to explore the potential therapeutic targets to improve prognosis. (Colli et al., 2021; Bai et al., 2023; Newhook et al., 2023). For instance, the whole-genome and RNA-sequencing data of 316 patients, obtained from the TCGA database, were employed to analyze the genomic and transcriptomic status of DNA damage response (DDR) gens in oral squamous cell carcinoma (OSCC), leading to the identification of eight hub genes, which could predict the treatment response of OSCC to novel anti-tumor compounds, thereby improving patient outcomes. (Pomella et al., 2023). Tian et al. identified DEGs between mice with subarachnoid hemorrhage (SAH) and control mice using two datasets, GSE167110 and GSE79416, from the GEO database and also explored the expression levels and functional pathways of the hub gene CCR2. (Tian et al., 2022). Hou et al. explored the CD74/STAT1 signaling pathway in trastuzumab-induced cardiotoxicity using GO and KEGG analysis. (Hou et al., 2023). It has been found that FBXO9 affects the metastasis of lung cancer cells by participating in the assembly process of the Vacuolar-type H + -ATPase (V-ATPase), thus influencing the prognosis of lung cancer patients. (Liu et al., 2024). Therefore, it is critical to utilize genomic-level research in the clinical practice of cancer treatment.
In this study, using comprehensive bioinformatics analysis of RNA sequencing data from OS tissues and adjacent non-cancerous tissues, we demonstrated that the mRNA and protein expression of SLC25A4 was markedly downregulated in OS patients. Furthermore, pan-cancer analysis revealed that SLC25A4 expression was reduced in most tumors, and the cBioPortal database indicated that genetic alterations in SLC25A4 were strongly linked to OS patient prognosis. GSEA revealed that SLC25A4 was associated with the cell cycle, apoptosis, the immune response, cell proliferation, and inflammation. In addition, HOS and MG-63 cells with SLC25A4 knockdown showed significantly increased proliferation, migration, and invasion, as well as a significant decrease in apoptosis. Here, we explored the transcriptional status, protein levels, functional pathways, mutations, and prognostic associations of SLC25A4 in OS. It is hoped that these findings may enhance an understanding of the mechanisms associated with OS occurrence and development and help in improving the accuracy of prognosis prediction for OS patients. Hence, the current study may provide a potentially effective target for OS diagnosis and intervention.
The SLC25 carrier superfamily, the largest solute transport family expressed on the inner mitochondrial membrane (IMM), plays a role in transporting compounds, including amino acids, fatty acids, and nucleotides during metabolism. (Kunji et al., 2020; Ruprecht and Kunji, 2020). Therefore, the SLC25 carrier superfamily is closely related to various biological pathways including metabolite trafficking, signal transmission, and substance metabolism. (Chen et al., 2022). Several studies have reported the role of SLC25 in pathophysiological conditions as well as disease progression and showed that it was associated with abnormal tumor metabolism. (Ruprecht and Kunji, 2020). SLC25A4 encodes a protein also known as adenine nucleotide translocator 1 (ANT1), that participates in ATP/ADP exchange on the IMM. (Klingenberg, 2008; Lu et al., 2017; Zhang et al., 2017). Bertholet et al reported that ANT was a key protein required for mitophagy in several cell types and showed that ANT played a novel function as an essential mediator of mitophagy in normal and disease conditions. (Hoshino et al., 2019). Mitochondrial permeability transition pore (mPTP), a structure formed in the IMM, is thought to be the basis for regulating apoptosis, and ANT has been found to be a pore-forming component of mPTP. (Bround et al., 2020). It has been reported that the expression of ANT1 is associated with several apoptotic processes, including caspase activation, mitochondrial membrane potential collapse, phenotypic alteration, DNA degradation, and other features of apoptosis. (Bauer et al., 1999). ANT is a multifunctional protein that plays a key role in several processes, including tumorigenesis, participates in tumor anabolism, controls oxidative phosphorylation and glycolytic homeostasis, and regulates cell death. (Zhao et al., 2021). For instance, Jang et al revealed that ANT1 overexpression induced apoptosis in breast cancer cells and strongly suppressed tumor development both in vitro and in vivo, suggesting that ANT1 might be an effective target for breast cancer treatment. (Jang et al., 2008). Some chemotherapeutic drugs, including lonidamine (LND), can directly or indirectly stimulate ANT and affect the opening of mPTP, thereby inducing tumor cell death. (Decaudin et al., 1998; Abdel-Wahab et al., 2019). LND possesses anti-cancer effects; however, clinical trials showed the presence of significant toxic side effects. (Wang et al., 2023). ANT can regulate energy metabolism by converting its c-state to m-state to complete the ADP/ATP cycle. (Ruprecht et al., 2019). When ANT is in the c-state, ADP is transported from the cytoplasm to the mitochondrial matrix along with the transport of inorganic phosphate (Pi) and H+. On the other hand, when ANT is in the m-state, ATP is transported from the mitochondrial matrix to the cytoplasm. (Springett et al., 2017). ANT is a potentially robust target for drug development; however, it should be noted that different subtypes of ANT play different roles in cancer. (Zhang et al., 2018). For example, ANT1 and ANT3 accelerate tumor cell apoptosis, while ANT2 and ANT4 inhibit apoptosis. (Li et al., 2020). Therefore, ANT1 might also be considered a promising target to study novel anticancer agents and might be a novel biomarker for tumor diagnosis and intervention. (Rochette et al., 2020).
Comprehensive bioinformatics analysis showed that the expression of SLC25A4 was markedly downregulated in both OS tissues and OS cell lines, and the decrease in its profile was closely associated with worse OS patient prognosis. Furthermore, cell function assays revealed that increased expression of SLC25A4 significantly reduced OS cell proliferation, migration, and invasion, while enhancing apoptosis, indicating that SLC25A4 was involved in tumorigenesis, tumor progression, and metastasis. Therefore, SLC25A4 might be a potential key gene for OS and provide a new target for its treatment, thereby contributing to OS diagnosis, treatment, and patient prognosis.
However, the present study has several limitations. First, due to limitations in surgical indications for OS patients and continuous improvements in chemotherapy regimens, the number of samples collected for RNA sequencing was relatively small. Second, the role and function of SLC25A4 were studied in vitro, and in vivo investigations involving SLC25A4 are thus needed. Finally, the specific pathways and regulatory mechanisms associated with SLC25A4 in OS still require further investigation.
In conclusion, this study revealed that the expression of SLC25A4 was significantly downregulated in patients with OS and was strongly associated with prognosis. We also revealed that the prognosis of patients with enhanced SLC25A4 expression was superior to that of patients with reduced SLC25A4 expression. Low SLC25A4 expression significantly promoted OS cell proliferation, migration, and invasion, and inhibited apoptosis, thus participating in OS development. The study suggested that SLC25A4 might be a therapeutic target for predicting OS patient prognosis, and whether it contributes to OS diagnosis, treatment, and prognosis still requires further investigation.
Publicly available datasets were analyzed in this study. This data can be found here: STRING database (https://cn.string-db.org/), TCGA database (https://www.cancer.gov/ccg/research/genome-sequencing/tcga), EGA database (https://ega-archive.org/?lang=zh), HPA database (https://www.proteinatlas.org/), cBioPortal for Cancer Genomics (http://cbioportal.org), GEO database (https://www.ncbi.nlm.nih.gov/geo/), accession number GSE238110. The raw data supporting the conclusions of this article will be made available by the authors, without undue reservation.
The studies involving humans were approved by the Qilu Hospital of Shandong University (KYLL-2019(KS)-076). The studies were conducted in accordance with the local legislation and institutional requirements. The participants provided their written informed consent to participate in this study.
YZ: Validation, Writing–original draft. YW: Writing–original draft, Formal Analysis, Data curation. WZ: Writing–original draft, Methodology, Investigation. SF: Project administration, Supervision, Writing–original draft. YX: Formal Analysis, Writing–original draft. TW: Writing–original draft, Investigation. NH: Writing–original draft, Software. KL: Project administration, Writing–original draft. AZ: Writing–review and editing, Funding acquisition.
The author(s) declare that financial support was received for the research, authorship, and/or publication of this article. Funding for this research was provided by Key Research and Development Program of Shandong Province (grant no. 2019GSF108060), Shandong Provincial Natural Science Foundation (grant no. ZR202010220039) and Jinan Municipal Health Commission Science and Technology Plan Project (2023-1-8).
Our sincerest gratitude to all participants of this study.
The authors declare that the research was conducted in the absence of any commercial or financial relationships that could be construed as a potential conflict of interest.
All claims expressed in this article are solely those of the authors and do not necessarily represent those of their affiliated organizations, or those of the publisher, the editors and the reviewers. Any product that may be evaluated in this article, or claim that may be made by its manufacturer, is not guaranteed or endorsed by the publisher.
The Supplementary Material for this article can be found online at: https://www.frontiersin.org/articles/10.3389/fgene.2024.1410145/full#supplementary-material
Abdel-Wahab, A. F., Mahmoud, W., and Al-Harizy, R. M. (2019). Targeting glucose metabolism to suppress cancer progression: prospective of anti-glycolytic cancer therapy. Pharmacol. Res. 150, 104511. doi:10.1016/j.phrs.2019.104511
Bai, M., Wu, L., Zhao, M., Jin, P., Liu, J., Wang, W., et al. (2023). Integrated analysis of EGFR mutated non-small cell lung cancer reveals two distinct molecular subtypes. Clin. Transl. Med. 13 (10), e1431. doi:10.1002/ctm2.1431
Bauer, M. K., Schubert, A., Rocks, O., and Grimm, S. (1999). Adenine nucleotide translocase-1, a component of the permeability transition pore, can dominantly induce apoptosis. J. Cell. Biol. 147 (7), 1493–1502. doi:10.1083/jcb.147.7.1493
Beird, H. C., Bielack, S. S., Flanagan, A. M., Gill, J., Heymann, D., Janeway, K. A., et al. (2022). Osteosarcoma. Nat. Rev. Dis. Prim. 8 (1), 77. doi:10.1038/s41572-022-00409-y
Bround, M. J., Bers, D. M., and Molkentin, J. D. (2020). A 20/20 view of ANT function in mitochondrial biology and necrotic cell death. J. Mol. Cell. Cardiol. 144, A3-A13–a13. doi:10.1016/j.yjmcc.2020.05.012
Brown, J. M., and Attardi, L. D. (2005). The role of apoptosis in cancer development and treatment response. Nat. Rev. Cancer 5 (3), 231–237. doi:10.1038/nrc1560
Chen, Y. J., Hong, W. F., Liu, M. L., Guo, X., Yu, Y. Y., Cui, Y. H., et al. (2022). An integrated bioinformatic investigation of mitochondrial solute carrier family 25 (SLC25) in colon cancer followed by preliminary validation of member 5 (SLC25A5) in tumorigenesis. Cell. death Dis. 13 (3), 237. doi:10.1038/s41419-022-04692-1
Cimadamore-Werthein, C., Jaiquel Baron, S., King, M. S., Springett, R., and Kunji, E. R. (2023). Human mitochondrial ADP/ATP carrier SLC25A4 operates with a ping-pong kinetic mechanism. EMBO Rep. 24 (8), e57127. doi:10.15252/embr.202357127
Colli, A., Nadarevic, T., Miletic, D., Giljaca, V., Fraquelli, M., Štimac, D., et al. (2021). Abdominal ultrasound and alpha-foetoprotein for the diagnosis of hepatocellular carcinoma in adults with chronic liver disease. Cochrane Database Syst. Rev. 4 (4), Cd013346. doi:10.1002/14651858.CD013346.pub2
Decaudin, D., Marzo, I., Brenner, C., and Kroemer, G. (1998). Mitochondria in chemotherapy-induced apoptosis: a prospective novel target of cancer therapy (review). Int. J. Oncol. 12 (1), 141–152. doi:10.3892/ijo.12.1.141
Heng, C., Zheng, X., Hui, J., Ma, X., and Fan, D. (2024). Neodymium and manganese ions co-doped whitlockite for temperature monitoring, photothermal therapy, and bone tissue repair in osteosarcoma. J. colloid interface Sci. 653 (Pt B), 1488–1503. doi:10.1016/j.jcis.2023.09.186
Hoshino, A., Wang, W. J., Wada, S., McDermott-Roe, C., Evans, C. S., Gosis, B., et al. (2019). The ADP/ATP translocase drives mitophagy independent of nucleotide exchange. Nature 575 (7782), 375–379. doi:10.1038/s41586-019-1667-4
Hou, H., Xu, Y., Xie, M., and Chen, R. (2023). Exploring the potential molecular mechanism of trastuzumab-induced cardiotoxicity based on RNA sequencing and bioinformatics analysis. Biochem. Pharmacol. 208, 115388. doi:10.1016/j.bcp.2022.115388
Jang, J. Y., Choi, Y., Jeon, Y. K., Aung, K. C., and Kim, C. W. (2008). Over-expression of adenine nucleotide translocase 1 (ANT1) induces apoptosis and tumor regression in vivo. BMC Cancer 8, 160. doi:10.1186/1471-2407-8-160
Ji, R., Wang, Y., Pan, D., Han, J., Wang, Y., Zheng, S., et al. (2024). NUCB2 inhibition antagonizes osteosarcoma progression and promotes anti-tumor immunity through inactivating NUCKS1/CXCL8 axis. Cancer Lett. 591, 216893. doi:10.1016/j.canlet.2024.216893
Kansara, M., Teng, M. W., Smyth, M. J., and Thomas, D. M. (2014). Translational biology of osteosarcoma. Nat. Rev. Cancer 14 (11), 722–735. doi:10.1038/nrc3838
Klingenberg, M. (2008). The ADP and ATP transport in mitochondria and its carrier. Biochim. Biophys. Acta 1778 (10), 1978–2021. doi:10.1016/j.bbamem.2008.04.011
Kunji, E. R. S., King, M. S., Ruprecht, J. J., and Thangaratnarajah, C. (2020). The SLC25 carrier family: important transport proteins in mitochondrial physiology and pathology. Physiol. (Bethesda, Md) 35 (5), 302–327. doi:10.1152/physiol.00009.2020
Kunji, E. R. S., and Ruprecht, J. J. (2020). The mitochondrial ADP/ATP carrier exists and functions as a monomer. Biochem. Soc. Trans. 48 (4), 1419–1432. doi:10.1042/BST20190933
Li, T., Li, Y., Liu, T., Hu, B., Li, J., Liu, C., et al. (2020). Mitochondrial PAK6 inhibits prostate cancer cell apoptosis via the PAK6-SIRT4-ANT2 complex. Theranostics 10 (6), 2571–2586. doi:10.7150/thno.42874
Lillo Osuna, M. A., Garcia-Lopez, J., El Ayachi, I., Fatima, I., Khalid, A. B., Kumpati, J., et al. (2019). Activation of estrogen receptor alpha by decitabine inhibits osteosarcoma growth and metastasis. Cancer Res. 79 (6), 1054–1068. doi:10.1158/0008-5472.CAN-18-1255
Lin, Y. H., Jewell, B. E., Gingold, J., Lu, L., Zhao, R., Wang, L. L., et al. (2017). Osteosarcoma: molecular pathogenesis and iPSC modeling. Trends Mol. Med. 23 (8), 737–755. doi:10.1016/j.molmed.2017.06.004
Liu, L., Chen, X., Wu, L., Huang, K., Wang, Z., Zheng, Y., et al. (2024). Ubiquitin ligase subunit FBXO9 inhibits V-ATPase assembly and impedes lung cancer metastasis. Exp. Hematol. Oncol. 13 (1), 32. doi:10.1186/s40164-024-00497-4
Lu, Y. W., Acoba, M. G., Selvaraju, K., Huang, T. C., Nirujogi, R. S., Sathe, G., et al. (2017). Human adenine nucleotide translocases physically and functionally interact with respirasomes. Mol. Biol. Cell. 28 (11), 1489–1506. doi:10.1091/mbc.E17-03-0195
Newhook, T. E., Vreeland, T. J., Griffin, J. F., Tidwell, R. S. S., Prakash, L. R., Koay, E. J., et al. (2023). Prognosis associated with CA19-9 response dynamics and normalization during neoadjuvant therapy in resected pancreatic adenocarcinoma. Ann. Surg. 277 (3), 484–490. doi:10.1097/SLA.0000000000005184
Pomella, S., Cassandri, M., Melaiu, O., Marampon, F., Gargari, M., Campanella, V., et al. (2023). DNA damage response gene signature as potential treatment markers for oral squamous cell carcinoma. Int. J. Mol. Sci. 24 (3), 2673. doi:10.3390/ijms24032673
Rochette, L., Meloux, A., Zeller, M., Malka, G., Cottin, Y., and Vergely, C. (2020). Mitochondrial SLC25 carriers: novel targets for cancer therapy. Molecules 25 (10), 2417. doi:10.3390/molecules25102417
Ruprecht, J. J., King, M. S., Zögg, T., Aleksandrova, A. A., Pardon, E., Crichton, P. G., et al. (2019). The molecular mechanism of transport by the mitochondrial ADP/ATP carrier. Cell. 176 (3), 435–447. doi:10.1016/j.cell.2018.11.025
Ruprecht, J. J., and Kunji, E. R. S. (2020). The SLC25 mitochondrial carrier family: structure and mechanism. Trends Biochem. Sci. 45 (3), 244–258. doi:10.1016/j.tibs.2019.11.001
Springett, R., King, M. S., Crichton, P. G., and Kunji, E. R. S. (2017). Modelling the free energy profile of the mitochondrial ADP/ATP carrier. Biochim. Biophys. Acta Bioenerg. 1858 (11), 906–914. doi:10.1016/j.bbabio.2017.05.006
Subramanian, A., Tamayo, P., Mootha, V. K., Mukherjee, S., Ebert, B. L., Gillette, M. A., et al. (2005). Gene set enrichment analysis: a knowledge-based approach for interpreting genome-wide expression profiles. Proc. Natl. Acad. Sci. U. S. A. 102 (43), 15545–15550. doi:10.1073/pnas.0506580102
Tian, Q., Guo, Y., Feng, S., Liu, C., He, P., Wang, J., et al. (2022). Inhibition of CCR2 attenuates neuroinflammation and neuronal apoptosis after subarachnoid hemorrhage through the PI3K/Akt pathway. J. Neuroinflammation 19 (1), 312. doi:10.1186/s12974-022-02676-8
Vial, J., Huchedé, P., Fagault, S., Basset, F., Rossi, M., Geoffray, J., et al. (2020). Low expression of ANT1 confers oncogenic properties to rhabdomyosarcoma tumor cells by modulating metabolism and death pathways. Cell. Death Discov. 6, 64. doi:10.1038/s41420-020-00302-1
Villani, A., Shore, A., Wasserman, J. D., Stephens, D., Kim, R. H., Druker, H., et al. (2016). Biochemical and imaging surveillance in germline TP53 mutation carriers with Li-Fraumeni syndrome: 11 year follow-up of a prospective observational study. Lancet Oncol. 17 (9), 1295–1305. doi:10.1016/S1470-2045(16)30249-2
Wang, Y., Tian, X., Zhang, W., Zhang, Z., Lazcano, R., Hingorani, P., et al. (2022). Comprehensive surfaceome profiling to identify and validate novel cell-surface targets in osteosarcoma. Mol. Cancer Ther. 21 (6), 903–913. doi:10.1158/1535-7163.MCT-21-0836
Wang, Z., Qin, Y., Wang, X., Zhang, T., Hu, Y., Wang, D., et al. (2023). Glutathione programmed mitochondria targeted delivery of lonidamine for effective against triple negative breast cancer. Int. J. nanomedicine 18, 4023–4042. doi:10.2147/IJN.S413217
Wu, L., Cheng, B., Sun, X., Zhang, Z., Kang, J., Chen, Y., et al. (2024). Induction immunochemotherapy followed by definitive chemoradiotherapy for unresectable locally advanced non-small cell lung cancer: a multi-institutional retrospective cohort study. MedComm 5 (3), e501. doi:10.1002/mco2.501
Zarghooni, K., Bratke, G., Landgraf, P., Simon, T., Maintz, D., and Eysel, P. (2023). The diagnosis and treatment of osteosarcoma and ewing's sarcoma in children and adolescents. Dtsch. Arzteblatt Int. 120 (24), 405–412. doi:10.3238/arztebl.m2023.0079
Zhang, C., Jiang, H., Wang, P., Liu, H., and Sun, X. (2017). Transcription factor NF-kappa B represses ANT1 transcription and leads to mitochondrial dysfunctions. Sci. Rep. 7, 44708. doi:10.1038/srep44708
Zhang, R., Li, G., Zhang, Q., Tang, Q., Huang, J., Hu, C., et al. (2018). Hirsutine induces mPTP-dependent apoptosis through ROCK1/PTEN/PI3K/GSK3β pathway in human lung cancer cells. Cell. Death Dis. 9 (6), 598. doi:10.1038/s41419-018-0641-7
Zhang, W., Yang, Y., Lin, L., He, J., Dong, J., Yan, B., et al. (2022). Comprehensive characterization of ubiquitinome of human colorectal cancer and identification of potential survival-related ubiquitination. J. Transl. Med. 20 (1), 445. doi:10.1186/s12967-022-03645-8
Keywords: osteosarcoma, bioinformatics analysis, SLC25A4, prognosis, survival analysis
Citation: Zhang Y, Wang Y, Zhang W, Feng S, Xing Y, Wang T, Huang N, Li K and Zhang A (2024) Comprehensive transcriptomic analysis identifies SLC25A4 as a key predictor of prognosis in osteosarcoma. Front. Genet. 15:1410145. doi: 10.3389/fgene.2024.1410145
Received: 31 March 2024; Accepted: 28 May 2024;
Published: 18 June 2024.
Edited by:
Leilei Wu, Tongji University, ChinaReviewed by:
Chenan Liu, Capital Medical University, ChinaCopyright © 2024 Zhang, Wang, Zhang, Feng, Xing, Wang, Huang, Li and Zhang. This is an open-access article distributed under the terms of the Creative Commons Attribution License (CC BY). The use, distribution or reproduction in other forums is permitted, provided the original author(s) and the copyright owner(s) are credited and that the original publication in this journal is cited, in accordance with accepted academic practice. No use, distribution or reproduction is permitted which does not comply with these terms.
*Correspondence: Ka Li, b3N0ZW9sa0AxNjMuY29t; Aijun Zhang, emhhbmdhaWp1bkBzZHUuZWR1LmNu
†These authors have contributed equally to this work and share first authorship
Disclaimer: All claims expressed in this article are solely those of the authors and do not necessarily represent those of their affiliated organizations, or those of the publisher, the editors and the reviewers. Any product that may be evaluated in this article or claim that may be made by its manufacturer is not guaranteed or endorsed by the publisher.
Research integrity at Frontiers
Learn more about the work of our research integrity team to safeguard the quality of each article we publish.