 Qian Liu
 Ze Lin2†
 Daqi Huang
 Yipeng Fang
 Xin Zhang
 Tao Hao
94% of researchers rate our articles as excellent or good
Learn more about the work of our research integrity team to safeguard the quality of each article we publish.
Find out more
ORIGINAL RESEARCH article
Front. Genet. , 30 July 2024
Sec. RNA
Volume 15 - 2024 | https://doi.org/10.3389/fgene.2024.1365232
Ferroptosis has been observed to play an important role during erythrocyte differentiation (ED). However, the biological gene markers and ferroptosis mechanisms in ED remain unknown. We downloaded the datasets of ED in human umbilical cord blood-derived CD34+ cells from the Gene Expression Omnibus database. Using median differentiation time, the sample was categorized into long and short groups. The differentially expressed ferroptosis-related genes (DE-FRGs) were screened using differential expression analysis. The enrichment analyses and a protein–protein interaction (PPI) network were conducted. To predict the ED stage, a logistic regression model was constructed using the least absolute shrinkage and selection operator (LASSO). Overall, 22 DE-FRGs were identified. Ferroptosis-related pathways were enriched using Gene Ontology and the Kyoto Encyclopedia of Genes and Genomes. Gene Set Enrichment Analysis and Gene Set Variation Analysis revealed the primary involvement of DE-FRGs in JAK-STAT, MAPK, PI3K-AKT-mTORC1, WNT, and NOTCH signaling pathways. Ten-hub DE-FRGs were obtained using PPI analysis. Furthermore, we constructed mRNA-microRNA (miRNA) and mRNA-transcription factor networks. Immune cell infiltration levels differed significantly during ED. LASSO regression analysis established a signature using six DE-FRGs (ATF3, CDH2, CHAC1, DDR2, DPP4, and GDF15) related to the ED stage. Bioinformatic analyses identified ferroptosis-associated genes during ED, which were further validated. Overall, we identified ferroptosis-related genes to predict their correlations in ED. Exploring the underlying mechanisms of ferroptosis may help us better understand pathophysiological changes in ED and provide new evidence for clinical transformation.
Erythropoiesis is a complex, tightly regulated process. Altered erythroid production leads to various types of anemia and hemoglobin disorders including thalassemia syndrome, inherited bone marrow failure, chronic anemia, polycythemia vera, and sickle cell anemia (Zhang Y. et al., 2022). Billions of people are affected by various erythrocyte-related diseases worldwide, posing a significant public health challenge (Srivastava et al., 2022). Erythrocyte transfusion is indispensable and irreplaceable not only for patients with anemia and hemoglobin disorders, but also for modern medical practices, such as cancer treatment and surgery (Lee et al., 2023). However, the whole process, from blood collection to clinical use, consumes a significant amount of resources, and there are many problems to solve, such as the spread of pathogenic microorganisms, the cost of the whole process, and approximately 118.5 million units of blood collected globally each year, which are insufficient to meet the annual global demand of over 300 million units for blood transfusions (Christaki et al., 2019). An aging population and emerging risks of viruses and pathogens exacerbate the problem of supply shortages. The development of alternative blood transfusion products helps mitigate erythrocyte shortages and transfusion limitations. Each unit of transfused blood contains a trillion erythrocytes. However, obtaining such large quantities of erythrocytes in vitro involve overcoming several challenges. The bottleneck of low adult β-hemoglobin expression and nucleation efficiency remains to be resolved. The regulatory mechanism during erythroid differentiation will help to further study and ultimately identify the molecular pathways involved in the pathological process of erythroid diseases and provide great promise for transfusion medicine and novel cell-based therapies.
Developing erythroid precursors absorb exceptionally large amounts of iron to accommodate increased synthesis of heme (Ryu et al., 2017; Philpott, 2020). Iron could be released from ferritin, where most of the cellular iron is stored through a process known as “ferritinophagy” (Dowdle et al., 2014; Mancias et al., 2014). Ferritinophagy is an important step for iron release before mitochondrial iron import and heme biosynthesis (Nilsson et al., 2009; Mancias et al., 2015). Ferritinophagy initiates ferroptosis by promoting iron accumulation. Ferroptosis is an active mode of cell death, defined as catalytic Fe(II)-dependent regulated necrosis accompanied by lipid peroxidation (Toyokuni et al., 2023). Ferroptosis involves embryonic hematopoiesis, particularly erythropoiesis in rats (Zheng et al., 2021). Ferroptosis is observed in the extraembryonic endodermal component of the visceral yolk sac, which induces blood precursors, and in embryonally nucleated erythrocytes that, disappear in enucleated erythrocytes (Zheng et al., 2021). Ferroptosis inhibitors significantly delay erythrocyte enucleation. Additionally, ferroptosis may mediate B-cells differentiation (Chen et al., 2022). Abnormal ferroptosis damages the development erythrocytes, leading to erythropoiesis suppression and anemia (Chen et al., 2022). Ferroptosis has new therapeutic potential for blood cell-related diseases. In many patients with heart failure, inflammation, and oxidative stress lead to an iron-deficient state, which can limit erythropoiesis in erythroid precursors (Packer, 2022). Increasing the levels of cytosolic Fe (2+) available to the mitochondria enables the synthesis of heme from erythroid precursors (Packer, 2022). However, the genes significantly related to ferroptosis in erythropoiesis are unknown, and whether ferroptosis genes can be used as biomarkers to discriminate between early and late differentiation is yet to been reported.
CD34+ cells isolated from umbilical cord blood (UCB) serve as a valuable model system to study gene regulation of erythropoiesis. This study obtained data on the erythrocyte differentiation (ED) of human umbilical cord blood-derived CD34+ cells from the Gene Expression Omnibus (GEO) database for bioinformatic analysis to screeng differentially expressed genes (DEGs) between early and late differentiation. Subsequently, the differentially expressed ferroptosis-related genes (DE-FRGs) were acquired. Their ability to diagnose the differentiation stage, biological functions, and regulatory networks was analyzed. We also identified hub genes and predicted their association with immune cell infiltration. Our findings explain the potential role of ferroptosis in erythropoiesis and may provide new directions for treating of erythrocyte-related diseases.
Expression profile data associated with ED were obtained from the GEO database (Barrett et al., 2013). ED-related datasets were retrieved using the following keywords: “umbilical cord blood CD34+ cells” and “Homo sapiens.” Our study comprised data from 46 data from UCB-CD34+ cell-derived erythroid progenitors at different time points of differentiation. We downloaded the (ED)-related datasets GSE49438 (a total of 12 samples harvested on day 21, 42, 49, and 56) (Li B. et al., 2014), GSE118537 (a total of 28 samples harvested on day 0, 2, 4, 6, 7.5, 8, 8.5, 10, 10.5, 11, 11.5, 12, 14, and 16) (Gillespie et al., 2020) and GSE156306 (a total of 6 samples harvested on day 8, 10, and 12) (Guo et al., 2020) using the R package GEOquery (Davis and Meltzer, 2007). The details of the database are presented in Table 1.
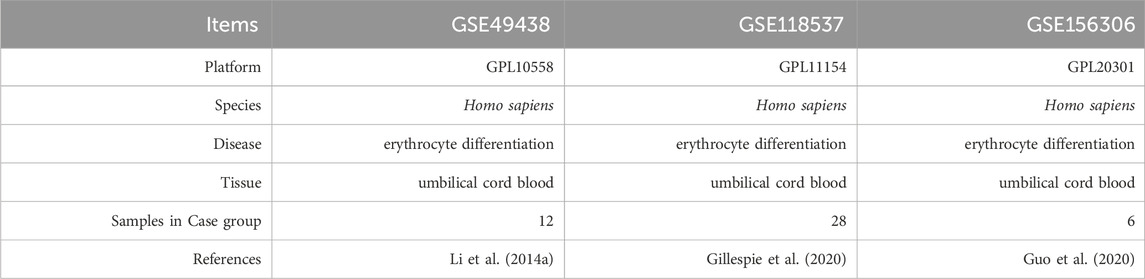
Table 1. List of dataset information.
Additionally, 753 ferroptosis-related genes (FRGs) were obtained by combining and deduplicating genes from the GeneCards (Stelzer et al., 2016), Molecular Signatures Database (MSigDB) (Liberzon et al., 2015) and FerrDb online databases (Zhou and Bao, 2020).
We used R package sva (Leek et al., 2012) to de-batch the three datasets and obtained the integrated GEO dataset as an ED-dataset (Supplementary Figure S1). ED can be categorized into the early proliferation and late differentiation stages. Based on the median cultivation time (11 days) of the ED dataset, we divided the group into long cultivation time (long) and short cultivation time (short) groups for difference analysis. According to the three literatures, most cells in the short and long groups were in the proliferation and differentiation stages, respectively. The linear model for microarray data (limma) package was used to identify DEGs between samples from long group and those from those from short group. The p-value correction method used was BH procedure. The screening thresholds for DEGs are |log2FoldChange (logFC)| >1.5 and adjusted p < 0.05 and presented as a volcano map drawn using the R package ggplot2. The upregulated DEGswith log2FC > 1.5 and adjusted p < 0.05 and the downregulated DEGs as genes with log2FC < −1.5 and adjusted p < 0.05 were intersected with FRGs and presented as Venn diagram, respectively. The DEG results were obtained using volcano plots and heat maps drawn with the R package ggplot2 and pheatmap, respectively. DE-FRGs were identified by intersecting the DEGs and FRGs. We used the R package RCircos (version 1.2.2) (Zhang et al., 2013) to draw a chromosome localization map and observe the distribution positions of the screened DE-FRGs on human chromosomes. The DE-FRG expression in the ED dataset was displayed as a heatmap drawn using the R package pheatmap.
GO and KEGG enrichment analyses were conducted using the R package clusterProfiler (Version 4.10.0) and R package GOplot (Version: 1.0.2), respectively (Yu et al., 2012). The threshold was set as p < 0.05, the false discovery rate (FDR) value (q.Value) was <0.25. Combined with the log2FC values, enrichment analyses were performed by calculating Z-scores using the R package GOplot.20.
We retrieved the gene set “c2.cp.v7.2. symbols” in theMSigDB. We conducted enrichment analysis on all genes within the long and short groups of the ED-dataset using the R package cluster Profiler. The parameters were as follows: the seed was 2020, the number of calculations was 10,000, and each gene set contained at least five genes, and at most 500 genes, and the screening criteria for significant enrichment were p < 0.05 and FDR value (q.Value) < 0.25.
We obtained the gene set “H.A.v7.4. Symbols.gmt” from the MSigDB database for GSVA and investigated the variation in biological processes between the long and short groups of the ED dataset. Statistical significance for enrichment was set at p < 0.05.
The STRING database was used to construct a PPI network associated with DE-FRGs (with a minimum required interaction score of 0.400). The PPI network model was visualized using the Cytoscape software (version 3.9.1). The GeneMANIA website was used to predict the functional similarity of the selected DE-FRGs and construct an interaction network. ENCORI and CHIPBase databases (Li J. H. et al., 2014) (version 3.0) (https://rna.sysu.edu.cn/chipbase/database) predicted that the miRNAs supported more than three databases and TF supported more than 6 document interaction with DE-FRGs, respectively. Subsequently, the Cytoscape software was used to visualize the interaction between mRNA-miRNAs and mRNA-TF.
Cluster analysis based on DE-FRGs was performed using Consensus Cluster Plus (Wilkerson and Hayes, 2010) with the standard (the number of clusters was set between two and eight, and 80% of the total samples were extracted by repeating 1,000 times = “km,” distance = “euclidean”).
Based on the expression of FRGs in the dataset, the FRGs score of each sample was obtained using the ssGSEA algorithm to represent the FRGs expression level of the sample. The group was then divided into high and low FRGs scores bounded by the median FRGs score.
Based on the median FRGs of the samples, the gene set was divided into high and low FRG score groups for the gene correlation analysis. The difference in infiltration abundance of immune cells between groups with high and low FRG scores in the ED dataset of 28 immune cell types is demonstrated using a boxplot plot, and the correlation between immune cells and FRGs is shown through correlation heat map and correlation scatter plot.
CIBERSORTx is a deconvolution of the transcriptome expression matrix that is used to estimate the composition and abundance of immune cells among mixed cells. The gene expression matrix data were grouped and uploaded to the CIBERSORTx website. Combined with the LM22 characteristic gene matrix, immune cell infiltration matrix data were obtained and displayed in stacked bar charts. Subsequently, we combined the gene expression matrix to calculate the correlation between immune cells and DE-FRGs and drew a correlation heat map using the R package pheatmap. The correlation between immune cells and FRGs was determined using Spearman’s rank correlation coefficient and visualized using the R package ggplot2.
To obtain an ED diagnostic model for FRGs, we used 10x cross-validation on the ED-dataset with a seed number of 123, performed LASSO regression, and ran 1,000 cycles to prevent overfitting (Zhang et al., 2023). Subsequently, we analyzed the DE-FRGs in the LASSO diagnostic model using a univariate logistic model. DE-FRGs meeting the threshold (p < 0.10) were identified using a multivariate logistic model. A nomogram was drawn using RMS to show the relationship between DE-FRGs in the diagnostic model based on the results of the multi-factor logistic model. Finally, we drew a calibration curve using calibration analysis to evaluate the accuracy and resolution of the logistic model based on the DE-FRGs.
One million CD34+ cells from 100 mL of human umbilical cord blood were purified using anti-CD34 antibodies linked to magnetic microbeads. Subsequently, primary human CD34+ hematopoietic progenitor cells were differentiated ex vivo in IMDM (Thermo Fisher Scientific, Waltham, Massachusetts) containing 20% knockout serum replacement and 2 mM GlutaMAX (Thermo Fisher Scientific), 25 μg/mL insulin, 150 μg/mL transferrin, 40 μg/mL inositol, 10 μg/mL folic acid, 90 ng/mL ferric nitrate, 900 ng/mL ferrous sulfate, and 160 μM monothioglycerol (all from Sigma-Aldrich, St. Louis, Missouri). From induction day 0 to day 8, the cells were cultured in medium supplemented with 1 nM dexamethasone (Sigma-Aldrich), 10 ng/mL IL-3,100 ng/mL stem cell factor (both from Peprotech, Rocky Hill, New Jersey), and 3 U/mL erythropoietin (Epo, R&D Systems, Minneapolis, Minnesota). From induction day 8–14, expanded erythroblasts were cultured in the presence of 3 U/mL Epo and 100 ng/mL stem cell factor. From day 14, the erythroblasts were cultured in the presence of 3 U/mL Epo.
From days 8–12, the major population of the cells was in the proliferation stage, while from day 16, the major population of the cells was in the differentiation stage. Cells were separately harvested after 8, 12, and 16 days of differentiation for RNA isolation and qRT-PCR analysis. RNA extraction, cDNA synthesis, and qPCR were performed as previously described (Liu et al., 2020). The comparing relative fold expression differences of each gene were normalized to the expression of day 8 by the method of 2−ΔΔCt. The primer sequences are listed in Supplementary Table S1.
All data processing and statistical analyses were performed using the R software Version 4.1.2 (The R Foundation for Statistical Computing, Vienna, Austria). Continuous variables were compared using Wilcoxon rank-sum test. One-way analysis of variance followed by Dunnett’s multiple comparison test was used to compare means among the different groups. A ROC curve was generated to assess the model performance. Correlations were calculated using Spearman correlation analysis. A two-sided p < 0.05 was considered statistically significant.
The workflow chart of this study is shown in Figure 1. A differential study of long and short samples revealed 782 DEGs, of which 481 and 301 were upregulated and down-regulated in long samples, respectively (Figure 2A). The intersections of DEGs and FRGs yielded 25 DE-FRGs, of which 18 and 7 were up-regulated (Figure 2B) and downregulated in long samples (Figure 2C), respectively. The grouping comparison diagram (Figure 2D) shows that 22 of the 25 DE-FRGs were statistically significant (p < 0.05). The positions of these 22 DE-FRGs on the human chromosomes were used to draw a chromosomal localization map (Figure 2E). These 22 FRGs were mainly distributed on chromosomes 1 and 2. ATF3, DDR2 and MAP1LC3C are located on chromosome 1, DPP4, EFEMP1, GALNT14, IL1B and MYCN are located on chromosome 2, and there are only 0–2 FRGs distributed on other chromosomes.
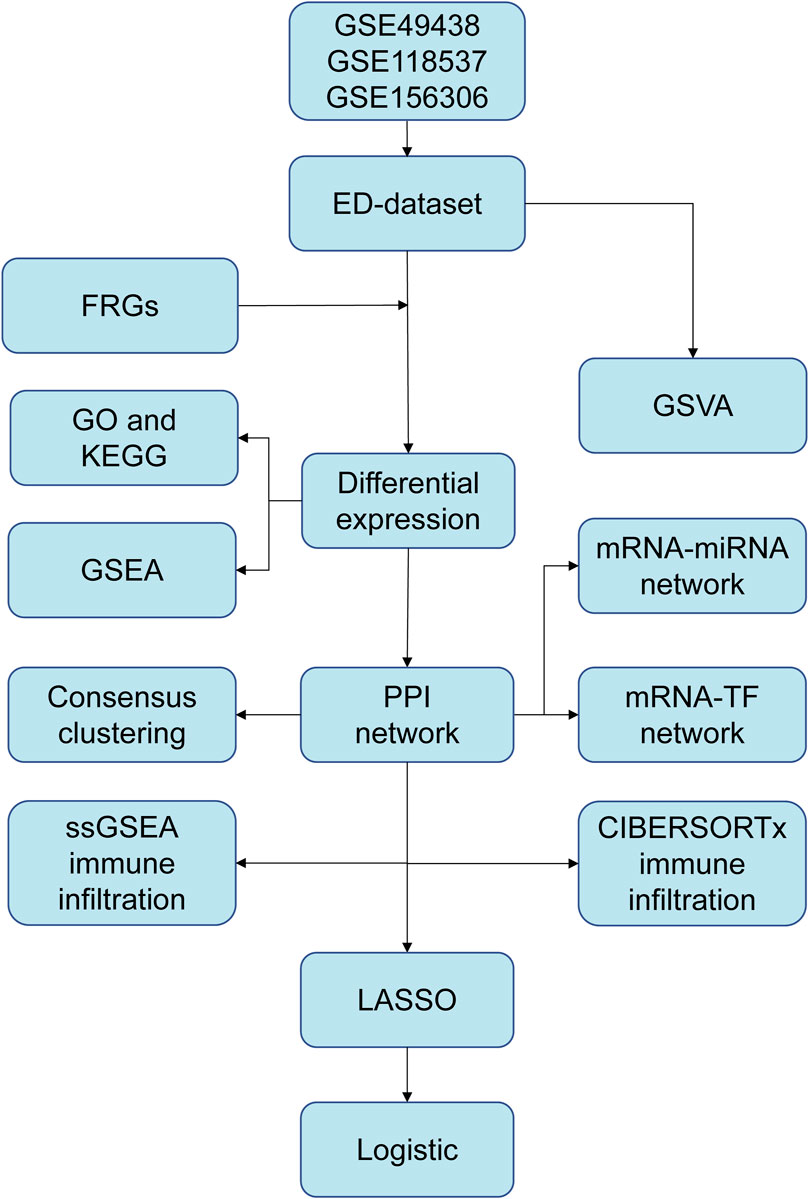
Figure 1. The flow chart of data preparation, processing, and analysis. ED, erythrocyte differentiation. FRGs, ferroptosis-related genes. GO, Gene Ontology. KEGG, Kyoto Encyclopedia of Genes and Genomes. GSVA, Gene Set Variation Analysis. GSEA, Gene Set Enrichment Analysis. PPI, Protein-protein interaction. TF, transcription factor. ssGSEA, single-sample gene set enrichment analysis. LASSO, least absolute shrinkage and selection operator.
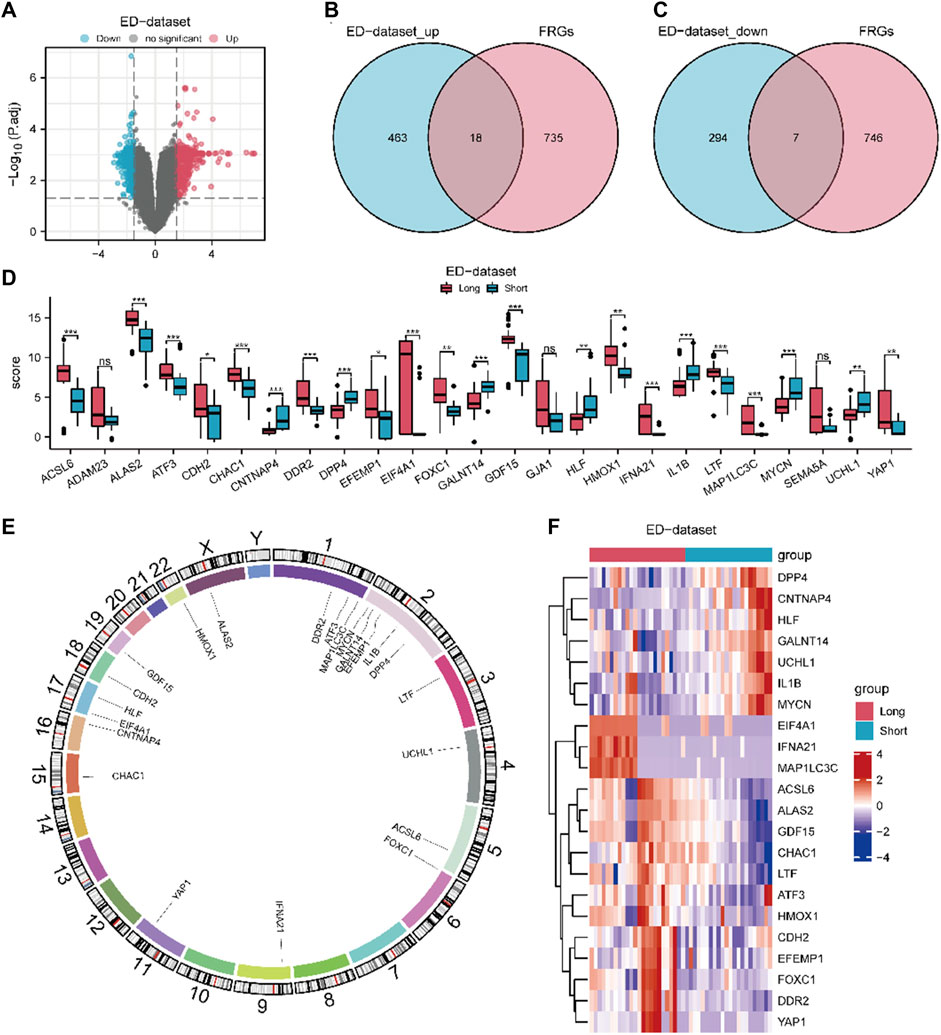
Figure 2. Expression differences of FRGs in ED datasets. (A) Volcano map of DEGs between long and short group. The DE-FRGs were obtained after intersecting the up-regulated (B) and down-regulated (C) DEGs with FRGs. (D) Grouping comparison diagram of DE-FRGs in ED-dataset. (E) Chromosome mapping of DE-FRGs. (F) Heat map of 22 DE-FRGs in ED-dataset. The comparison between two grous is performed using the Wilcoxon rank sum test. The comparison is performed using the Wilcoxon rank sum test. *P adj < 0.05, and **P adj< 0.01, ***P adj < 0.001, DEGs, differentially expressed genes. FRGs, ferroptosis-related genes. DE-FRGs, differentially expressed ferroptosis related to genes. ED, erythrocyte differentiation.
A heat map (Figure 2F) shows the expression of the 22 DE-FRGs in ED-dataset. To determine the diagnostic value of discriminating the early stage from the late stage of ED, ROC curves of the 22 FRGs were plotted (Supplementary Figure S2). Except for CDH2 (area under the curve [AUC] = 0.674), all other 21 FRGs (AUC 0.7–0.9) demonstrated moderate predictive accuracy.
To elucidate the biological functions and pathways that were associated with the 22 DE-FRGs, we then performed GO and KEGG analysis analyses, which are demonstrated by using the bar map (Figure 3A) and circular network diagram (Figure 3B), respectively. The GO analysis suggested that these DE-FRGs were mainly enriched in the regulation of extrinsic apoptotic signaling pathway, RNA polymerase II transcription regulator complex, and receptor receptor-ligand activity. Moreover, the results of KEGG revealed that these DE-FRGs were mainly enriched in the ferroptosis, and NOD-like receptor signaling pathways. Subsequently, a chord diagram (Figure 3C) and donut plot (Figure 3D) were constructed to show that these 22 DE-FRGs underwent GO and KEGG enrichment analysis of the combined log2FC. The results showed that ossification (GO:0001503) was significantly up-regulated. We selected a representative KEGG pathway to construct a ferroptosis pathway diagram (Figure 3E).
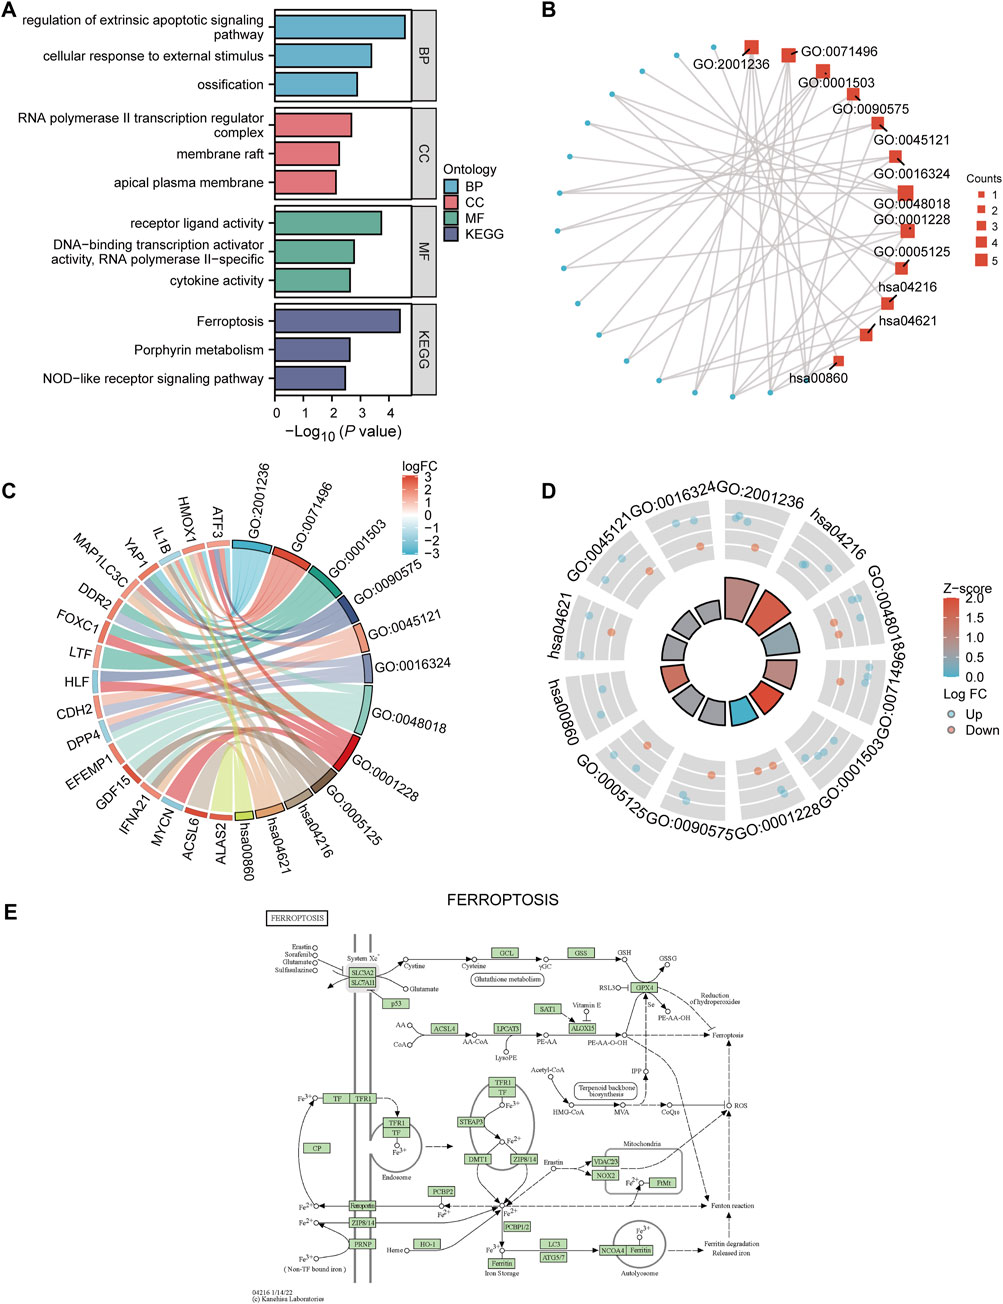
Figure 3. GO and KEGG analysis. (A) Bar graph showing the results of GO and KEGG analysis. (B) GO enrichment analysis results of DE-FRGs are shown in a circular network diagram. DE-FRGs combined log2FC are shown in the chord diagram (C) and donut plot (D). The red and blue dots represent up-regulated (log2FC > 0) and t down-regulated (log2FC < 0) genes, respectively. (E) KEGG pathway diagram of ferroptosis (hsa04216). DE-FRGs, differentially expressed ferroptosis-related genes. GO, Gene Ontology. KEGG, Kyoto Encyclopedia of Genes and Genomes.
GSEA was performed to analyze the relationship between all gene expression and participating biological processes, affected cell components, and molecular functions of ED-datasets. GSEA indicated that the 22 DE-FRGs in the ED dataset were significantly enriched in the ferroptosis, NOTCH pathway, WNT signaling pathway and pluripotency, hippo signaling pathway, fceri-mediated MAPK activation, and HEDGEHOG-, and JAK-STAT -signaling pathways (Supplementary Figures S3A–H). GSVA was conducted to explore the differences in the hallmark gene sets during differentiation. The results showed that 21 hallmark gene sets differed between the long and short groups, such as oxidative phosphorylation, hypoxia, cholesterol homeostasis, WNT/beta-catenin signaling, JAK-STAT3 signaling, PI3K-AKT-MTOR signaling, MTORC1 signaling pathways (p < 0.05) (Figure 4A). A grouping comparison map was drawn for these 21 hallmark gene sets (Figure 4B) to further illustrate the expression differences. Differences in the 20 hallmark gene sets were statistically significant between the long and short groups (p < 0.05), except for the hallmark early estrogen response gene sets (p < 0.05).
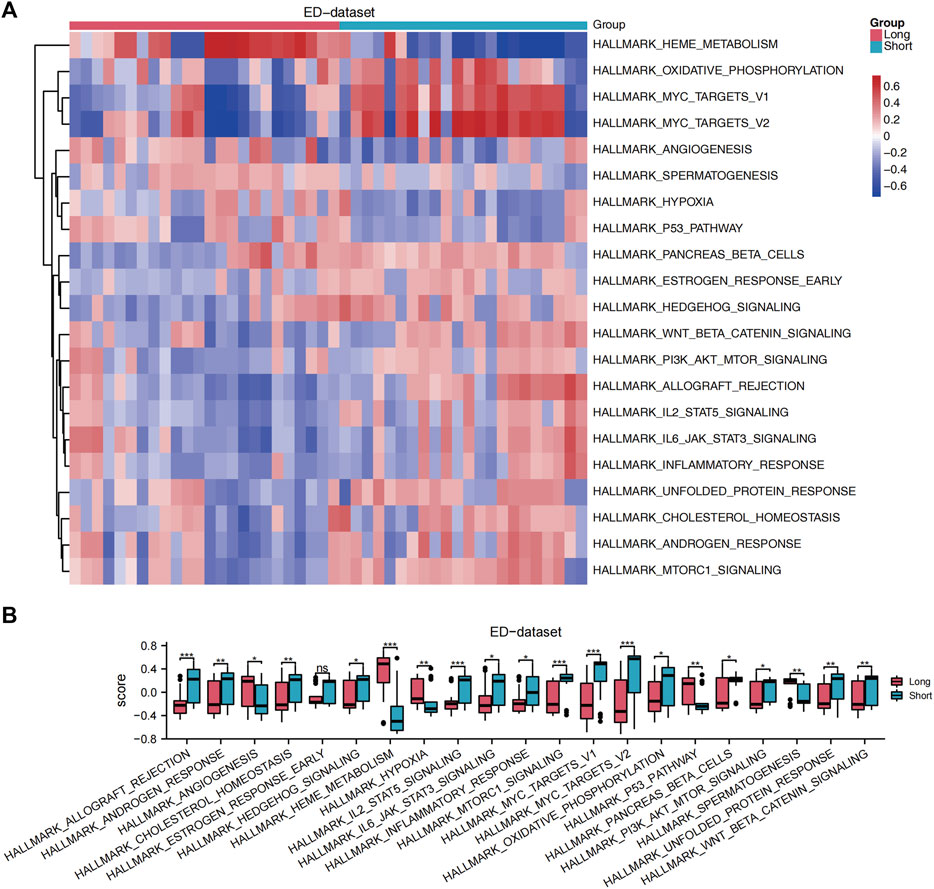
Figure 4. GSVA. (A) A heat map showed the scores of gene set functions in GSVA. (B) GSVA of enrichment pathways with statistical differences between the long and short groups. The comparison is performed using the Wilcoxon rank sum test. *p < 0.05, **p < 0.01, ***p < 0.001, ED, erythrocyte differentiation. GSVA, Gene Set Variation Analysis.
PPI analysis was conducted to determine the interactive relationship among DE-FRGs (Figure 5A). The cytoHubba plugin analysis identified 10 hub genes (ATF3, CDH2, CHAC1, DDR2, DPP4, GDF15, HMOX1, IFNA21, IL1B, and YAP1). IL1B had the greatest interaction with other FRGs when the least required interaction score was 0.400. Subsequently, we used the maximal clique centrality (MCC) algorithm to calculate the scores of DE-FRGs connected to other PPI network nodes (Figure 5B). Specific FRG scores are listed in Supplementary Table S2. IL1B ranked first in the MCC algorithm score. Additionally, we predicted and constructed an interaction network of functionally similar genes of these 10 DE-FRGs using the GeneMANIA website (Figure 5C) to observe co-expression, physical interaction relationships, prediction, and co-localization. Moreover, the Spearman algorithm was used to analyze the correlation between the 10 FRG expression levels, and the correlation heat map (Supplementary Figure S4A) and chord maps (Supplementary Figure S4B) were used to display the results of the analysis. The results showed that, except for gene DPP4 in the ED dataset, the correlation between the expression levels of IL1B and other FRGs was mainly negative, conversely, the correlation between the expression levels of other FRGs was mainly positive. A correlation scatter diagram shows the results of the correlation analysis for the most representative four pairs of genes (Supplementary Figures S3C–F).
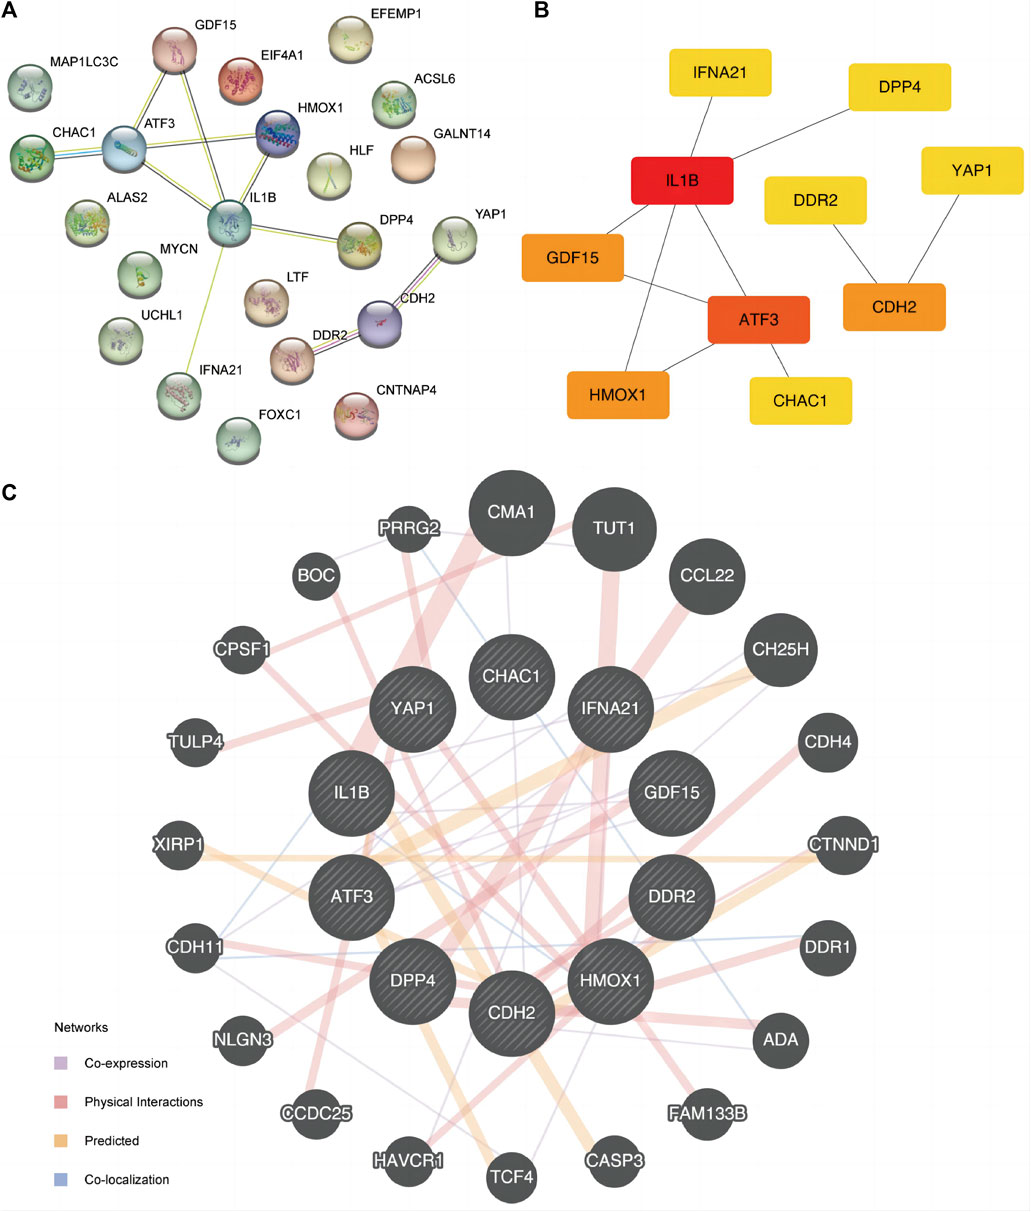
Figure 5. PPI interaction network. (A) PPI network of FRGs. (B) PPI network of FRGs in MCC algorithm. The rectangle color from yellow to red in the Figure represents the gradual increase of the score. (C) FRGs’ GeneMANIA site predicts interaction networks of functionally similar genes. FRGs, ferroptosis-related genes. PPI, protein-protein interaction. MCC, maximal clique centrality.
We also used the ENCORI and ChIPBase3.0 database to predict the microRNAs (miRNAs) and TF interacting with the 10 FRGs (Figure 6) to accurately investigate the molecular mechanism underlying the 10 hub DE-FDEGs, and then mapped the interaction network using Cytoscape software. The mRNA-miRNA interaction network consisted of nine mRNAs and 48 miRNAs (Supplementary Table S3). The mRNA-TF interaction network contained eight mRNAs (CDH2, CHAC1, DPP4, GDF15, HMOX1, IFNA21, IL1B, and YAP1) and 26 TF (Supplementary Table S4).
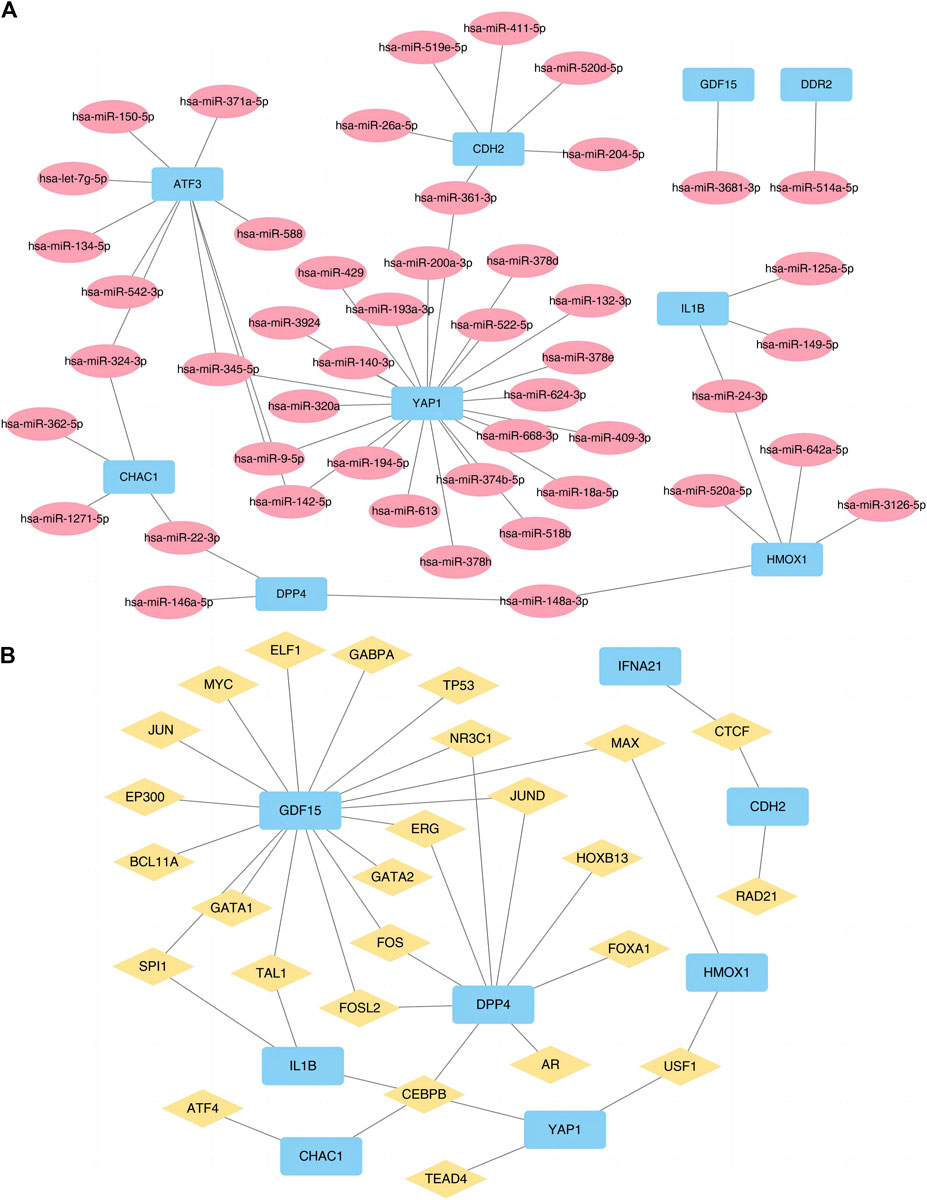
Figure 6. Prediction networks of mRNA-miRNA and mRNA-TF. (A) Interactions of DE-FRGs and miRNA. (B) Interactions of DE-FRGs and transcription factor. TF, Transcription factor. DE-FRGs, differentially expressed ferroptosis-related genes.
Unsupervised consensus clustering was performed based on DE-FRGs. By increasing the clustering variable k from 2 to 8, we found that optimal categorization occurred when k = 3 (Supplementary Figure S5A–C). Additionally, the principal component analysis (Supplementary Figure S5D) and heat maps (Supplementary Figure S5E) revealed significant differences among the three clusters.
Based on the expression of the 10 hub DE-FRGs, the ssGSEA algorithm was used to obtain the FRG scores of each sample to represent the FRG expression level. Subsequently, the dataset was then classified into high and low FRG scores, based on the median FRG score. Next, a grouping comparison diagram showed that the FRG scores of the 10 DE-FRGs were significantly different between the high and low groups (Supplementary Figure S6A). The ROC curves for the 10 FRGs (Supplementary Figures S6B–K) showed that the expression of GDF15 (AUC = 0.938) and HMOX1 (AUC = 0.981) was highly accurate in predicting FRG scores.
To explore the differences in immune infiltration between the groups with high and low FRG scores, we used the ssGSEA algorithm to calculate the infiltration abundance of 28 immune cell types (Supplementary Figure S7A). The results showed that the infiltration abundances of the 12 immune cell types were significantly different between the high and low FRGs score groups (p < 0.05). Subsequently, we then calculated the correlation between the infiltration abundance of these 12 immune cell types in the low (Figure 7A) and high (Figure 7B) FRG score groups. The infiltration abundance of the 12 immune cell types showed a positive correlation (r > 0). Simultaneously, we calculated the abundance of the 12 immune cell types of infiltration and 10 DE-FRGs in the low (Figure 7C) and high (Figure 7D) FRG score groups. The results showed that IL1B was significantly positively correlated with these 12 immune cell types (r > 0, p < 0.05), whereas GDF15 and CHAC1 were negatively correlated with the 12 immune cell types (r < 0, p < 0.05).
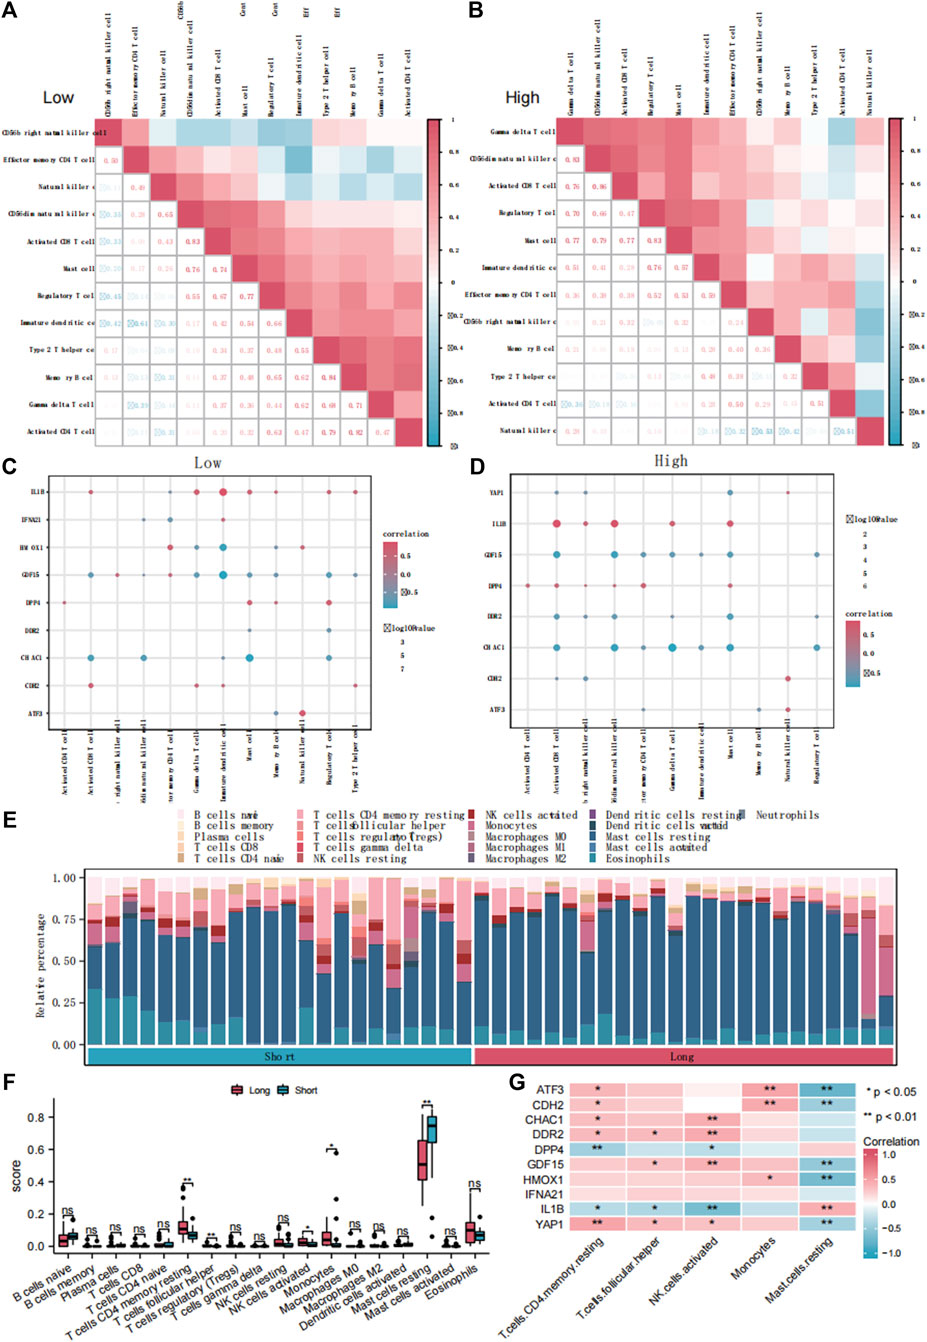
Figure 7. The immune infiltration analysis of ssGSEA and CIBERSORTx. Correlation analysis of immune cell infiltration abundance in dataset ED-dataset with low (A) and high (B) FRG score. Correlation analysis of immune cells and DE-FRGs in groups with low (C) and high (D) FRGs score. (E) Bars plot showed 22 types of immune cells in different samples of the ED-dataset. (F) Box plot showed difference of infiltrating immune cells between the long and short groups based on CIBERSORT. (G) Heatmap of correlations of hub genes with differentially infiltrated inED. ED, erythrocyte differentiation. FRGs, ferroptosis-related genes. ssGSEA, single sample gene set enrichment analysis. DE-FRGs, differentially expressed ferroptosis-related genes.
Comparing the immune infiltration of the long- and short groups with CIBERSORTx, significant differences were found in the immune infiltration components between the two groups (Figures 7E, F). In the long group, the proportions of CD4 memory resting T cells, follicular helper T cells, activated NK cells, and monocytes were significantly higher, and resting mast cells were lower than those in the short group (p < 0.05) (Figure 7F). The heat map (Figure 7G) shows the correlation between the abundance of the five immune cell infiltrates and the 10 DE-FRGs. Four representative pairs of FRGs and immune cells were collected to construct correlated scatter graphs (Supplementary Figures S7B–E).
LASSO regression analysis was used to construct a diagnostic model (Figure 8A), which revealed eight FRGs for predicting differentiation. We also obtained a trajectory diagram for the LASSO variables (Figure 8B). Subsequently, a logistic model was constructed for the ED dataset with these eight FRGs, and a forest map (Figure 8C) was used to show the situation of the single-factor logistic model. Six FRGs (ATF3, CDH2, CHAC1, DDR2, DPP4, and GDF15) were included in the multi-factor multiple logistic model. We constructed a diagnostic nomogram (Figure 8D) and a diagnostic calibration curve (Figure 8E). The red line representing the calibration curve is close to the gray line representing the ideal curve, indicating that the model is well-fitted.
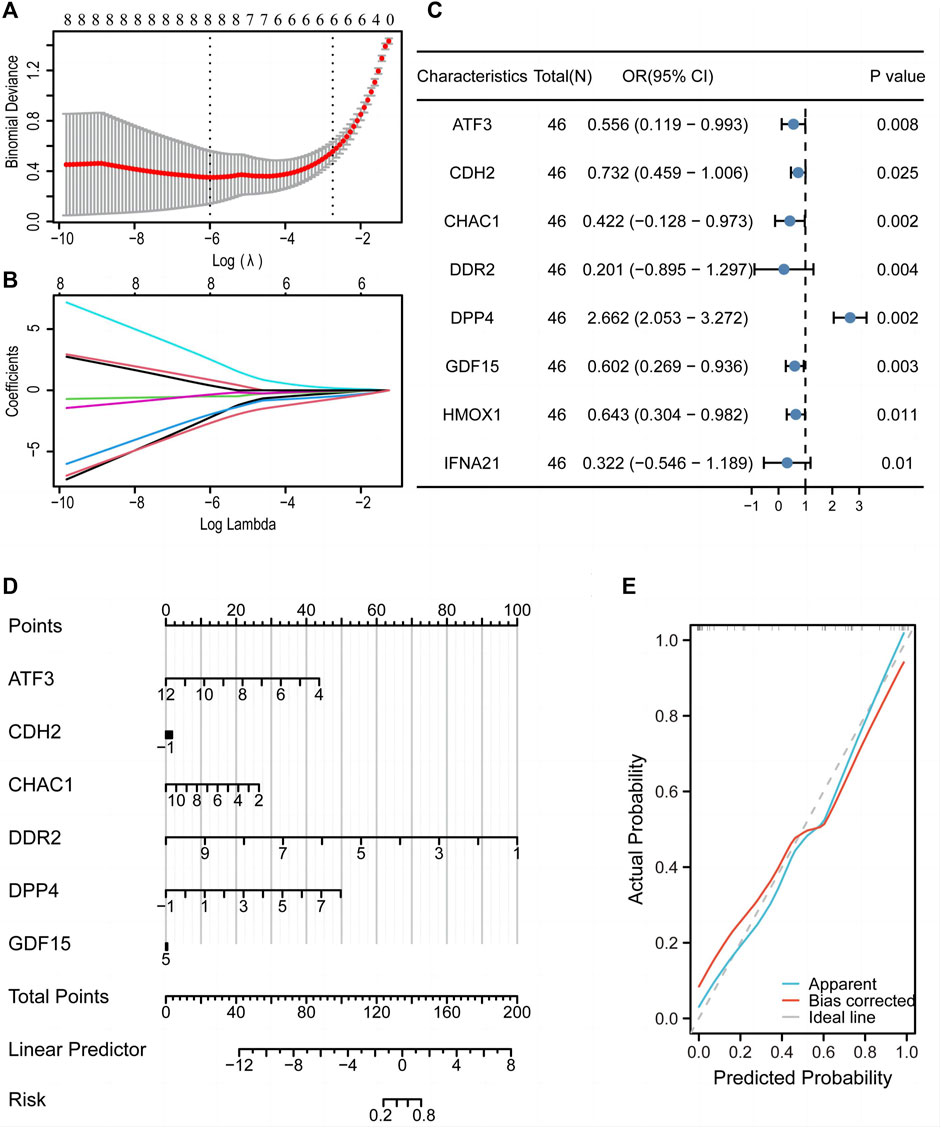
Figure 8. A diagnostic model of the training set was constructed using the LASSO diagnostic model and logistic model. LASSO regression analysis (A) and LASSO coefficient (B) revealed eight genes associated with diagnosis. (C) Forest map of single factor logistic model. (D) Nomogram to predict the diagnostic value of the multi-factor Logistic model. (E) Diagnostic calibration curve of multi-factor logistic model. LASSO, least absolute shrinkage and selection operator.
We previous previously established a serum- and feeder-free culture system to induce and monitor the erythroid differentiation of umbilical cord blood -derived CD34+ cells. The mRNA expression levels of the six genes in the multifactor multiple logistic model were further evaluated during in vitro erythropoiesis (Figure 9). RT-qPCR results showed that the mRNA expression levels of DDR2, GDF15, CDH2, CHAC1and ATF3 were upregulated on day 16 compared with that on day 8 (p < 0.05), whereas the expression level of DDP4 was downregulated on day 16 (p < 0.05) during erythroid differentiation of human umbilical cord blood-derived CD34+ cells, consistent with the trend of bioinformatic analysis.
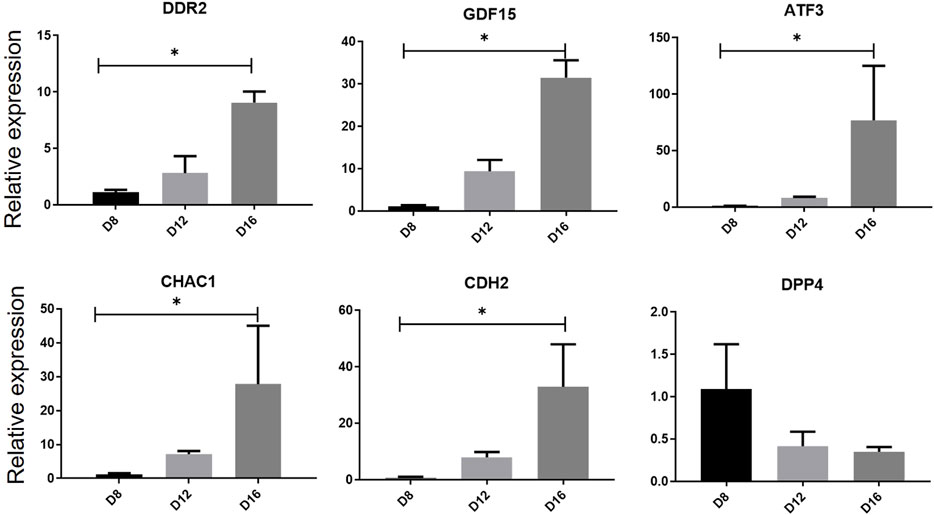
Figure 9. Relative gene expression verification of hub genes during erythrocyte differentiation. The expression levels of hub genes in human umbilical cord blood-derived CD34+ on differentiation days 8, 12 and 16 was measured by RT-qPCR. One-way analysis of variance followed by Dunnett’s multiple comparison test was used to compare means among groups. *p < 0.05, **p < 0.01, ***p < 0.001. Data are expressed as the mean ± SD of technical triplicates from one of several independent experiments. RT-qPCR, quantitative reverse-transcription PCR.
Anemia is a worldwide health issue and a common complication of many diseases, such as heart failure and tumors. Transfusion is a crucial treatment. However, blood supply shortages and transfusion-related risks have become global issues of major concern due to donor-related issues. Despite the substantial efforts made in vitro generation of erythrocytes using various stem cells, most protocols have low efficiency in generating sufficient functional red blood cells (RBCs), including stable β-globin expression and enucleation. Therefore, understanding the erythropoiesis mechanism during development is necessary. Erythrocytes, organelle-free cells packaged with iron-containing hemoglobin, are the end-product of a complex hierarchy of hematopoietic progenitors that become progressively restricted to the erythroid lineage. This stepwise differentiation process requires large amounts of iron for hemoglobin synthesis. Ferroptosis is involved in various physiological and pathological processes, including erythropoiesis.
In this study, we explored 753 genes involved in ferroptosis and identified 25 DE-FRGs between the early and late ED stages. Enrichment analysis indicated that DE-FRGs were primarily involved in the JAK-STAT, MAPK, PI3K-AKT-mTORC1, WNT, and NOTCH signaling pathways. Ten hub DE-FRGs were obtained based on the PPI analysis. Furthermore, we created mRNA-miRNA and mRNA-TF constructs. The infiltration levels of immune cells differed significantly during ED. Finally, we established a signature using six DE-FRGs related to ED stages through LASSO regression analysis. The RT-qPCR validation results suggested that the six DE-FRGs are potential signature genes for erythropoiesis. This study revealed that ferroptosis may provide a promising strategy for optimizing in vitro erythrocyte hematopoiesis and treating erythrocyte diseases.
This study identified the molecular signatures of ferroptosis in ED of human umbilical cord blood-derived CD34+ cells. We obtained 10 hub DE-FRGs with significant interactions (IL1B, HMOX1, DPP4, ATF3, YAP1, CDH2, CHAC1, DDR2, GDF15, and IFNA21). Similar to the results of our study, IL1B, HMOX1, GDF15, YAP1, and DPP4 have been reported to play roles in ferroptosis and erythroid differentiation. IL1B interacted with five FRGs. IL-1β might promote hypoferremia or decreased iron availability by stimulating the expression of hepcidin, which could impair erythropoiesis (Nemeth et al., 2004). IL-1 receptor antagonists reduced the incidence of anemia (Dinarello, 2005; Vallurupalli et al., 2020). Therefore, IL-1β may be decreased to increase iron availability and promote erythroid differentiation. Autophagy inhibits excess iron-induced ferroptosis and subsequently increases IL-1Β (Su et al., 2021). HMOX1, the inducible enzyme that catabolizes the degradation of heme into iron, plays a major role in the clearance of senescent and damaged RBCs, systemic iron homeostasis, and erythropoiesis (Starzyński et al., 2013; Kim et al., 2018). The discrepancy in sensitivity to ferroptosis can be determined and regulated by HO-1 (Li et al., 2023). The oxidative stress also promoted HO-1 translocation to mitochondria, leading to mitochondrial iron overload (Chen Y. et al., 2023). GDF-15, a bone marrow-derived cytokine, suppresses the iron regulator hepcidin in vitro and is significantly increased in patients with ineffective erythropoiesis (Liu et al., 2021). GDF-15 is the mitochondrial metabolism related markers. Those with iron overload had higher GDF15 levels compared with non-iron overload patients (Huang et al., 2019). YAP1, an erythroid regulator, coordinates metabolic status with the proliferation of erythroid progenitors to promote stress erythropoiesis (Hao et al., 2019). YAP/TAZ play an important role in erythroid maturation and enucleation (Damkham et al., 2022). Hippo/YAP1/c-Jun axis regulated iron metabolism (Zhou et al., 2023). YAP1 deficiency boosted mitochondrial dysfunction and the ferrous iron accumulation (Zhang J. et al., 2022). DPP-4 decreases erythropoietin (Epo) activity by cleavage, negatively regulates colony-stimulating factor activity and stress hematopoiesis (Broxmeyer et al., 2012; Ou et al., 2013), and improves the responsiveness to erythropoiesis-stimulating agent (Hasegawa et al., 2021). In our study, we predicted the differential expression of these genes in the early and late stages of differentiation and analyzed the pathways and immune infiltration associated with these genes in subsequent analyses. The transcription factors ATF3 and YAP1 play multiple roles in shaping ferroptosis sensitivity through either transcription-dependent or transcription-independent mechanisms (Dai et al., 2020). As there is still a lack of evidence on whether FRGs contribute to the stage of ED, a logistic regression model was constructed to distinguish between five key genes (DPP4, CDH2, CHAC1, and DDR2). The validation of the six key genes met the trend of bioinformatic analysis. However, a few studies have investigated the mechanisms of action of other genes involved in ED.
Furthermore, functional enrichment analysis indicated that the DEGs were primarily involved in the JAK-STAT, MAPK, PI3K-AKT-mTORC1, WNT, and NOTCH signaling pathways. Hypoxia promotes erythropoiesis by increasing Epo production. Although Epo is the principal regulator of erythroid progenitors, signaling from the Epo-receptor activates several pathways, including the JAK/STAT, ras/raf/MAP kinase, and PI3K/Akt cascades, to promote cell survival, proliferation, and differentiation (Ingley et al., 2004). JAK/STAT, MAPK, and PI3K are considered the main signaling pathways that play significant roles in fetal hemoglobin induction (Rahim et al., 2013). The JAK-STAT signaling pathway regulates certain TFs (GATA1, GATA2, SPI1, and RUNX1) involved in ED regulation, development, and maturation (Liu et al., 2017). Erythrocyte proliferation and survival are also associated with the activation of the JAK-STAT pathway (Cokic et al., 2012). The level of IL-1β was decreased via inactivating of JAK/STAT signaling pathway (Ni et al., 2023). The PI3K-AKT signaling pathway regulates the Epo-induced survival, proliferation, and maturation of early erythroid progenitors (Lopez et al., 2011). The reduction of Pi4ka inhibits myeloid and erythroid cell differentiation in vitro and promotes anemia in vivo through a mechanism involving the deregulation of AKT, MAPK, and JAK-STAT signaling pathways (Ziyad et al., 2018). Ferroptosis can be reducd through the MAPK signaling pathway (Chen W. et al., 2023). We previously reported the mTOR signaling pathway played roles during human umbilical cord blood-derived CD34+ cell erythropoiesis in vitro (Liu et al., 2020). The inhibition of mTORC1 sensitizes cells to ferroptosis (Zhang et al., 2021). The components of the JAK-STAT-NF-κB signaling pathway are DNA hypomethylated and upregulation, targeting key genes for erythropoiesis. The activation of the Wnt/beta-catenin signaling attenuates cellular lipid ROS production and subsequently inhibits ferroptosis. The beta-catenin/TCF4 transcription complex directly binds to the promoter region of GPX4, a peroxidase that suppresses ROS-triggered ferroptosis resulting in suppressing ferroptosis (Wang et al., 2022). Although Wnt/β-catenin is dispensable for steady-state erythropoiesis, its activity is essential for stress erythropoiesis in response to bone marrow injury and anemia (Krimpenfort and Nethe, 2021). The canonical WNT signaling pathway also inhibits the expansion and/or survival of primitive erythrocytes (Paluru et al., 2014). GATA2 contributes to the inhibition of the canonical WNT signaling pathway, thereby permitting progenitors to exit the cell cycle and commit to a hematopoietic fate. Subsequently, the activation of the non-canonical WNT signaling pathway plays a role in enabling progenitors to differentiate into mature RBCs (Mimoto et al., 2015). The activation of the NOTCH signaling pathway leads to the inhibition of differentiation of immature precursors, suggesting important roles for the NOTCH signaling pathway in hematopoiesis (Sugimoto et al., 2006). Our results expand our understanding of the mechanisms underlying erythropoiesis. However, broader validation is needed to improve our understanding of the mechanisms of ferroptosis in the ED of human umbilical cord blood-derived CD34+ cells.
Erythropoiesis is a complex and sophisticated multistage process regulated by TFs and miRNAs. This study also established TF- and miRNA-target gene networks. The importance of several TFs in erythropoiesis has been unequivocally demonstrated by cell-based ex vivo assays, as well as in knockout mouse models and rare patients with anemias (Kerenyi and Orkin, 2010). Members of the GATA TF family, GATA1 and GATA2, play crucial roles in regulating lineage-restricted genes during erythroid differentiation (Moriguchi and Yamamoto, 2014). GATA-2 is essential for the maintenance and proliferation of immature hematopoietic progenitors, whereas GATA-1 is essential for the survival of erythroid progenitors and terminal differentiation of erythroid cells (Ohneda and Yamamoto, 2002). Similarly, in our differentiation system, GATA1 expression gradually increased and then decreased, whereas GATA2 expression gradually decreased following cell maturation (Liu et al., 2020). Several TFs, such as GATA-1 (Vakoc et al., 2005) or BCL11A (Sankaran et al., 2008), have been described as being required for the transcriptional switch from γ-globin to β-globin expression. BCL11A plays a novel regulatory role in erythroid differentiation, maturation, and globin production (Luanpitpong et al., 2022). MiRNAs play key roles in erythropoiesis and control the expression of several TF genes involved in erythroid differentiation and hemoglobin gene expression (Jafari et al., 2019). MiRNA-146a is significantly more abundant in reticulocytes obtained from adults than those from umbilical cord blood and inhibits γ globin expression (Azzouzi et al., 2011). MiR-24 promotes terminal differentiation (Drak Alsibai and Meseure, 2018). Our findings provide a resource for future studies aimed at elucidating the roles of TFs and miRNAs in erythropoiesis.
The blood and immune systems develop during early embryogenesis. Immune-erythroid cells are coupled with dual erythroid and immune regulatory networks and play immunomodulatory roles throughout human ontogenesis by actively interacting with various immune cells (Xu et al., 2022). Two transcriptional regulation programs are co-activated in immune erythroid cells: one is centered on the GATA1, MYC, and MYB regulons to ensure normal erythroid differentiation, and the other is dependent on the GATA2, FOS, and JUN regulons to instruct immunomodulatory activity. The mRNA-TF interaction network in our study included GDF15, GATA1, MYC, MYB, GATA2, FOS, and JUN. A negative correlation was found between GDF15 and the abundance of the 12 immune cell types of infiltration in samples with high and low FRG scores. GDF15 was associated with the abundance of five immune cell types between the early and late differentiation stages. Therefore, we speculated that GDF15 is an important gene associated with ED, ferroptosis, and immune invasion. Our results showed that some immune cells differed significantly during erythropoiesis. Erythroid progenitor cells play an important role in the regulation of immune responses and tumor progression. CD71+-nucleated erythroid cells play immunosuppressive roles in orchestrating immune response (Grzywa et al., 2021). RBCs affect immune cell functions. For example, they inhibit T-cell proliferation via direct cell-cell contact and affect dendritic cell functions (Bernard et al., 2010; Yi et al., 2015). Moreover, RBCs serve as critical immune sensors through the surface expression of nucleic acid–sensing toll-like receptor 9 (Lam et al., 2021). Endothelial progenitor cell (EPC) differentiation is a promising strategy to reduce cancer-induced immunosuppression and tumor-promoting effects of EPCs (Zhang H. et al., 2022).
Ferroptosis is associated with the immune response. ssGSEA showed that the infiltration abundance of 12 immune cell types was significantly different between high and low FRG scores. Ferroptosis affects immune cells in two ways. Immune cells require sufficient amounts of iron for their proliferation and for mediating their effector function. Ferroptosis affects the number and functions of immune cells. In contrast, ferroptotic cells are recognized by immune cells and trigger various inflammatory or specific responses (Chen et al., 2021). Ferroptosis regulates the activity and function of cytotoxic (CD8+) and helper T (CD4+) cells. Ferroptosis mediates neutrophil recruitment and neutrophil extracellular trap formation (NETosis). In T cells, ferroptosis induces a novel synergy between immunotherapy and radiotherapy. Additionally, ferroptosis may mediate B cell differentiation, antibody responses, and lymphoma. Ferroptosis regulates T- and B-cell immunity, which are involved in infectious diseases. Chronic immune activation in the setting of malignancy alters systemic iron homeostasis and directs iron fluxes into myeloid cells, which may result in iron-restricted erythropoiesis and anemia (Pfeifhofer-Obermair et al., 2018). Tumor-induced erythroid progenitor cells eventually differentiate into myeloid cells that exert robust immunosuppressive functions (Long et al., 2022). Consistent with our results, an interaction was found between the immune status, ferroptosis, and erythropoiesis. However, the exact mechanisms underlying these interactions require further study.
Considering the individual differences and technical limitations, we integrated three gene expression profile datasets to obtain a larger sample size and improve the accuracy of our conclusions. However, the number of patients included in this study was relatively small. Another apparent limitation was that we did not perform in vitro or in vivo experiments to validate the underlying mechanisms and their correlation between immune cells and hub genes, although we verified that six DE-FRGs changed markedly during ED stages. Therefore, we will continue to improve this aspect in the future.
In our study, 25 hub DE-FRGs were identified for erythropoiesis, which could be potential targets for subsequent research. Functional annotations were performed to elucidate the processes and pathways involving these genes. Ten hub DE-FRGs were obtained according to the PPI analysis. This study also predicted certain target miRNAs and TF that may be related to the pathophysiological process of erythropoiesis via ferroptosis. In addition, our analysis confirmed differences in immune infiltration during erythropoiesis. Finally, we established a signature using six DE-FRGs related to erythrocyte differentiation stages by LASSO regression analysis. The six DE-FRG were validated to be potential signature genes for erythropoiesis. Our findings may lay the groundwork for future clinical applications of ex vivo production of functional human reticulocytes for transfusion of human umbilical cord blood-derived CD34+ cells. This study could be important for understanding erythropoiesis and hematologic disorders whose etiology is related to impaired erythroid differentiation and hemoglobinopathies.
The datasets presented in this study can be found in online repositories. The names of the repository/repositories and accession number(s) can be found in the article/Supplementary Material.
The studies involving humans were approved by Binzhou Medical University Hospital and the First Affiliated Hospital of Shantou University Medical College. The studies were conducted in accordance with the local legislation and institutional requirements. The participants provided their written informed consent to participate in this study.
QL: Conceptualization, Funding acquisition, Writing–original draft. ZL: Data curation, Validation, Writing–review and editing. MY: Data curation, Formal Analysis, Writing–review and editing. JW: Resources, Visualization, Writing–review and editing. LL: Resources, Visualization, Writing–review and editing. DH: Resources, Visualization, Writing–review and editing. YF: Data curation, Formal Analysis, Writing–review and editing. XZ: Funding acquisition, Supervision, Validation, Writing–review and editing. TH: Conceptualization, Supervision, Writing–review and editing.
The author(s) declare that financial support was received for the research, authorship, and/or publication of this article. This work was supported by grants from the National Natural Science Foundation of China (no. 82100244, 31371509), China Postdoctoral Science Foundation (no. 2022M712012), Shandong Province Medical and Health Science and Technology Development Project (no. 202003040648), Binzhou Medical University Scientific Foundation (no. BYFY2020KYQD40), 2020 Li Ka Shing Foundation Cross-Disciplinary Research Grant (no. 2020LKSFG20B) and 2022 Characteristics and Innovation Grant for college of Guangdong Province (2022KTSCX040).
We would like to thank all the contributors to the transcriptome sequencing data used in this study.
The authors declare that the research was conducted in the absence of any commercial or financial relationships that could be construed as a potential conflict of interest.
All claims expressed in this article are solely those of the authors and do not necessarily represent those of their affiliated organizations, or those of the publisher, the editors and the reviewers. Any product that may be evaluated in this article, or claim that may be made by its manufacturer, is not guaranteed or endorsed by the publisher.
The Supplementary Material for this article can be found online at: https://www.frontiersin.org/articles/10.3389/fgene.2024.1365232/full#supplementary-material
SUPPLEMENTARY FIGURE S1 | Data preprocessing. (A) Box plot of the sample distribution of ED-dataset before normalization. (B) Box plot of the sample distribution of ED-dataset after normalization. ED, erythrocyte differentiation.
SUPPLEMENTARY FIGURE S2 | A diagnostic assessment of 22 DE-FRGs in the ED-dataset was displayed. A ROC curve was generated to assess the model performance. The AUC is used to determine the prediction accuracy. The AUC is usually between 0.5 and 1.0. The ROC curve has low/moderate/high accuracy when the AUC is 0.5–0.7/0.7–0.9/>0.9, respectively. FRGs, ferroptosis-related genes. ROC, receiver operating characteristic curve. AUC, area under the curve. TPR, true positive rate. FPR, false positive rate. CI, confidence interval. ED, erythrocyte differentiation.
SUPPLEMENTARY FIGURE S3 | Correlation analysis of DE-FRGs in ED-dataset. (A) The heat map showed the correlation of DE-FRGs. (B) The chord map shows the correlation of DE-FRGs. (C–F) The scatter plot shows the correlation between ATF3 and HMOX1, DDR2 and GDF15, GDF15 and IL1B, andDDR2 and IL1B. Correlations were calculated using Spearman correlation analysis. The correlation coefficient (r) in the correlation scatter plot is strongly correlated when the absolute value is above 0.8. The absolute value of 0.5–0.8 is moderately correlated. The absolute value between 0.3 and 0.5 shows a weak correlation. Absolute values below 0.3 are considered weak or irrelevant. FRGs, ferroptosis-related genes. ED, erythrocyte differentiation.
SUPPLEMENTARY FIGURE S4 | GSEA. (A) Seven main biological characteristics of GSEA of ED-dataset. Genes of ED-dataset were significantly enriched in wp ferroptosis (B), NOTCH pathway (C), WNT signaling pathway and pluripotency (D), HIPPO signaling (E), e fceri mediated MAPK activation (F), hedgehog signaling pathway (G), JAK-STAT signaling pathway (H).
SUPPLEMENTARY FIGURE S5 | Consensus clustering analysis based on DE-FRGs (A) Consensus heatmap of K = 3. (B) Cumulative distribution function (CDF) curves for k = 2–8. (C) Elbow plot showing the relative change in area under the CDF curve. (D) PCA for the unsupervised clustering results (K = 3). (E) The heatmap shows the expression of the 10 hub DE-FRGs among clusters of the dataset. based on the ED-dataset. PCA, principal component analysis. ED, erythrocyte differentiation.
SUPPLEMENTARY FIGURE S6 | Construction of FRGs scores (A) Grouping comparison graphs of high and low FRGs scores in the ED-dataset are shown. (B–K) FRG ROC curve results are displayed in the ED-dataset based on the FRG score group. A ROC curve was generated to assess the model performance. * P < 0.05, ** P < 0.01, *** P < 0.001, ED, erythrocyte differentiation. FRGs, ferroptosis-related genes. ROC, receiver operating characteristic curve. AUC, area under the curve. TPR, true positive rate. FPR: false positive rate. CI, confidence interval.
SUPPLEMENTARY FIGURE S7 | The immune infiltration analysis of ssGSEA and CIBERSORTx. (A) Grouping comparison of ssGSEA immune infiltration analysis between groups with high and low FRG scores. Correlation analysis of immune cells and DE-FRGs in groups with low FRGs score. Correlation scatter plot of ATF3-Monocytes (B), YAP1 - CD4 memory resting T cells (C), ATF3–Mast cells resting (D), and HMOX1-Mast cells resting (E). Correlations were calculated using Spearman correlation analysis. ED, erythrocyte differentiation. FRGs, ferroptosis related genes. ssGSEA, single sample gene set enrichment analysis.
Azzouzi, I., Moest, H., Winkler, J., Fauchère, J. C., Gerber, A. P., Wollscheid, B., et al. (2011). MicroRNA-96 directly inhibits γ-globin expression in human erythropoiesis. PLoS One 6 (7), e22838. doi:10.1371/journal.pone.0022838
Barrett, T., Wilhite, S. E., Ledoux, P., Evangelista, C., Kim, I. F., Tomashevsky, M., et al. (2013). NCBI GEO: archive for functional genomics data sets--update. Nucleic Acids Res. 41 (Database issue), D991–D995. doi:10.1093/nar/gks1193
Bernard, A., Meier, C., Ward, M., Browning, T., Montgomery, A., Kasten, M., et al. (2010). Packed red blood cells suppress T-cell proliferation through a process involving cell-cell contact. J. Trauma 69 (2), 320–329. doi:10.1097/TA.0b013e3181e401f0
Broxmeyer, H. E., Hoggatt, J., O'Leary, H. A., Mantel, C., Chitteti, B. R., Cooper, S., et al. (2012). Dipeptidylpeptidase 4 negatively regulates colony-stimulating factor activity and stress hematopoiesis. Nat. Med. 18 (12), 1786–1796. doi:10.1038/nm.2991
Chen, W., Zhang, Y., Wang, Z., Tan, M., Lin, J., Qian, X., et al. (2023b). Dapagliflozin alleviates myocardial ischemia/reperfusion injury by reducing ferroptosis via MAPK signaling inhibition. Front. Pharmacol. 14, 1078205. doi:10.3389/fphar.2023.1078205
Chen, X., Kang, R., Kroemer, G., and Tang, D. (2021). Ferroptosis in infection, inflammation, and immunity. J. Exp. Med. 218 (6), e20210518. doi:10.1084/jem.20210518
Chen, Y., Guo, X., Zeng, Y., Mo, X., Hong, S., He, H., et al. (2023a). Oxidative stress induces mitochondrial iron overload and ferroptotic cell death. Sci. Rep. 13 (1), 15515. doi:10.1038/s41598-023-42760-4
Chen, Z., Jiang, J., Fu, N., and Chen, L. (2022). Targetting ferroptosis for blood cell-related diseases. J. Drug Target 30 (3), 244–258. doi:10.1080/1061186X.2021.1971237
Christaki, E. E., Politou, M., Antonelou, M., Athanasopoulos, A., Simantirakis, E., Seghatchian, J., et al. (2019). Ex vivo generation of transfusable red blood cells from various stem cell sources: a concise revisit of where we are now. Transfus. Apher. Sci. 58 (1), 108–112. doi:10.1016/j.transci.2018.12.015
Cokic, V. P., Bhattacharya, B., Beleslin-Cokic, B. B., Noguchi, C. T., Puri, R. K., and Schechter, A. N. (2012). JAK-STAT and AKT pathway-coupled genes in erythroid progenitor cells through ontogeny. J. Transl. Med. 10, 116. doi:10.1186/1479-5876-10-116
Dai, C., Chen, X., Li, J., Comish, P., Kang, R., and Tang, D. (2020). Transcription factors in ferroptotic cell death. Cancer Gene Ther. 27 (9), 645–656. doi:10.1038/s41417-020-0170-2
Damkham, N., Lorthongpanich, C., Klaihmon, P., Lueangamornnara, U., Kheolamai, P., Trakarnsanga, K., et al. (2022). YAP and TAZ play a crucial role in human erythrocyte maturation and enucleation. Stem Cell. Res. Ther. 13 (1), 467. doi:10.1186/s13287-022-03166-7
Davis, S., and Meltzer, P. S. (2007). GEOquery: a bridge between the gene expression Omnibus (GEO) and BioConductor. Bioinformatics 23 (14), 1846–1847. doi:10.1093/bioinformatics/btm254
Dinarello, C. A. (2005). Blocking IL-1 in systemic inflammation. J. Exp. Med. 201 (9), 1355–1359. doi:10.1084/jem.20050640
Dowdle, W. E., Nyfeler, B., Nagel, J., Elling, R. A., Liu, S., Triantafellow, E., et al. (2014). Selective VPS34 inhibitor blocks autophagy and uncovers a role for NCOA4 in ferritin degradation and iron homeostasis in vivo. Nat. Cell. Biol. 16 (11), 1069–1079. doi:10.1038/ncb3053
Drak Alsibai, K., and Meseure, D. (2018). Tumor microenvironment and noncoding RNAs as co-drivers of epithelial-mesenchymal transition and cancer metastasis. Dev. Dyn. 247 (3), 405–431. doi:10.1002/dvdy.24548
Gillespie, M. A., Palii, C. G., Sanchez-Taltavull, D., Shannon, P., Longabaugh, W. J. R., Downes, D. J., et al. (2020). Absolute quantification of transcription factors reveals principles of gene regulation in erythropoiesis. Mol. Cell. 78 (5), 960–974. doi:10.1016/j.molcel.2020.03.031
Grzywa, T. M., Nowis, D., and Golab, J. (2021). The role of CD71(+) erythroid cells in the regulation of the immune response. Pharmacol. Ther. 228, 107927. doi:10.1016/j.pharmthera.2021.107927
Guo, X., Plank-Bazinet, J., Krivega, I., Dale, R. K., and Dean, A. (2020). Embryonic erythropoiesis and hemoglobin switching require transcriptional repressor ETO2 to modulate chromatin organization. Nucleic Acids Res. 48 (18), 10226–10240. doi:10.1093/nar/gkaa736
Hao, S., Matsui, Y., Lai, Z. C., and Paulson, R. F. (2019). Yap1 promotes proliferation of transiently amplifying stress erythroid progenitors during erythroid regeneration. Exp. Hematol. 80, 42–54. doi:10.1016/j.exphem.2019.11.002
Hasegawa, T., Zhao, J., Bieber, B., Zee, J., Pisoni, R. L., Robinson, B. M., et al. (2021). Association between dipeptidyl peptidase-4 inhibitor prescription and erythropoiesis-stimulating agent hyporesponsiveness in hemodialysis patients with diabetes mellitus. Kidney Blood Press Res. 46 (3), 352–361. doi:10.1159/000515704
Huang, Y., Lei, Y., Liu, R., Liu, J., Yang, G., Xiang, Z., et al. (2019). Imbalance of erythropoiesis and iron metabolism in patients with thalassemia. Int. J. Med. Sci. 16 (2), 302–310. doi:10.7150/ijms.27829
Ingley, E., Tilbrook, P. A., and Klinken, S. P. (2004). New insights into the regulation of erythroid cells. IUBMB Life 56 (4), 177–184. doi:10.1080/15216540410001703956
Jafari, M., Ghadami, E., Dadkhah, T., and Akhavan-Niaki, H. (2019). PI3k/AKT signaling pathway: erythropoiesis and beyond. J. Cell. Physiol. 234 (3), 2373–2385. doi:10.1002/jcp.27262
Kerenyi, M. A., and Orkin, S. H. (2010). Networking erythropoiesis. J. Exp. Med. 207 (12), 2537–2541. doi:10.1084/jem.20102260
Kim, K. S., Zhang, D. L., Kovtunovych, G., Ghosh, M. C., Ollivierre, H., Eckhaus, M. A., et al. (2018). Infused wild-type macrophages reside and self-renew in the liver to rescue the hemolysis and anemia of Hmox1-deficient mice. Blood Adv. 2 (20), 2732–2743. doi:10.1182/bloodadvances.2018019737
Krimpenfort, R. A., and Nethe, M. (2021). Canonical Wnt: a safeguard and threat for erythropoiesis. Blood Adv. 5 (18), 3726–3735. doi:10.1182/bloodadvances.2021004845
Lam, L. K. M., Murphy, S., Kokkinaki, D., Venosa, A., Sherrill-Mix, S., Casu, C., et al. (2021). DNA binding to TLR9 expressed by red blood cells promotes innate immune activation and anemia. Sci. Transl. Med. 13 (616), eabj1008. doi:10.1126/scitranslmed.abj1008
Lee, S.-J., Jung, C., Oh, J. E., Kim, S., Lee, S., Lee, J. Y., et al. (2023). Generation of red blood cells from human pluripotent stem cells—an update. Cells 12 (11), 1554. doi:10.3390/cells12111554
Leek, J. T., Johnson, W. E., Parker, H. S., Jaffe, A. E., and Storey, J. D. (2012). The sva package for removing batch effects and other unwanted variation in high-throughput experiments. Bioinformatics 28 (6), 882–883. doi:10.1093/bioinformatics/bts034
Li, B., Ding, L., Yang, C., Kang, B., Liu, L., Story, M. D., et al. (2014a). Characterization of transcription factor networks involved in umbilical cord blood CD34+ stem cells-derived erythropoiesis. PLoS One 9 (9), e107133. doi:10.1371/journal.pone.0107133
Li, J. H., Liu, S., Zhou, H., Qu, L. H., and Yang, J. H. (2014b). starBase v2.0: decoding miRNA-ceRNA, miRNA-ncRNA and protein-RNA interaction networks from large-scale CLIP-Seq data. Nucleic Acids Res. 42 (Database issue), D92–D97. doi:10.1093/nar/gkt1248
Li, Y., Yang, Y., Guo, T., Weng, C., Yang, Y., Wang, Z., et al. (2023). Heme oxygenase-1 determines the cell fate of ferroptotic death of alveolar macrophages in COPD. Front. Immunol. 14, 1162087. doi:10.3389/fimmu.2023.1162087
Liberzon, A., Birger, C., Thorvaldsdóttir, H., Ghandi, M., Mesirov, J. P., and Tamayo, P. (2015). The Molecular Signatures Database (MSigDB) hallmark gene set collection. Cell. Syst. 1 (6), 417–425. doi:10.1016/j.cels.2015.12.004
Liu, Q., Luo, L., Ren, C., Zou, M., Yang, S., Cai, B., et al. (2020). The opposing roles of the mTOR signaling pathway in different phases of human umbilical cord blood-derived CD34+ cell erythropoiesis. Stem cells Dayt. Ohio 38, 1492–1505. doi:10.1002/stem.3268
Liu, X., Hu, J., Hu, X. R., Li, X. X., Guan, D. R., Liu, J. Q., et al. (2021). Expression of iron-regulating erythroid factors in different types of erythropoiesis disorders. Zhonghua Xue Ye Xue Za Zhi 42 (1), 52–57. doi:10.3760/cma.j.issn.0253-2727.2021.01.010
Liu, Z., Feng, Q., Sun, P., Lu, Y., Yang, M., Zhang, X., et al. (2017). Genome-wide DNA methylation drives human embryonic stem cell erythropoiesis by remodeling gene expression dynamics. Epigenomics 9 (12), 1543–1558. doi:10.2217/epi-2017-0039
Long, H., Jia, Q., Wang, L., Fang, W., Wang, Z., Jiang, T., et al. (2022). Tumor-induced erythroid precursor-differentiated myeloid cells mediate immunosuppression and curtail anti-PD-1/PD-L1 treatment efficacy. Cancer Cell. 40 (6), 674–693 e7. doi:10.1016/j.ccell.2022.04.018
Lopez, T. V., Lappin, T. R. J., Maxwell, P., Shi, Z., Lopez-Marure, R., Aguilar, C., et al. (2011). Autocrine/paracrine erythropoietin signalling promotes JAK/STAT-dependent proliferation of human cervical cancer cells. Int. J. Cancer 129 (11), 2566–2576. doi:10.1002/ijc.25935
Luanpitpong, S., Kang, X., Janan, M., Thumanu, K., Li, J., Kheolamai, P., et al. (2022). Metabolic sensor O-GlcNAcylation regulates erythroid differentiation and globin production via BCL11A. Stem Cell. Res. Ther. 13 (1), 274. doi:10.1186/s13287-022-02954-5
Mancias, J. D., Pontano Vaites, L., Nissim, S., Biancur, D. E., Kim, A. J., Wang, X., et al. (2015). Ferritinophagy via NCOA4 is required for erythropoiesis and is regulated by iron dependent HERC2-mediated proteolysis. Elife 4, e10308. doi:10.7554/eLife.10308
Mancias, J. D., Wang, X., Gygi, S. P., Harper, J. W., and Kimmelman, A. C. (2014). Quantitative proteomics identifies NCOA4 as the cargo receptor mediating ferritinophagy. Nature 509 (7498), 105–109. doi:10.1038/nature13148
Mimoto, M. S., Kwon, S., Green, Y. S., Goldman, D., and Christian, J. L. (2015). GATA2 regulates Wnt signaling to promote primitive red blood cell fate. Dev. Biol. 407 (1), 1–11. doi:10.1016/j.ydbio.2015.08.012
Moriguchi, T., and Yamamoto, M. (2014). A regulatory network governing Gata1 and Gata2 gene transcription orchestrates erythroid lineage differentiation. Int. J. Hematol. 100 (5), 417–424. doi:10.1007/s12185-014-1568-0
Nemeth, E., Tuttle, M. S., Powelson, J., Vaughn, M. B., Donovan, A., Ward, D. M., et al. (2004). Hepcidin regulates cellular iron efflux by binding to ferroportin and inducing its internalization. Science 306 (5704), 2090–2093. doi:10.1126/science.1104742
Ni, L. L., Che, Y. H., Sun, H. M., Wang, B., Wang, M. Y., Yang, Z. Z., et al. (2023). The therapeutic effect of wasp venom (Vespa magnifica, Smith) and its effective part on rheumatoid arthritis fibroblast-like synoviocytes through modulating inflammation, redox homeostasis and ferroptosis. J. Ethnopharmacol. 317, 116700. doi:10.1016/j.jep.2023.116700
Nilsson, R., Schultz, I. J., Pierce, E. L., Soltis, K. A., Naranuntarat, A., Ward, D. M., et al. (2009). Discovery of genes essential for heme biosynthesis through large-scale gene expression analysis. Cell. Metab. 10 (2), 119–130. doi:10.1016/j.cmet.2009.06.012
Ohneda, K., and Yamamoto, M. (2002). Roles of hematopoietic transcription factors GATA-1 and GATA-2 in the development of red blood cell lineage. Acta Haematol. 108 (4), 237–245. doi:10.1159/000065660
Ou, X., O'Leary, H. A., and Broxmeyer, H. E. (2013). Implications of DPP4 modification of proteins that regulate stem/progenitor and more mature cell types. Blood 122 (2), 161–169. doi:10.1182/blood-2013-02-487470
Packer, M. (2022). How can sodium-glucose cotransporter 2 inhibitors stimulate erythrocytosis in patients who are iron-deficient? Implications for understanding iron homeostasis in heart failure. Eur. J. Heart Fail 24 (12), 2287–2296. doi:10.1002/ejhf.2731
Paluru, P., Hudock, K. M., Cheng, X., Mills, J. A., Ying, L., Galvão, A. M., et al. (2014). The negative impact of Wnt signaling on megakaryocyte and primitive erythroid progenitors derived from human embryonic stem cells. Stem Cell. Res. 12 (2), 441–451. doi:10.1016/j.scr.2013.12.003
Pfeifhofer-Obermair, C., Tymoszuk, P., Petzer, V., Weiss, G., and Nairz, M. (2018). Iron in the tumor microenvironment-connecting the dots. Front. Oncol. 8, 549. doi:10.3389/fonc.2018.00549
Philpott, C. C. (2020). Iron on the move: mobilizing liver iron via NCOA4. Blood 136 (23), 2604–2605. doi:10.1182/blood.2020007971
Rahim, F., Allahmoradi, H., Salari, F., Shahjahani, M., Fard, A. D., Hosseini, S. A., et al. (2013). Evaluation of signaling pathways involved in γ-globin gene induction using fetal hemoglobin inducer drugs. Int. J. Hematol. Oncol. Stem Cell. Res. 7 (3), 41–46. doi:10.1088/0143-0807/27/4/007
Ryu, M. S., Zhang, D., Protchenko, O., Shakoury-Elizeh, M., and Philpott, C. C. (2017). PCBP1 and NCOA4 regulate erythroid iron storage and heme biosynthesis. J. Clin. Investig. 127 (5), 1786–1797. doi:10.1172/JCI90519
Sankaran, V. G., Menne, T. F., Xu, J., Akie, T. E., Lettre, G., Van Handel, B., et al. (2008). Human fetal hemoglobin expression is regulated by the developmental stage-specific repressor BCL11A. Science 322 (5909), 1839–1842. doi:10.1126/science.1165409
Srivastava, S., Kumar, P., Paul, R., and Debnath, P. (2022). Effect of change in individual and household level characteristics on anemia prevalence among adolescent boys and girls in India. BMC Public Health 22 (1), 1478. doi:10.1186/s12889-022-13863-w
Starzyński, R. R., Canonne-Hergaux, F., Lenartowicz, M., Krzeptowski, W., Willemetz, A., Styś, A., et al. (2013). Ferroportin expression in haem oxygenase 1-deficient mice. Biochem. J. 449 (1), 69–78. doi:10.1042/BJ20121139
Stelzer, G., Rosen, N., Plaschkes, I., Zimmerman, S., Twik, M., Fishilevich, S., et al. (2016). The GeneCards suite: from gene data mining to disease genome sequence analyses. Curr. Protoc. Bioinforma. 54 (1), 30 1–1 30 33. doi:10.1002/cpbi.5
Su, G., Yang, W., Wang, S., Geng, C., and Guan, X. (2021). SIRT1-autophagy axis inhibits excess iron-induced ferroptosis of foam cells and subsequently increases IL-1Β and IL-18. Biochem. Biophys. Res. Commun. 561, 33–39. doi:10.1016/j.bbrc.2021.05.011
Sugimoto, A., Yamamoto, M., Suzuki, M., Inoue, T., Nakamura, S., Motoda, R., et al. (2006). Delta-4 Notch ligand promotes erythroid differentiation of human umbilical cord blood CD34+ cells. Exp. Hematol. 34 (4), 424–432. doi:10.1016/j.exphem.2005.12.016
Toyokuni, S., Kong, Y., Zheng, H., Maeda, Y., Katabuchi, M., and Motooka, Y. (2023). Three-dimensional regulation of ferroptosis at the intersection of iron, sulfur, and oxygen executing scrap and build toward evolution. Antioxid. Redox Signal 39, 807–815. doi:10.1089/ars.2022.0142
Vakoc, C. R., Letting, D. L., Gheldof, N., Sawado, T., Bender, M. A., Groudine, M., et al. (2005). Proximity among distant regulatory elements at the beta-globin locus requires GATA-1 and FOG-1. Mol. Cell. 17 (3), 453–462. doi:10.1016/j.molcel.2004.12.028
Vallurupalli, M., MacFadyen, J. G., Glynn, R. J., Thuren, T., Libby, P., Berliner, N., et al. (2020). Effects of interleukin-1β inhibition on incident anemia: exploratory analyses from a randomized trial. Ann. Intern Med. 172 (8), 523–532. doi:10.7326/M19-2945
Wang, Y., Zheng, L., Shang, W., Yang, Z., Li, T., Liu, F., et al. (2022). Wnt/beta-catenin signaling confers ferroptosis resistance by targeting GPX4 in gastric cancer. Cell. Death Differ. 29 (11), 2190–2202. doi:10.1038/s41418-022-01008-w
Wilkerson, M. D., and Hayes, D. N. (2010). ConsensusClusterPlus: a class discovery tool with confidence assessments and item tracking. Bioinformatics 26 (12), 1572–1573. doi:10.1093/bioinformatics/btq170
Xu, C., He, J., Wang, H., Zhang, Y., Wu, J., Zhao, L., et al. (2022). Single-cell transcriptomic analysis identifies an immune-prone population in erythroid precursors during human ontogenesis. Nat. Immunol. 23 (7), 1109–1120. doi:10.1038/s41590-022-01245-8
Yi, T., Li, J., Chen, H., Wu, J., An, J., Xu, Y., et al. (2015). Splenic dendritic cells survey red blood cells for missing self-CD47 to trigger adaptive immune responses. Immunity 43 (4), 764–775. doi:10.1016/j.immuni.2015.08.021
Yu, G., Wang, L. G., Han, Y., and He, Q. Y. (2012). clusterProfiler: an R package for comparing biological themes among gene clusters. OMICS 16 (5), 284–287. doi:10.1089/omi.2011.0118
Zhang, H., Meltzer, P., and Davis, S. (2013). RCircos: an R package for Circos 2D track plots. BMC Bioinforma. 14, 244. doi:10.1186/1471-2105-14-244
Zhang, H., Wan, G. Z., Wang, Y. Y., Chen, W., and Guan, J. Z. (2022c). The role of erythrocytes and erythroid progenitor cells in tumors. Open Life Sci. 17 (1), 1641–1656. doi:10.1515/biol-2022-0102
Zhang, J., Zheng, Y., Wang, Y., Wang, J., Sang, A., Song, X., et al. (2022b). YAP1 alleviates sepsis-induced acute lung injury via inhibiting ferritinophagy-mediated ferroptosis. Front. Immunol. 13, 884362. doi:10.3389/fimmu.2022.884362
Zhang, X., Yang, L., Deng, Y., Huang, Z., Huang, H., Wu, Y., et al. (2023). Single-cell RNA-Seq and bulk RNA-Seq reveal reliable diagnostic and prognostic biomarkers for CRC. J. Cancer Res. Clin. Oncol. 149 (12), 9805–9821. doi:10.1007/s00432-023-04882-0
Zhang, Y., Swanda, R. V., Nie, L., Liu, X., Wang, C., Lee, H., et al. (2021). mTORC1 couples cyst(e)ine availability with GPX4 protein synthesis and ferroptosis regulation. Nat. Commun. 12 (1), 1589. doi:10.1038/s41467-021-21841-w
Zhang, Y., Xu, Y., Zhang, S., Lu, Z., Li, Y., and Zhao, B. (2022a). The regulation roles of Ca(2+) in erythropoiesis: what have we learned? Exp. Hematol. 106, 19–30. doi:10.1016/j.exphem.2021.12.192
Zheng, H., Jiang, L., Tsuduki, T., Conrad, M., and Toyokuni, S. (2021). Embryonal erythropoiesis and aging exploit ferroptosis. Redox Biol. 48, 102175. doi:10.1016/j.redox.2021.102175
Zhou, N., and Bao, J. (2020). FerrDb: a manually curated resource for regulators and markers of ferroptosis and ferroptosis-disease associations. Database (Oxford) 2020, baaa021. doi:10.1093/database/baaa021
Zhou, T., Xie, Y., Hou, X., Bai, W., Li, X., Liu, Z., et al. (2023). Irbesartan overcomes gemcitabine resistance in pancreatic cancer by suppressing stemness and iron metabolism via inhibition of the Hippo/YAP1/c-Jun axis. J. Exp. Clin. Cancer Res. 42 (1), 111. doi:10.1186/s13046-023-02671-8
Keywords: ferroptosis, erythrocyte differentiation, human umbilical cord blood-derived CD34+ cell, immunocyte infiltration, bioinformatic analysis
Citation: Liu Q, Lin Z, Yue M, Wu J, Li L, Huang D, Fang Y, Zhang X and Hao T (2024) Identification and validation of ferroptosis related markers in erythrocyte differentiation of umbilical cord blood-derived CD34+ cell by bioinformatic analysis. Front. Genet. 15:1365232. doi: 10.3389/fgene.2024.1365232
Received: 04 January 2024; Accepted: 09 July 2024;
Published: 30 July 2024.
Edited by:
Gary S. Stein, University of Vermont, United StatesReviewed by:
Maria Rosa Lidonnici, San Raffaele Telethon Institute for Gene Therapy (SR-Tiget), ItalyCopyright © 2024 Liu, Lin, Yue, Wu, Li, Huang, Fang, Zhang and Hao. This is an open-access article distributed under the terms of the Creative Commons Attribution License (CC BY). The use, distribution or reproduction in other forums is permitted, provided the original author(s) and the copyright owner(s) are credited and that the original publication in this journal is cited, in accordance with accepted academic practice. No use, distribution or reproduction is permitted which does not comply with these terms.
*Correspondence: Xin Zhang, d2FsdGVyemhhbmd4QDEzOS5jb20=; Tao Hao, aHRqbnVAc3R1MjAyMC5qbnUuZWR1LmNu
†These authors have contributed equally to this work
Disclaimer: All claims expressed in this article are solely those of the authors and do not necessarily represent those of their affiliated organizations, or those of the publisher, the editors and the reviewers. Any product that may be evaluated in this article or claim that may be made by its manufacturer is not guaranteed or endorsed by the publisher.
Research integrity at Frontiers
Learn more about the work of our research integrity team to safeguard the quality of each article we publish.