 Kyle Gardiner1
 Xuekui Zhang
 Li Xing
- 1Department of Mathematics and Statistics, University of Saskatchewan, Saskatoon, SK, Canada
- 2Department of Mathematics and Statistics, University of Victoria, Victoria, BC, Canada
The traditional single nucleotide polymorphism (SNP)-wise approach in genome-wide association studies is focused on examining the marginal association between each SNP with the outcome separately and applying multiple testing adjustments to the resulting p-values to reduce false positives. However, the approach suffers a lack of power in identifying biomarkers. We design an ensemble machine learning approach to aggregate results from logistic regression models based on multiple subsamples, which helps to identify biomarkers from high-dimensional genomic data. We use different methods to analyze a genome-wide association study from the Alzheimer’s Disease Neuroimaging Initiative. The SNP-wise approach does not identify any significant signal, while our novel approach provides a list of ranked SNPs associated with the cognitive functions of interests.
1 Introduction
Genome-wide association studies (GWASs) are used to identify associations between genetic variations and diseases/traits of interest. A commonly used approach is the SNP-wise approach, which involves surveying single nucleotide polymorphisms (SNPs) that comprise the genome to locate ones associated with the outcome via regression models Uffelmann et al. (2021). To avoid inflation of false positives, multiple testing adjustments, such as a Bonferroni adjustment or false discovery rate (FDR) control, are carried out to the resulting p-values from these numerous SNP-wise hypothesis testings Benjamini and Hochberg (1995); Sesia et al. (2021); Uffelmann et al. (2021). However, after multiple testing adjustments, barely any associations are detected, especially for small-sized and medium-sized data Hong and Park (2012). The proposed solutions in literature for combatting these low-powered GWASs include only testing a subset of these SNPs given some prior knowledge, increasing p-value thresholds, and increasing sample size to increase the power of detecting signals Johnson et al. (2010); Uffelmann et al. (2021); Wei et al. (2009). However, the first two solutions are affected by subject opinions, and available resources determine the sample size of a study.
The advance of machine learning algorithms provides researchers with great toolkits to extract information from high-dimensional data. So, instead of looking at the marginal association between the outcome variable and each SNP separately, advanced machine learning methods can handle many SNPs simultaneously and select important ones from them while maintaining great accuracy in prediction. For example, random forest uses multiple decision trees as its base learners to combine prediction power for more accurate prediction, and it can also provide a list of SNPs ranked based on the importance of the association with the outcome variable Breiman (2001).
In this paper, we propose a novel algorithm named Bagged Logistic Regression (BLESS), which can help identify important features/SNPs when traditional SNP-wise association testing struggles. This approach leverages bootstrapping techniques to fit logistic regression models as its base learners on subsamples of the data. This enables the assessment of SNP effects within each subsample, followed by checking if the resulting p-values exceed a threshold after multiple testing adjustments from all subsamples. The outcome is a ranked list of SNPs based on their adjusted p-value. The bootstrap aggregation (bagging) approach brings new insights to the GWAS analysis.
BLESS is an ensemble algorithm that combines multiple model outputs to reduce variability and provide a more comprehensive representation of the data. In addition, BLESS can handle high-dimensional data by subsetting it into more manageable sets, which diminishes the need for extensive computational resource allocation and assists in avoiding issues of correlation and multicollinearity between SNPs. Finally, BLESS is capable of finding notable associated features even in small sample sizes, making it a convenient approach since small/medium-sized datasets are common in GWAS.
The rest of the article is organized as below. Section 2 explains materials and methods, including datasets for method illustration, the traditional SNP-wise approach, random forest, and our novel BLESS algorithm approach for GWAS. Section 3 contains a simulation study with the design and results. Section 4 is data application, where we use these methods in our ADNI datasets to identify SNPs significantly associated with the outcome of cognitive impairment. At last, Section 5 discusses the implications of the BLESS algorithm and future directions.
2 Materials and methods
2.1 Data and outcome
Data used in this article are obtained from the Alzheimer’s Disease Neuroimaging Initiative (ADNI) database (https:/adni.loni.usc.edu). The two particular datasets used are from ADNI Department of Defence (ADNI DoD) and ADNI2/Grand Opportunities (ADNI2_GO). These datasets contain rich information on genotypes, phenotypes, demographics, and cognitive assessments of 197 and 236 participants, respectively.
The outcome of interest to this study is the cognitive measure of Clinical Dementia Rating (CDR). CDR is a 5-point scale that provides a standardized way to characterize the severity of dementia, i.e., 0 = none, 0.5 = questionable, 1 = mild, 2 = moderate, and 3 = severe Hughes et al. (1982); Morris (1993). The measurement assesses a variety of cognitive domains, such as “…memory, orientation, judgment and problem-solving, community affairs, home and hobbies, and personal care” (Hughes et al., 1982; Morris (1993, 1997)). Due to a severe positive skewness of the original CDR scores in both cohorts (in ADNI DoD, kurtosis = 11.321 and skewness = 2.547; in ADNI2_GO, kurtosis = 3.294 and skewness = 1.642), the commonly used data transformation functions such as log and square root are unable to make the data symmetric. Therefore, we dichotomize the CDR scores into two categories based on a predetermined threshold of 0.5, outlined by Hughes et al. and O’Bryant et al. O’Bryant et al. (2008). That is, a person with scores
For the genotypes, in both cohorts, quality control (QC) is conducted by using the popular PLINK Purcell et al. (2007) software, which included removing individuals and SNPs with high percentage of missing values and low minor allele frequencies, filtering SNPs that deviated from the Hardy-Weinberg equilibrium Edwards (2008), and removing females from the data, as they were the extreme minority. Moreover, principal component analysis (PCA) of genotypes is conducted, and the top 5 principal components (PCs) are included in the model to account for the population stratification Price et al. (2006). Table 1 contains a detailed summary of the QC procedures.
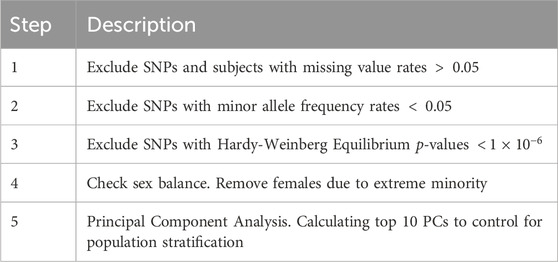
Table 1. Detailed summary of the QC procedures.
The covariates included in this study are age, ethnicity, Apolipoprotein E4 (ApoE4), Mini-Mental State Examination (MMSE), Alzheimer’s Disease Assessment Scale (ADAS) and the top 5 principal components (PCs) from PCA. ApoE4 is a gene variant strongly associated with the onset of Alzheimer’s Disease (AD) Corder et al. (1993). Additionally, MMSE and ADAS are both commonly used assessments of cognitive function, particularly in the context of AD and dementia Folstein et al. (1975); Rosen et al. (1984). Note that simple imputation is used to deal with variables with a small proportion of missing values, where mode is imputed for categorical variables and mean is imputed for continuous variables. Tables 2, 3 outline the summary statistics stratified based on CDR groups for each cohort.
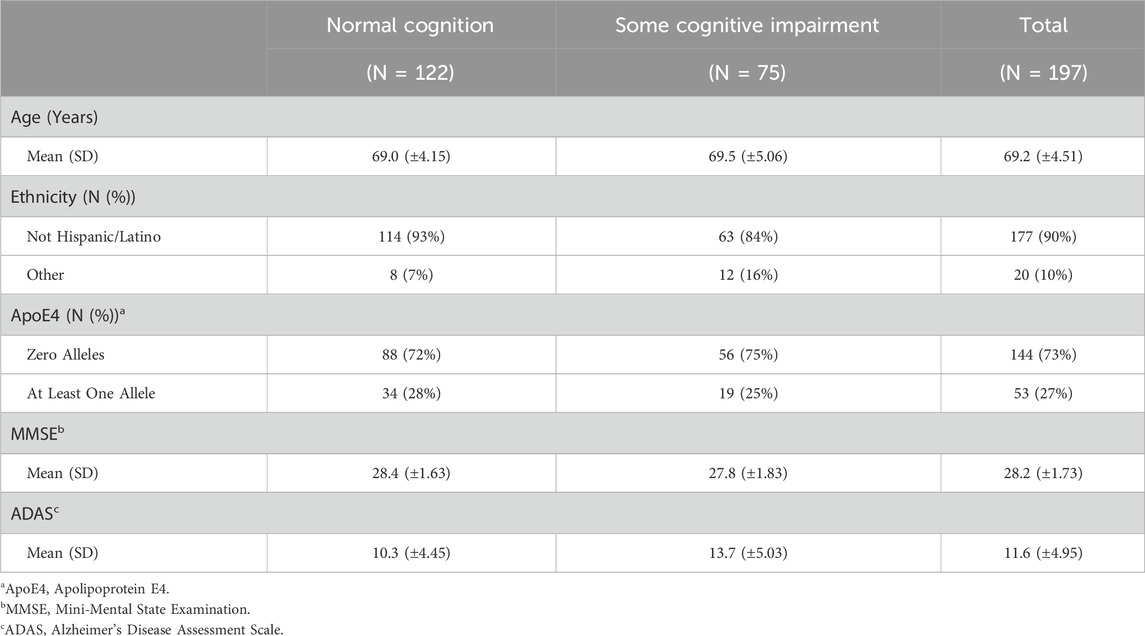
Table 2. Summary statistics for ADNI DoD data.
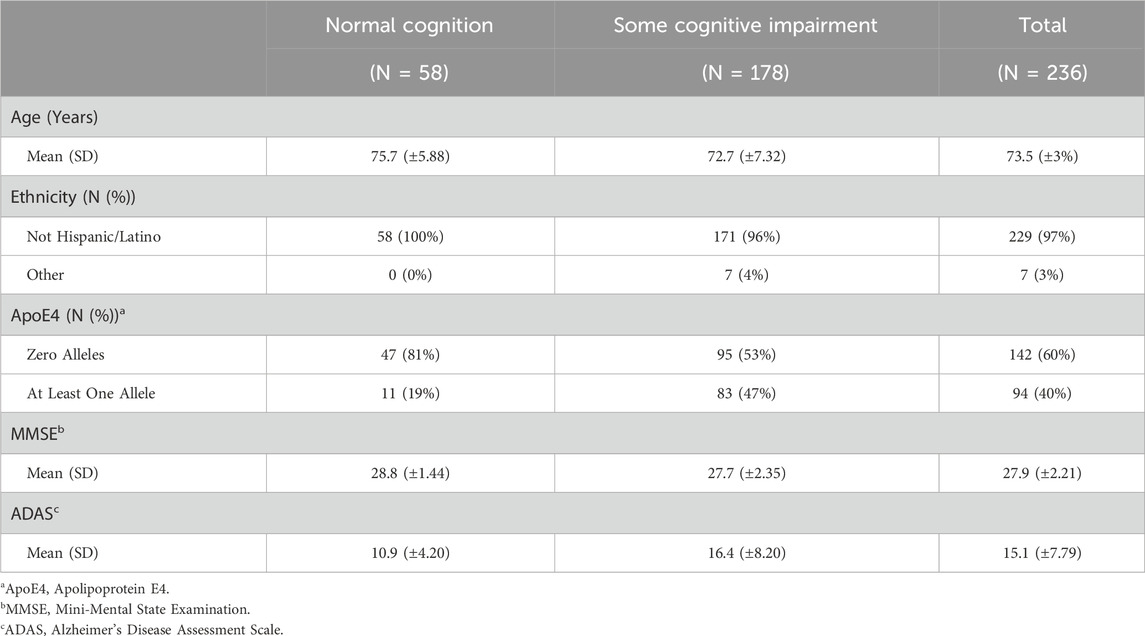
Table 3. Summary statistics for ADNI2_GO data.
2.2 SNP-wise approach
The traditional SNP-wise approach involves applying regression models to evaluate the associations of each SNP individually to the outcome of interest. These regression models are often adjusted by various covariates. For example, logistic regression models would be used in this study, as the outcome variable is binary. These models would be adjusted by the covariates outlined in Section 2.1. From there, multiple testing adjustments must be utilized to the resulting p-values in order to reduce false positives Benjamini and Hochberg (1995); Uffelmann et al. (2021).
This approach suffers stringent penalties from some multiple testing adjustments and the invalid assumptions of independence among the hypotheses testing required by multiple testing procedures, leading to a lack of power in identifying important signals from small or medium-sized data. Despite these issues, this approach has the benefit of ranking the SNPs based on their marginal associations, which results in taking the top SNPs for further analysis Li (2008).
2.3 Random forest
Random forest is a powerful ensemble learning method that has been gaining traction due to its ability to make robust and accurate predictions. As mentioned, random forest combines the predictive power of multiple decision trees to make more accurate final predictions. By making use of bagging and random feature selection, random forest reduces model overfitting and increases generalizability to unseen data Breiman (2001).
Using the randomForest package in R, Liaw and Wiener (2002) we can specify the number of decision trees built as well as assess the importance of SNPs based on two measurements, mean decrease accuracy and mean decrease Gini. Mean decrease accuracy refers to the reduction in accuracy when a particular feature is permuted. Mean decrease Gini refers to the decrease in Gini impurity, which measures the probability of misclassifying the label of a randomly chosen element within a set of data points Mola and Siciliano (1997); Yuan et al. (2021). Essentially, larger values on both measures signify important features Han et al. (2016).
2.4 BLESS algorithm
The BLESS algorithm utilizes an ensemble approach similar to random forest, where the base model is a logistic regression model instead of a decision tree. Figure 1 provides an architecture of the BLESS algorithm. The BLESS algorithm uses bootstrap subsampling without replacement and subsets the features, which randomly selects a subset of all features Pathical and Serpen (2010). These approaches can alleviate the issue of correlation and collinearity between features and improve model performance. These data subsets are then used to build logistic regression models, where the aggregated results, over multiple iterations, are subjected to FDR multiple testing adjustments, effectively creating a ranked list of features associated with the outcome.
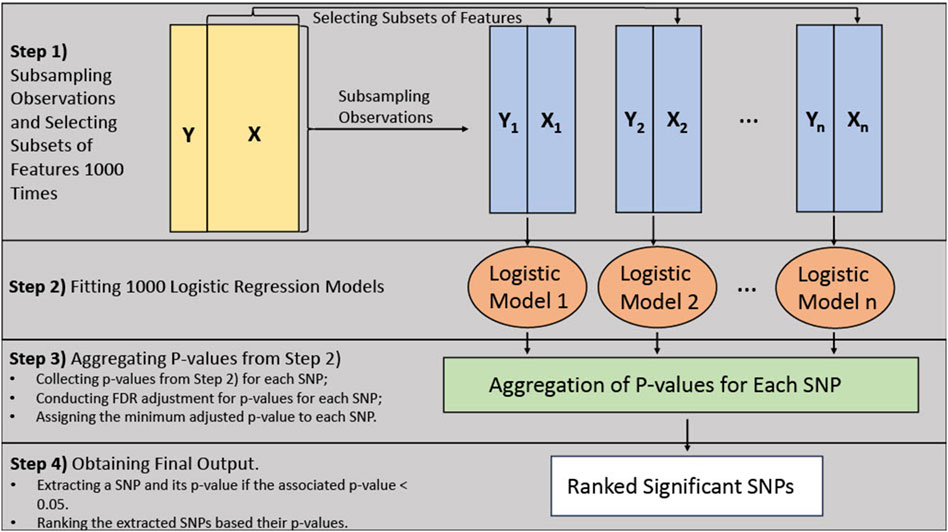
Figure 1. Bless algorithm architecture.
Figure 1 demonstrates the architecture of the algorithm. In Step 1, a percentage (say 90%) of the observations and approximately the square root of the number of features (i.e., SNPs) are randomly subsampled 1000 times/iterations. Each subsample also contains the covariates of interest. For Step 2, a logistic regression model is fitted, using each of the resulting datasets from Step 1, to estimate the effects of the selected features in the dataset on the outcome variable. This process results in numerous statistical tests on SNPs through the 1000 logistic regression models. Within Step 3, we conduct the FDR multiple testing adjustments to the group of p-values for each SNP carried out from the previous step. We dynamically adjust the p-values for multiple tests by accounting for the fluctuating number of comparisons for each SNP. For example, if an SNP were selected for 100 out of the 1000 iterations, then 100 would be the number of tests for multiple testing adjustments. Finally, if any adjusted p-values exceed the threshold of 0.05, the corresponding SNP is identified as a significant signal and included in the final list. Moreover, among the selected SNPs, the minimum adjusted value within the group of p-values for that SNP is incorporated in the final list. This process aids in the creation of a ranked list based on these adjusted p-values in Step 4.
It should be noted the BLESS algorithm has the flexibility to increase the number of iterations. Augmenting the number of iterations can ensure each feature or genetic variant has ample opportunity to be accounted for when randomly sampling the features.
3 Simulation study
3.1 Simulation design
We carry out simulation studies to test the ability of our novel BLESS algorithm to identify the significant SNPs. We first build a blueprint model based on the ADNI DoD cohort. From the cohort, we identify the top 1000 SNPs from SNP-wise association testing based on their marginal effects. From the top 1000, we select the top 30 SNPs with their pairwise LD distances
where
For each simulated data, we apply the BLESS algorithm and obtain the list of significant SNPs for each dataset. To obtain the best combination of the tuning parameters in the BLESS algorithm, we vary the size of percentages as 80%, 90% and 100% and vary the number of selected features as 10, 30, and 50. Note that the percentages of 90% and the magic number 30 (i.e., approximately the square root of the total number of features considered) are recommended for the bagging method Liaw and Wiener (2002). Additionally, we consider increasing the number of input SNPs to 5000. Following the same setup as above, 3614 SNPs pass the filtering and are used to assess the algorithm’s performance.
We calculate the recall, precision, and accuracy for these lists of identified SNPs to assess the algorithm’s overall performance in identifying the true signals. Let true positive (TP) be the number of SNPs that BLESS can identify from the 30 blueprint SNPs, true negative (TN) be the number of SNPs that BLESS did not identify and were not in the blueprint SNPs, false positive (FP) be the number of SNPs BLESS identified and were not in the blueprint SNPs, and false negative (FN) be the number of SNPs from the blueprint SNPs that BLESS did not identify. The evaluation metrics are defined as the following.
As a comparison, we also carry out the SNP-wise approach to the generated data mentioned above, with adjustment of the resulting p-values based on an FDR adjustment. For this, the simulation metrics are set up the same as above.
3.2 Simulation results
Figure 2 shows the boxplots of the resulting recall, precision, and accuracy from simulation studies across various simulation settings when inputting 1000 SNPs. Supplementary Appendix Figure S7 in Supplementary Appendix 6.2 displays the similar results when inputting 5000 SNPs. In general, the BLESS algorithm provides high recall, low precision, and medium accuracy across all the simulation settings, indicating its ability to identify most of the original blueprint SNPs accurately but also possessing quite a bit of false positive signals. The best combination of the tuning parameters is 90% with 30 (the square root of the total features) based on a balanced performance of all metrics considered.
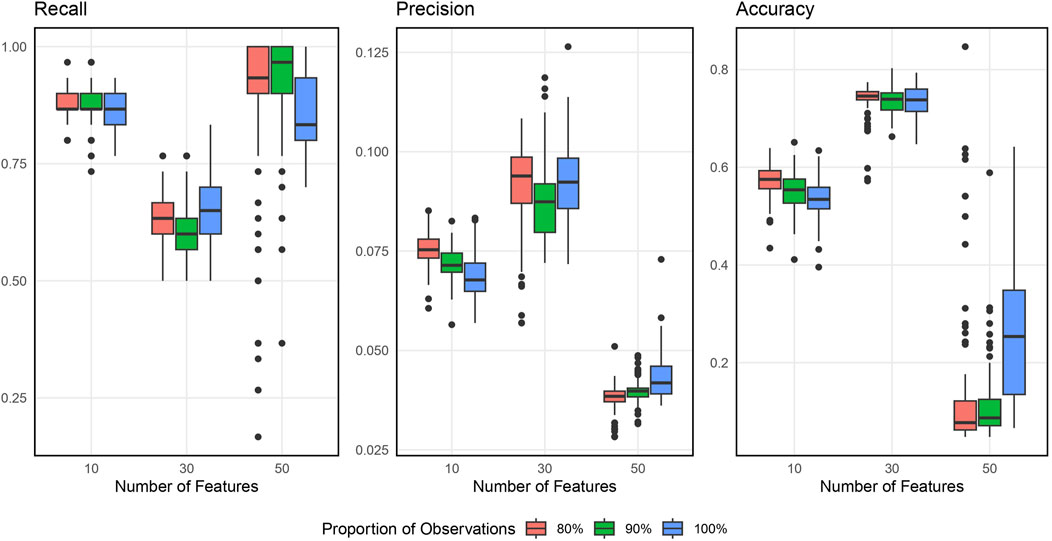
Figure 2. Boxplots of Evaluation Metrics from Simulation Studies for 1000 Input SNPs. The number of selected features varies as 10, 30, and 50, and the proportion of subsamples varies as 80%, 90% and 100%.
Figure 3 displays the simulation evaluation metrics for applying SNP-wise association testing with FDR multiple testing corrections when inputting 1000 SNPs. Supplementary Appendix Figure S8 (in Supplementary Appendix 6.2) does the same but for 5000 input SNPs. As shown, the SNP-wise approach has high recall, low precision and low accuracy indicating this method can identify nearly all the blueprint SNPs, but also a large number of false signals.
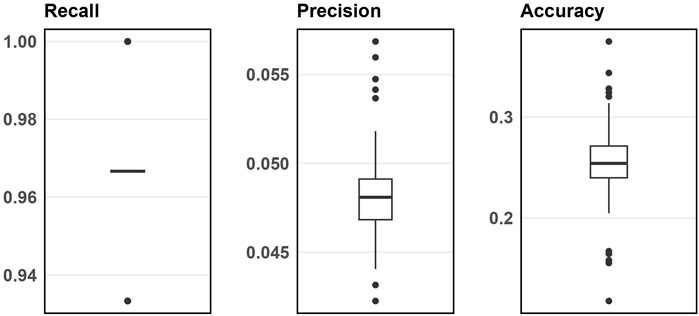
Figure 3. Boxplots of evaluation metrics from simulation studies for 1000 input SNPs from SNP-wise association testing.
From this result, BLESS generally performs better than the traditional SNP-wise approach when considering all the evaluation metrics. Now we apply the BLESS algorithm to real data.
4 Data application
We apply our BLESS algorithm to the two ADNI datasets introduced in Section 2.1 to demonstrate algorithm applications. For both cohorts, the outcome variable is the dichotomized CDR score indicating a normal or cognitive impairment status, and the included covariates are age, ApoE4, MMSE, ADAS, and the top 5 PCs. After the quality control, the genotyping data are included for analysis. ADNI DoD and ANDI2_GO contain the variables mentioned and the genetic information from 197 to 236 participants, respectively.
As for the analysis approach, we first apply SNP-wise association testing to both cohorts to assess their SNPs’ marginal effects associated with the binary CDR outcome. In particular, as stated previously in Section 2.2, logistic regression is used as the base model, which is adjusted by Age, MMSE scores, ADAS scores, ApoE4, Ethnicity, and the top 5 PCs, for each of the cohorts. We utilize this approach as a way to filter out the top 1000 SNPs for each group. From there, we apply both random forest and the BLESS algorithm to each filtered SNP list, comparing and contrasting the results between the two. Finally, GSEA is performed on the top 100 BLESS-identified SNPs, for ADNI DoD only, to highlight the importance of GSEA and further validate the BLESS algorithm’s ability to identify SNPs associated with cognitive impairment when traditional methods struggle.
Figure 4 is the Manhattan Plot for ADNI DoD. Due to the stringent multiple testing penalty and not reaching the genome-wide threshold, no significant SNPs are uncovered. Therefore, we carry the top SNPs to use with random forest and BLESS.
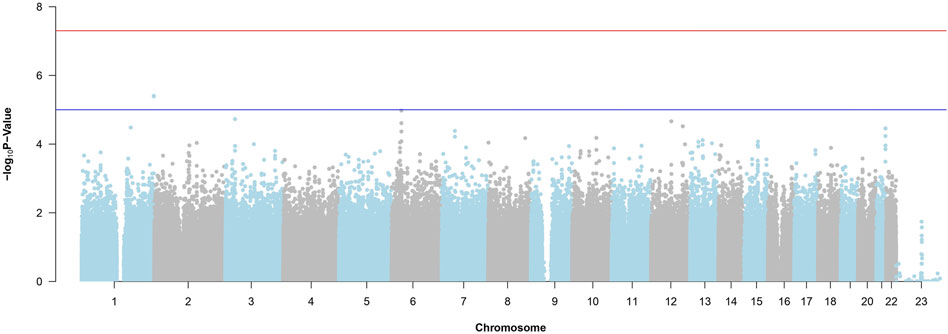
Figure 4. Manhattan Plot from the SNP-Wise Approach for ADNI DoD. The red horizontal line is the genome-wide significance threshold (p-value =
4.1 Random forest
For both cohorts, using the top 1000 SNPs and the covariates indicated above, the random forest models are built with 1000 trees. The results, based on the measurements in Section 2.3, are shown in Figures 5, 6. Additionally, Appendix 6.2 contains results from building the models with 5000 trees (Supplementary Appendix Figures S9, S10).

Figure 5. Dotchart Plot of Variable Importance from Random Forest for ADNI DoD. This model was built using 1000 trees.
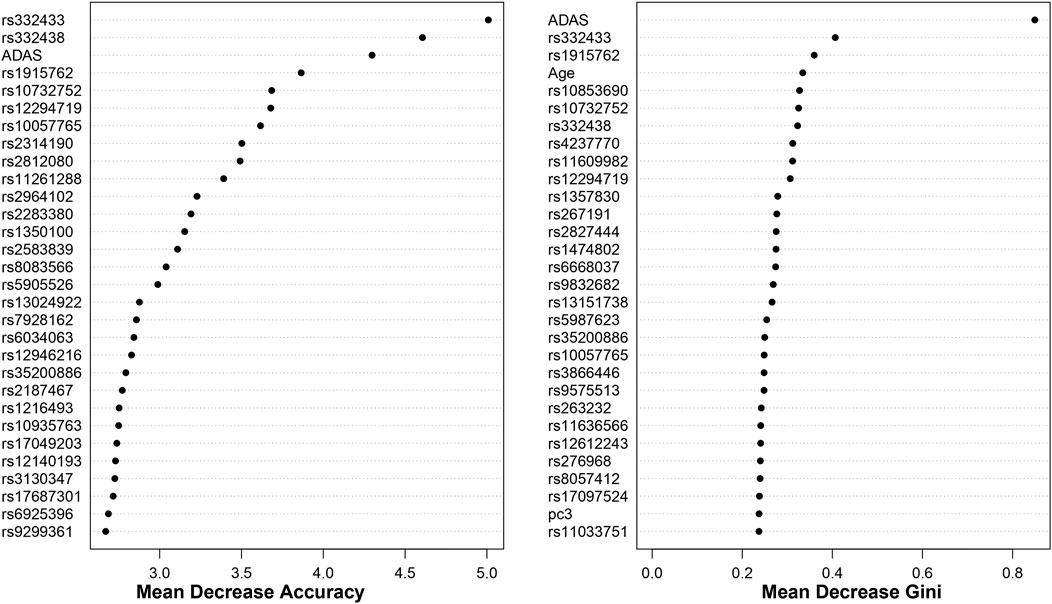
Figure 6. Dotchart Plot of Variable Importance from Random Forest for ADNI2_GO. This model was built using 1000 trees.
4.2 BLESS results
Based on the results in Section 3.2 and for simplicity, we utilize 1000 input SNPs. Taking the top 1000 SNPs from the SNP-wise approach, in addition to the covariates and outcome variable mentioned above, we apply the BLESS algorithm to them for each cohort. As outlined in Section 2.4, we randomly sample 90% of the observations and use a subset of approximately square root the number of SNPs (about 30 SNPs) for ADNI DoD and ADNI2_GO separately, while including the covariates as fixed effects for every iteration. Using the subsample of data, we fit the logistic regression base model. We then repeat this process 1000 times and aggregate the results. From there, we apply FDR multiple testing adjustment to each grouped SNP and extract the minimum adjusted p-value.
Tables 4, 5 display the top 10 features identified by BLESS for their respective cohort. These top 10 BLESS identified features are accompanied by their FDR-adjusted p-values (FDR-p), p-value from SNP-wise association testing, and the rank of that feature with respect to the top 1000 SNPs based on marginal effects.
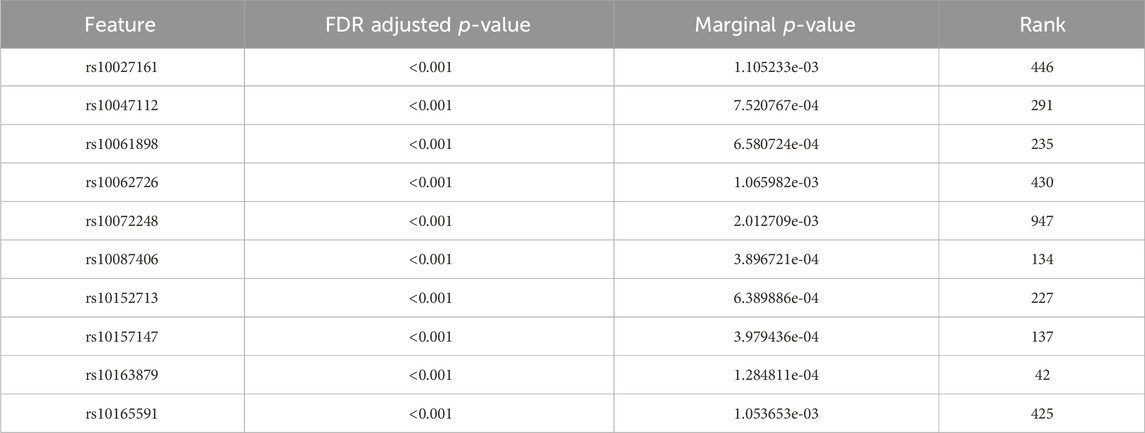
Table 4. Top 10 ranked features from the BLESS algorithm for ADNI DoD with 1000 iterations.
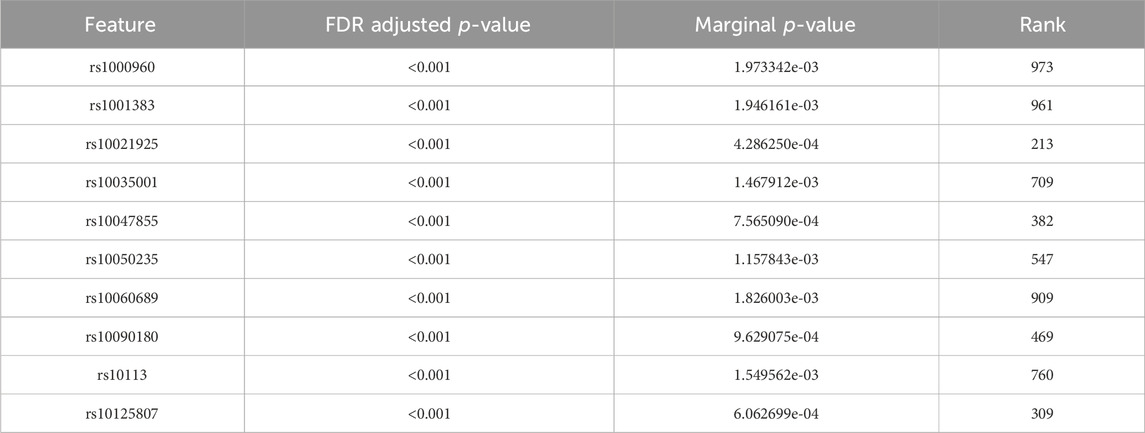
Table 5. Top 10 ranked features from the BLESS algorithm for ADNI2_GO with 1000 iterations.
Moreover, we identify some overlap by comparing the results between random forest and BLESS. For example, in the ADNI DoD group, BLESS-identified SNPs rs11161788 (FDR-p
Additionally, as discussed in Section 2.4, the number of iterations can be increased to enhance the probability that each feature is accurately accounted for. Supplementary Appendix Tables S6, S7 in Supplementary Appendix 6.1 show the results of augmenting the number of iterations in the BLESS algorithm to 5000.
4.3 Post-hoc analysis
SNP to gene mapping is essential for determining the biological impact of particular SNPs. The mapping allows for a clearer understanding of how each SNP is related to the disease/trait of interest. Using the popular web-based genomic tool, g:Profiler Raudvere et al. (2019), we input the top 100 BLESS-identified SNPs for ADNI DoD with 1000 iterations, to identify which genes those SNPs land on. From there, we investigate the designated genes to identify associations with cognitive decline related to AD. An Excel file with the mapped genes can be found in Supplementary Material.
Some of the BLESS results hold promising biological implications. For example, rs10807240 is mapped to Leucine Rich Repeat And Fibronectin Type III Domain Containing 2 (LRFN2). A case study conducted by Thevenon et al. resulted in the implication of LRFN2 to deficits in a variety of tasks related to attention, working memory, and executive function Thevenon et al. (2015). Additionally, LRFN2 has been associated with antisocial personality disorder Rautiainen et al. (2016) and autism Voineagu et al. (2011).
Furthermore, these trends have been identified in mice. LRFN2-deficient mice have displayed suppressed inhibitory synapse development in the hippocampus, one of the main brain regions responsible for memory formation, and autism-like behaviours such as sensory dysfunction, impaired communication skills and social withdrawal Li et al. (2018); Morimura et al. (2019). However, despite these findings, the knowledge behind the role of LRFN2 is limited, especially for humans, and therefore requires further investigation.
Moving on from LFRN2, rs11129016 is mapped to Zinc Finger Protein 385D (ZNF385D). A GWAS conducted by Eicher et al. identified multiple SNPs, which mapped to this gene, associated with reading disability and language impairment. These disorders introduce barriers that affect communication skills development. Additionally, Eicher et al. found ZNF385D markers associated with overall brain volume Eicher et al. (2013). Brain volume changes have been associated with changes in cognition. That is, volume loss has been associated with higher rates of annual memory loss, decline in verbal fluency, and reduced attention, visuospatial ability and executive function Armstrong et al. (2020). Finally, in an ADNI study, a couple of SNPs within this gene were associated with brain arteriolosclerosis. This disease is characterized by the thickening of arterial vessel walls in the brain and has been linked to worst MMSE and CDR scores Ighodaro et al. (2016).
5 Conclusion and discussion
This article introduces the BLESS algorithm, an alternative approach for identifying relevant SNPs that may have been missed from the SNP-wise approach. It employs ensemble machine-learning approaches that involve subsampling and subsetting data, fitting logistic regression models for each subset, and applying FDR multiple testing adjustments to the aggregated result from multiple iterations. One of the main motivations behind this algorithm is to create an approach that can be used in GWAS when the traditional SNP-wise approach may produce inconclusive results. Additionally, as we randomly select a subset of SNPs for an iteration, the BLESS algorithm can assist in avoiding issues of correlation and collinearity or linkage disequilibrium between SNPs.
Utilizing simulation studies, we demonstrate the BLESS algorithm’s ability to identify a good proportion of the simulation-generating SNPs (i.e., true signals). From there, we apply random forest and the BLESS algorithm to data from ADNI DoD and ADNI2_GO to identify SNPs related to the cognitive measure CDR that were missed in the SNP-wise approach. Notably, we emphasize the BLESS algorithm’s ability to provide a ranked list based on FDR-adjusted p-values. This approach not only captures comparable results to another bagging method but also offers additional significant features.
Finally, using the top-ranked features from BLESS for ADNI DoD, GSEA was performed to explore the biological implications of the identified SNPs. This analysis serves to reinforce the application of SNP to gene mapping and provides further validation for the performance of the BLESS algorithm.
Some of the limitations behind this approach lie in the subsampling used. When using subsampling for each iteration, many features are excluded from the model-building process. Since the data is randomly subsampled, there is a potential to miss features and/or only build a few models with relevant features. However, as mentioned, the number of iterations can be increased to ensure each feature has more opportunities to be sampled. Additionally, it may be theoretically challenging to determine the optimal number of iterations. By monitoring the results between sequential iterations and looking for signs of convergence, researchers can make decisions on the stopping criteria. However, this approach is data-specific and requires researchers’ subjective opinions on the signs of convergence. Future studies can explore more robust methods for identifying the optimal number of iterations.
In conclusion, BLESS can be used to identify associated SNPs when traditional SNP-wise approaches struggle. BLESS can also handle high-dimensional data, as well as utilize common small/medium-sized data. Moreover, since this algorithm can be treated as a general ensemble machine learning method, it can be applied to data in other research sections.
For the Alzheimer’s disease neuroimaging initiative
Data used in preparation of this article were obtained from the Alzheimer’s Disease Neuroimaging Initiative (ADNI) database (adni.loni.usc.edu). As such, the investigators within the ADNI contributed to the design and implementation of ADNI and/or provided data but did not participate in analysis or writing of this report. A complete listing of ADNI investigators can be found at: http://adni.loni.usc.edu/wpcontent/uploads/how_to_apply/ADNI_Acknowledgement_List.pdf.
Data availability statement
The data analyzed in this study is subject to the following licenses/restrictions: Authors obtained the data usage through an application process from the ADNI website. Requests to access these datasets should be directed to https://adni.loni.usc.edu/data-samples/access-data/#access_data.
Author contributions
KG: Formal Analysis, Software, Visualization, Validation, Writing–original draft, Writing–review and editing. XZ: Conceptualization, Funding acquisition, Methodology, Resources, Software, Supervision, Validation, Writing–review and editing. LX: Conceptualization, Funding acquisition, Methodology, Project administration, Resources, Software, Supervision, Validation, Visualization, Writing–review and editing.
Funding
The author(s) declare that financial support was received for the research, authorship, and/or publication of this article. This work is supported by the University of Saskatchewan internal funding, NSERC DG # RGPIN-2021-03530 (LX), the Canada Research Chair #CRC-2021-00232 (XZ), the Michael Smith Health Research BC Scholar: # SCH-2022-2553 (XZ), and NSERC CGS-M (KG). ADNI is funded by the National Institute on Aging, the National Institute of Biomedical Imaging and Bioengineering, and through generous contributions from the following: AbbVie, Alzheimer’s Association; Alzheimer’s Drug Discovery Foundation; Araclon Biotech; BioClinica, Inc.; Biogen; Bristol-Myers Squibb Company; CereSpir, Inc.; Cogstate; Eisai Inc.; Elan Pharmaceuticals, Inc.; Eli Lilly and Company; EuroImmun; F. Hoffmann-La Roche Ltd. and its affiliated company Genentech, Inc.; Fujirebio; GE Healthcare; IXICO Ltd.; Janssen Alzheimer Immunotherapy Research Development, LLC.; Johnson Pharmaceutical Research Development LLC.; Lumosity; Lundbeck; Merck Co., Inc.; Meso Scale Diagnostics, LLC.; NeuroRx Research; Neurotrack Technologies; Novartis Pharmaceuticals Corporation; Pfizer Inc.; Piramal Imaging; Servier; Takeda Pharmaceutical Company; and Transition Therapeutics. The Canadian Institutes of Health Research is providing funds to support ADNI clinical sites in Canada. Private sector contributions are facilitated by the Foundation for the National Institutes of Health (www.fnih.org). The grantee organization is the Northern California Institute for Research and Education, and the study is coordinated by the Alzheimer’s Therapeutic Research Institute at the University of Southern California. ADNI data are disseminated by the Laboratory for Neuro Imaging at the University of Southern California.
Acknowledgments
We acknowledge the Digital Research Alliance of Canada for providing the computational resources. Additionally, We would like to acknowledge this research is an extension of a PIMS VXML project, Genome-Wide Association Study on Gene Pathway Identification and Cognitive Function Prediction (https://vxml.pims.math.ca/projects/genome/). We would also like to acknowledge ADNI. Data collection and sharing for this project was funded by the Alzheimer’s Disease Neuroimaging Initiative (ADNI) (National Institutes of Health Grant U01 AG024904) and DOD ADNI (Department of Defense award number W81XWH-12-2-0012).
Conflict of interest
The authors declare that the research was conducted in the absence of any commercial or financial relationships that could be construed as a potential conflict of interest.
Publisher’s note
All claims expressed in this article are solely those of the authors and do not necessarily represent those of their affiliated organizations, or those of the publisher, the editors and the reviewers. Any product that may be evaluated in this article, or claim that may be made by its manufacturer, is not guaranteed or endorsed by the publisher.
Supplementary material
The Supplementary Material for this article can be found online at: https://www.frontiersin.org/articles/10.3389/fgene.2024.1336891/full#supplementary-material
References
Armstrong, N. M., An, Y., Shin, J. J., Williams, O. A., Doshi, J., Erus, G., et al. (2020). Associations between cognitive and brain volume changes in cognitively normal older adults. NeuroImage 223, 117289. doi:10.1016/j.neuroimage.2020.117289
Benjamini, Y., and Hochberg, Y. (1995). Controlling the false discovery rate: a practical and powerful approach to multiple testing. J. R. Stat. Soc. Ser. B Methodol. 57, 289–300. doi:10.1111/j.2517-6161.1995.tb02031.x
Corder, E. H., Saunders, A. M., Strittmatter, W. J., Schmechel, D. E., Gaskell, P. C., Small, G. W., et al. (1993). Gene dose of apolipoprotein e type 4 allele and the risk of alzheimer’s disease in late onset families. Science 261, 921–923. doi:10.1126/science.8346443
Edwards, A. (2008). Anecdotal, historical and critical commentaries on genetics: gh hardy (1908) and hardy–weinberg equilibrium. Genetics 179, 1143–1150. doi:10.1534/genetics.104.92940
Eicher, J. D., Powers, N. R., Miller, L. L., Akshoomoff, N., Amaral, D. G., Bloss, C. S., et al. (2013). Genome-wide association study of shared components of reading disability and language impairment. Genes, Brain Behav. 12, 792–801. doi:10.1111/gbb.12085
Folstein, M. F., Folstein, S. E., and McHugh, P. R. (1975). “mini-mental state”: a practical method for grading the cognitive state of patients for the clinician. J. Psychiatric Res. 12, 189–198. doi:10.1016/0022-3956(75)90026-6
Han, H., Guo, X., and Yu, H. (2016). “Variable selection using mean decrease accuracy and mean decrease gini based on random forest,” in 2016 7th IEEE International Conference on Software Engineering and Service Science (ICSESS), Beijing, 26-28 Aug. 2016, 219–224. doi:10.1109/ICSESS.2016.7883053
Hong, E., and Park, J. (2012). Sample size and statistical power calculation in genetic association studies. Genomics amp; Inf. 10, 117–122. doi:10.5808/gi.2012.10.2.117
Hughes, C. P., Berg, L., Danziger, W., Coben, L. A., and Martin, R. L. (1982). A new clinical scale for the staging of dementia. Br. J. Psychiatry 140, 566–572. doi:10.1192/bjp.140.6.566
Ighodaro, E. T., Abner, E. L., Fardo, D. W., Lin, A.-L., Katsumata, Y., Schmitt, F. A., et al. (2016). Risk factors and global cognitive status related to brain arteriolosclerosis in elderly individuals. J. Cereb. Blood Flow amp; Metabolism 37, 201–216. doi:10.1177/0271678x15621574
Johnson, R. C., Nelson, G. W., Troyer, J. L., Lautenberger, J. A., Kessing, B. D., Winkler, C. A., et al. (2010). Accounting for multiple comparisons in a genome-wide association study (gwas). BMC Genomics 11, 724. doi:10.1186/1471-2164-11-724
Li, J. (2008). Prioritize and select snps for association studies with multi-stage designs. J. Comput. Biol. 15, 241–257. doi:10.1089/cmb.2007.0090
Li, Y., Kim, R., Cho, Y. S., Song, W. S., Kim, D., Kim, K., et al. (2018). Lrfn2-mutant mice display suppressed synaptic plasticity and inhibitory synapse development and abnormal social communication and startle response. J. Neurosci. 38, 5872–5887. doi:10.1523/jneurosci.3321-17.2018
Mola, F., and Siciliano, R. (1997). A fast splitting procedure for classification trees. Statistics Comput. 7, 209–216. doi:10.1023/A:1018590219790
Morimura, N., Yasuda, H., Yamaguchi, K., Katayama, K.-I., Tomioka, N. H., Yamada, K., et al. (2019). Autism-like behaviors and enhanced memory formation and synaptic plasticity in lrfn2/salm1-deficient mice. IBRO Rep. 6, S144–S145. doi:10.1016/j.ibror.2019.07.460
Morris, J. C. (1993). The Clinical Dementia Rating (CDR): current version and scoring rules. Neurology 43, 2412–2414. doi:10.1212/wnl.43.11.2412-a
Morris, J. C. (1997). Clinical dementia rating: a reliable and valid diagnostic and staging measure for dementia of the alzheimer type. Int. Psychogeriatrics 9, 173–176. doi:10.1017/s1041610297004870
Mu, W., and Zhang, W. (2013). Molecular approaches, models, and techniques in pharmacogenomic research and development. Pharmacogenomics, 273–294. doi:10.1016/b978-0-12-391918-2.00008-1
O’Bryant, S. E., Waring, S. C., Munro Cullum, C., Hall, J., Lacritz, L., Massman, P. J., et al. (2008). Staging dementia using clinical dementia rating scale sum of boxes scores: a Texas alzheimer's research consortium study. Archives Neurology 65, 1091–1095. doi:10.1001/archneur.65.8.1091
Pathical, S., and Serpen, G. (2010). “Comparison of subsampling techniques for random subspace ensembles,” in 2010 international conference on machine learning and cybernetics, 1, 380–385. doi:10.1109/ICMLC.2010.5581032
Price, A. L., Patterson, N. J., Plenge, R. M., Weinblatt, M. E., Shadick, N. A., and Reich, D. (2006). Principal components analysis corrects for stratification in genome-wide association studies. Nat. Genet. 38, 904–909. doi:10.1038/ng1847
Purcell, S., Neale, B., Todd-Brown, K., Thomas, L., Ferreira, M. A., Bender, D., et al. (2007). Plink: a tool set for whole-genome association and population-based linkage analyses. Am. J. Hum. Genet. 81, 559–575. doi:10.1086/519795
Raudvere, U., Kolberg, L., Kuzmin, I., Arak, T., Adler, P., Peterson, H., et al. (2019). g: profiler: a web server for functional enrichment analysis and conversions of gene lists (2019 update). Nucleic acids Res. 47, W191–W198. doi:10.1093/nar/gkz369
Rautiainen, M.-R., Paunio, T., Repo-Tiihonen, E., Virkkunen, M., Ollila, H. M., Sulkava, S., et al. (2016). Genome-wide association study of antisocial personality disorder. Transl. Psychiatry 6, e883. doi:10.1038/tp.2016.155
Rosen, W., Mohs, R., and Davis, K. (1984). A new rating scale for alzheimer’s disease. Am. J. Psychiatry 141, 1356–1364. doi:10.1176/ajp.141.11.1356
Sesia, M., Bates, S., Candès, E., Marchini, J., and Sabatti, C. (2021). False discovery rate control in genome-wide association studies with population structure. Proc. Natl. Acad. Sci. 118, e2105841118. doi:10.1073/pnas.2105841118
Thevenon, J., Souchay, C., Seabold, G. K., Dygai-Cochet, I., Callier, P., Gay, S., et al. (2015). Heterozygous deletion of the lrfn2 gene is associated with working memory deficits. Eur. J. Hum. Genet. 24, 911–918. doi:10.1038/ejhg.2015.221
Uffelmann, E., Huang, Q. Q., Munung, N. S., de Vries, J., Okada, Y., Martin, A. R., et al. (2021). Genome-wide association studies. Nat. Rev. Methods Prim. 1, 59. doi:10.1038/s43586-021-00056-9
Voineagu, I., Wang, X., Johnston, P., Lowe, J. K., Tian, Y., Horvath, S., et al. (2011). Transcriptomic analysis of autistic brain reveals convergent molecular pathology. Nature 474, 380–384. doi:10.1038/nature10110
Wei, Z., Sun, W., Wang, K., and Hakonarson, H. (2009). Multiple testing in genome-wide association studies via hidden markov models. Bioinformatics 25, 2802–2808. doi:10.1093/bioinformatics/btp476
Keywords: ensemble learning, genome-wide association study, cognitive function, genomics biomarker, bagging (bootstrap aggregation)
Citation: Gardiner K, Zhang X and Xing L (2024) BLESS: bagged logistic regression for biomarker identification. Front. Genet. 15:1336891. doi: 10.3389/fgene.2024.1336891
Received: 11 November 2023; Accepted: 31 July 2024;
Published: 10 September 2024.
Edited by:
Lihui Zhao, Northwestern University, United StatesReviewed by:
Na Yu, Toronto Metropolitan University, CanadaGuohua Yan, University of New Brunswick Fredericton, Canada
Copyright © 2024 Gardiner, Zhang and Xing. This is an open-access article distributed under the terms of the Creative Commons Attribution License (CC BY). The use, distribution or reproduction in other forums is permitted, provided the original author(s) and the copyright owner(s) are credited and that the original publication in this journal is cited, in accordance with accepted academic practice. No use, distribution or reproduction is permitted which does not comply with these terms.
*Correspondence: Li Xing, bGl4NDkxQG1haWwudXNhc2suY2E=