 Everest Uriel Castaneda1,2
 Erich J. Baker3*
- 1Department of Biology, Baylor University, Waco, TX, United States
- 2School of Engineering and Computer Science, Baylor University, Waco, TX, United States
- 3Department of Mathematics and Computer Science, Belmont University, Nashville, TN, United States
Automating the recreation of gene and mixed gene-compound networks from Kyoto Encyclopedia of Genes and Genomes (KEGG) Markup Language (KGML) files is challenging because the data structure does not preserve the independent or loosely connected neighborhoods in which they were originally derived, referred to here as its topological environment. Identical accession numbers may overlap, causing neighborhoods to artificially collapse based on duplicated identifiers. This causes current parsers to create misleading or erroneous graphical representations when mixed gene networks are converted to gene-only networks. To overcome these challenges we created a python-based KEGG NetworkX Topological (KNeXT) parser that allows users to accurately recapitulate genetic networks and mixed networks from KGML map data. The software, archived as a python package index (PyPI) file to ensure broad application, is designed to ingest KGML files through built-in APIs and dynamically create high-fidelity topological representations. The utilization of NetworkX’s framework to generate tab-separated files additionally ensures that KNeXT results may be imported into other graph frameworks and maintain programmatic access to the original x-y axis positions to each node in the KEGG pathway. KNeXT is a well-described Python 3 package that allows users to rapidly download and aggregate specific KGML files and recreate KEGG pathways based on a range of user-defined settings. KNeXT is platform-independent, distinctive, and it is not written on top of other Python parsers. Furthermore, KNeXT enables users to parse entire local folders or single files through command line scripts and convert the output into NCBI or UniProt IDs. KNeXT provides an ability for researchers to generate pathway visualizations while persevering the original context of a KEGG pathway. Source code is freely available at https://github.com/everest-castaneda/knext.
1 Introduction
As network analyses become progressively feasible due to the increasing scalability and access to graph algorithms (Shannon et al., 2003; Lumsdaine et al., 2007; Hagberg et al., 2008) researchers are leveraging biological interaction graphs to derive new information, impute missing data, and drive decisions (Yue et al., 2019). Consequently, there often exists a need to visualize and extract information independent of a network’s original context and preserve the underlying graph structure to enable novel interrogation of the data (Bernstein et al., 2021).
Experimentally verified biological pathways play a key role in graphical analyses and are vital to hypothesis-testing and cross-validation experiments (Yu et al., 2017). One of the most widely used network pathway databases is the Kyoto Encyclopedia of Genes and Genomes (KEGG) (Kanehisa et al., 2022). KEGG hosts a series of experimentally verified and manually crafted biological pathways procured from various species and, most notably, all pathways can be externally downloaded as a network map written in KEGG Markup Language (KGML), a proprietary XML format. In order to parse, recreate, or convert KEGG pathways, KGML files require computational assistance for manipulation (Wrzodek et al., 2011). Currently, several software tools exist to parse KGML files: graphite, a bioconductor package which creates compound propagated genomic networks (Sales et al., 2012), CyKEGGParser, a Cytoscape application that fixes issues in KEGG-generated graphs (Nersisyan et al., 2014), KEGG2NET (Chanumolu et al., 2021), which converts KGML files into directed acyclic graphs, Biopython, a KGML parser for graphics rendering and data acquisition in Python (Cock et al., 2009), and KEGGParser, a MATLab-based parser and editor (Arakelyan and Nersisyan, 2013). Each parser fulfills a role in conforming, correcting, or converting pathways for use in other analyses, providing benefit where strict gene-only networks are required for input (Chen et al., 2017).
One fundamental challenge of creating automated KEGG parsers is to produce biologically-relevant representations of KGML pathways while maintaining the integrity of underlying data (Yu et al., 2017; Bernstein et al., 2021). Here we describe a python-based KEGG NetworkX Topological (KNeXT) parser that builds upon existing strategies by providing improved biologically-relevant representations of genetic networks and mixed networks from KGML data. To summarize, genetic networks are composed entirely of gene-gene interactions that avail themselves to semantic similarity analysis. (Díaz-Montaña et al., 2017). In contrast, mixed networks retain information regarding biological systems, such as interacting pathways, and chemical interactions Kanehisa et al. (2015). Due to the complex nature of KEGG graphs, parsers must produce output that can adapted for novel contexts, (Sales et al., 2012), and, furthermore, offer the ability to facilitate visualization, which is crucial for complex network data Sato et al. (2023). Hence, KNeXT converts KGML maps into tab-delimited files that are readily useable in other software analyses and visualization tools such as Cytoscape (Shannon et al., 2003) and NetworkX (Hagberg et al., 2008). An overarching difference between KNexT and other software is that it discriminates between genes and compounds in different topological configurations by utilizing the KGML file’s entry identifications as terminal modifiers. This allows users to derive networks in their original orientation and capture subgraphs. These topologies and overlapping nodes are a derivative of pathways which reflect spaciotemporally regulated complexes (Hurst et al., 2004) such as the cell cycle and cohesin loading (Litwin and Wysocki, 2018). KNexT features commands that enable users to recreate graphs as mixed networks or gene networks with compound propagation and “AND/OR group” parsing, similar to graphite (Sales et al., 2012). The resulting tab-delimited edge list also features notations of interactions that are derived from compound propagation or clique isolation and, if applicable, the original weights derived from the KGML file. KNeXT additionally provides access to a dictionary of nodes and their x-y axis coordinates for aiding in re-creation of the original KEGG layout in NetworkX.
2 Materials and methods
2.1 Overview
KNeXT is implemented in Python3 (v.3.9) and uses the NetworkX library (v.3.1) (Hagberg et al., 2008) for creating gene-only networks. Users may use the embedded KNeXT command, get-kgml, see Table 1 for a complete list of KNeXT commands, to retrieve species-specific KGML files using KEGG’s application program interface (API). Alternatively, users may specify local KGML files or directories as source materials. Pathway reconstruction is handled by the NetworkX shortest path framework. This approach implements compound propagation as described in (Sales et al., 2012) and Figure 1 to remove compounds from the network and avoid disconnected graph representations, and convert “AND/OR” type interactions into individual nodes (Sales et al., 2012). The shortest path framework is also used when transiting groups with undefined KEGG Orthology (KO) accession numbers.
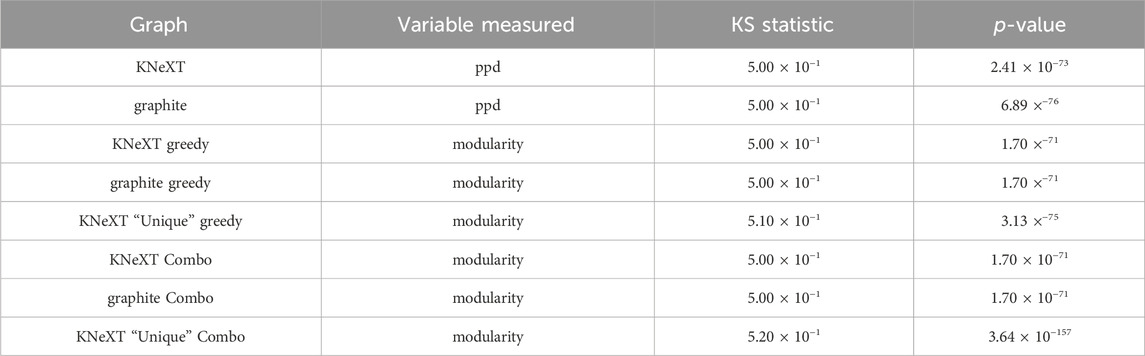
TABLE 1. Summary statistics for all Kolmorogov-Smirnov tests for normality.
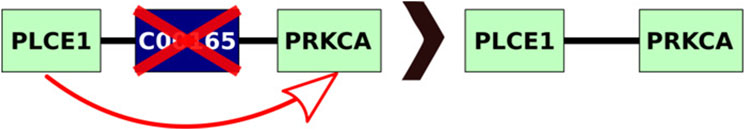
FIGURE 1. Example compound propagation. As described, KNeXT propagates genes by attaching edges between genes and then deleting the compound. KNeXT always retains unique identifiers in compounds, but for simplicity, the compound illustrated does not contain an entry identification number. KNeXT uses the shortest path algorithm in NetworkX to automate the propagation of compounds.
2.2 Parsing and output
KNeXT enables users to recreate KEGG pathways in the form of gene-gene networks or mixed networks consisting of a combination of genes, compounds, and pathways. See Figure 2 for an example of KNeXT’s process and Table 2 for programmatic descriptions.
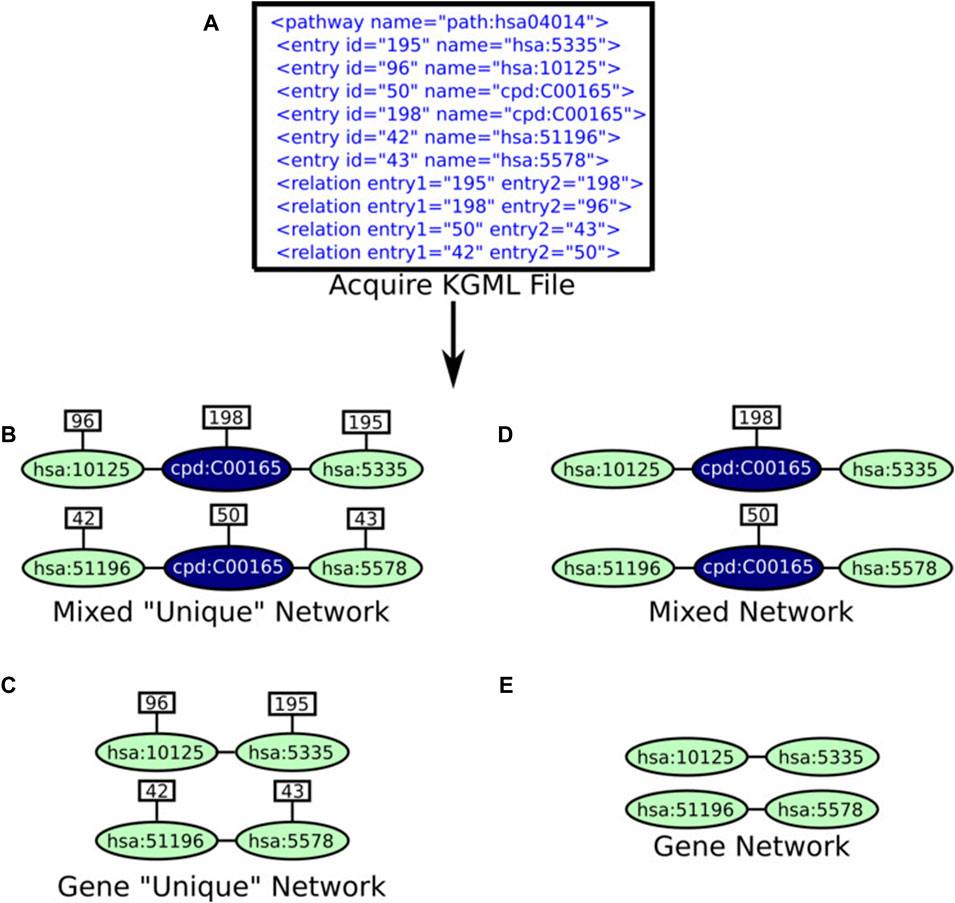
FIGURE 2. KNeXT’s schematic. (A). KNeXT may acquire the KGML file or the user may use a downloaded KGML file as input. After, KNeXT parses the input then creates edges between genes, compounds, or other represented entities and attaches the entry identifier (id). There are four different outputs, which include the following: mixed, mixed unique, genes, and genes unique. (B). The mixed “unique” network retains all entry ids as well as non-genomic entities such as compounds. (C). The gene “unique” network retains only genes entities while also keeping entry ids to differentiate between genes involved in differing spatial topologies. (D). The mixed network retains the entry ids for compounds to retain differentiation while removing all entry ids from gene entities. (E). The gene network removes all entry ids, which is a similar output to graphite’s gene network.
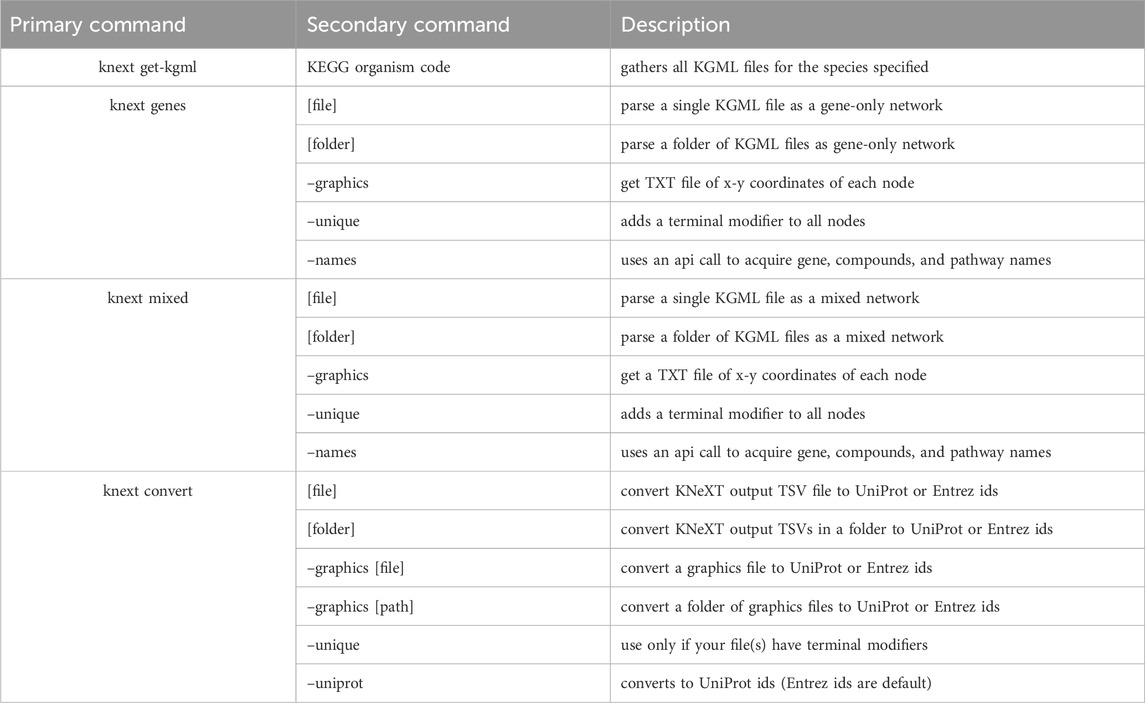
TABLE 2. Commands and descriptions.
For gene only networks, KNeXT outputs a tab-separated value (TSV) file consisting of source and target gene with appropriate metadata, see Table 3 for example, Users may, in turn, visualize gene-gene output using NetworkX’s standard visualization libraries. Users wishing to maintain compounds, genes, and pathways may use the mixed command to output source and sink relationships, see Table 4 for an example. Lastly, using the–names command adds a “names” column for each accession, which enhances the ability to edit data, see Table 5.
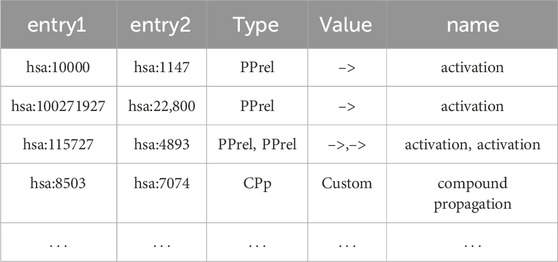
TABLE 3. Example dataframe of gene-only network with metadata.

TABLE 4. Example dataframe of mixed networks with metadata.
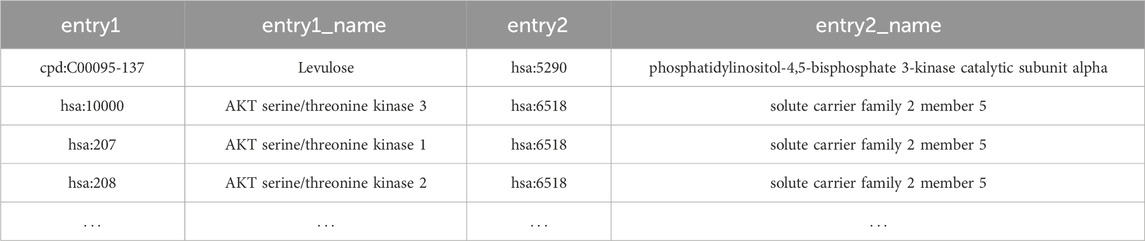
TABLE 5. Example dataframe of mixed compounds and genes along with their and gene and compound names.
For both gene-only and mixed-graphs, the–unique flag will generate a pathway with all genes and compounds with unique identifiers to avoid overlapping nodes. KNeXT does this by attaching unique terminal identifiers to each entry, ensuring that distal nodes are not bridged after compound propagation, see 2 B-C. Additionally, the terminal modifiers create distinct nodes that recapitulate correct positioning for pathway visualization. Users have the ability to use a–graphics flag to generate a dictionary of each node and its x-y coordinates, see Table 6 for an example. The resulting dictionary allows NetworkX to readily recapitulate KEGG style network visualization. All output can be readily converted into equivalent identifiers from other databases using the convert command. The conversion tool utilizes KEGG’s API to retrieve and map identifiers from Entrez (Sayers et al., 2022) and UniProtKB (The UniProt Consortium, 2023) IDs.
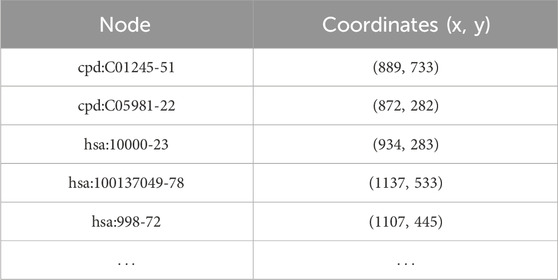
TABLE 6. Longform output of programmatic access to feature positions for input into NetworkX.
2.3 Data acquisition
Graphite version 1.48.0 was used for all pathway analysis. Since graphite contains its own database of pathways gathered from KEGG Sales et al. (2012), we captured 313 human pathways that are shared between both sources. See Supplementary Table S1 for a complete listing of all KEGG codes for each pathway used in this study and for R code used to export all pathways from the R environment. In addition, we created a ground truth graph using data from the UCSC Genome Browser using their filter to retrieve only database supported information (Kent et al., 2022). For simplicity, all relationships are represented as weightless undirected acyclic graphs.
2.4 Pathway analysis and statistical testing
We used two metrics for pathway analysis, per pathway difference (ppd) and modularity. For our analysis of ppd, we used the following:
2.5 Community detection
One feature of KNeXT is its ability to parse pathways with terminal modifiers. Hence, we analyzed whether KNeXT’s “–unique” output graphs increase modularity using two different community detection algorithms. While the focus of this work is not to survey all applicable algorithms, we used greedy modularity (Clauset et al., 2004a), a module written in NetworkX (Hagberg et al., 2008), and pyCombo, a python wrapper around the C++ implementation of Combo (Sobolevsky et al., 2014). Both these algorithms have shown robust utility for capturing high modularity in human KEGG pathways (Rahiminejad et al., 2019). All algorithms were leveraged using default parameters, and, we used a seed of one for pyCombo. Briefly, the fast greedy community detection algorithm finds the community with the highest modularity from an iterative process that assess communities as community pairs are combined (Clauset et al., 2004a; b). pyCombo is a combination algorithm that finds communities with the highest modularity through using one of the following processes: combining communities, splitting communities, or moving nodes between communities (Sobolevsky et al., 2014).
3 Results
Automating the recreation of topologically relevant KEGG graphs from KGML files is difficult to due overlapping protein, gene, and compound identifiers. We do not know of any automated parsers that modify or interpret equivalent identifiers to create isolated connected components. KNeXT is intended to bridge this gap and our results provide a comparative analysis with a modern widely-used parser called graphite (Sales et al., 2012), which has been cited in several recent studies (Bianco et al., 2017; Gouy et al., 2017; Benedetti et al., 2020; Rahat et al., 2020; Hellstern et al., 2021; Liang et al., 2022).
To illustrate the advantages of KNeXT we compare our novel approach to graphite using the Homo sapiens Rat Sarcoma (RAS) signaling pathway, a highly complex pathway with multiple effectors and features (Vojtek and Der, 1998). The KEGG pathway features two states, the active and inactive state, and a third independent state that outlines guanine nucleotide exchange factors and their effectors. Figure 3 is a recreation of the pathway as described in the KEGG website https://www.genome.jp/kegg-bin/show_pathway?hsa04014. To simplify the figure, we highlight pathways of interest and utilize undirected edges. Briefly, only the immediate neighborhood around compound C00165, DAG, is highlighted because it occurs in two subgraphs but forms connections with different genes based on which neighborhood it resides.
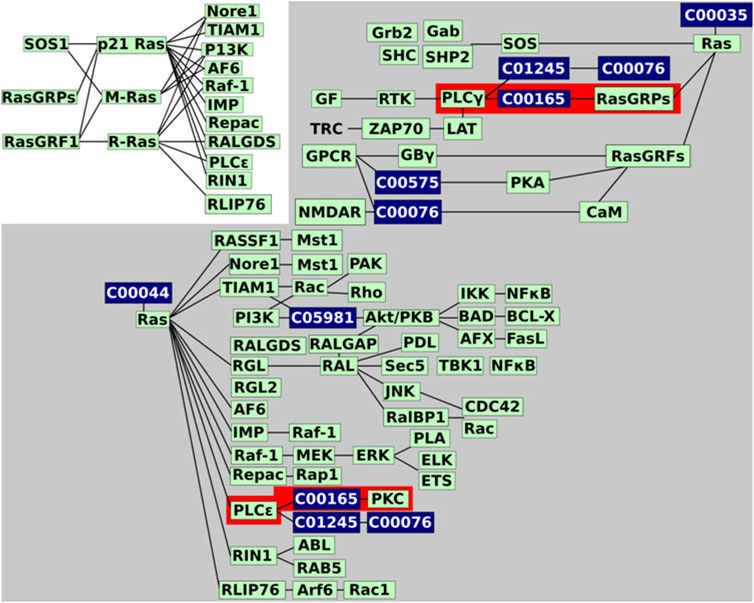
FIGURE 3. Recreated RAS signaling pathway. KEGG’s hsa04014 pathway image recreated. We reformatted the graph to undirected edges and emphasized the two connected components, in grey background, and the two neighborhoods, highlighted in red, we will be investigating. Genes are colored in green while compounds are in dark blue.
Relying on unmodified KGML files, automated parsers are susceptible to overlapping nodes with the same identifiers, even when the nodes are in disconnected or distant neighborhoods (Figures 4A,D). As Figure 3 demonstrates, in the RAS pathway, DAG is represented in both the activate and inactive states. Although DAG is the exact same in either state, it exists in two distant neighborhoods or toplogies, see Figure 4B. As a result, when propagated with graphite, genes involved in PLCγ are bridged to both RasGRFs and PKC, creating a topology not reflected in the original KEGG diagram, compare Figures 4D,E. Figure 4D highlights edges in dashed red lines that do not support the original topology, and edges in dotted red lines are interactions not reflected in the University of Southern California Genome Browser Gene Interaction Track (Kent et al., 2022). While the latter is desirable, the former is misleading because it establishes connections between genes that are not indicated in the original KEGG pathway nor have any scientific evidence supporting its interactions (Kent et al., 2022). For example, the connection between genes PLCE1 and PLCG1 (Figure 4D) inferred by graphite does not appear in either KEGG topology, Figure 3, in contrast to the KNeXT result that retains neighborhood topology, Figure 4F. This is also illustrated when compounds are propagated without the KNeXT terminal modifier, Figure 4C. KNeXT is able to properly represent the relationship as two distinct connected components, Figure 4F.
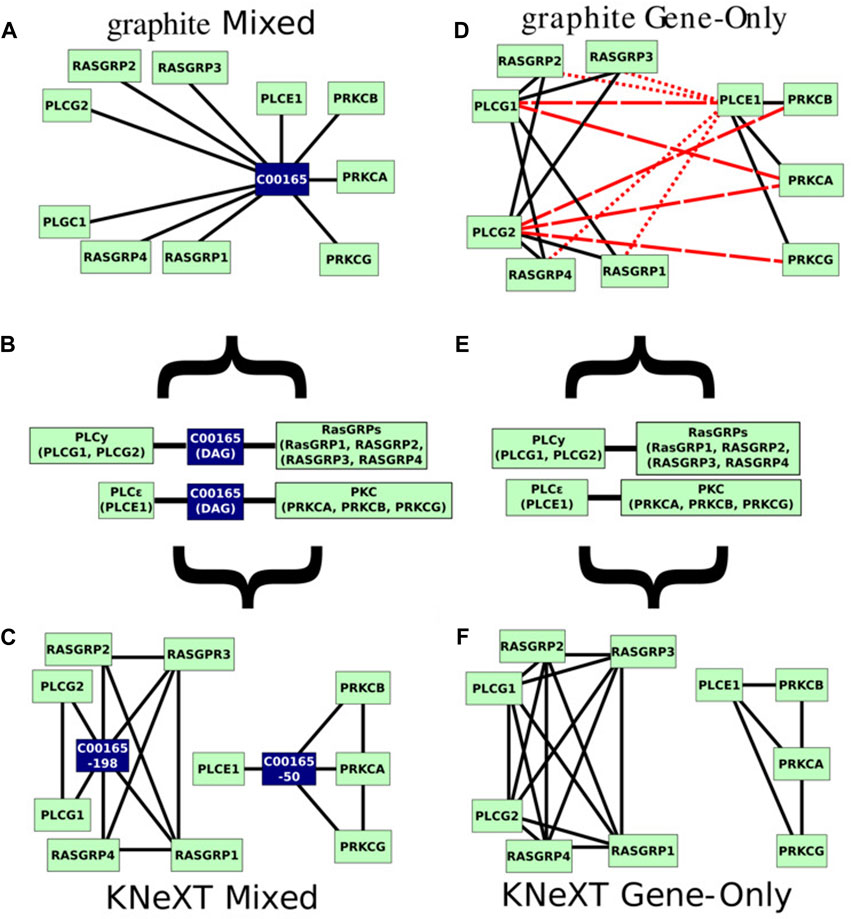
FIGURE 4. Mixed and gene only representations of the original KEGG pathway. (A). The mixed, genes and compound, representation of the hsa04014 pathway generated by graphite using the mixed command. (B). Pathway hsa04014s immediate neighborhood centered on compound C00165 (DAG). Type “AND” interactions are not individualized to emphasize what is originally given by the KGML files. Gene symbols within the type “AND” interactions are notated with parenthesis. (C). The mixed genes and compound representation of the hsa04014 pathway parsed by KNeXT using the parse-mixed command. (D). graphite’s gene only network representation of the hsa04014 pathway. Erroneous or otherwise misleading edges are marked in red dashes, and furthermore, edges which have no scientific evidence are marked in red dotted lines. (E). Pathway hsa04014 from KEGG represented in gene only form. Type “AND” interactions are not individualized to emphasize the original KGML file format. (F). The parsed hsa04014 pathway generated by KNeXT using the parse-genes command. In both cases, KNeXT illustrates higher accuracy when recapitulating the two distal neighborhoods.
We conducted a comparative analysis to extrapolate across all human pathways. Our first analysis was based on the validation between the edges constructed in a ground truth graph, which was gathered from the UCSC Genome Browser, and the edges generated in each respective parser, KNeXT and graphite. Figure 5A shows the results of a ppd between graphite and KNeXT. ppd was significantly higher for graphite, 0.045 p-value, compared to KNeXT indicating that a significant amount of unverified edges are inflated when compound propagation does not regard unique identifiers between each compound.

FIGURE 5. Results of pathway analyses. Probability value (p) annotation is as follows: ns: 0.050
Our next analysis consisted of a survey of KNeXT’s ability to capture subgraphs using the–unique flag, which creates independent neighborhoods and unique topologies. This is the most prominent feature that differs from conventional parsers. We found that each pathway exhibited higher modularity compared to conventional parsing methods, see Figures 5B,C for results. This trend was consistent no matter which community detection algorithm we used, compare Figures 5B,C.
4 Discussion and conclusion
Topology, the spatial order of a graph’s edges and vertices, is a highly relevant aspect of network use in biology (Pavlopoulos et al., 2011; Gao et al., 2018). While identical gene or compound identifiers may be represented in disparate neighborhoods within the KEGG visualization framework, the existence of duplicate identifiers in the KGML file may prohibit recapitulation of original structure. Oftentimes, this will result in automated KGML parsers creating misleading or incorrect gene-gene or mixed-compound representations (Wrzodek et al., 2011; Arakelyan and Nersisyan, 2013; Nersisyan et al., 2014). Existing approaches, such as graphite, provide a tremendous utility to the bioinformatics and R communities and have demonstrated robustness across several additional databases (Sales et al., 2012). However, while KNeXT does not extend to additional databases, it does provide a novel automated KGML parser for the Python community while simultaneously addressing the pervasive issues driven by the KGML inclusion of duplicate identifiers. KNeXT is able to distinguish gene and compound localization within the larger topology without the need for post-processing modifications (Arakelyan and Nersisyan, 2013; Nersisyan et al., 2014). It also produces x-y axis localizations compatible with NetworkX, shown in Table 6, enabling rapid result visualization.
It is important to note that KNeXT achieves its ability to accurately reconstruct topology by adding unique modifiers to KEGG components via the–unique command. As a result, KNeXT outputs include modifier extensions to the original identifiers that need to be stripped before use in identifier mapping tools outside of KNeXT’s convert implementation. While KNeXT provides options for identifier mapping among Entrez (Sayers et al., 2022), UniProtKB (The UniProt Consortium, 2023), and KEGG (Kanehisa et al., 2022) ids, further experiments on fully realized, terminally-modified, KEGG pathways produced by KNeXT will be necessary to determine the impact of topology modification on downstream analysis. This may include the future development of tools for integrating KNeXT directly into larger packages such as metaGraphite (Sales et al., 2019), netgsa (Hellstern et al., 2021) or Cytoscape (Shannon et al., 2003). This will also include leveraging these terminally modified pathways in algorithms that require strict neighborhood embeddings such as graph autoencoders (GAE) (Lin et al., 2023). Since we have shown that these pathways exhibit a significant increase in modularity, it has been shown that GAEs may benefit from modularity-based prior communities when calculating embeddings (Salha-Galvan et al., 2022). Furthermore, the ability to swiftly isolate subgraphs will be useful to remove genes, which have a biased spatial pattern, such as housekeeping genes (Karathia et al., 2016).
In addition, we have noticed a lack of edges within UCSC’s graphical database. We attributed this to “OR” edges being unaccounted. Further research will be needed to investigate missing edges. Missing edges might be an artifact of automated parsers, and of course, our parser fills in these gaps without artificially inflating erroneous edges.
The KNeXT Python package will benefit users familiar with Python 3 and/or desire a command line interface to KGML downloading and parsing. KNeXT provides automated tools that perform analogous functions expected from modern KGML parsers (Sales et al., 2012) while preserving the vital overarching topological structure of KEGG source material. Our software reduces the complexity of isolating connected components, externally visualizing graphs, and reducing pathways into just their genetic components.
Data availability statement
The original contributions presented in the study are included in the article/Supplementary Material, further inquiries can be directed to the corresponding author.
Author contributions
EC: Writing–original draft, Writing–review and editing, Conceptualization, Investigation, Software, Visualization. EB: Writing–original draft, Writing–review and editing, Supervision.
Funding
The author(s) declare that no financial support was received for the research, authorship, and/or publication of this article.
Acknowledgments
We would like to thank Candace Ditsch who provided helpful comments and improved the clarity of earlier drafts of the manuscript.
Conflict of interest
The authors declare that the research was conducted in the absence of any commercial or financial relationships that could be construed as a potential conflict of interest.
Publisher’s note
All claims expressed in this article are solely those of the authors and do not necessarily represent those of their affiliated organizations, or those of the publisher, the editors and the reviewers. Any product that may be evaluated in this article, or claim that may be made by its manufacturer, is not guaranteed or endorsed by the publisher.
Supplementary material
The Supplementary Material for this article can be found online at: https://www.frontiersin.org/articles/10.3389/fgene.2024.1292394/full#supplementary-material
References
Arakelyan, A., and Nersisyan, L. (2013). KEGGParser: parsing and editing KEGG pathway maps in Matlab. Bioinformatics 29, 518–519. doi:10.1093/bioinformatics/bts730
Benedetti, E., Pučić-Baković, M., Keser, T., Gerstner, N., Büyüközkan, M., Štambuk, T., et al. (2020). A strategy to incorporate prior knowledge into correlation network cutoff selection. Nat. Commun. 11, 5153. doi:10.1038/s41467-020-18675-3
Bernstein, D. B., Sulheim, S., Almaas, E., and Segrè, D. (2021). Addressing uncertainty in genome-scale metabolic model reconstruction and analysis. Genome Biol. 22, 64. doi:10.1186/s13059-021-02289-z
Bianco, L., Riccadonna, S., Lavezzo, E., Falda, M., Formentin, E., Cavalieri, D., et al. (2017). Pathway inspector: a pathway based web application for RNAseq analysis of model and non-model organisms. Bioinformatics 33, 453–455. doi:10.1093/bioinformatics/btw636
Blondel, V. D., Guillaume, J.-L., Lambiotte, R., and Lefebvre, E. (2008). Fast unfolding of communities in large networks. J. Stat. Mech. Theory Exp. 2008, P10008. doi:10.1088/1742-5468/2008/10/P10008
Chanumolu, S., Albahrani, M., Can, H., and Otu, H. (2021). Kegg2net: deducing gene interaction networks and acyclic graphs from kegg pathways. EMBnet.J. 26, 949. doi:10.14806/ej.26.0.949
Chen, L., Zhang, Y.-H., Wang, S., Zhang, Y., Huang, T., and Cai, Y.-D. (2017). Prediction and analysis of essential genes using the enrichments of gene ontology and KEGG pathways. PloS one 12, e0184129. doi:10.1371/journal.pone.0184129
Clauset, A., Newman, M. E. J., and Moore, C. (2004a). Finding community structure in very large networks. Phys. Rev. E 70, 066111. doi:10.1103/physreve.70.066111
Clauset, A., Newman, M. E. J., and Moore, C. (2004b). Finding community structure in very large networks. Phys. Rev. E 70, 066111. doi:10.1103/PhysRevE.70.066111
Cock, P. J. A., Antao, T., Chang, J. T., Chapman, B. A., Cox, C. J., Dalke, A., et al. (2009). Biopython: freely available python tools for computational molecular biology and bioinformatics. Bioinformatics 25, 1422–1423. doi:10.1093/bioinformatics/btp163
Díaz-Montaña, J. J., Díaz-Díaz, N., and Gómez-Vela, F. (2017). Gfd-net: a novel semantic similarity methodology for the analysis of gene networks. J. Biomed. Inf. 68, 71–82. doi:10.1016/j.jbi.2017.02.013
Gao, W., Wu, H., Siddiqui, M. K., and Baig, A. Q. (2018). Study of biological networks using graph theory. Saudi J. Biol. Sci. 25, 1212–1219. doi:10.1016/j.sjbs.2017.11.022
Gouy, A., Daub, J. T., and Excoffier, L. (2017). Detecting gene subnetworks under selection in biological pathways. Nucleic Acids Res. 45, e149. doi:10.1093/nar/gkx626
Hagberg, A. A., Schult, D. A., and Swart, P. J. (2008). “Exploring network structure, dynamics, and function using NetworkX,”. Proceedings of the 7th Python in science conference. Editors G. Varoquaux, T. Vaught, and J. Millman, 11–15.
Hellstern, M., Ma, J., Yue, K., and Shojaie, A. (2021). Place: United States netgsa: fast computation and interactive visualization for topology-based pathway enrichment analysis. PLoS Comput. Biol. 17, e1008979. doi:10.1371/journal.pcbi.1008979
Hurst, L. D., Pál, C., and Lercher, M. J. (2004). The evolutionary dynamics of eukaryotic gene order. Nat. Rev. Genet. 5, 299–310. doi:10.1038/nrg1319
Kanehisa, M., Furumichi, M., Sato, Y., Kawashima, M., and Ishiguro-Watanabe, M. (2022). KEGG: new perspectives on genomes, pathways, diseases and drugs. Nucleic Acids Res. 45, D353–D361. doi:10.1093/nar/gkw1092
Kanehisa, M., Sato, Y., Kawashima, M., Furumichi, M., and Tanabe, M. (2015). KEGG as a reference resource for gene and protein annotation. Nucleic Acids Res. 44, D457–D462. doi:10.1093/nar/gkv1070
Karathia, H., Kingsford, C., Girvan, M., and Hannenhalli, S. (2016). A pathway-centric view of spatial proximity in the 3d nucleome across cell lines. Sci. Rep. 6, 39279. doi:10.1038/srep39279
Kent, W. J., Sugnet, C. W., Furey, T. S., Roskin, K. M., Pringle, T. H., Zahler, A. M., et al. (2022). The human genome browser at UCSC. Genome Res. 12, 996–1006. doi:10.1101/gr.229102
Liang, B., Gong, H., Lu, L., and Xu, J. (2022). Risk stratification and pathway analysis based on graph neural network and interpretable algorithm. BMC Bioinforma. 23, 394. doi:10.1186/s12859-022-04950-1
Lin, M., Wen, K., Zhu, X., Zhao, H., and Sun, X. (2023). Graph autoencoder with preserving node attribute similarity. Entropy 25, 567. doi:10.3390/e25040567
Litwin, I., and Wysocki, R. (2018). New insights into cohesin loading. Curr. Genet. 64, 53–61. doi:10.1007/s00294-017-0723-6
Lumsdaine, A., Gregor, D., Hendrickson, B., and Berry, J. (2007). Challenges in parallel graph processing. Parallel Process. Lett. 17, 5–20. doi:10.1142/S0129626407002843
Nersisyan, L., Samsonyan, R., and Arakelyan, A. (2014). Cykeggparser: tailoring kegg pathways to fit into systems biology analysis workflows, F1000Research 3. [version 2; peer review: 2 approved. doi:10.12688/f1000research.4410.2
Pavlopoulos, G. A., Secrier, M., Moschopoulos, C. N., Soldatos, T. G., Kossida, S., Aerts, J., et al. (2011). Using graph theory to analyze biological networks. BioData Min. 4, 10. doi:10.1186/1756-0381-4-10
Rahat, B., Ali, T., Sapehia, D., Mahajan, A., and Kaur, J. (2020). Circulating cell-free nucleic acids as epigenetic biomarkers in precision medicine. Front. Genet. 11, 844. doi:10.3389/fgene.2020.00844
Rahiminejad, S., Maurya, M. R., and Subramaniam, S. (2019). Topological and functional comparison of community detection algorithms in biological networks. BMC Bioinforma. 20, 212. doi:10.1186/s12859-019-2746-0
Sales, G., Calura, E., Cavalieri, D., and Romualdi, C. (2012). Graphite - a bioconductor package to convert pathway topology to gene network. BMC Bioinforma. 13, 20. doi:10.1186/1471-2105-13-20
Sales, G., Calura, E., and Romualdi, C. (2019). metaGraphite–a new layer of pathway annotation to get metabolite networks. Bioinformatics 35, 1258–1260. doi:10.1093/bioinformatics/bty719
Salha-Galvan, G., Lutzeyer, J. F., Dasoulas, G., Hennequin, R., and Vazirgiannis, M. (2022). Modularity-aware graph autoencoders for joint community detection and link prediction. Neural Netw. 153, 474–495. doi:10.1016/j.neunet.2022.06.021
Sato, N., Uematsu, M., Fujimoto, K., Uematsu, S., and Imoto, S. (2023). ggkegg: analysis and visualization of KEGG data utilizing the grammar of graphics. Bioinformatics 39, btad622. doi:10.1093/bioinformatics/btad622
Sayers, E. W., Bolton, E. E., Brister, J. R., Canese, K., Chan, J., Comeau, D. C., et al. (2022). Database resources of the national center for biotechnology information. Nucleic acids Res. 50, D20–D26. doi:10.1093/nar/gkab1112
Shannon, P., Markiel, A., Ozier, O., Baliga, N. S., Wang, J. T., Ramage, D., et al. (2003). Cytoscape: a software environment for integrated models of biomolecular interaction networks. Genome Res. 13, 2498–2504. doi:10.1101/gr.1239303
Sobolevsky, S., Campari, R., Belyi, A., and Ratti, C. (2014). General optimization technique for high-quality community detection in complex networks. Phys. Rev. E 90, 012811. doi:10.1103/PhysRevE.90.012811
The UniProt Consortium (2023). UniProt: the universal protein knowledgebase in 2023. Nucleic Acids Res. 51, D523–D531. doi:10.1093/nar/gkac1052
Vojtek, A. B., and Der, C. J. (1998). Increasing complexity of the ras signaling pathway. J. Biol. Chem. 273, 19925–19928. doi:10.1074/jbc.273.32.19925
Wrzodek, C., Dräger, A., and Zell, A. (2011). KEGGtranslator: visualizing and converting the KEGG PATHWAY database to various formats. Bioinformatics 27, 2314–2315. doi:10.1093/bioinformatics/btr377
Yu, C., Woo, H. J., Yu, X., Oyama, T., Wallqvist, A., and Reifman, J. (2017). A strategy for evaluating pathway analysis methods. BMC Bioinforma. 18, 453. doi:10.1186/s12859-017-1866-7
Keywords: KEGG, KGML parser, python, NetworkX, KGML graph
Citation: Castaneda EU and Baker EJ (2024) KNeXT: a NetworkX-based topologically relevant KEGG parser. Front. Genet. 15:1292394. doi: 10.3389/fgene.2024.1292394
Received: 12 September 2023; Accepted: 25 January 2024;
Published: 13 February 2024.
Edited by:
Marco S. Nobile, Ca’ Foscari University of Venice, ItalyReviewed by:
Yalbi I. Balderas-Martínez, National Institute of Respiratory Diseases-Mexico (INER), MexicoPavel Loskot, The Zhejiang University-University of Illinois at Urbana-Champaign Institute, United States
Copyright © 2024 Castaneda and Baker. This is an open-access article distributed under the terms of the Creative Commons Attribution License (CC BY). The use, distribution or reproduction in other forums is permitted, provided the original author(s) and the copyright owner(s) are credited and that the original publication in this journal is cited, in accordance with accepted academic practice. No use, distribution or reproduction is permitted which does not comply with these terms.
*Correspondence: Erich J. Baker, ZXJpY2guYmFrZXJAYmVsbW9udC5lZHU=