 Candela Ojeda-Marín
 Isabel Cervantes
 Nora Formoso-Rafferty
 Juan Pablo Gutiérrez
94% of researchers rate our articles as excellent or good
Learn more about the work of our research integrity team to safeguard the quality of each article we publish.
Find out more
ORIGINAL RESEARCH article
Front. Genet., 14 December 2023
Sec. Livestock Genomics
Volume 14 - 2023 | https://doi.org/10.3389/fgene.2023.1303748
This study aimed to compare different inbreeding measures estimated from pedigree and molecular data from two divergent mouse lines selected for environmental birth weight during 26 generations. Furthermore, the performance of different approaches and both molecular and pedigree data sources for estimating Ne were tested in this population. A total of 1,699 individuals were genotyped using a high-density genotyping array. Genomic relationship matrices were used to calculate molecular inbreeding: Nejati-Javaremi (FNEJ), Li and Horvitz (FL&H), Van Raden method 1 (FVR1) and method 2 (FVR2), and Yang (FYAN). Inbreeding based on runs of homozygosity (FROH) and pedigree inbreeding (FPED) were also computed. FROH, FNEJ, and FL&H were also adjusted for their average values in the first generation of selection and named FROH0, FNEJ0, and FL&H0. ∆F was calculated from pedigrees as the individual inbreeding rate between the individual and his parents (∆FPEDt) and individual increases in inbreeding (∆FPEDi). Moreover, individual ∆F was calculated from the different molecular inbreeding coefficients (∆FNEJ0, ∆FL&H, ∆FL&H0, ∆FVR1, ∆FVR2, ∆FYAN, and ∆FROH0). The Ne was obtained from different ∆F, such as NePEDt, NePEDi, NeNEJ0, NeL&H, NeL&H0, NeVR1, NeVR2, NeYAN, and NeROH0. Comparing with FPED, FROH, FNEJ and FVR2 overestimated inbreeding while FNEJ0, FL&H, FL&H0, FVR1 and FYAN underestimated inbreeding. Correlations between inbreeding coefficients and ∆F were calculated. FROH had the highest correlation with FPED (0.89); FYAN had correlations >0.95 with all the other molecular inbreeding coefficients. NePEDi was more reliable than NePEDt and presented similar behaviour to NeL&H0 and NeNEJ0. Stable trends in Ne were not observed until the 10th generation. In the 10th generation NePEDi was 42.20, NeL&H0 was 45.04 and NeNEJ0 was 45.05 and in the last generation these Ne were 35.65, 35.94 and 35.93, respectively FROH presented the highest correlation with FPED, which addresses the identity by descent probability (IBD). The evolution of NeL&H0 and NeNEJ0 was the most similar to that of NePEDi. Data from several generations was necessary to reach a stable trend for Ne, both with pedigree and molecular data. This population was useful to test different approaches to computing inbreeding coefficients and Ne using molecular and pedigree data.
Inbreeding appears due to mating between related individuals and is related to negative consequences because of an increase in homozygosity, such as a reduction in fitness, namely, inbreeding depression (Hedrick, 2012; Alemu et al., 2021). Therefore, the study of inbreeding is essential in many areas, e.g., animal and plant breeding (Villanueva et al., 2021), human genetics (McQuillan et al., 2012), and evolutionary (Roff, 1997) and conservation biology (Frankham et al., 2010).
Traditionally, pedigree data has been used to measure inbreeding (Howard et al., 2017; Villanueva et al., 2021); however, this only provides the expected proportions of the genome that are identical by descent (IBD) and does not capture variation due to Mendelian sampling and linkage during gamete formation (Howard et al., 2017).
The implementation of molecular technologies has led to the development of numerous genomic estimators of inbreeding coefficients (Howard et al., 2017; Alemu et al., 2021; Villanueva et al., 2021), which can distinguish between individuals with the same ascendants and differentiate inbreeding at specific regions in chromosomes (Howard et al., 2017; Villanueva et al., 2021). Different approaches have been developed to measure inbreeding coefficients based on genomic data, including methods based on homozygous stretches of DNA sequences (runs of homozygosity—ROH) (Ceballos et al., 2018). However, ROH detection is highly dependent on the parameters set by the user (Peripolli et al., 2017; Rodríguez-Ramilo et al., 2019; Villanueva et al., 2021); therefore, comparisons between studies are not straightforward. In this context, other methodologies appeared that detected homozygosity by descent (HBD) segments under a probabilistic framework based on hidden Markov models. The probability of a single nucleotide polymorphism (SNP) being in an HBD segment was modelled as a function of genotyping error, intermarker distances and allele frequencies (Druet and Gautier, 2017). In addition, other methods are based on analysing each SNP and are derived from genomic relationship matrices (GRMs) (Li and Horvitz, 1953; Nejati-Javaremi et al., 1997; VanRaden, 2008; Yang et al., 2010; VanRaden et al., 2011). GRMs are used to obtain genomic predictions in animal breeding and can be used to estimate inbreeding given (Villanueva et al., 2021). These measures, however, are designed with different constraints and can lead to very different results with several implications (Villanueva et al., 2021).
One of the indicators most used to assess the genetic diversity of a population is the effective population size (Ne) (Wright, 1931). There are some approaches based on different indicators that have been used to measure Ne: the change in allele frequencies across generations (variance Ne), increase in homozygosity (inbreeding Ne), increase in kinship (coancestry Ne) or the rate of loss of less frequent alleles (eigenvalue Ne). Ne can also be estimated using census parameters, pedigree data, individual genotypes or demographic information (Sjödin et al., 2005; Leroy et al., 2013). The relationship between the increase in inbreeding (∆F) and Ne is defined by the classic formula: Ne
A divergent selection experiment for birth weight variability in mice has been successfully carried out, creating two lines, one homogeneous and the other heterogeneous over 26 generation (Formoso-Rafferty et al., 2016a). The experimental mating design avoided sharing grandparents and was optimised as a function of selection criteria in both selected lines (Formoso-Rafferty et al., 2016b). The homogeneous line presented advantages in production, animal welfare, response to selection, and traits related to robustness, such as longevity, survival and feed efficiency (Formoso-Rafferty et al., 2017; Formoso-Rafferty et al., 2018; Formoso-Rafferty et al., 2019; Formoso-Rafferty et al., 2020; Formoso-Rafferty et al., 2022; Formoso-Rafferty et al., 2023).
This study aimed to compare different inbreeding measures estimated from pedigree and molecular data from divergent mouse lines for environmental variability in birth weight. Furthermore, the performance of Ne estimated using different approaches and both molecular and pedigree data sources was tested in this divergent population. The applications of different methodologies in this particular population structure (strong divergent selection) are intended to evaluate the suitability in populations under selection.
Pedigree data were obtained from 26 discrete generations of a successful divergent selection experiment for environmental variability of birth weight in mice, including an additional five previous discrete generations randomly mated. In the experiment, in each generation, 43 females were mated to one male to give a maximum of two parturitions, avoiding mating animals sharing grandparents, with an approximately 30% proportion selected within the line. In the five preceding generations, 32 males were mated to 64 females, each male with 2 females. More details of the selection process can be found in Formoso-Rafferty et al. (2016a).
A total of 1824 individuals from the 26 selection generations were genotyped using the Affymetrix Mouse Diversity Genotyping Array with 616,137 SNPs. The individuals genotyped were those selected according to the selection criteria in each generation. During quality control (QC) animals with a call rate lower than 97% were removed, leaving 1,669 for analysis. Of these, 1,587 were females and 112 were males. The first generation of selected mice was used as the reference population (a total of 70 individuals, all females). The QC was also applied to the SNPs: 3% of missing genotypes were allowed, SNPs mapped to sex chromosomes were removed, and 545,656 SNPs were retained. This set was used to detect ROH to ensure maximum genome coverage and, therefore, avoid loss of information: no minor allele frequency (MAF) was applied as recommended other authors recommended (Meyermans et al., 2020).
Additional QC was applied to determine the other genomic inbreeding coefficients estimators: SNPs presenting MAFs lower than 0.05 in the reference population were removed. Additionally, remnant SNPs with MAFs less than 0.05 among the whole population were also removed. Finally, 173,546 SNPs were kept, which were used to obtain inbreeding coefficients from different GRMs. The number of animals genotyped per generation in the selected population is presented in Table 1.
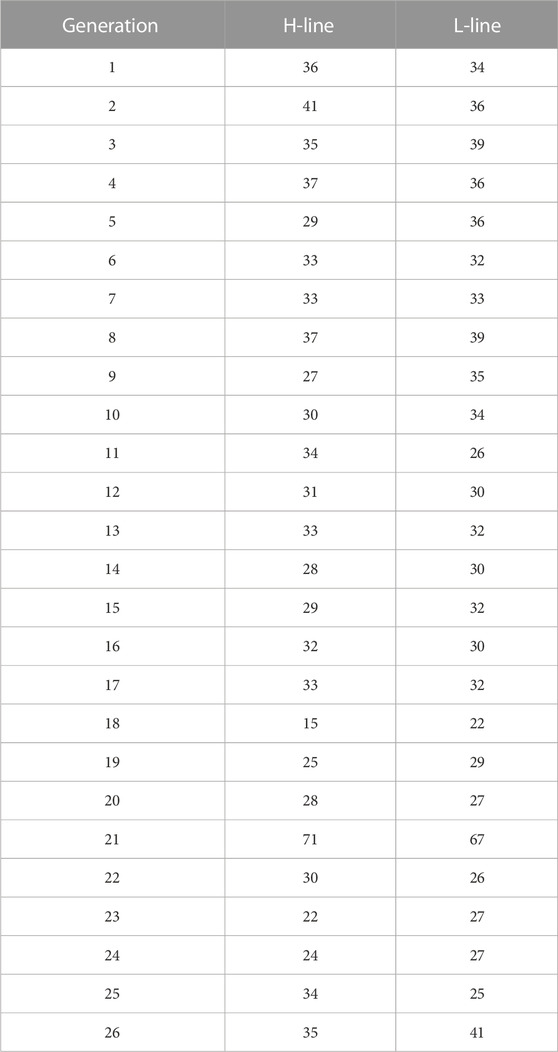
TABLE 1. Number of animals sampled per line and generation. H-Line: high variability line. L-Line: low variability line.
Inbreeding coefficients from genomic data were obtained from the diagonal elements of different GRMs and ROH.
Inbreeding based on GRMs was named using the nomenclature chosen by Villanueva et al., (2021); therefore, inbreeding coefficients were calculated as follows:
1) FNEJ uses the diagonal elements of the allelic relationship matrix of Nejati-Javaremi et al. (1997). FNEJ is calculated using all individuals (FNEJT), those from the high variability line (FNEJH) and those from the low variability line (FNEJL).
2)
3) FL&H estimates the deviation of the observed frequency of homozygotes from the expected frequency of homozygotes in the reference population under Hardy-Weinberg proportions (Li and Horvitz, 1953).
4)
5) FVR1 is computed from the diagonal elements of the GRM obtained according to Van Raden’s method 1 (VanRaden, 2008).
6) FVR2 is computed from the diagonal elements of the GRM obtained according to Van Raden’s method 2 (Leutenegger et al., 2003; VanRaden, 2008).
7) FYAN uses the diagonal elements from the GRM of Yang to compute inbreeding coefficients (Yang et al., 2010).
8) Sliding window algorithms were used to detect ROH in each population. The parameters set were as follows: 50 SNPs per window; one heterozygote allowed in a window; no limit of the number of heterozygotes per ROH; five missing SNPs allowed in a window; the minimum length of an ROH was 1,000 kb; the minimum number of homozygous SNPs in an ROH was set at 100; the required minimum density was set at one SNP/50 kb; the window threshold was set at 0.5; and the minimum distance between two ROHs was 1,000 kb. Inbreeding based on ROH was calculated as
9)
10) Pedigree inbreeding coefficients (FPED) are defined as the probability of an individual having two identical alleles by descent and are computed following Meuwissen and Luo (1992).
In summary, we tested several methods; some were intrinsically adjusted for the allele frequencies of the reference population (FL&H, FVR1, FVR2, and FYAN), others were adjusted for mean inbreeding of the reference population (
Expected homozygosity (FEXP) was calculated from the frequency of the reference allele (p) per generation as
Our own R code was used to calculate coefficients based on GRMs. PLINK v 1.9 (Chang et al., 2015) was used to detect ROH, and ENDOG v 4.8 (Gutierrez and Goyache, 2005) was used to calculate pedigree inbreeding coefficients.
Effective population size was computed for each generation from individual increases in inbreeding (Gutiérrez et al., 2008; Gutiérrez et al., 2009) based on the different inbreeding coefficients described above. When pedigree inbreeding was used, two approaches were applied to calculate the individual increase in inbreeding. One is based on the classic formula:
Moreover, the individual increase in inbreeding coefficient using FPED was also calculated as
The molecular Ne based on FNEJ0 (
The expected Ne per generation was computed as
In addition, the number of generations that passed since the founder generation to the reference population could be derived from the classic formula
Moreover, t was also calculated using the average FPED of the reference population (tPED) and the average ∆FPEDi of whole selection generations. In this case, tPED represented the number of generations elapsed if the breeding method of the selection experiment would be applied from the founder population of the recorded pedigree to the first generation of the experiment (reference population).
Pearson’s correlation coefficients were calculated between all computed inbreeding coefficients and increases in inbreeding. Correlations between the different inbreeding coefficients were calculated for the whole population and different generation groups: initial (1, 2, 3, and 4), intermediate (16, 17, 18, and 19), and most recent generations (23, 24, 25, and 26). R software was used to calculate correlations using the function “cor·” (Rizopoulos, 2007).
Figure 1 shows the trend of average inbreeding across generations calculated using molecular and pedigree approaches, which was positive in both cases. Both approaches presented similar performances across generations, except FROH and FNEJ, which showed the greatest amount of inbreeding in the first and last generations. In the first generation, FROH was 0.54 and FNEJ was 0.61, and in the last generation, FROH was 0.68 and FNEJ was 0.73. The lowest individual inbreeding coefficient was identified for FL&H in the first (−0.02) and last generation (0.28) (Supplementary Table S1). There were not differences in the evolution of the different inbreeding coefficients in the two selection lines when analysed separately (results are not shown). We therefore decided to analyse the data together.
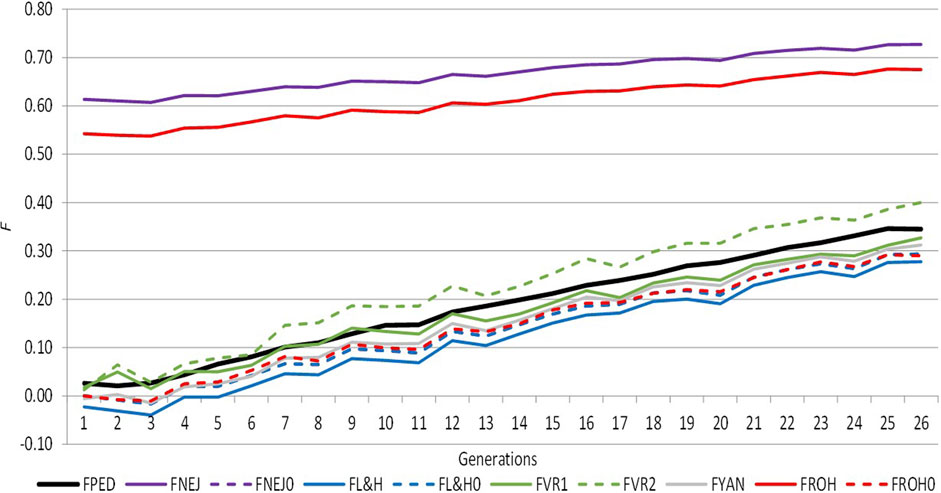
FIGURE 1. Evolution of the different inbreeding coefficients computed from pedigree and molecular information across the selection generation. FPED: inbreeding coefficient computed from pedigree information. FNEJ: inbreeding coefficient computed from the diagonal of the Nejati Javaremi Matrix. FL&H: inbreeding coefficient computed from the diagonal of the Li and Horvitz Matrix. FVR1: inbreeding coefficient computed from the diagonal of the Van Raden type 1 matrix. FVR2: inbreeding coefficient computed from the diagonal of the Van Raden type 2 matrix. FYAN: inbreeding coefficient computed from the diagonal of the Yang matrix. FROH: inbreeding coefficient computed using runs of homozygosity. FPED0, FNEJ0, FL&H0, and FROH0 were adjusted for the mean inbreeding coefficients of the first selection generation.
The evolution of expected homozygosity and FNEJ for the whole population and selected lines for divergent birth weight variability across generations are represented in Figure 2. Expected homozygosity presented a positive trend when data from all individuals was used and when selected lines were analysed separately. Moreover, FEXPH and FEXPL were similar to FNEJH and FNEJL, with 0.75 FEXPH, 0.74 FEXPL, 0.73 FNEJH, and 0.72 FNEJL in the last generation. FEXP was greater than FNEJ until the seventh generation. However, after these generations, FEXP was markedly lower than FNEJ and lower than expected homozygosity within line because of the structure created by divergent selection. The highest values of FEXP and FNEJ were reached in the last selection generation, at 0.67 and 0.72, respectively.
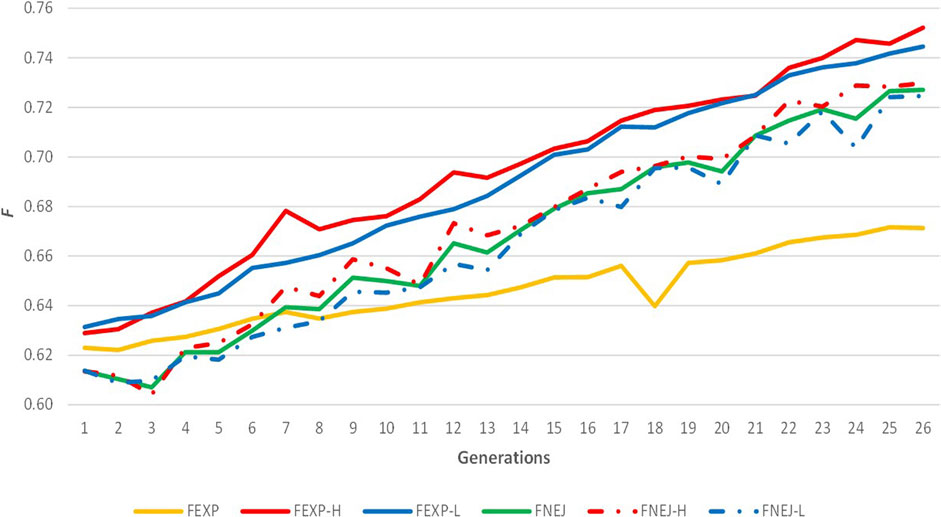
FIGURE 2. Evolution of expected homozygosity (FEXP) and mean inbreeding coefficient obtained from the Nejati-Javaremi genomic relationship matrix (FNEJ) across the selection generations. FEXP-T was calculated using all individuals. FEXP-H was calculated using individuals from the high variability line. FEXP-L was calculated using individuals from the low variability line. FNEJ-T was calculated using all genotyped individuals. FNEJ-H was calculated using individuals from the high variability line. FNEJ-L was calculated using individuals from the low variability line.
Correlations between molecular and pedigree inbreeding coefficients using the whole population are shown in Table 2. All correlations were greater than 0.84. The correlations between FPED and molecular inbreeding coefficients were between 0.84 (FPED-FVR1) and 0.89 (FPED-FROH). The strongest correlations between molecular inbreeding coefficients were detected between FNEJ and FL&H (1.00). The FYAN showed correlations greater than 0.95 with all other molecular inbreeding coefficients, and the correlation with FPED was 0.88. When only a few generations were used to calculate the correlation coefficients, these correlations were lower between FPED and the molecular inbreeding coefficients (Supplementary Table S2). In the initial generations, FPED showed the highest correlation with FROH (0.25) and the lowest correlation with FVR1 (0.11). However, in the intermediate generations, FPED showed the highest correlations with FNEJ and FL&H (0.39), and the lowest correlation was observed with FVR2 (0.22). Moreover, in the most recent generations, the highest correlations were also observed between FPED-FNEJ and FPED-FL&H (0.22), and the lowest correlation was observed between FPED-FVR2 (0.13). Finally, in general, FYAN showed the highest correlations with other molecular inbreeding coefficients in the initial, intermediate, and final generations.
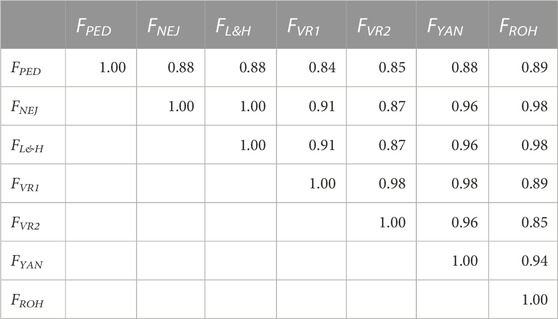
TABLE 2. Correlation coefficients between molecular and pedigree inbreeding coefficients of all genotyped individuals. FPED: inbreeding coefficient computed from pedigree. FNEJ: inbreeding coefficient computed from the diagonal of the Nejati-Javaremi matrix. FL&H i: inbreeding coefficient computed from the diagonal of Li and Horvitz Matrix. FVR1: inbreeding coefficient computed from the diagonal of the Van Raden type 1 matrix. FVR2: inbreeding coefficient computed from the diagonal of the Van Raden type 2 matrix. FYAN: inbreeding coefficient computed from the diagonal of the Yang matrix. FROH: inbreeding coefficient computed using runs of homozygosity.
The evolution of individual inbreeding increases across generations calculated by pedigree and molecular inbreeding coefficients are shown in Figure 3. The ∆FPEDt (values between −0.03 and 0.06, Figure 3A) showed an irregular evolution across generations unlike ∆FPEDi (0.00 and 0.02, Figure 3B), which increased during fifteen generations and became stable thereafter. Individual increases in inbreeding calculated from molecular inbreeding coefficients showed a similar trend, with higher variability among individuals until the 10th generation, after which the trend was stabilised. The ∆FL&H0 (values between −0.13 and 0.13, Figure 3E) performed more like the other molecular increases in inbreeding (∆FNEJ0, ∆FVR1, ∆FVR2, ∆FYAN and ∆FROH0) than ∆FL&H (values between −0.02 and 0.02, Figure 3D) in the first five generations of selection.
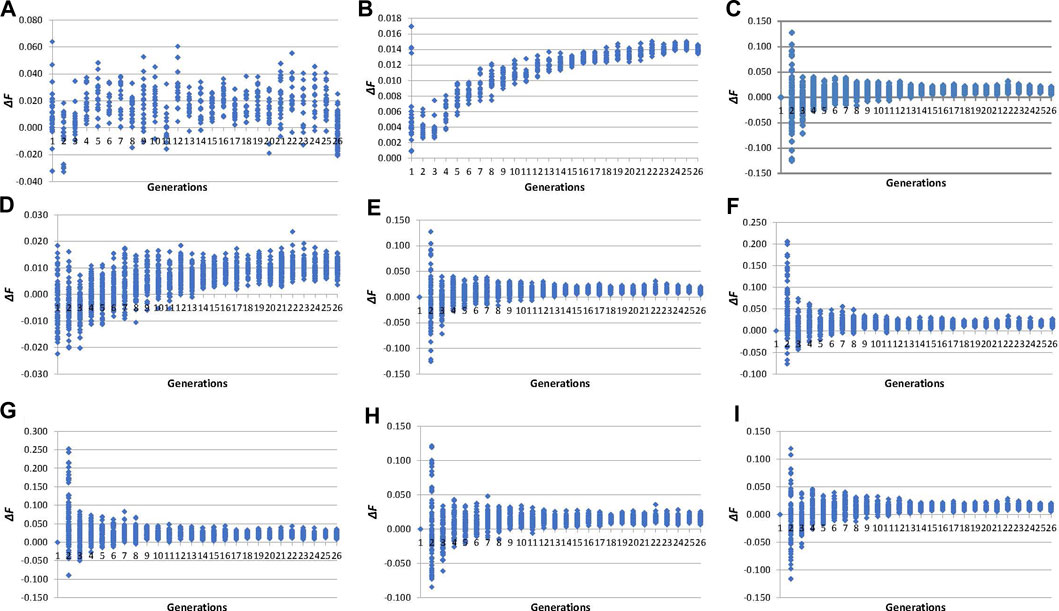
FIGURE 3. Evolution across selection generations of molecular and pedigree increases in inbreeding coefficients (∆F) of all genotyped individuals. (A): ∆FPEDt derived from pedigree referenced against the inbreeding coefficient of the individual’s parents. (B): ∆FPEDi derived from pedigree referred to the number of generations of the individual. (C): ∆FNEJ0 derived from inbreeding coefficients (F) of the Nejati-Javaremi matrix (FNEJ) adjusted for the mean FNEJ of the first selection generation. (D): ∆FL&H derived from the diagonal of the Li and Horvitz matrix. (E): ∆FL&H0 derived from F of the Li and Horvitz matrix (FL&H) adjusted for the mean FL&H of the first selection generation. (F): ∆FVR1 derived from the diagonal of the Van Raden type 1 matrix. (G): ∆FVR2 derived from the diagonal of the Van Raden type 2 matrix. (H): ∆FYAN derived from the diagonal of the Yang matrix. (I): ∆FFROH0 derived from F of runs of homozygosity (FROH) adjusted for the mean FROH of the first selection generation.
Table 3 shows the correlations between increases in inbreeding calculated using all generations. Correlations greater than 0.90 were identified between ∆FL&H0—∆FNEJ0 (1.00), ∆FL&H—∆FYAN (0.92), ∆FROH0—∆FNEJ0 (0.91), and ∆FROH0—∆FL&H0 (0.91). Moreover, ∆FYAN was strongly correlated with ∆FVR1 (0.89) and ∆FVR2 (0.86). The lowest correlations were detected between ∆FPEDt and all other inbreeding increases being between 0.38 for ∆FPEDi and 0.18 for ∆FVR1 and ∆FVR2. Interestingly, higher correlations were detected between ∆FL&H and ∆FYAN, ∆FVR1 and ∆FVR2 than between ∆FL&H0 and ∆FYAN, ∆FVR1 and ∆FVR2. When only groups of generations (initial, intermediate and most recent generations) were considered, correlations between individual ∆F values were generally lower than when all generations were used (Supplementary Table S3). The strongest correlations were detected between ∆FL&H0 and ∆FNEJ0(1.00) in all generation groups. In summary, the molecular ∆F with the strongest correlations among the others in the different generation groups was ∆FYAN, followed by ∆FROH0. Nevertheless, when only a few generations were used to calculate ∆F, correlations between molecular and pedigree measures were very low.
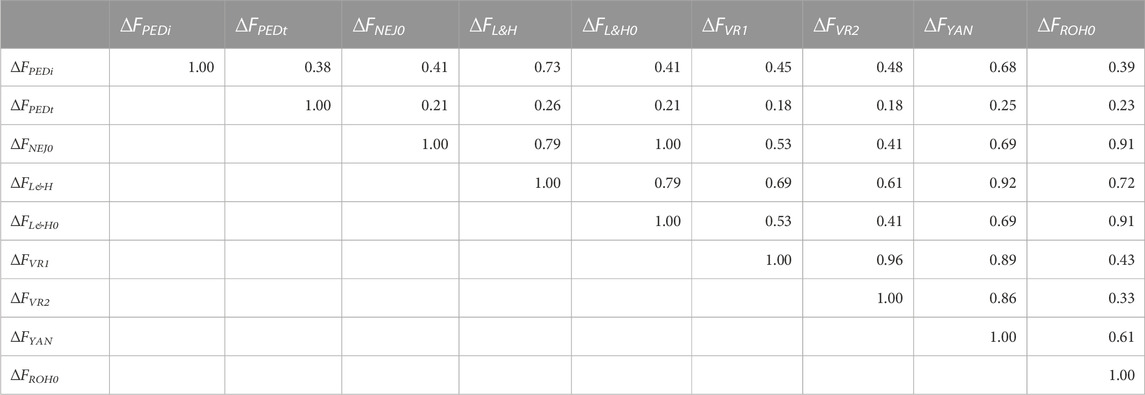
TABLE 3. Correlation coefficients between molecular and pedigree increases in inbreeding coefficients (∆F) of all genotyped individuals. ∆FPEDi was derived from pedigree referenced against the number of generations of the individual. ∆FPEDt was derived from the pedigree referring to the inbreeding coefficient of the individual’s parents. ∆FNEJ was derived from the diagonal of the Nejati-Javaremi matrix. ∆FNEJ0 was derived from inbreeding coefficients (F) obtained using the Nejati-Javaremi matrix (FNEJ) adjusted for the mean FNEJ of the first selection generation. ∆FL&H was derived from the diagonal of the Li and Horvitz matrix. ∆FL&H0 was derived from F using the Li and Horvitz matrix (FL&H) adjusted for the mean FL&H of the first selection generation. ∆FVR1 was derived from the diagonal of the Van Raden type 1 matrix. ∆FVR2 was derived from the diagonal of the Van Raden type 2 matrix. ∆FYAN was derived from the diagonal of the Yang matrix. ∆FROH was computed using runs of homozygosity. ∆FFROH0 was derived from F obtained using runs of homozygosity (FROH) adjusted for the mean FROH of the first selection generation.
Table 4 shows Ne calculated via different methodologies with molecular and pedigree data across the selection generations. The Ne trend stabilises after the 10th generation of selection except for NePEDt, which presented high variability across generations. In fact, NePEDt showed high values in generations 11 (1,482.27) and 26 (1,138.82) and a negative value in the second generation (−80.03). The NePEDi showed neither values as high as NePEDt nor negative values. The NePEDi showed the highest values in the first generations (94.72 in the first, 143.44 in the second, and 129.46 in the third). The lowest value of NePEDi was identified in the 25th generation (34.37). The mean and standard deviation across generations for NePEDt were 125.94 and 346.28, respectively, and 53.58 and 28.38, respectively, for NePEDi. Regarding molecular measurements, Ne performance differed across methodologies. Extremely negative values were detected with NeL&H in the first five generations of selection, the most negative being in the fifth generation (−4,081.60). These extremely negative values translated into a negative mean value (−228.68) with a high standard deviation (988.62). The NeNEJ0, NeL&H0, NeROH0, and NeYAN also presented negative values in the first and second generations. The NeVR2 had lower values compared with other molecular approaches, with a mean of 23.26 compared with 35.87 for NeNEJ0, 35.88 for NeL&H0, 32.66 for NeVR1, 40.76 for NeYAN and 30.48 for NeROH0. The standard deviation of NeVR1 was the lowest (6.11). The evolution of NeNEJ0 and NeL&H0 was almost identical. The evolution of NeNEJ0, NeL&H0, NeVR1, NeYAN, and NeROH0 as of the 10th generation was similar to that of NePEDi, while NeL&H0 showed greater values than NePEDi, and NeVR2 showed lower values than NePEDi. The evolution of NeEXP was more irregular than that of NeNEJ0, with extremely negative and positive values, such as 1852.44 in the 16th generation and −464.38 in the 26th generation (Supplementary Figure S1). When selected lines were analysed separately, NeEXPH presented a more regular evolution than NeEXPL. However, extremely negative and positive values were also observed in both (Supplementary Figure S1).
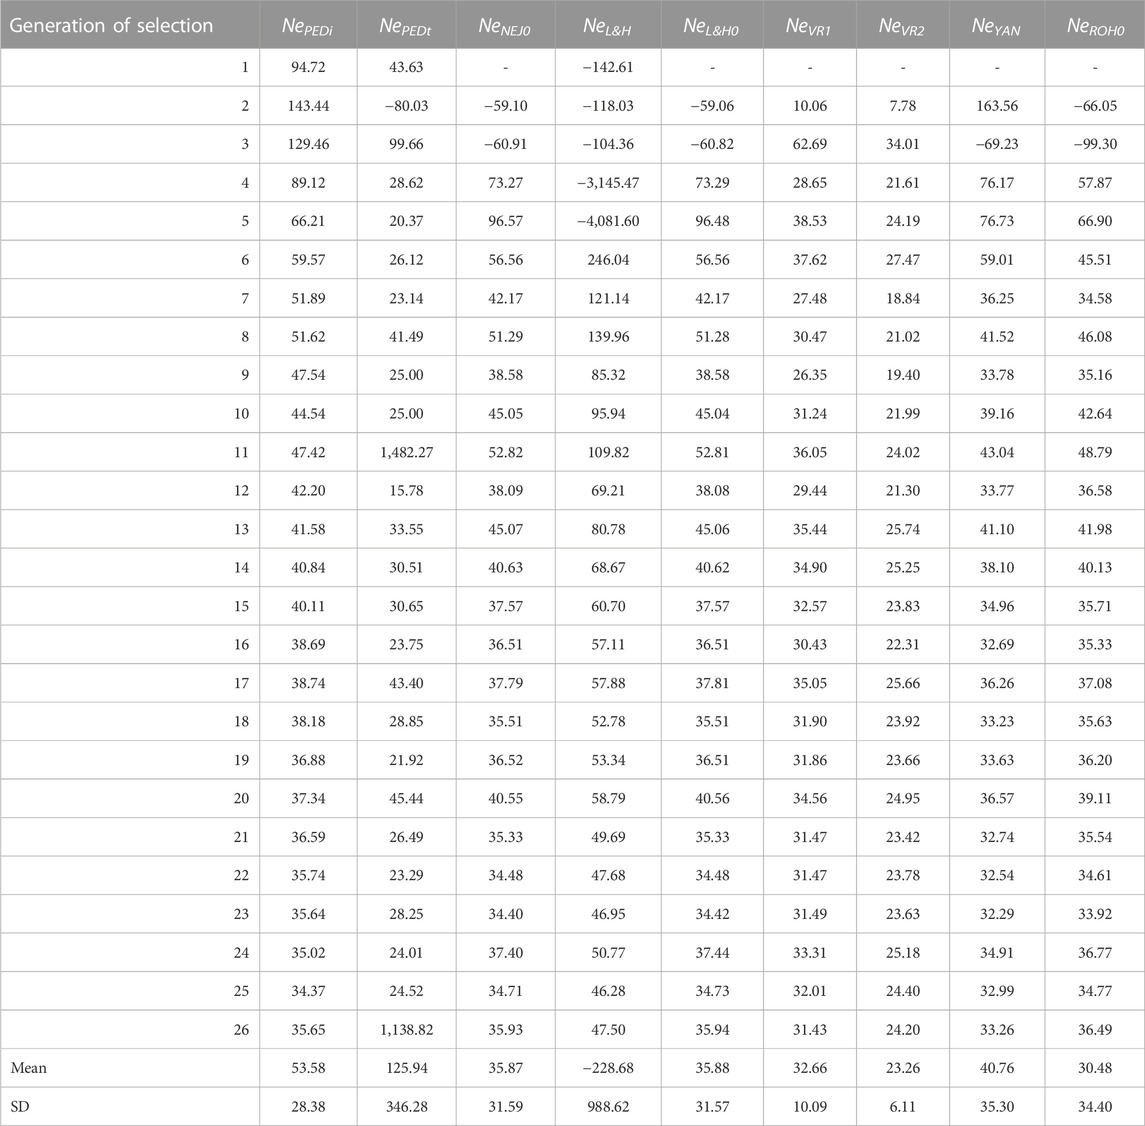
TABLE 4. Evolution across selection generations, total mean, and standard deviation (SD) of the effective population size (Ne) using pedigree and molecular information. NePEDi derived from the individual increase in inbreeding (∆F) refers to the number of individual generations. NePEDt derived from ∆F based on the increase in pedigree inbreeding between two successive generations. NeNEJ0 derived from the inbreeding coefficient (F) of the Nejati-Javaremi genomic matrix (FNEJ) adjusted for the mean FNEJ of the first generation of selection. NeL&H. derived from ∆F of the Li and Horvitz genomic matrix. NeL&H0 derived from F of the Li and Horvitz genomic matrix (FL&H) adjusted for mean FL&H of the first generation of selection. NeVR1 derived from ∆F of the Van Raden type 1 genomic matrix. NeVR2 derived from ∆F of the Van Raden type 2 genomic matrix. NeYAN derived from ∆F of the Yang genomic matrix. NeROH0 derived from the F of runs of homozygosity (FROH) adjusted for mean FROH of the first generation of selection.
The Nes was 85.33, which was used to infer the number of generations that had passed from the founder population from the hypothetical foundation to the first generation of selection using FNEJ (tNEJ) and FROH(tROH) as described above: tNEJ was 162 generations, and tROH was 133 generations.
When pedigree data was used to calculate the number of generations elapsed if the breeding method of the selection experiment would be applied from the founder population of the recorded pedigree to the first generation of the experiment, tPED was two generations.
This population, formed by two divergent lines selected for birth weight variability during twenty-six discrete generations, allowed us to test different inbreeding measures using molecular and pedigree data and their application to compute Ne.
The inbreeding coefficient has been defined in terms of correlations between parents uniting gametes (Wright, 1931) and as a probability that two genes randomly sampled in the parents’ gametes are IBD (Malecot, 1948). Because of FPED is completely defined in terms of IBD probability, the performance of the molecular inbreeding coefficients are going to be compared with FPED, although the use of FPED as the golden standard is not straightforward as assumes that the founders of the pedigree are unrelated (Keller et al., 2011) and provide the expected proportion of inbreeding while ignoring the effects of other forces such as Mendelian sampling, linkage, or natural selection against homozygous alleles (Wright, 1931). The FL&H, FVR1, FVR2, and FYAN behave more like correlations and have negative values in some individuals (Supplementary Table S1), as reported by other authors (Alemu et al., 2021; Villanueva et al., 2021). In the ROH definition, a long stretch of homozygosity is expected to be inherited from a common ancestor (Ceballos et al., 2018); FROH values range from 0 to 1 (Alemu et al., 2021) and present the highest correlations with FPED when all individuals from these populations are used. Therefore, among all the different measures of molecular inbreeding analysed in this population, FROH better fits the IBD definition when FPED is used as the reference coefficient. However, ROH analysis is an empirical, rule-based approach, and detection relies on the definition of several parameters that must be adjusted as a function of several constraints, such as marker density or the number of genotyping errors (Ferenčaković et al., 2013; Meyermans et al., 2020). Hence, ROH detection varied across different studies. Moreover, FROH is more representative of IBD than FNEJ, defined as the proportion of homozygous SNPs in the individual and, thus, unable to differentiate between IBD and identity by state (IBS) (Toro et al., 2014); however, FROH theoretically represents the proportion of long IBS regions in the genome. Furthermore, if FROH and FNEJ were used to infer the number of generations that had passed since the founder population, tNEJ would be expected to present the highest value due to FNEJ being fully IBS, while FROH is expected to be more representative of IBD. The high values of tPED and tROH reflected the history of the founder population originating from the genetic contribution of three inbred mouse lines: BALB/c, C57BL and CBA. This mixed starting population was maintained under panmixia for 40 generations before the start of the selection experiment (Formoso-Rafferty et al., 2016b). The lowest correlations between FPED and molecular inbreeding coefficients were detected with FVR1 and FVR2. In addition, other authors (Caballero et al., 2022) reported that the poorest performance with regard to IBD was detected for FVR2.
The number of generations that had passed before starting the experiment inferred from pedigree (tPED) was very low. Pedigrees, however, are usually limited to a few past generations and ignore some of the ancestral relationships (Keller et al., 2011). In this case, FPED was calculated using five generations before initiating the experiment, and the mating method was changed at this start; therefore, tPED was lower than the number of generations that had passed since the founder population in the pedigree.
When all data was used, correlations between different inbreeding measures were high. In other studies in Iberian pigs (Saura et al., 2015), cattle (Alemu et al., 2021; Lozada-Soto et al., 2022) or humans (McQuillan et al., 2012), strong correlations were also detected. However, when a low number of generations was used, the correlations between different pedigrees and genomic inbreeding measures were lower. Therefore, the high correlations observed when using all animals across generations were probably because of the large number of genotypes distributed across generations, resulting in a wide range of inbreeding values in all coefficients. This demonstrates that this experimental population was of particular interest to check the relationship between the different parameters assayed. Moreover, other authors reported that the incompleteness of the pedigree should lead to poor correlations (Schiavo et al., 2022). Furthermore, the correlations between the different increases in inbreeding were lower than between the inbreeding coefficients because, firstly, ∆FPEDi and ∆F molecular are standardised by the depth of pedigree information. Therefore, the evolution of ∆F was expected to be stable if the mating design remains stable across generations, generating less variation than in the case of inbreeding coefficients and lower correlations. In addition, ΔFPEDi was also expected to correlate better with the other coefficients than ∆FPEDt, because the estimating molecular ∆Fs were designed following ∆FPEDi. We could not fit the ∆FPEDt formula to the molecular information because we did not genotype the trios.
If the frequencies of the base population are known, the performances of FL&H, FVR1, FVR2, and FYAN are in terms of IBD (Caballero et al., 2022). However, other authors have reported that FL&H, FVR1, FVR2, and FYAN presented values outside of Malecot and Wright’s inbreeding definitions and that FNEJ better fitted these definitions, as its values ranged between 0 and 1 (Saura et al., 2015; Villanueva et al., 2021). Moreover, Villanueva et al. (2021) observed that only FL&H could be interpreted in terms of loss or gain of genetic variability, while FVR1, FVR2, and FYAN presented some inconsistencies concerning loss or gain of genetic variability. Regarding the application of inbreeding measures, FROH and FPED should be preferred to measure the increase in whole genome homozygosity, and FROH should be preferred over FPED when pedigrees are not deep enough or present many errors (Keller et al., 2011; Alemu et al., 2021).
It has been reported that FYAN and FVR2, giving higher weight to rare alleles (Villanueva et al., 2021), presented the highest correlation with homozygosity at SNPs with moderate to high MAFs (Alemu et al., 2021). However, alleles with low MAFs are more representative of kinship because of the higher probability of being transmitted when individuals belong to the same family. Hence, FPED and FROH. did not reflect the segregation of these low-frequency alleles that could be an indicator of kinship. Therefore, to measure global inbreeding, FPED and FROH were more useful (Alemu et al., 2021; Caballero et al., 2022), and FYAN or FVR2 could be better for measuring population kinship.
The FL&H represents a modification of FNEJ adjusted for the expected homozygosity of the reference population. Hence, these inbreeding coefficients have negative values in some individuals (Supplementary Table S3). For FL&H, this is clearly represented in Figure 1, where expected homozygosity was greater than FNEJ during the first ten generations. This was reflected as negative values of the individual increases in inbreeding and high negative and positive NeL&H values during the first eleven generations. The FL&H is designed using the allele frequencies of a reference population to express homozygosity in terms of IBD, such as FVR1, FVR2, and FYAN. However, ∆FL&H presented more variability during the first five generations of selection (Figure 3) than FVR1, FVR2, and FYAN. This was probably because FL&H had a higher influence on the change in the mating design during the first selection generations and was more dependent on Hardy-Weinberg disequilibrium. This problem was solved when FL&H was adjusted for the mean inbreeding coefficient of the first generation of selection (NeL&H0). Arias et al. (2023) described that the adjustment of the inbreeding coefficients by the mean of the reference population did not allow a complete correction of the estimates, however, the use of the allele frequencies of the RP to estimate the IBD evolution in the population studied hides some assumptions, as the reference population is in Hardy-Weinberg equilibrium or that the RP have no molecular kindship, as it is assumed to be the real founder population. Therefore, adjusting the molecular inbreeding estimates for the mean inbreeding of the RP brings these estimates closer to the IBD definition. In this context, FROH and FNEJ presented the advantage of not being influenced by the allele frequencies of the RP in their estimation and of being easily corrected by the mean FROH and FNEJ of the RP. Furthermore, the first two generations presented negative values for NeNEJ0, NeL&H0, and NeROH0. due to a negative individual increase in inbreeding produced by a negative trend of inbreeding coefficients in the first two generations, which was probably produced by the abrupt change in mating design. Thus, this negative trend could also be because in the five previous generations before the experiment, individuals were randomly mated, and from the first generation of selection, matings were designed to avoid sharing grandparents to avoid inbreeding. In addition, none of the effective population sizes started to present stable values until the 10th generation. Toro et al. (2020) had previously pointed out that when optimal management of genetic diversity is implemented in a population, molecular estimates of Ne could be meaningless because the increase in genetic diversity resulted in negative Ne. In addition, none of the effective population sizes began to present stable values until the 10th generation. Therefore, in this population, ten generations of selection were needed to reflect the change in mating method by the effective population size, as expected, since Ne is a diversity indicator strongly influenced by the change in mating policy, as seen in the results of this study (Table 3).
The NeNEJ0 and NeL&H0 presented almost identical values in this population and similar values to NePEDi. NeNEJ0 presented the advantage of not using the frequencies of a reference population such as NeFROH0 and, therefore, are less dependent on allele frequencies.
Comparing NePEDi and NePEDt, the latter presented a higher standard deviation, as other authors reported that NePEDt presented high fluctuations over time due to the high impact of breeding method changes, errors in pedigree registration, or sampling effects (Gutiérrez et al., 2008; Gutiérrez et al., 2009; Cervantes et al., 2011; Leroy et al., 2013) and could lead to negative values (Groeneveld et al., 2009; Leroy et al., 2009; Nagy et al., 2010). The NePEDi values were high during the 10th–12th first generations. After that, the evolution of NePEDi tended to be stable and reflected the history of mating. Moreover, no negative values were observed, and the standard deviation was lower. Furthermore, NePEDi evolved to be similar to the number of males of females mated in the selection experiment, accounting for the intensity of selection that could be influencing the evolution of homozygosity in this population, when the weight of the random mating previous to the experiment decreased. Another study performed in French Angora rabbits divergently selected for total fleece weight, showed that the low line had high Ne values calculated from pedigree data. However, this line always showed lower levels of inbreeding than the high line over the years of selection, even though the mating policy was the same in both lines (Rafat et al., 2009). This did not occur in our selection lines, both of which had almost the same level of inbreeding since the beginning of the experiment (results not shown).
The minimum viable population size thresholds have been traditionally defined as 50 for the short term and 500 for the long term (Harmon and Braude, 2010). All Ne values of the last generations obtained for this population were lower than the defined thresholds. Low Ne levels relate to a decrease in genetic variability, allele fixation, and a reduction in the selection response (Domínguez-Viveros et al., 2020). Nevertheless, the use of a strict critical level for Ne is not straightforward, as different factors could affect its interpretation, such as the method used, the species, or population structure (Leroy et al., 2013; Mokhtari et al., 2015). Moreover, in other studies, effective population sizes below 50 were reported in some species that did not present viability problems (Leroy et al., 2013). Therefore, this threshold should be revised and adapted to the particularity of each population.
The results obtained in these studies allowed to understand better the performance of different inbreeding coefficients and effective population sizes applied in a population with many discrete generations and under strong selection. Moreover, these results could be used as a reference for the study of inbreeding and genetic diversity in other populations. The FROH and FPED presented the strongest correlations and were more representative of inbreeding in terms of IBD. However, other measures such as FYAN were useful in terms of rare alleles, which are more likely inherited from common ancestors. Adjusting the inbreeding estimates to the mean inbreeding of the reference population allowed it to fit more closely to IBD. The NePEDi presented a more reliable performance than NePEDt. In general, Ne obtained by molecular data showed a similar trend when comparing molecular approaches to each other and NePEDi, being more similar to NeL&H0 and NeNEJ0. However, data from several generations was necessary to reach a stable trend for Ne, both with pedigree and molecular data.
The data presented in the study are deposited in the Figshare repository, accession link: https://figshare.com/s/632fbaefccc501da66e1.
The animal study was approved by Animal Experimentation Committee (PROEX 224/18). The study was conducted in accordance with the local legislation and institutional requirements.
CO-M: Conceptualization, Data curation, Formal Analysis, Investigation, Methodology, Software, Visualization, Writing–original draft, Writing–review and editing. IC: Conceptualization, Investigation, Project administration, Resources, Supervision, Validation, Writing–review and editing. NF-R: Data curation, Supervision, Writing–review and editing. JPG: Conceptualization, Formal Analysis, Investigation, Methodology, Software, Supervision, Writing–review and editing.
The authors declare financial support was received for the research, authorship, and/or publication of this article. This study was funded by a grant from the Ministry of Science, Innovation, and Universities; grant number: PGC 2018-096198-A-I00.
The genotyping service was carried out at CEGEN-PRB3-ISCIII; it is supported by grant PT17/0019 of the PE I+D+i 2013-2016 and funded by ISCII and ERDF.
The authors declare that the research was conducted in the absence of any commercial or financial relationships that could be construed as a potential conflict of interest.
All claims expressed in this article are solely those of the authors and do not necessarily represent those of their affiliated organizations, or those of the publisher, the editors and the reviewers. Any product that may be evaluated in this article, or claim that may be made by its manufacturer, is not guaranteed or endorsed by the publisher.
The Supplementary Material for this article can be found online at: https://www.frontiersin.org/articles/10.3389/fgene.2023.1303748/full#supplementary-material
Alemu, S. W., Kadri, N. K., Harland, C., Faux, P., CharlierCaballero, A., Druet, T., et al. (2021). An evaluation of inbreeding measures using a whole-genome sequenced cattle pedigree. Hered. (Edinb). 126, 410–423. doi:10.1038/s41437-020-00383-9
Arias, K. D., Gutiérrez, J. P., Fernández, I., Álvarez, I., and Goyache, F. (2023). Approaching autozygosity in a small pedigree of Gochu Asturcelta pigs. Genet. Sel. Evol. 25, 74. doi:10.1186/s12711-023-00846-7
Caballero, A., Fernández, A., Villanueva, B., and Toro, M. A. (2022). A comparison of marker-based estimators of inbreeding and inbreeding depression. Genet. Sel. Evol. 54 (1), 82. doi:10.1186/s12711-022-00772-0
Ceballos, F. C., Joshi, P. K., Clark, D. W., Ramsay, M., and Wilson, J. F. (2018). Runs of homozygosity: windows into population history and trait architecture. Nat. Rev. Genet. 19 (4), 220–234. doi:10.1038/nrg.2017.109
Cervantes, I., Goyache, F., Molina, A., Valera, M., and Gutiérrez, J. P. (2008). Application of individual increase in inbreeding to estimate realized effective sizes from real pedigrees. J. Anim. Breed. Genet. 125 (5), 301–310. doi:10.1111/j.1439-0388.2008.00755.x
Cervantes, I., Goyache, F., Molina, A., Valera, M., and Gutiérrez, J. P. (2011). Estimation of effective population size from the rate of coancestry in pedigreed populations. J. Anim. Breed. Genet. 128 (1), 56–63. doi:10.1111/j.1439-0388.2010.00881.x
Chang, C. C., Chow, C. C., Tellier, L. C., Vattikuti, S., Purcell, S. M., and Lee, J. J. (2015). Second-generation PLINK: rising to the challenge of larger and richer datasets. GigaScience 4, 7. doi:10.1186/s13742-015-0047-8
Domínguez-Viveros, J., Rodríguez-Almeida, F. A., Medellín-Cázares, A., and Gutiérrez, J. P. (2020). Análisis del pedigrí en diez poblaciones mexicanas de ovinos. Rev. Mex. Cienc. Pecu. 11 (4), 1071–1086. doi:10.22319/rmcp.v11i4.5457
Druet, T., and Gautier, M. (2017). A model-based approach to characterize individual inbreeding at both global and local genomic scales. Mol. Ecol. 26 (20), 5820–5841. doi:10.1111/mec.14324
Falconer, D. S., and MacKay, T. F. C. (1996). Introduction to quantitative genetics. Harlow, England: Prentice Hall.
Ferenčaković, M., Sölkner, J., and Curik, I. (2013). Estimating autozygosity from high-throughput information: effects of SNP density and genotyping errors. Genet. Sel. Evol. 45 (1), 42. doi:10.1186/1297-9686-45-42
Formoso-Rafferty, N., Cervantes, I., Ibáñez-Escriche, N., and Gutiérrez, J. P. (2016a). Correlated genetic trends for production and welfare traits in a mouse population divergently selected for birth weight environmental variability. Animal 10, 1770–1777. doi:10.1017/S1751731116000860
Formoso-Rafferty, N., Cervantes, I., Ibáñez-Escriche, N., and Gutiérrez, J. P. (2016b). Genetic control of the environmental variance for birth weight in seven generations of a divergent selection experiment in mice. J. Anim. Breed. Genet. 133 (3), 227–237. doi:10.1111/jbg.12174
Formoso-Rafferty, N., Cervantes, I., Ibáñez-Escriche, N., and Gutiérrez, J. P. (2017). Modulating birth weight heritability in mice. J. Anim. Sci. 95, 531–537. doi:10.2527/jas2016.1169
Formoso-Rafferty, N., Cervantes, I., Sánchez, J. P., Gutiérrez, J. P., and Bodin, L. (2019). Effect of feed restriction on the environmental variability of birth weight in divergently selected lines of mice. Genet. Sel. Evol. 51 (1), 27. doi:10.1186/s12711-019-0471-9
Formoso-Rafferty, N., Chavez, K. N., Ojeda, C., Cervantes, I., and Gutiérrez, J. P. (2020). Selection response in a divergent selection experiment for birth weight variability in mice compared with a control line. Anim. (Basel) 10 (6), 920. doi:10.3390/ani10060920
Formoso-Rafferty, N., El-Ouazizi El-Kahia, L., Arias-Álvarez, M., Gutiérrez, J. P., and Cervantes, I. (2023). Embryo survival and fertility differ in lines divergently selected for birth weight homogeneity in mice. J. Anim. Breed. Genet. 140, 549–557. doi:10.1111/jbg.12778
Formoso-Rafferty, N., Gutiérrez, J. P., García-Álvarez, A., Pérez, T., and Cervantes, I. (2022). Impact of selection for birth weight variability on reproductive longevity: a mice model. J. Anim. Breed. Genet. 139 (4), 370–379. doi:10.1111/jbg.12676
Frankham, R., Ballou, J. D., and Briscoe, D. A. (2010). Introduction to conservation genetics. New York: Cambridge University Press.
González-Recio, O., and López de MaturanaGutiérrez, E. J. P. (2007). Inbreeding depression on female fertility and calving ease in Spanish dairy cattle. J. Dairy. Sci. 90, 5744–5752. doi:10.3168/jds.2007-0203
Groeneveld, E., Westhuizen, B. V. D., Maiwashe, A., Voordewind, F., and Ferraz, J. B. S. (2009). POPREP: a generic report for population management. Genet. Mol. Res. 8 (3), 1158–1178. doi:10.4238/vol8-3gmr648
Gutiérrez, J. P., Cervantes, I., and Goyache, F. (2009). Improving the estimation of realized effective population sizes in farm animals. J. Anim. Breed. Genet. 126 (4), 327–332. doi:10.1111/j.1439-0388.2009.00810.x
Gutiérrez, J. P., Cervantes, I., Molina, A., Valera, M., and Goyache, F. (2008). Individual increase in inbreeding allows estimating effective sizes from pedigrees. Genet. Sel. Evol. 40 (4), 359–378. doi:10.1186/1297-9686-40-4-359
Gutierrez, J. P., and Goyache, F. (2005). A note on ENDOG: a computer program for analysing pedigree information. J. Anim. Breed. Genet. 122 (3), 172–176. doi:10.1111/j.1439-0388.2005.00512.x
Harmon, L., and Braude, S. (2010). “Conservation of small populations: effective population sizes, inbreeding, and the 50/500 rule,” in An introduction to methods and models in ecology, evolution, and conservation biology. Editors S. Braude, and S. B. Low (Princeton, New Jersey, USA: Princeton University Press), 125–138.
Hedrick, P. W. (2012). What is the evidence for heterozygote advantage selection? Trends. Ecol. Evol. 27 (12), 698–704. doi:10.1016/j.tree.2012.08.012
Hill, W. G. (1981). Estimation of effective population size from data on linkage disequilibrium. Genet. Res. 38, 209–216. doi:10.1017/s0016672300020553
Howard, J. T., Pryce, J. E., Baes, C., and Maltecca, C. (2017). Invited review: inbreeding in the genomics era: inbreeding, inbreeding depression, and management of genomic variability. J. Dairy. Sci. 100 (8), 6009–6024. doi:10.3168/jds.2017-12787
Keller, M. C., Visscher, P. M., and Goddard, M. E. (2011). Quantification of inbreeding due to distant ancestors and its detection using dense single nucleotide polymorphism data. Genetics 189 (1), 237–249. doi:10.1534/genetics.111.130922
Krimbas, C. B., and Tsakas, S. (1971). The genetics of Dacus oleae V. Changes of esterase polymorphism in a naturas population following insecticide control: selection or drift? Evolution 25, 565–578. doi:10.1111/j.1558-5646.1971.tb01904.x
Leroy, G., Mary-Huard, T., Verrier, E., Danvy, S., Charvolin, E., and Danchin-Burge, C. (2013). Methods to estimate effective population size using pedigree data: examples in dog, sheep, cattle and horse. Genet. Sel. Evol. 45 (1), 1. doi:10.1186/1297-9686-45-1
Leroy, G., Verrier, E., Meriaux, J. C., and Rognon, X. (2009). Genetic diversity of dog breeds: within-breed diversity comparing genealogical and molecular data. Anim. Genet. 40 (3), 323–332. doi:10.1111/j.1365-2052.2008.01842.x
Leutenegger, A. L., Prum, B., Génin, E., Verny, C., Lemainque, A., Clerget-Darpoux, F., et al. (2003). Estimation of the inbreeding coefficient through use of genomic data. Am. J. Hum. Genet. 73 (3), 516–523. doi:10.1086/378207
Li, C. C., and Horvitz, D. G. (1953). Some methods of estimating the inbreeding coefficient. Am. J. Hum. Genet. 5 (2), 107–117.
Lozada-Soto, E. A., Tiezzi, F., Jiang, J., Cole, J. B., VanRaden, P. M., and Maltecca, C. (2022). Genomic characterization of autozygosity and recent inbreeding trends in all major breeds of US dairy cattle. J. Dairy. Sci. 105 (11), 8956–8971. doi:10.3168/jds.2022-22116
McQuillan, R., Eklund, N., Pirastu, N., Kuningas, M., McEvoy, B. P., Esko, T., et al. (2012). Evidence of inbreeding depression on human height. PLOS Genet. 8 (7), e1002655. doi:10.1371/journal.pgen.1002655
Meuwissen, T., and Luo, Z. (1992). Computing inbreeding coefficients in large populations. Genet. Sel. Evol. 24 (4), 305–313. doi:10.1186/1297-9686-24-4-305
Meyermans, R., Gorssen, W., Buys, N., and Janssens, S. (2020). How to study runs of homozygosity using PLINK? A guide for analyzing medium density SNP data in livestock and pet species. BMC Genomics 21 (1), 94. doi:10.1186/s12864-020-6463-x
Mokhtari, M. S., Miraei-Ashtiani, S. R., Jafaroghli, M., and Gutiérrez, J. P. (2015). Studying genetic diversity in moghani sheep using pedigree analysis. J. Agr. Sci. Tech. 17, 1151–1160.
Nagy, I., Curik, I., Radnai, I., Cervantes, I., Gyovai, P., Baumung, R., et al. (2010). Genetic diversity and population structure of the synthetic Pannon White rabbit revealed by pedigree analyses. J. Anim. Sci. 88 (4), 1267–1275. doi:10.2527/jas.2009-2273
Nei, M., and Tajima, F. (1981). Genetic drift and estimation of effective population size. Genetics 98 (3), 625–640. doi:10.1093/genetics/98.3.625
Nejati-Javaremi, A., Smith, C., and Gibson, J. P. (1997). Effect of total allelic relationship on accuracy of evaluation and response to selection. J. Anim. Sci. 75 (7), 1738–1745. doi:10.2527/1997.7571738x
Peripolli, E., Munari, D. P., Silva, M. V. G. B., Lima, A. L. F., Irgang, R., and Baldi, F. (2017). Runs of homozygosity: current knowledge and applications in livestock. Anim. Genet. 48 (3), 255–271. doi:10.1111/age.12526
Pollak, E. (1983). A new method for estimating the effective population size from allele frequency changes. Genetics 104 (3), 531–548. doi:10.1093/genetics/104.3.531
Pudovkin, A. I., Zaykin, D. V., and Hedgecock, D. (1996). On the potential for estimating the effective number of breeders from heterozygote-excess in progeny. Genetics 144 (1), 383–387. doi:10.1093/genetics/144.1.383
Rafat, S. A., Allain, D., and de Rochambeau and, H. (2009). Genetic description of a divergent selection experiment in Angora rabbits with overlapping generations. J. Anim. Breed. Genet. 126 (3), 189–197. doi:10.1111/j.1439-0388.2008.00769.x
Rizopoulos, D. (2007). Ltm: AnRPackage for latent variable modeling and item response theory analyses. J. Stat. Soft 17, 1–25. doi:10.18637/jss.v017.i05
Rodríguez-Ramilo, S. T., Elsen, J. M., and Legarra, A. (2019). Inbreeding and effective population size in French dairy sheep: comparison between genomic and pedigree estimates. J. Dairy. Sci. 102 (5), 4227–4237. doi:10.3168/jds.2018-15405
Saura, M., Fernández, A., Varona, L., Fernández, A. I., de Cara, M., Barragán, C., et al. (2015). Detecting inbreeding depression for reproductive traits in Iberian pigs using genome-wide data. Genet. Sel. Evol. 47, 1. doi:10.1186/s12711-014-0081-5
Schiavo, G., Bovo, S., Ribani, A., Moscatelli, G., Bonacini, M., Prandi, M., et al. (2022). Comparative analysis of inbreeding parameters and runs of homozygosity islands in 2 Italian autochthonous cattle breeds mainly raised in the Parmigiano-Reggiano cheese production region. J. Dairy. Sci. 105 (3), 2408–2425. doi:10.3168/jds.2021-20915
Sjödin, P., Kaj, I., Krone, S., Lascoux, M., and Nordborg, M. (2005). On the meaning and existence of an effective population size. Genetics 169 (2), 1061–1070. doi:10.1534/genetics.104.026799
Tallmon, D. A., Koyuk, A., Luikart, G., and Beaumont, M. A. (2008). COMPUTER PROGRAMS: onesamp: a program to estimate effective population size using approximate Bayesian computation. Mol. Ecol. Res. 8 (2), 299–301. doi:10.1111/j.1471-8286.2007.01997.x
Toro, M. A., Villanueva, B., and Fernández, J. (2014). Genomics applied to management strategies in conservation programmes. Livest. Sci. 166, 48–53. doi:10.1016/j.livsci.2014.04.020
Toro, M. A., Villanueva, B., and Fernández, J. (2020). The concept of effective population size loses its meaning in the context of optimal management of diversity using molecular markers. J. Anim. Breed. Genet. 137 (4), 345–355. doi:10.1111/jbg.12455
VanRaden, P. M. (2008). Efficient methods to compute genomic predictions. J. Dairy. Sci. 91 (11), 4414–4423. doi:10.3168/jds.2007-0980
VanRaden, P. M., Olson, K. M., Wiggans, G. R., Cole, J. B., and Tooker, M. E. (2011). Genomic inbreeding and relationships among Holsteins, Jerseys, and Brown Swiss. J. Dairy. Sci. 94 (11), 5673–5682. doi:10.3168/jds.2011-4500
Villanueva, B., Fernández, A., Saura, M., Caballero, A., Fernández, J., Morales-González, E., et al. (2021). The value of genomic relationship matrices to estimate levels of inbreeding. Genet. Sel. Evol. 53 (1), 42. doi:10.1186/s12711-021-00635-0
Wang, J., Santiago, E., and Caballero, A. (2016). Prediction and estimation of effective population size. Heredity 117 (4), 193–206. doi:10.1038/hdy.2016.43
Wright, S. (1931). Evolution in mendelian populations. Genetics 16 (2), 97–159. doi:10.1093/genetics/16.2.97
Keywords: genomic inbreeding, effective population size, divergent selection, birth weight environmental variability, increase in inbreeding
Citation: Ojeda-Marín C, Cervantes I, Formoso-Rafferty N and Gutiérrez JP (2023) Genomic inbreeding measures applied to a population of mice divergently selected for birth weight environmental variance. Front. Genet. 14:1303748. doi: 10.3389/fgene.2023.1303748
Received: 28 September 2023; Accepted: 27 November 2023;
Published: 14 December 2023.
Edited by:
Luis Varona, University of Zaragoza, SpainReviewed by:
Ricardo Pong-Wong, University of Edinburgh, United KingdomCopyright © 2023 Ojeda-Marín, Cervantes, Formoso-Rafferty and Gutiérrez. This is an open-access article distributed under the terms of the Creative Commons Attribution License (CC BY). The use, distribution or reproduction in other forums is permitted, provided the original author(s) and the copyright owner(s) are credited and that the original publication in this journal is cited, in accordance with accepted academic practice. No use, distribution or reproduction is permitted which does not comply with these terms.
*Correspondence: Candela Ojeda-Marín, Y2FuZGVsYW9AdWNtLmVz
Disclaimer: All claims expressed in this article are solely those of the authors and do not necessarily represent those of their affiliated organizations, or those of the publisher, the editors and the reviewers. Any product that may be evaluated in this article or claim that may be made by its manufacturer is not guaranteed or endorsed by the publisher.
Research integrity at Frontiers
Learn more about the work of our research integrity team to safeguard the quality of each article we publish.