
95% of researchers rate our articles as excellent or good
Learn more about the work of our research integrity team to safeguard the quality of each article we publish.
Find out more
ORIGINAL RESEARCH article
Front. Genet. , 26 October 2023
Sec. Genomics of Plants and the Phytoecosystem
Volume 14 - 2023 | https://doi.org/10.3389/fgene.2023.1266402
This article is part of the Research Topic Genetic Advancements for Improving the Plant Tolerance to Biotic and Abiotic Stresses View all 13 articles
 Collins Kimutai1,2‡
 Noel Ndlovu3‡†
 Vijay Chaikam2†Berhanu Tadesse Ertiro2
 Biswanath Das2
 Yoseph Beyene2Oliver Kiplagat1
 Charles Spillane3†
 Boddupalli M. Prasanna2†
 Manje Gowda2*†
Low soil nitrogen levels, compounded by the high costs associated with nitrogen supplementation through fertilizers, significantly contribute to food insecurity, malnutrition, and rural poverty in maize-dependent smallholder communities of sub-Saharan Africa (SSA). The discovery of genomic regions associated with low nitrogen tolerance in maize can enhance selection efficiency and facilitate the development of improved varieties. To elucidate the genetic architecture of grain yield (GY) and its associated traits (anthesis-silking interval (ASI), anthesis date (AD), plant height (PH), ear position (EPO), and ear height (EH)) under different soil nitrogen regimes, four F3 maize populations were evaluated in Kenya and Zimbabwe. GY and all the traits evaluated showed significant genotypic variance and moderate heritability under both optimum and low nitrogen stress conditions. A total of 91 quantitative trait loci (QTL) related to GY (11) and other secondary traits (AD (26), PH (19), EH (24), EPO (7) and ASI (4)) were detected. Under low soil nitrogen conditions, PH and ASI had the highest number of QTLs. Furthermore, some common QTLs were identified between secondary traits under both nitrogen regimes. These QTLs are of significant value for further validation and possible rapid introgression into maize populations using marker-assisted selection. Identification of many QTL with minor effects indicates genomic selection (GS) is more appropriate for their improvement. Genomic prediction within each population revealed low to moderately high accuracy under optimum and low soil N stress management. However, the accuracies were higher for GY, PH and EH under optimum compared to low soil N stress. Our findings indicate that genetic gain can be improved in maize breeding for low N stress tolerance by using GS.
Maize (Zea mays L.), a staple crop in sub-Saharan Africa (SSA), is projected to increase in demand (Ekpa et al., 2018), necessitating improved breeding systems to maximize productivity. Over the years, maize productivity in SSA has been limited by the adverse effects of parasitic weeds (e.g., Striga sp. (Kanampiu et al., 2018; Yacoubou et al., 2021)), insect infestations (e.g., fall armyworm (Baudron et al., 2019; De Groote et al., 2020)), and disease incidences (e.g., Maize lethal necrosis (Boddupalli et al., 2020)). Most notably, inadequate soil fertility (particularly low nitrogen) is a primary cause of low maize yields in the region’s smallholder farming communities. Modelling studies have established that climate change has the potential to worsen these current maize production constraints (Tesfaye et al., 2015), especially under low soil nitrogen conditions (Falconnier et al., 2020). In this regard, maize breeding holds a significant potential to provide sustainable solutions to the prevailing and projected biotic and abiotic constraints (Eriksson et al., 2018; Ndlovu, 2020).
As nitrogen use efficiency (NUE) is critical for sustainable productivity, there is major interest in developing varieties that perform better in low soil nitrogen stress conditions (Ribaut et al., 2007). However, to harness plant breeding for such stress conditions, an understanding of the performance of maize genotypes under low nitrogen conditions is required. Assessing the performance of maize genotypes under different nitrogen regimes is critical for identifying promising parental lines. Phenotypic evaluations can reveal useful diversity in maize germplasm (Shitta et al., 2021; Chen et al., 2023a). However, morphological characterizations of genotypes are influenced by both the genotype (G) and environment (E), as well as G × E interaction, and hence may not accurately reflect the genotypic effect of nitrogen utilization per se (de Carvalho et al., 2012). In addition, large genotype X season and genotype × location interactions can stymie progress in selecting for low nitrogen tolerance (Ribaut et al., 2007). In this context, understanding the genetic architecture of grain yield (GY) and other secondary traits that are associated with low soil nitrogen can speed up genetic improvement (Ertiro et al., 2020c) for low nitrogen tolerance in tropical maize.
Maize GY under low soil nitrogen is a complex trait governed by multiple genes. In most cases, maize breeding for low nitrogen focuses on the anthesis-silking interval (ASI), anthesis date (AD), plant height (PH), ear position (EPO), and ear height (EH) for indirect selection and GY for direct selection (Worku et al., 2007; Worku et al., 2008; Worku et al., 2012; Das et al., 2019; Ertiro et al., 2020b; Ertiro et al., 2022; Ndlovu et al., 2022). However, morphological characterizations are time-consuming, cost-ineffective, and lack accuracy. The complex nature of breeding maize under low nitrogen conditions has necessitated the use of quantitative trait loci (QTL) based approaches which have been shown to contribute significantly to the understanding of the genetic basis of crop performance and stability under nitrogen-stressed conditions (Semagn et al., 2015). The discovery and characterization of QTL can assist breeders in using genomic regions linked with complex trait expression and deciphering their genetic contribution at the target loci (Ertiro et al., 2020c). In addition, through QTL analysis, the biological mechanisms responsible for phenotypic expression can be pursued. Furthermore, exploiting molecular markers in breeding has allowed the mapping of a subset of markers associated with one or more QTL that contribute to regulating the expression of complex traits like GY. Such molecular markers can form the concrete basis for the use of other genomic approaches such as genomic selection in the desired population (Würschum, 2012). Unfortunately, little is known about the genetic basis of GY and associated traits under low nitrogen conditions, and major effect QTLs are yet to be reported (Ertiro et al., 2020c).
Genomic selection (GS) is a tool increasingly used to reduce the breeding cycle length and increase genetic gain in both crops and livestock (Meuwissen et al., 2001). The success of GS in the dairy industry (where the breeding cycle of the cattle can be reduced from 7 years to 18 months) has helped to achieve twice the genetic gain for key traits (García-Ruiz et al., 2016). Such successes have motivated plant breeders to apply GS in crop improvement for reducing the breeding cycle and increase genetic gain. Currently, GS is applied to improve a range of different traits in maize (Beyene et al., 2015; Ertiro et al., 2020a; Kibe et al., 2020; Gowda et al., 2021; Ndlovu et al., 2022), wheat (Dreisigacker et al., 2021; Bonnett et al., 2022; Juliana et al., 2022; Ficht et al., 2023), and other crops (Hu et al., 2022; Qin et al., 2022; Chen et al., 2023b). GS has been successfully integrated into maize breeding programs for improving GY under optimum and drought conditions (Beyene et al., 2015; Zhang et al., 2017b; Vivek et al., 2017; Beyene et al., 2019; Wang et al., 2020; Beyene et al., 2021). Linkage mapping enables the detection of QTL for the target trait by using different bi-parental populations, whereas GS enables the selection of superior individuals by considering the effects of multiple genes controlling a target trait (Crossa et al., 2017; Yuan et al., 2019). Combining linkage mapping results with GS will accelerate the breeding efficiency for GY and other complex traits under low N stress conditions. Therefore, the full potential of GS needs to be assessed in biparental and/or practical breeding populations for low soil N tolerance.
Studies conducted over the last 20 years have identified QTL that generally explained a significant portion of the phenotypic variance, and therefore gave rise to an optimistic assessment of the prospects of marker-assisted selection (Semagn et al., 2010). According to Coque and Gallais (2006), the detected marker QTL associations in maize revealed the consistency of the involvement of some traits, such as root architecture and glutamine synthase activity, which would be of major importance for GY setting under both optimum and low nitrogen conditions. The discovery of genomic regions associated with GY and other agronomic traits in maize under low soil nitrogen conditions is of paramount importance. Hence, this study sought to evaluate four F3 populations to 1) estimate the phenotypic effect and heritability for GY and other agronomic traits under optimum and low nitrogen management 2) identify the genomic regions associated with these traits, and 3) assessing the usefulness of GS in improving GY and other agronomic traits under optimum and low soil N conditions. The findings of this study can provide genetic resources that can be used in scaling the application of MAS for enhancing maize GY in nitrogen-starved soils in SSA. Furthermore, the identification of QTL can hasten maize breeding cycles and facilitate the release of nitrogen-tolerant or NUE varieties for resource-constrained smallholder farmer communities in the region.
Four F3 tropical maize populations were evaluated in Kenya and Zimbabwe. The populations were developed by the Global Maize Program of the International Maize and Wheat Improvement Center (CIMMYT). The specific details of the tested populations are presented in Table 1. These lines are adapted to mid-altitude regions (1,000–1500 M Above sea level) of SSA. They are bred on a good-by-good basis and adapted to stress conditions. Populations are test crossed with an appropriate tester from the opposite heterotic group for phenotypic evaluations. The CIMMYT lines utilized for the project were derived from breeding programs targeting tolerance to low soil nitrogen; hence the best choice for QTL mapping with most of the lines included in two association mapping panel (AMP) constituted under IMAS (improved maize for Africa soils) and DTMA (Drought Tolerant Maize for Africa) projects (Semagn et al., 2012; Ertiro et al., 2020a). The four populations formed a set of multiple bi-parental populations used in the current study.
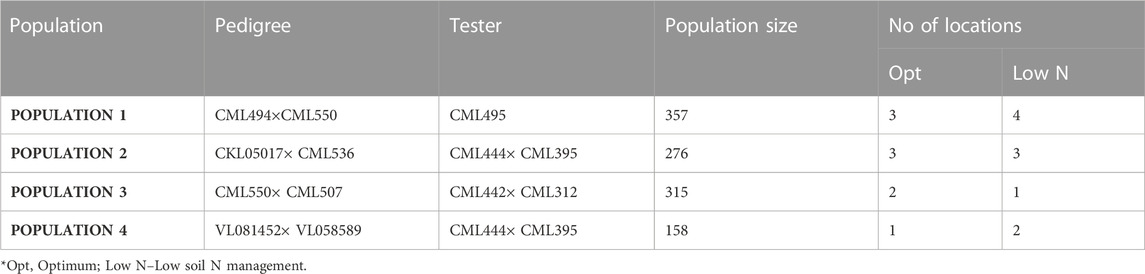
TABLE 1. Details of the populations used in this study and number of locations evaluated under optimum and low N management.
All four populations were evaluated for response to low soil nitrogen conditions at one to four different locations; Kiboko (Longitude 37°E, Latitude 2°S, 975 M A.S.L), Embu (Longitude 37°E, Latitude 3°S, 1560 M A.S.L), and Harare in Zimbabwe (Longitude 310 E, Latitude 17°S, 1490 M A.S.L). The lines were evaluated on an alpha lattice incomplete block design under two nitrogen levels. The two nitrogen treatments were low N (N-depleted field/plot with no application of N fertilizer) and at normal farmer practice conditions (optimum N 200 kg/ha). The low-N sites were prepared by depleting N by growing sorghum at high density with no N fertilizer sources added for four cropping cycles. The depletion crop was uprooted at near maturity and removed from the low-N field to prevent the incorporation of crop residues into the soil. A soil nitrate concentration ranging from 7.5 to 15 parts per million (ppm) is indicative of soil nitrogen deficiency (Zaman-Allah et al., 2018). Low N sites with around 10 ppm of nitrate level provide good experimental conditions for detecting useful genetic variation. The sites used in the present study showed soil nitrate levels ranging from 0.10 to 0.12 ppm in stress experimental sites, while in the optimum sites, the levels were greater than 0.25 ppm. Single row plots measuring 5 m long at 0.75 m row spacing with two seeds per hill were sown. After 3 weeks of planting, plants were thinned to one plant per hill to obtain a final population density of 53,333 plants per hectare. All entries were planted on the same day in conventionally tilled plots and maintained under rain-fed or irrigated conditions.
Ten plants in the middle of the row were selected for each genotype for phenotypic evaluation. Phenotypic components measured and analyzed are plant height (PH in centimeters), anthesis date (AD, days), anthesis silking interval (ASI, days), ear height (EH, in centimeters), ear position (EPO, ratio of EH/PH), number of ears per plant (EPP, total number of ears per plot divided by number of plants per plot) and grain yield (GY in t/ha). Mature ears were harvested, manually bagged, air-dried, and shelled on an electric shelling device. The total GY of each plot was weighed on a balance and converted to GY into t/ha.
Best linear unbiased predictors (BLUPs) were calculated with mixed model where genotypes and other factors were treated as random except replications and best linear unbiased estimators (BLUEs) were calculated where genotype entries and replications are treated as fixed effects and the rest of the terms as random. Estimating broad-sense heritability, all the terms were considered random. Broad sense heritability was estimated by the formula:
Where σ2G is the genotypic variance, σ2GE is the Genotypic by environment interaction (GEI), σ2e is the error variance, E is the number of environments and r is the number of replications in each trial. The phenotypic and genotypic correlations among traits were evaluated as described by Hirel et al. (2007).
Phenotypic data was collected on testcross hybrids whereas F3 population lines were genotyped. Since, the single tester was used for each population, assumption is tester effect is same across lines, therefore, tester effect was not included in the model for analyses. Total DNA was extracted from bulked young leaves of the lines according to the CTAB method (CIMMYT, 2005), and the DNA quality for each sample was checked using gel-electrophoresis and spectrophotometer (NanoDrop ND8000 Thermo Scientific) before genotyping. Genotyping was performed using the Illumina MaizeSNP1500 Bead Chip evenly spaced SNP to cover the whole maize genome (Ganal et al., 2011). The above task was performed at LGC genomic labs in the United Kingdom (https://www.lgcgroup.com/genotyping/).
Markers which are homozygous for both the parents and polymorphic between them were retained for mapping in each population. Linkage maps in all four populations were constructed using QTL IciMapping version 4.1 software (Meng et al., 2015). Finally, we used 202, 452, 384, and 387 high-quality SNPs in F3pop1, F3pop2, F3pop3, and F3pop4, respectively. Linkage map was constructed by using these SNPs, by selecting the most significant markers using stepwise regression. A likelihood ratio test was used to calculate the logarithm of odds (LOD) for each marker at score of >3 with a 30 cM maximum distance between two loci. The recombination frequency between linked loci was transformed into cM (centi Morgan) using Kosambi”s mapping function (Kosambi, 1916). BLUPs across environments were used to detect QTLs based on inclusive composite interval mapping (ICIM) for each population. Phenotypic variation explained by individual QTL and total variation explained by all QTLs together was estimated. QTL naming was done with letter “q” indicating QTL, followed by abbreviation of trait name, the chromosome and marker position, respectively (Ribaut et al., 1997). Additive (a) and dominance (d) effects for each QTL as estimated with QTL IciMapping v.4.1 were used to calculate the ratio of dominance level (|d/a|). This ratio was used to classify the nature of QTL: additive (A; 0 ≤ |d/a| ≤ 0.2); partially dominant (PD; 0.2 < |d/a| ≤ 0.8); dominant (D; 0.8 < |d/a| ≤ 1.2) and overdominant (OD; |d/a| > 1.2).
Genomic prediction (GP) analyses were conducted in R program version 4.2.1 (R Core Team 2023). GP was applied on each F3 population to find out the prediction ability of GY and other agronomic traits evaluated in optimum and low soil N conditions. We used GP model RR-BLUP to predict the untested lines using a five-fold cross validation (Zhao et al., 2012; Crossa et al., 2017). BLUEs across environments for each of the F3 population were used for the analysis. For GS analyses polymorphic SNPs between the parents of each population was used, like 202, 452, 384, and 387 SNPs in F3pop1, F3pop2, F3pop3 and F3pop4, respectively were used. We applied five-fold cross validations with ‘within population’ approach where both training and estimation set are derived from within each of biparental population. For each trait in each population, 100 iterations were done for sampling of the training and estimation sets. The prediction accuracy was calculated as the correlation between the observed and predicted breeding values divided by the square root of heritability (Dekkers, 2007).
GY, ASI, AD, PH, EPO, and EH varied widely across the two nitrogen regimes (i.e., optimum and low nitrogen environments). The extent of variation, however, differed between the four bi-parental maize populations. Low nitrogen conditions increased the trial mean for AD and decreased the trial mean for GY and PH across the four F3 populations tested in this study (Figure 1, Supplementary Table S1). GY showed a negative genotypic correlation with AD and ASI across the two nitrogen regimes (Figure 2). Moreover, consistent positive genetic correlations for GY were recorded with EH, EPO, and PH.
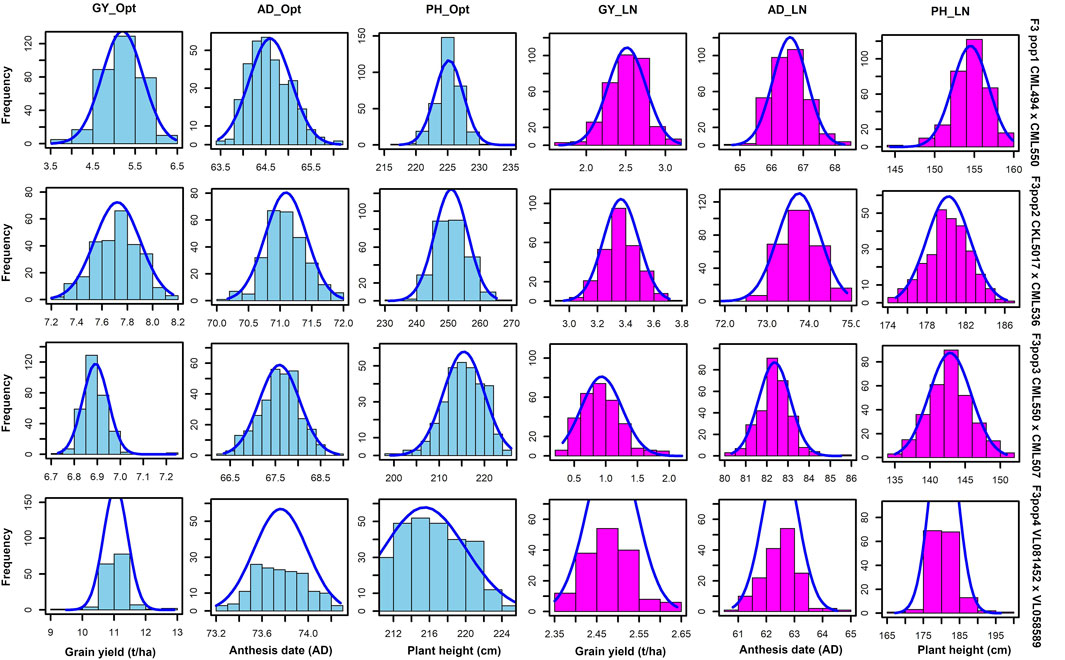
FIGURE 1. Phenotypic distribution for GY, AD and PH under optimum and low soil nitrogen conditions. The sky blue and pink colour denotes trials conducted under optimum and low nitrogen conditions, respectively. GY–Grain yield; AD - anthesis date; PH–plant height.
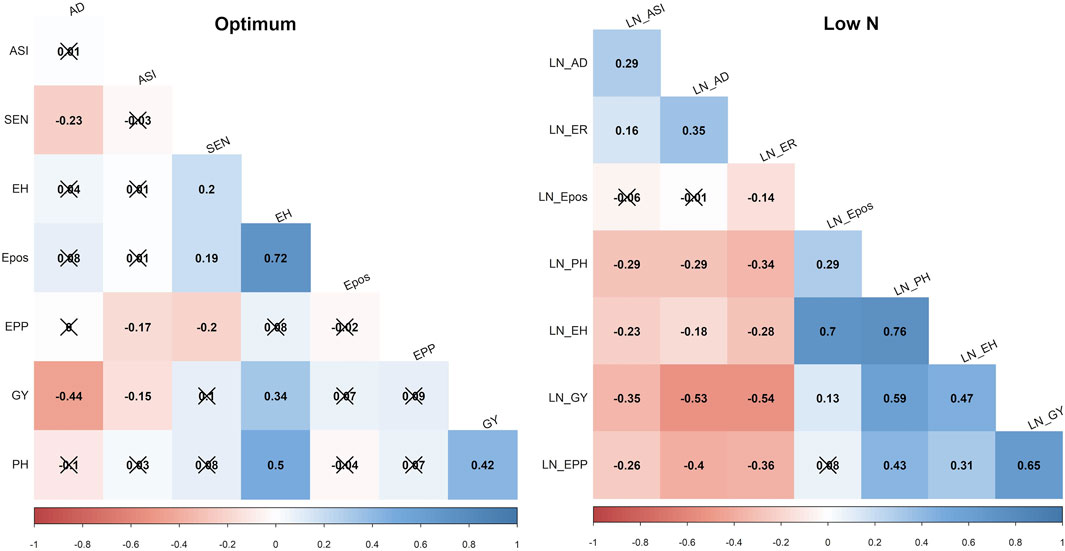
FIGURE 2. Phenotypic correlations of GY and other agronomic traits evaluated under optimum and low soil nitrogen conditions in F3 pop1 CML494 x CML550 population. The x marks indicated values are not significant at p < 0.05. LN–low soil N conditions. Correlations with >0.11, and >0.19 were significant at 0.05, and 0.01 (p) levels, respectively. GY–Grain yield; AD - anthesis date; ASI - anthesis silking interval; PH–plant height; EH, ear height; Epos–ear position; EPP–ears per plant; SEN–senescence.
Population 1 (CML494xCML550): Across the study sites, average GY was 5.22 t/ha and 2.52 t/ha under optimum and low soil nitrogen conditions, respectively (Table 2). A margin of 2-day extension in AD was observed under low soil nitrogen conditions. The genotypic and genotype × environment interaction effects were significant (p ≤ 0.05) for GY. Under optimum conditions, moderate heritabilities across environments were recorded for AD (0.55), GY (0.54), and EH (0.51). Similarly, AD (0.62), GY (0.58), and EH (0.55) exhibited slightly higher heritability under low nitrogen conditions. The lowest heritabilities under optimum nitrogen conditions were exhibited by PH (0.36) and EPO (0.42) traits. ASI (0.18), PH (0.39), and EPO (0.48) recorded the lowest heritability values under low nitrogen conditions.
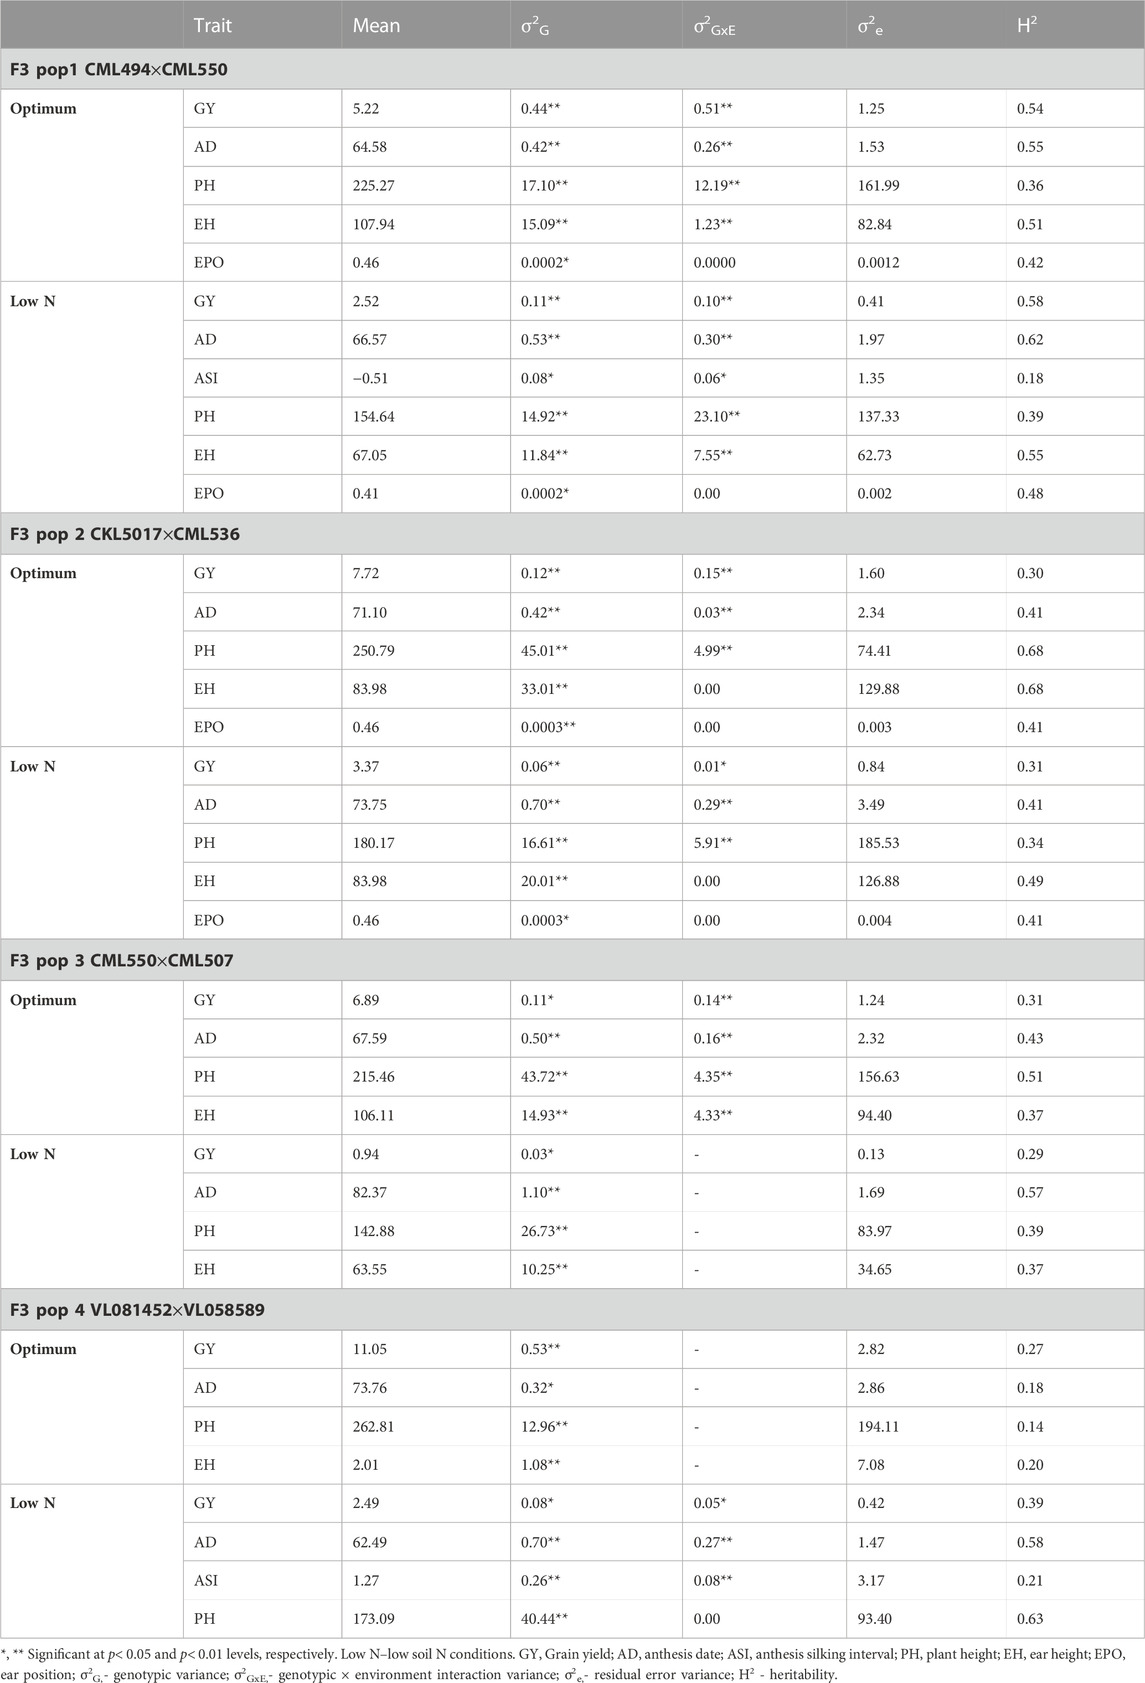
TABLE 2. Trait means, heritability and variance components of GY and other traits evaluated under optimum and low nitrogen conditions in four F3 populations across multiple environments.
Population 2 (CKL5017xCML536): Under optimum conditions (Table 2), moderate heritability was observed for PH (0.68) and EH (0.49) whilst GY (0.28) recorded low heritability across the studied sites. Under low nitrogen conditions, all the studied traits recorded low heritabilities with GY pegged at 0.31. The genotypic and genotype × environment interaction effects were significant (p ≤ 0.05) for GY. Across the studied regions, the mean GY was 7.72 t/ha and 3.37 t/ha under optimum and low nitrogen conditions, respectively.
Population 3 (CML550xCML507): Low heritabilities were recorded across the tested traits under both optimum and low nitrogen conditions (Table 2). GY heritabilities were 0.31 and 0.29 under optimum and low nitrogen conditions, respectively. The genotypic and genotype × environment interaction effects were significant (p ≤ 0.05) for GY. In this population, the mean GY was 6.89 t/ha and 0.94 t/ha under optimum and low nitrogen conditions, respectively.
Population 4 (VL081452xVL058589): All traits tested using population 4 under optimum conditions recorded low heritabilities (Table 2) including GY (0.27). Under low nitrogen conditions, AD (0.58) exhibited moderate heritability whilst GY (0.39) and ASI (0.21) had the lowest heritabilities. The genotypic and genotype × environment interaction effects were significant (p ≤ 0.05) for GY. Across the study sites, average yields were 11.05 t/ha and 2.49 t/ha under optimum and low nitrogen conditions, respectively.
The study obtained a total of 906.83, 1,650.28, 1857.12, and 2169.97 cM from 202, 452, 384, and 387 polymorphic SNPs for F3 population 1, 2, 3, and 4, respectively (Table 3). The mean distance between adjacent markers was lowest in population 2 (3.65 cM) and highest for population 4 (5.61 cM). Across the ten maize chromosomes, a total of 91 significant QTLs were identified for GY (11), AD (26), PH (19), ASI (4), EH (24), and EPO (7) under optimum (52) and low nitrogen (39) conditions (Tables 4–7). The identified QTLs were distributed across 10 chromosomes. Across environments, chromosomes 1 (16) and 8 (14) had the highest number of QTLs, whilst chromosomes 7 (5) and 5 (6) had the lowest number of QTLs. The identified QTLs were distributed as 19, 36, 18, and 36 for populations 1, 2, 3, and 4, respectively. Proportional phenotypic variance for each QTL ranged from 0.7% (AD for population 2 under optimum nitrogen) to 15.22% (AD for population 4 under low nitrogen).
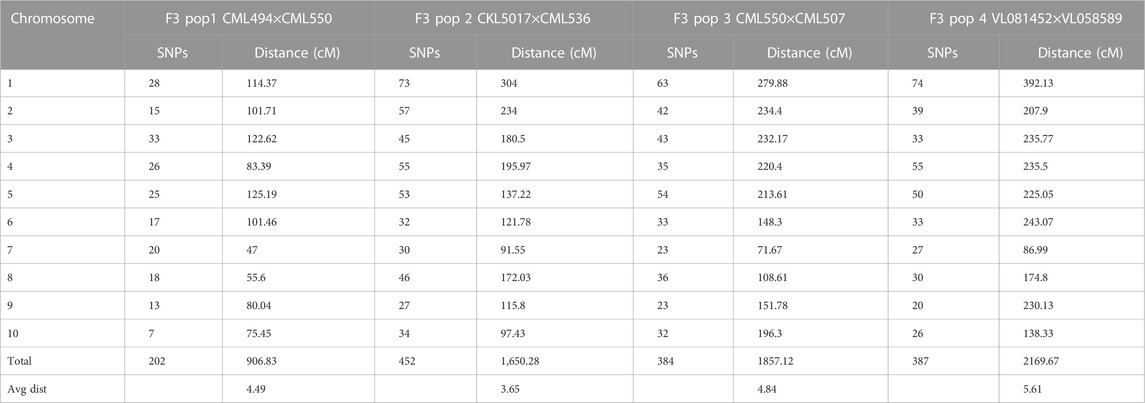
TABLE 3. Linkage map information for the four F3 populations used for QTL analysis.
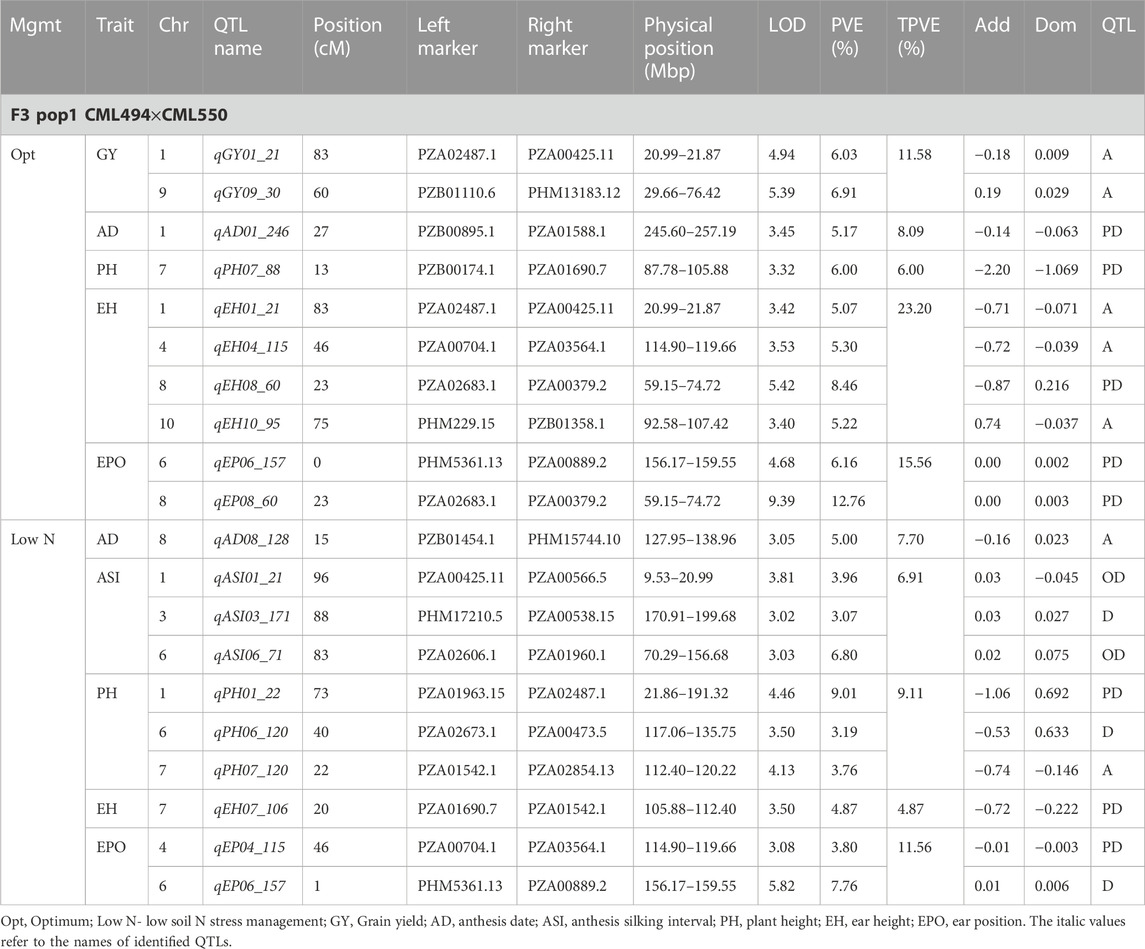
TABLE 4. Genetic characteristics of QTLs detected for GY and associated traits under optimum and low-nitrogen stress in F3 population 1.
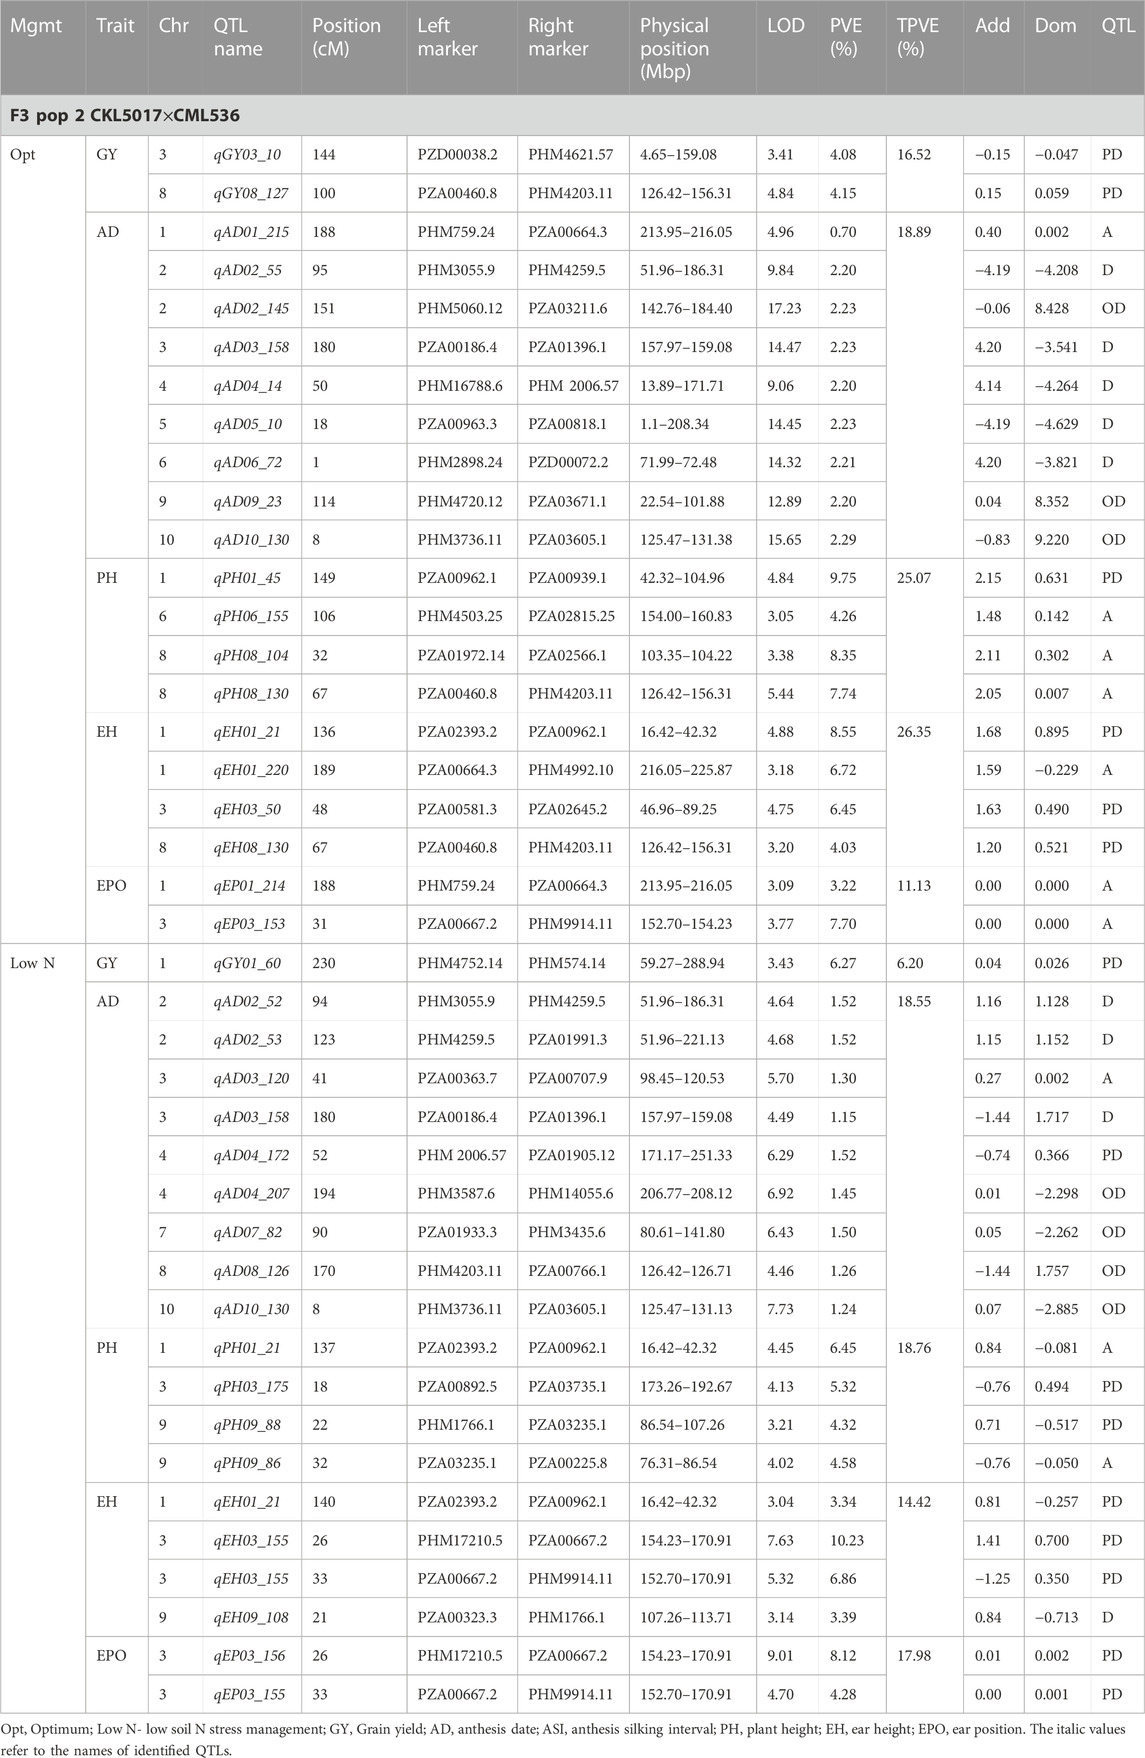
TABLE 5. Genetic characteristics of detected QTLs for GY and associated traits under optimum and low-nitrogen stress in F3 population 2.
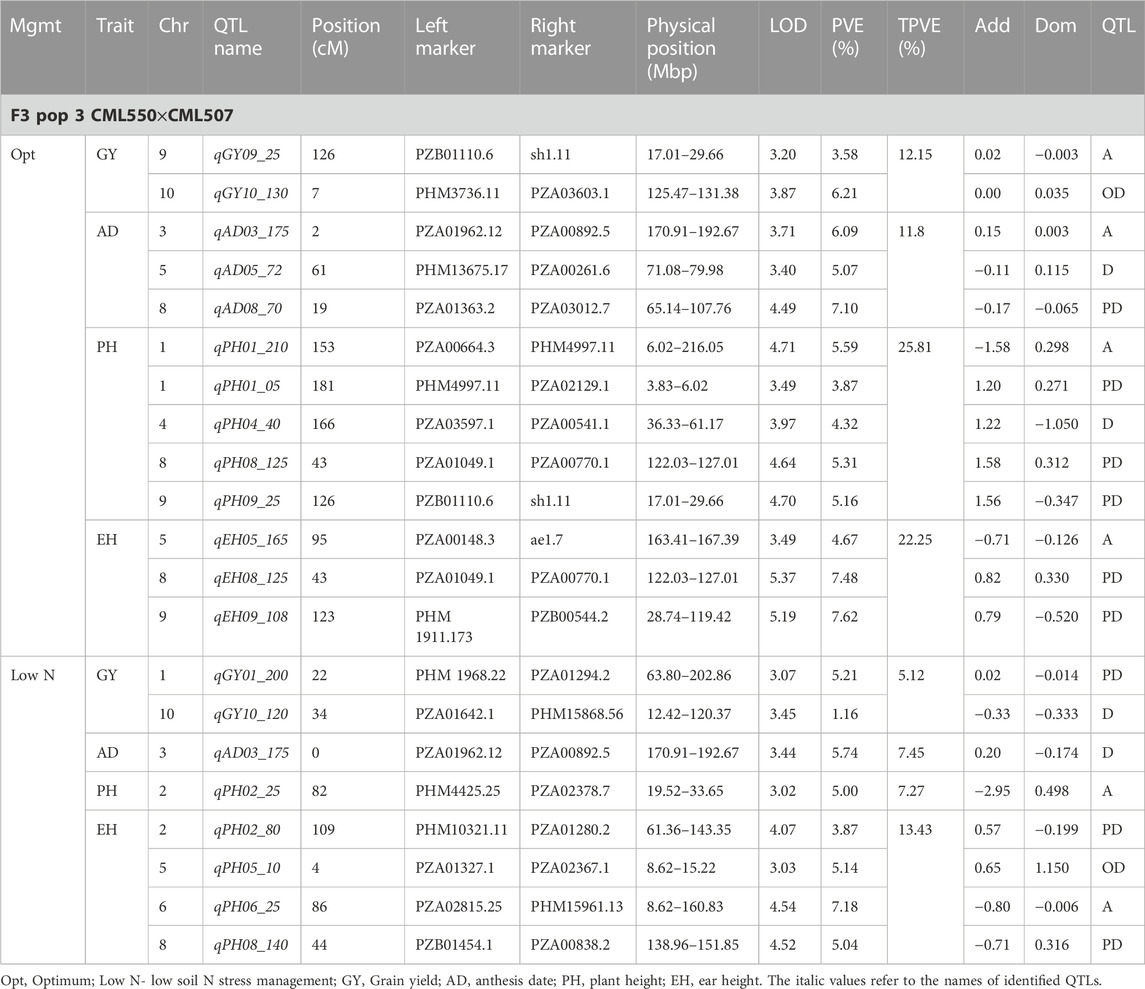
TABLE 6. Genetic characteristics of detected QTLs for GY and associated traits under optimum and low-nitrogen stress in F3 population 3.
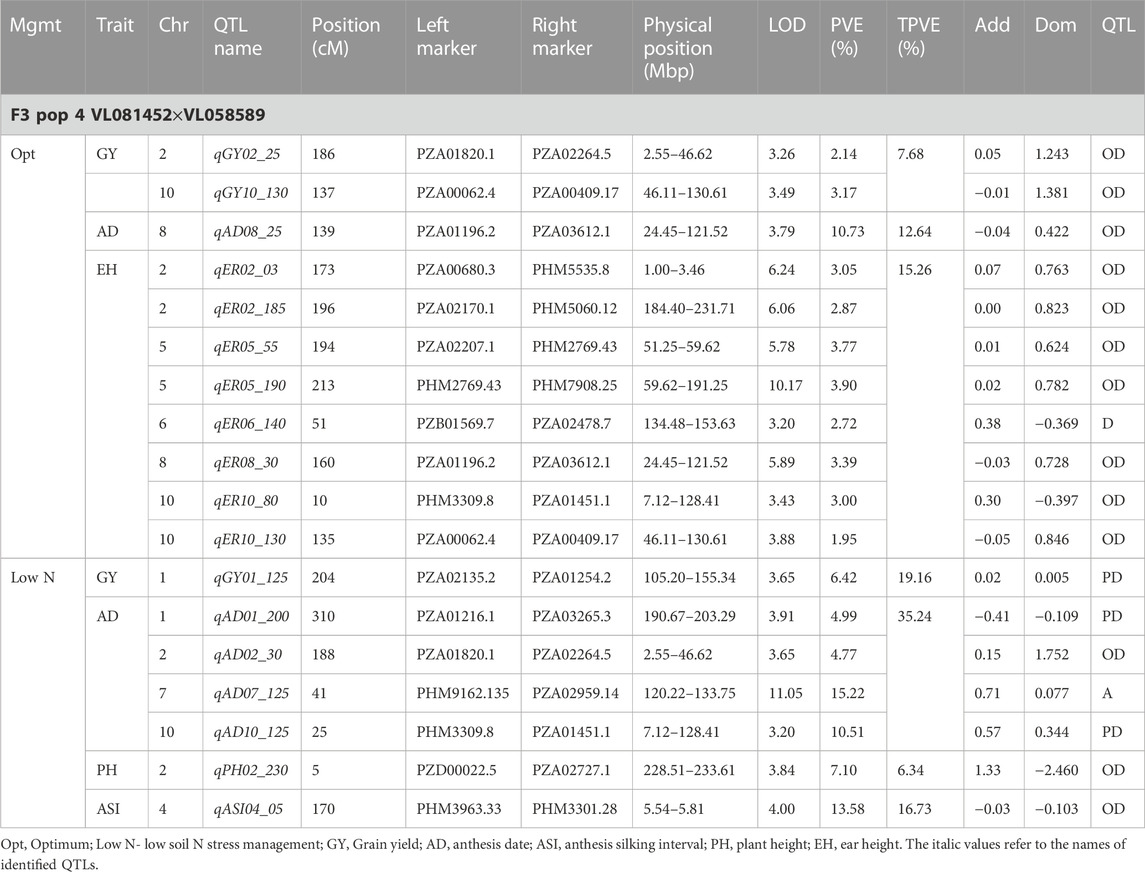
TABLE 7. Genetic characteristics of detected QTLs for GY and associated traits under optimum and low-nitrogen stress in F3 population 4.
Eleven QTLs were identified for GY under optimum (7) and low soil nitrogen (4) conditions distributed across all chromosomes except chromosome 4, 5, 6, and 8 (Tables 4–8). Across all genotypes and nitrogen regimes, no common QTL was identified. QTLs associated with GY under low nitrogen were detected in chromosomes 1 (population 2, 3, and 4) and 10 (population 3). On the other hand, QTL underlying GY under optimum nitrogen conditions were observed on chromosomes 1 (population 1), 2 (population 4), 8 (population 2), 9 (populations 1 and 3), and 10 (population 4). Under optimum conditions, the total phenotypic variance explained (TPVE) by all QTL was 11.58%, 16.52%, 12.15%, and 7.68% for populations 1, 2, 3, and 4, respectively. TPVE by all QTL under low nitrogen conditions was 6.20% (population 2), 5.12% (population 3) and 19.16% (population 4). Among the QTL detected for GY, we observed additive, dominance, partial dominance and over dominance effect QTL across 4 populations.
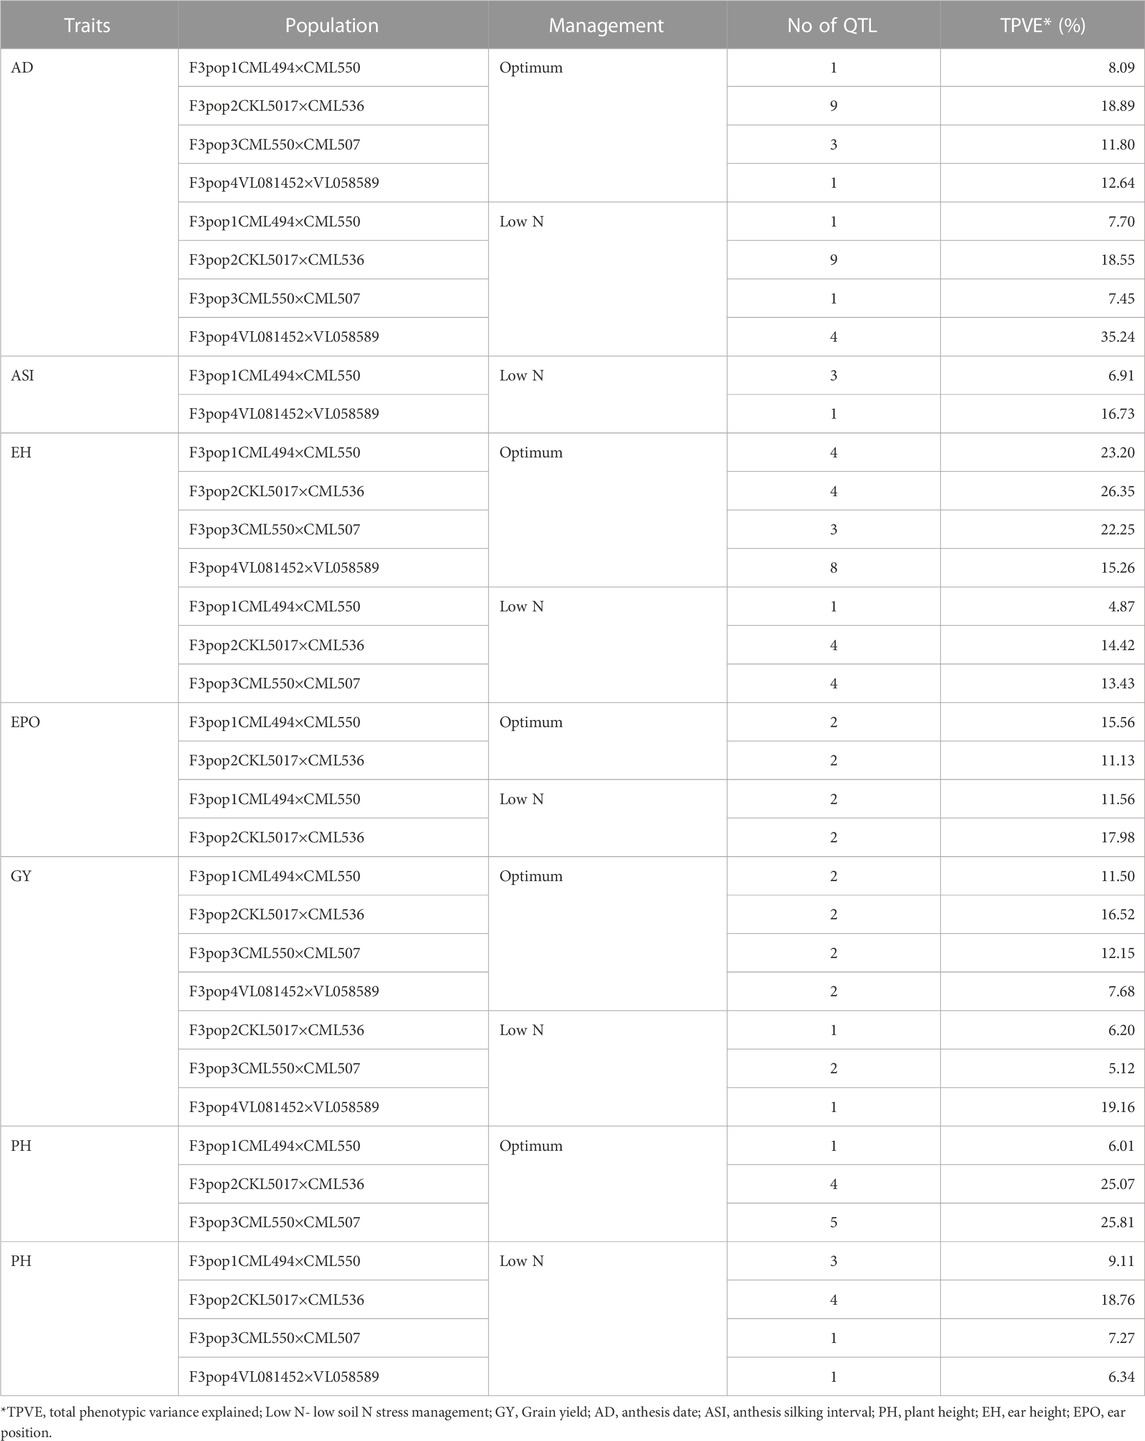
TABLE 8. Summary of detected QTL for measured traits under optimum and low-nitrogen stress in F3 populations derived from seven elite lines.
For AD, 26 significant QTLs were identified across the two nitrogen regimes. The QTLs were detected on chromosomes 1, 2, 3, 4, 7, and 10 under low nitrogen and on chromosomes 1, 2, 3, 4, 5, 6, 8, and 9 under optimum nitrogen conditions. No common QTL for the two nitrogen regimes was identified across the studied F3 populations. TPVE by all QTL under optimum conditions was 8.09%, 18.89%, 11.80% and 12.64% for populations 1, 2, 3 and 4, respectively. Under low nitrogen conditions, TPVE by all QTL was 7.70% (population 1), 18.55% (population 2), 7.45% (population 3) and 35.24% (population 4). The nature of the QTLs classified a few as additive, dominant, partial dominant and overdominance groups.
Four QTLs were identified for ASI under low nitrogen conditions. These were detected on chromosomes 1, 3, 4, and 6. As in the case of GY and AD, no common QTL was identified. TPVE by all QTLs under low nitrogen conditions was 6.91% (population 1) and 16.73% (population 4).
For EH, 24 significant QTLs were detected with 9 of those under low soil nitrogen conditions. The QTLs underlying EH under low soil nitrogen conditions were detected in chromosomes 1, 2, 3, 5, 6, 7, 8, and 9. Under optimum conditions, the QTLs were found in all 10 maize chromosomes except for chromosome 7. Common QTL for the two nitrogen regimes was not identified. TPVE by all QTLs under optimum conditions was 23.20%, 23.35%, 22.25% and 15.26% for populations 1, 2, 3, and 4, respectively. Under low soil nitrogen conditions, TPVE by all QTL was 4.87% (population 1), 14.42% (population 2), and 13.43% (population 3).
Significant QTLs underlying EPO were recorded as 7 under both nitrogen regimes. One QTL (Chromosome 6: qEPO6_157) was found in both low and optimum nitrogen conditions. Under low soil nitrogen management, QTLs were detected in chromosomes 3, 4, and 6. On the other hand, chromosomes 1, 3, 6, and 8 housed QTL underlying EPO under optimum conditions. Under optimum conditions, the TPVE by all QTL was 15.56%, and 11.13% for populations 1 and 2, respectively. TPVE by all QTLs under low nitrogen conditions was 11.56% (population 1) and 17.98% (population 2).
For PH, 19 significant QTLs were identified across the studied genotypes and nitrogen regimes. Nine of those were identified under low nitrogen conditions in chromosomes 1, 2, 3, 6, 7, and 9. Under optimum conditions, significant QTLs were detected in chromosomes 1, 4, 6, 8, and 9. No common QTL for the two nitrogen regimes was identified across the studied F3 populations. TPVE by all QTLs under optimum conditions was 6.00%, 25.07%, and 25.81% for populations 1, 2, and 3, respectively. Under low nitrogen conditions, TPVE by all QTL was 9.11% (population 1), 18.76% (population 2), 7.27% (population 3) and 6.34% (population 4).
The identification of common QTLs is crucial in targeting markers that can be used in breeding for improved nitrogen stress tolerance and NUE. This study identified several common QTLs across the studied F3 populations and nitrogen regimes (Tables 4–8). Under optimum conditions, one QTL (qAD03_158) for AD was overlapping with one QTL under low soil nitrogen conditions on chromosome 3 (157.97–159.08 Mbp). For ASI and PH, no common QTL was identified across the two nitrogen regimes. Under low soil nitrogen conditions, one QTL for EH, qEH01_21 (16.42–42.32 Mbp), was overlapping with two QTLs under optimum conditions (from 20.99 to 21.87 Mbp and 16.42 to 42.32 Mbp) on chromosome 1. Similarly, under low nitrogen, the second QTL for EH (qEH09_108: 107.26 to 113.71 Mbp) overlapped with one QTL under optimum conditions (28.74–119.42 Mbp) on chromosome 9. One common QTL for EPO, qEP06_157, was found under both low and optimum nitrogen conditions (156.17–159.55 Mbp and 156.17 to 159.55 Mbp) on chromosome 6. Under optimum conditions, one QTL for GY (qGY10_130) was found on chromosome 10 in both population 3 (125.47–131.38 Mbp) and population 4 (46.11–130.61 Mbp). A similar observation was made for one QTL underlying EH (qEH09_108) which was seen on chromosome 9 under optimum nitrogen conditions in population 3 (28.74–119.42 Mbp) and low nitrogen conditions in population 2 (107.26–113.71 Mbp). This study found no QTL correspondence among the studied traits across the nitrogen regimes.
To assess the potential breeding value of GY and other agronomic traits under optimum and low soil N management, GS analysis was performed on all four populations using NUE-associated traits and genotypic markers with RR-BLUP. The RR-BLUP prediction correlations were 0.35, 0.41, 0.06, and 0.35 in populations 1, 2, 3, and 4, respectively (Figure 3; Table 9) under optimum, whereas under low soil N management, the correlations were reduced to 0.21, 0.41, 0.04, and −0.02 in population 1, 2, 3, and 4, respectively. For AD, prediction correlations were 0.31, 0.63, 0.12, and 0.37 under optimum and 0.26, 0.43, 0.29, and 0.36 under low soil N management, respectively (Figure 3; Table 9). For PH, prediction correlations were 0.35, 0.52, 0.34, and 0.18 under optimum, and 0.44, 0.40, 0.15, and 0.10 under low soil N management in populations 1, 2, 3, and 4, respectively. Overall, the prediction correlations were higher in population 2 and lower in population 4 for all the traits under both optimum and low soil N management.
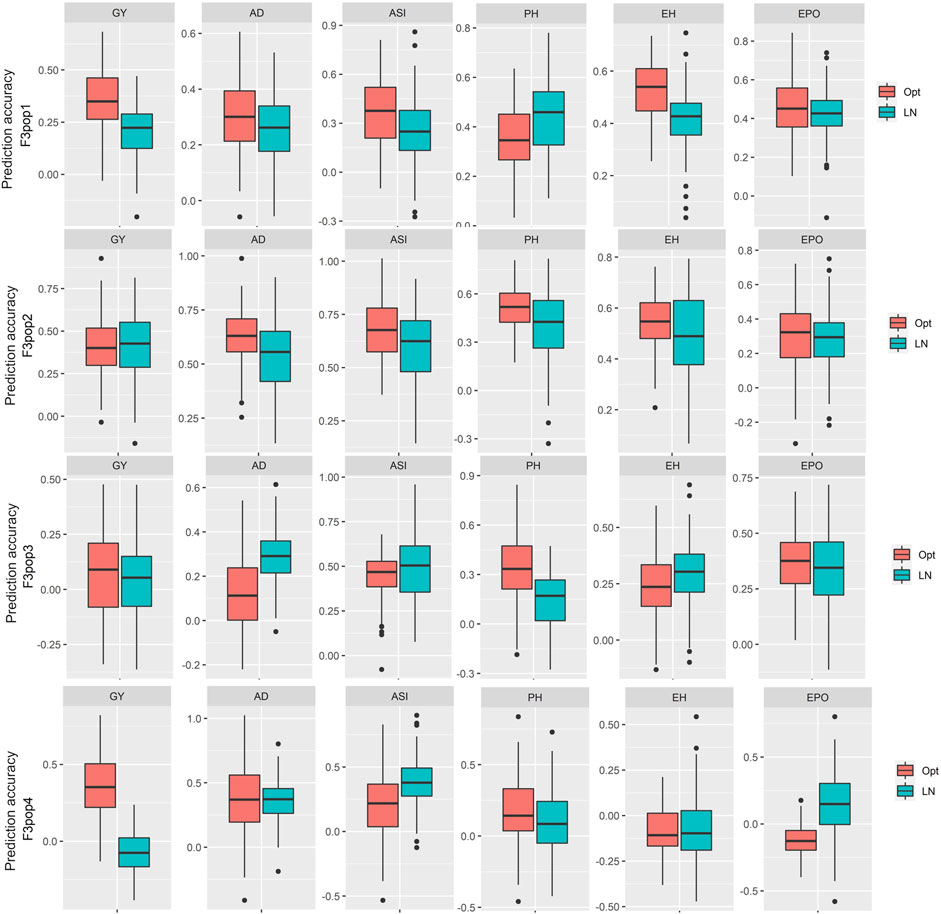
FIGURE 3. Distribution of the five-fold cross-validated genomic prediction correlations for grain yield (GY), anthesis date (AD), anthesis-silking interval (ASI), plant height (PH), ear height (EH), and ear position (EPO) evaluated in multiple environments under optimum and low soil N management conditions in four F3 populations.
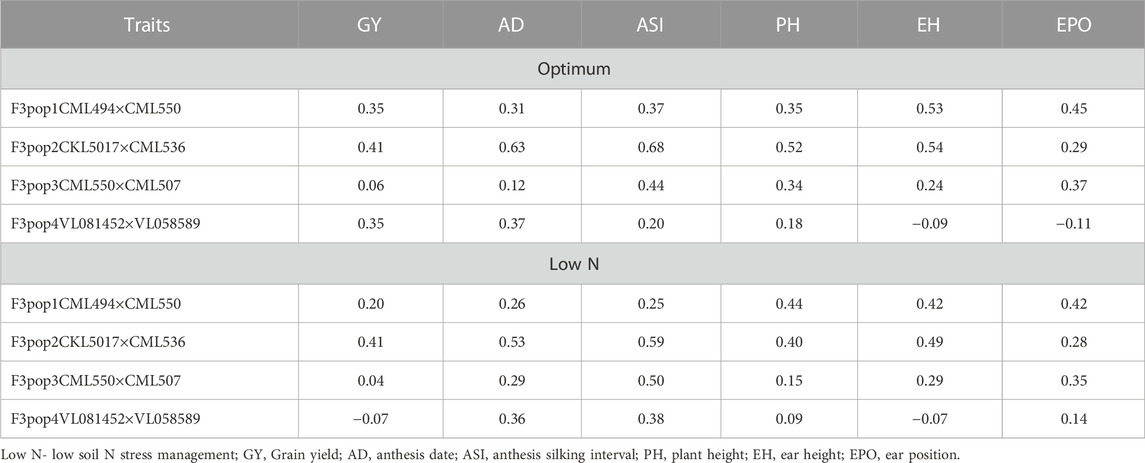
TABLE 9. The prediction accuracy for grain yield and other traits evaluated under optimum and low-nitrogen stress conditions for four F3 populations derived from seven elite lines.
The role of nitrogen stress in yield reduction and overall crop development cannot be overstated. An in-depth understanding of GY and other related agronomic traits is critical for the evidence-based development of varieties that are tolerant to low soil nitrogen stress (Derera et al., 2008). However, phenotypic characterization of such complex traits is very challenging due to unpredictable environmental and edaphic conditions (Liu et al., 2010). Importantly, selection through morphological characterization under nitrogen stress conditions is very inconsistent and will not give correct phenotypic data thereby derailing progress in maize breeding schemes. In contrast, the integration of precise genomic tools coupled with conventional breeding can accelerate the development of nitrogen-stress adaptive cultivars with high yields. In this research, two nitrogen regimes (i.e., low, and optimum nitrogen) served as the basis for the identification of QTLs related to GY and other agronomic traits (i.e., AD, ASI, PH, EH, and EPO) and their cross-cutting heritabilities in four F3 maize populations.
The target traits measured followed a normal distribution indicating that the studied traits are quantitative in nature and the tested F3 populations are stable and suitable for QTL mapping. The mean GY reduction in this study was 69.82% under low nitrogen stress. This is very close to the 71% yield reduction recorded in the study by Ertiro T. B. et al. (2020). Yield reduction under low soil nitrogen stress demonstrates the importance of nitrogen in the growth and development of maize (Ertiro T. B. et al., 2020). Numerous studies have linked a reduction in yield under low-N conditions to decreased kernel number due to abortion (Bänziger et al., 1997; Agrama et al., 1999; Ribaut et al., 2007). Low soil nitrogen environments decrease the number of kernels and ears per plant, decrease the chlorophyll concentration in the ear leaf, and lowers PH by roughly half (Ribaut et al., 2007).
Genotypic and genotype × environment interaction effects were significant for GY across the tested nitrogen regimes. Generally, across the studied environments, the most responsive trait was AD. Our results showed that low nitrogen stress extends the AD in maize. Furthermore, low nitrogen stress increased genetic variance for AD across the studied genotypes. This can be viewed as an indication of the adaptive nature of this secondary trait.
Across the four F3 populations, there was a consistent moderate to low heritability on all the studied traits across the two nitrogen regimes. For all traits, heritability was shown to decline under low nitrogen stress. The heritabilities of almost all the studied traits were moderate to low. Similar trends were also reported in earlier studies with DH populations (Ertiro et al., 2020b; Ertiro et al., 2022) and association panel (Ertiro et al., 2020a) which were evaluated under optimum and low soil N conditions. Despite this, the heritabilities were significant enough to facilitate indirect selection for increased GY under low nitrogen stress. By comparison, PH had low heritabilities under both low and optimum nitrogen conditions.
The pairwise correlation showed a strong negative correlation for GY with AD and ASI across the studied nitrogen regimes. However, other agronomic traits showed positive correlations with GY. These include PH, EH and EPO under both low and optimum soil nitrogen conditions. Similar correlation trends were also reported by earlier studies with maize hybrid and inbred line trials under low soil nitrogen conditions (Ertiro T. B. et al., 2020; Ertiro et al., 2022). PH, EH and EPO had a positive correlation with GY suggesting that improvement of these traits lead to improved maize varieties with high-yielding potentials. Furthermore, these correlations suggest the high odds of tightly linked loci controlling low-N tolerance through the coordinated expression of loci controlling these traits.
NUE traits are highly complex, the advent of high-density marker data has made it feasible to dissect their underlying genetics. The detection of QTLs underlying GY and other associated traits under different nitrogen regimes is integral for scaling breeding initiatives targeting the development of low nitrogen tolerant maize varieties. A total of 91 significant QTLs were identified in this study for six traits under low and optimum nitrogen management (Tables 5, 6, 7, and 8). The disparity in the number of QTLs under optimum (52) and low (39) indicates the effect of genetic variance across the environments. Some of these were found across management conditions and populations. Across the two nitrogen regimes, chromosomes 1 (16) and 8 (14) had the highest number of QTLs whilst chromosomes 7 (5) and 5 (6) had the lowest. Chromosomes with a high number of QTLs can be targeted for future research studies focusing on improving GY under low nitrogen stress. Proportional phenotypic variance for the QTLs ranged from 0.7% to 15.22%, with an average of 5.05%.
Population 4 had the highest number of QTLs (36). This is a testament to the diversity within the studied F3 populations across nitrogen management options. AD (26) and EH (24) had the highest number of QTLs whilst ASI (11) had the lowest. This is consistent with another study (Ertiro et al., 2020c) which found the highest QTL number as those underlying AD. In our study, this was consistent with the observed high genetic variance for AD and EH across the two nitrogen regimes.
Marker-assisted selection for GY improvement relies on the successful identification of QTLs with moderate to high effects. For GY, 11 QTLs were detected under both optimum (7) and low (4) nitrogen conditions. This is inconsistent with Ertiro et al., 2020c findings which recorded more QTLs under low nitrogen management than under optimum conditions. One QTL for GY (qGY10_130) was found under optimum conditions on chromosome 10 in both population 3 (125.47–131.38 Mbp) and population 4 (46.11–130.61 Mbp). A study by Ertiro et al., 2020c also found QTLs underlying GY under different nitrogen regimes on chromosome 10. No common QTL for GY was identified across the studied F3 populations. Ertiro et al. (2020a) also observed similar results, i.e., no common QTLs observed for GY. Noteworthy, the use of a different number of populations, locations and markers in future studies can give rise to a different outcome. In this study, some common QTLs were identified for AD, EH and EPO. The identification of common QTLs justifies the magnitude of correlation across the two nitrogen regimes. Common QTLs can also be used for indirect selection. Similar to the results of Ertiro et al., 2020c, QTL correspondences detected between the nitrogen regimes for the studied traits were not similar across F3 populations and this points to the genetic-background-specific nature of these QTLs.
The distinct genetic controls of the expression of the phenotypes reported in this study and related studies (Bänziger et al., 1999; Ribaut et al., 2007) suggest that selection for low nitrogen stress tolerance will be more effective under low nitrogen management. These findings unravel the most promising genomic regions for MAS to increase maize tolerance to low nitrogen stress. Further multi-environment trials with larger population sizes are necessary to validate the stability of the recorded QTLs and utilize them to identify underlying causal genes.
To achieve higher genetic gain, complex traits in maize breeding can be improved by integrating genomic, bioinformatic, and statistical tools into breeding programs (Beyene et al., 2019; Beyene et al., 2021). Rapid technological advancements have made available cheaper genotyping tools, while rapid progress in the field of big data and bioinformatics has led to the development of user-friendly software tools which can handle complex statistical models and facilitates breeders to apply them to improve complex traits on a more routine basis. GS, which predicts the breeding values by employing genome-wide markers is proving to be effective in improving complex traits that are controlled by multiple minor effect genes. For instance, RR-BLUP or G-BLUP is now very commonly used to predict several complex traits in maize (Guo et al., 2012; Hao et al., 2019; Beyene et al., 2021). Several NUE traits like chlorophyll index, chlorophyll fluorescence and leaf N content were also selected by genomic prediction before integrating into NUE breeding programs in ryegrass (Zhao et al., 2020). In the present study, GS was performed on GY and other agronomic traits evaluated under optimum and low soil N stress conditions. The average genomic prediction correlations ranged from 0.07 to 0.41 under optimum and −0.07 to 0.41 under low soil N stress conditions. The higher values of prediction correlations are comparable to earlier studies with a diversity panel evaluated under optimum and low soil N stress conditions (Ertiro et al., 2020c). The observed prediction accuracies for other agronomic traits are comparable to earlier studies reported under different stresses in maize (Zhang et al., 2015; Yuan et al., 2019).
In population 3, we found low accuracy for GY under optimum condition, which could be due to its small range of variability within the population as well as low heritability (Table 2, Figure 1). We observed a wide range of prediction correlations for same trait among different populations and management. This could be due to their differences in sample size, genetic variance, trait heritability, changes in population structure and linkage disequilibrium estimates. In some populations, we observed negative prediction correlations like GY for pop 4 under low soil N stress conditions (Figure 3; Table 9). Opposite linkage phases between markers and major-effect QTLs in the population may be the reason for negative correlations. In addition, the four F3 populations used in this study were developed by using tolerant x tolerant crosses for low soil N stress, which may be another reason why we observed low prediction correlations (as most of the causal factors for these traits might have been fixed on both the parental lines). As a result, variation is low for the traits which is evident with low to moderate heritability estimates (Table 2). Nevertheless, the prediction correlation followed a consistent pattern for all traits under both optimum and low N conditions. Traits with high prediction correlations also tend to have relatively high heritability estimates. In GS, the less complex trait AD and PH had higher accuracy compared to GY, which is consistent with the nature of trait complexity (Zhang et al., 2017a; Yuan et al., 2019). For simple inherited traits that are positively correlated with GY, prediction correlations are moderate to high, which clearly supports the usefulness of GS for their improvement under either optimum or low soil N stress conditions.
Overall, the linkage mapping studies with our F3 populations revealed several QTL with minor to moderate effects for GY and other agronomic traits under optimum and low N management. It is difficult to capture multiple QTL with small to moderate effects for selection and their environmental and genotypic specific expressions make it even more difficult to improve these traits only through traditional breeding or a few QTL based MAS. However, discovery of genomic regions through linkage mapping will continue to be vital to understanding the genetic basis of these traits. On the other hand, genome-wide selection is critical in improving quantitative traits. The phenotypic selection efficiency per cycle is measured as h (square root of heritability) and the value of marker-based prediction accuracy close to h indicates the selection response based on markers and based on phenotypes are near equal (Dekkers, 2007; Lorenzana and Bernardo, 2009). The prediction accuracies observed for GY and other traits was ≥1/2h indicating that the response to marker-based selection would be at least 50% of the response to phenotypic selection for agronomic traits. With the possibility of making three cycles per year by using marker-based selection, the selection response will be −1.5 times the gain from one cycle of phenotypic selection. These results indicate that genome-wide selection would be more efficient in terms of genetic gain per year. However, one must be cautious as we observed prediction accuracy of <0.10 for some traits in some populations, where GS has no additional advantage over phenotypic selection.
Nitrogen-depleted soils are a major factor behind low maize productivity in smallholder farming systems in SSA. Genomics-based plant breeding techniques such as QTL mapping and GS can provide useful information for scaling the development of low nitrogen tolerant maize varieties. Here, we sought to identify the genomic regions associated with GY and related traits under optimum and low soil nitrogen conditions in F3 maize populations grown in Kenya and Zimbabwe. Our analysis found a total of 91 QTLs underlying GY, ASI, AD, EH, EPO, and PH. However, no common QTL for GY was identified across the studied nitrogen regimes. The validation of these QTLs in the same F3 populations is needed to guarantee the success of future marker-assisted selections. Identification of many QTL with minor effects indicates rather QTL mapping on these traits, GS is more appropriate for their improvement. Genomic prediction correlations were low to moderate. However, by considering the possibility to have three cycles per year with marker-based selection, integration of GS in a low N tolerant breeding program will be more efficient to improve GY under low soil N conditions.
The original contributions presented in the study are included in the article/Supplementary Material. This data can also be accessed here: https://zenodo.org/records/10021760.
CK: Data curation, Formal Analysis, Investigation, Visualization, Writing–original draft. NN: Software, Validation, Visualization, Writing–original draft, Writing–review and editing. VC: Data curation, Investigation, Project administration, Writing–review and editing. BT: Investigation, Methodology, Visualization, Writing–review and editing. BD: Conceptualization, Funding acquisition, Methodology, Project administration, Resources, Visualization, Writing–review and editing. YB: Validation, Visualization, Writing–review and editing. OK: Project administration, Resources, Supervision, Writing–review and editing. CS: Supervision, Validation, Writing–review and editing. BP: Conceptualization, Funding acquisition, Project administration, Resources, Supervision, Writing–review and editing. MG: Conceptualization, Formal Analysis, Investigation, Methodology, Project administration, Software, Supervision, Validation, Visualization, Writing–original draft, Writing–review and editing.
The author(s) declare financial support was received for the research, authorship, and/or publication of this article. The research was supported by the Bill and Melinda Gates Foundation (B&MGF), Foundation for Food and Agriculture Research (FFAR) and the United States Agency for International Development (USAID) through the Stress Tolerant Maize for Africa (STMA, B&MGF Grant # OPP1134248) Project, IMAS Project, AGG (Accelerating Genetic Gains in Maize and Wheat for Improved Livelihoods; B&MGF Investment ID INV-003439) Project and the CGIAR Research Program on Maize (MAIZE). NN and CS acknowledge funding from the European Commission DESIRA funded LEG4DEV Project [FOOD/2020/418-901] and the Science Foundation Ireland Principal Investigator Grant [13/IA/1820].
The authors thank the CIMMYT field technicians for phenotypic evaluations and Laboratory technicians for sample preparation for genotyping. We are also grateful to LGC genomic labs in the UK for genotyping the populations and providing the marker information. More gratitude to CIMMYT scientists for their excellent and noble guide throughout the processes of this research.
The authors declare that the research was conducted in the absence of any commercial or financial relationships that could be construed as a potential conflict of interest.
All claims expressed in this article are solely those of the authors and do not necessarily represent those of their affiliated organizations, or those of the publisher, the editors and the reviewers. Any product that may be evaluated in this article, or claim that may be made by its manufacturer, is not guaranteed or endorsed by the publisher.
The Supplementary Material for this article can be found online at: https://www.frontiersin.org/articles/10.3389/fgene.2023.1266402/full#supplementary-material
Agrama, H., Zakaria, A., Said, F., and Tuinstra, M. (1999). Identification of quantitative trait loci for nitrogen use efficiency in maize. Mol. Breed. 5, 187–195. doi:10.1023/a:1009669507144
Bänziger, M., Betrán, F., and Lafitte, H. (1997). Efficiency of high-nitrogen selection environments for improving maize for low-nitrogen target environments. Crop Sci. 37, 1103–1109. doi:10.2135/cropsci1997.0011183x003700040012x
Bänziger, M., Edmeades, G., and Lafitte, H. (1999). Selection for drought tolerance increases maize yields across a range of nitrogen levels. Crop Sci. 39, 1035–1040. doi:10.2135/cropsci1999.0011183x003900040012x
Baudron, F., Zaman-Allah, M. A., Chaipa, I., Chari, N., and Chinwada, P. (2019). Understanding the factors influencing fall armyworm (Spodoptera frugiperda J.E. Smith) damage in African smallholder maize fields and quantifying its impact on yield. A case study in Eastern Zimbabwe. A case study East. Zimbabwe Crop Prot. 120, 141–150. doi:10.1016/j.cropro.2019.01.028
Beyene, Y., Gowda, M., Olsen, M., Robbins, K. R., Pérez-Rodríguez, P., Alvarado, G., et al. (2019). Empirical comparison of tropical maize hybrids selected through genomic and phenotypic selections. Front. plant Sci. 10, 1502. doi:10.3389/fpls.2019.01502
Beyene, Y., Gowda, M., Pérez-Rodríguez, P., Olsen, M., Robbins, K. R., Burgueño, J., et al. (2021). Application of genomic selection at the early stage of breeding pipeline in tropical maize. Front. Plant Sci. 12, 685488. doi:10.3389/fpls.2021.685488
Beyene, Y., Semagn, K., Mugo, S., Tarekegne, A., Babu, R., Meisel, B., et al. (2015). Genetic gains in grain yield through genomic selection in eight bi-parental maize populations under drought stress. Crop Sci. 55, 154–163. doi:10.2135/cropsci2014.07.0460
Boddupalli, P., Suresh, L., Mwatuni, F., Beyene, Y., Makumbi, D., Gowda, M., et al. (2020). Maize lethal necrosis (MLN): efforts toward containing the spread and impact of a devastating transboundary disease in sub-Saharan Africa. Virus Res. 282, 197943. doi:10.1016/j.virusres.2020.197943
Bonnett, D., Li, Y., Crossa, J., Dreisigacker, S., Basnet, B., Pérez-Rodríguez, P., et al. (2022). Response to early generation genomic selection for yield in wheat. Front. Plant Sci. 12, 718611. doi:10.3389/fpls.2021.718611
Chen, T., Liu, L., Zhou, Y., Zheng, Q., Luo, S., Xiang, T., et al. (2023a). Characterization and comprehensive evaluation of phenotypic characters in wild Camellia oleifera germplasm for conservation and breeding. Front. Plant Sci. 14, 1052890. doi:10.3389/fpls.2023.1052890
Chen, Y., Xiong, Y., Hong, H., Li, G., Gao, J., Guo, Q., et al. (2023b). Genetic dissection of and genomic selection for seed weight, pod length, and pod width in soybean. Crop J. 11, 832–841. doi:10.1016/j.cj.2022.11.006
Coque, M., and Gallais, A. (2006). Genomic regions involved in response to grain yield selection at high and low nitrogen fertilization in maize. Theor. Appl. Genet. 112, 1205–1220. doi:10.1007/s00122-006-0222-5
Crossa, J., Pérez-Rodríguez, P., Cuevas, J., Montesinos-López, O., Jarquín, D., De Los Campos, G., et al. (2017). Genomic selection in plant breeding: methods, models, and perspectives. Trends plant Sci. 22, 961–975. doi:10.1016/j.tplants.2017.08.011
Das, B., Atlin, G. N., Olsen, M., Burgueño, J., Tarekegne, A., Babu, R., et al. (2019). Identification of donors for low-nitrogen stress with maize lethal necrosis (MLN) tolerance for maize breeding in sub-Saharan Africa. Euphytica 215, 1–15. doi:10.1007/s10681-019-2406-5
de Carvalho, E. V., Afférri, F. S., Peluzio, J. M., Dotto, M. A., and Cancellier, L. L. (2012). Nitrogen use efficiency in corn (Zea mays L) genotypes under different conditions of nitrogen and seeding date. Maydica 57, 43–48.
De Groote, H., Kimenju, S. C., Munyua, B., Palmas, S., Kassie, M., and Bruce, A. (2020). Spread and impact of fall armyworm (Spodoptera frugiperda JE Smith) in maize production areas of Kenya. Agric. Ecosyst. Environ. 292, 106804. doi:10.1016/j.agee.2019.106804
Dekkers, J. C. M. (2007). Prediction of response to marker-assisted and genomic selection using selection index theory. J. Animal Breed. Genet. 124, 331–341. doi:10.1111/j.1439-0388.2007.00701.x
Derera, J., Tongoona, P., Vivek, B. S., and Laing, M. D. (2008). Gene action controlling grain yield and secondary traits in southern African maize hybrids under drought and non-drought environments. Euphytica 162, 411–422. doi:10.1007/s10681-007-9582-4
Dreisigacker, S., Crossa, J., Pérez-Rodríguez, P., Montesinos-López, O., Rosyara, U., Juliana, P., et al. (2021). Implementation of genomic selection in the CIMMYT global wheat program, findings from the past 10 years. United Kingdom: Hapres.
Ekpa, O., Palacios-Rojas, N., Kruseman, G., Fogliano, V., and Linnemann, A. R. (2018). Sub-Saharan African maize-based foods: technological perspectives to increase the food and nutrition security impacts of maize breeding programmes. Glob. Food Secur. 17, 48–56. doi:10.1016/j.gfs.2018.03.007
Eriksson, D., Akoroda, M., Azmach, G., Labuschagne, M., Mahungu, N., and Ortiz, R. (2018). Measuring the impact of plant breeding on sub-Saharan African staple crops. Outlook Agric. 47, 163–180. doi:10.1177/0030727018800723
Ertiro, B. T., Das, B., Kosgei, T., Tesfaye, A. T., Labuschagne, M. T., Worku, M., et al. (2022). Relationship between grain yield and quality traits under optimum and low-nitrogen stress environments in tropical maize. Agronomy 12, 438. doi:10.3390/agronomy12020438
Ertiro, B. T., Labuschagne, M., Olsen, M., Das, B., Prasanna, B. M., and Gowda, M. (2020a). Genetic dissection of nitrogen use efficiency in tropical maize through genome-wide association and genomic prediction. Front. plant Sci. 11, 474. doi:10.3389/fpls.2020.00474
Ertiro, B. T., Olsen, M., Das, B., Gowda, M., and Labuschagne, M. (2020b). Efficiency of indirect selection for grain yield in maize (Zea mays L.) under low nitrogen conditions through secondary traits under low nitrogen and grain yield under optimum conditions. Euphytica 216, 134–212. doi:10.1007/s10681-020-02668-w
Ertiro, B. T., Olsen, M., Das, B., Gowda, M., and Labuschagne, M. (2020c). Genetic dissection of grain yield and agronomic traits in maize under optimum and low-nitrogen stressed environments. Int. J. Mol. Sci. 21, 543. doi:10.3390/ijms21020543
Falconnier, G. N., Corbeels, M., Boote, K. J., Affholder, F., Adam, M., MacCarthy, D. S., et al. (2020). Modelling climate change impacts on maize yields under low nitrogen input conditions in sub-Saharan Africa. Glob. change Biol. 26, 5942–5964. doi:10.1111/gcb.15261
Ficht, A., Konkin, D. J., Cram, D., Sidebottom, C., Tan, Y., Pozniak, C., et al. (2023). Genomic selection for agronomic traits in a winter wheat breeding program. Theor. Appl. Genet. 136, 38. doi:10.1007/s00122-023-04294-1
Ganal, M. W., Durstewitz, G., Polley, A., Bérard, A., Buckler, E. S., Charcosset, A., et al. (2011). A large maize (Zea mays L.) SNP genotyping array: development and germplasm genotyping, and genetic mapping to compare with the B73 reference genome. PloS one 6, e28334. doi:10.1371/journal.pone.0028334
García-Ruiz, A., Cole, J. B., VanRaden, P. M., Wiggans, G. R., Ruiz-López, F. J., and Van Tassell, C. P. (2016). Changes in genetic selection differentials and generation intervals in US Holstein dairy cattle as a result of genomic selection. Proc. Natl. Acad. Sci. 113, E3995–E4004. doi:10.1073/pnas.1519061113
Gowda, M., Makumbi, D., Das, B., Nyaga, C., Kosgei, T., Crossa, J., et al. (2021). Genetic dissection of Striga hermonthica (Del.) Benth. resistance via genome-wide association and genomic prediction in tropical maize germplasm. Theor. Appl. Genet. 134, 941–958. doi:10.1007/s00122-020-03744-4
Guo, Z., Tucker, D. M., Lu, J., Kishore, V., and Gay, G. (2012). Evaluation of genome-wide selection efficiency in maize nested association mapping populations. Theor. Appl. Genet. 124, 261–275. doi:10.1007/s00122-011-1702-9
Hao, Y., Wang, H., Yang, X., Zhang, H., He, C., Li, D., et al. (2019). Genomic prediction using existing historical data contributing to selection in biparental populations: a study of kernel oil in maize. plant genome 12, 180025. doi:10.3835/plantgenome2018.05.0025
Hirel, B., Le Gouis, J., Ney, B., and Gallais, A. (2007). The challenge of improving nitrogen use efficiency in crop plants: towards a more central role for genetic variability and quantitative genetics within integrated approaches. J. Exp. Bot. 58, 2369–2387. doi:10.1093/jxb/erm097
Hu, J., Chen, B., Zhao, J., Zhang, F., Xie, T., Xu, K., et al. (2022). Genomic selection and genetic architecture of agronomic traits during modern rapeseed breeding. Nat. Genet. 54, 694–704. doi:10.1038/s41588-022-01055-6
Juliana, P., He, X., Marza, F., Islam, R., Anwar, B., Poland, J., et al. (2022). Genomic selection for wheat blast in a diversity panel, breeding panel and full-sibs panel. Front. Plant Sci. 12, 745379. doi:10.3389/fpls.2021.745379
Kanampiu, F., Makumbi, D., Mageto, E., Omanya, G., Waruingi, S., Musyoka, P., et al. (2018). Assessment of management options on Striga infestation and maize grain yield in Kenya. Weed Sci. 66, 516–524. doi:10.1017/wsc.2018.4
Kibe, M., Nyaga, C., Nair, S. K., Beyene, Y., Das, B., Bright, J. M., et al. (2020). Combination of linkage mapping, GWAS, and GP to dissect the genetic basis of common rust resistance in tropical maize germplasm. Int. J. Mol. Sci. 21, 6518. doi:10.3390/ijms21186518
Kosambi, D. D. (2016). “The estimation of map distances from recombination values,” in DD Kosambi (Berlin, Germny: Springer), 125–130.
Liu, X.-H., He, S.-L., Zheng, Z.-P., Huang, Y.-B., Tan, Z.-B., Li, Z., et al. (2010). Identification of the QTLs for grain yield using RIL population under different nitrogen regimes in maize. Afr. J. Agric. Res. 5, 2002–2007. doi:10.1111/j.1439-0523.2007.01465.x
Lorenzana, R. E., and Bernardo, R. (2009). Accuracy of genotypic value predictions for marker-based selection in biparental plant populations. Theor. Appl. Genet. 120, 151–161. doi:10.1007/s00122-009-1166-3
Meng, L., Li, H., Zhang, L., and Wang, J. (2015). QTL IciMapping: integrated software for genetic linkage map construction and quantitative trait locus mapping in biparental populations. Crop J. 3 (3), 269–283. doi:10.1016/j.cj.2015.01.001
Meuwissen, T. H., Hayes, B. J., and Goddard, M. E. (2001). Prediction of total genetic value using genome-wide dense marker maps. Genetics 157, 1819–1829. doi:10.1093/genetics/157.4.1819
Ndlovu, N. (2020). Application of genomics and phenomics in plant breeding for climate resilience. Asian Plant Res. J., 53–66. doi:10.9734/aprj/2020/v6i430137
Ndlovu, N., Spillane, C., McKeown, P. C., Cairns, J. E., Das, B., and Gowda, M. (2022). Genome-wide association studies of grain yield and quality traits under optimum and low-nitrogen stress in tropical maize (Zea mays L.). Theor. Appl. Genet. 135, 4351–4370. doi:10.1007/s00122-022-04224-7
Qin, J., Wang, F., Zhao, Q., Shi, A., Zhao, T., Song, Q., et al. (2022). Identification of candidate genes and genomic selection for seed protein in soybean breeding pipeline. Front. Plant Sci. 13, 882732. doi:10.3389/fpls.2022.882732
Ribaut, J.-M., Fracheboud, Y., Monneveux, P., Banziger, M., Vargas, M., and Jiang, C. (2007). Quantitative trait loci for yield and correlated traits under high and low soil nitrogen conditions in tropical maize. Mol. Breed. 20, 15–29. doi:10.1007/s11032-006-9041-2
Ribaut, J.-M., Jiang, C., Gonzalez-de-Leon, D., Edmeades, G., and Hoisington, D. (1997). Identification of quantitative trait loci under drought conditions in tropical maize. 2. yield components and marker-assisted selection strategies: 2. yield components and marker-assisted selection strategies. Theor. Appl. Genet. 94, 887–896. doi:10.1007/s001220050492
Semagn, K., Beyene, Y., Babu, R., Nair, S., Gowda, M., Das, B., et al. (2015). Quantitative trait loci mapping and molecular breeding for developing stress resilient maize for sub-saharan africa. Crop Sci. 55, 1449–1459. doi:10.2135/cropsci2014.09.0646
Semagn, K., Bjørnstad, Å., and Xu, Y. (2010). The genetic dissection of quantitative traits in crops. Electron. J. Biotechnol. 13, 0–17. doi:10.2225/vol13-issue5-fulltext-14
Semagn, K., Magorokosho, C., Vivek, B. S., Makumbi, D., Beyene, Y., Mugo, S., et al. (2012). Molecular characterization of diverse CIMMYT maize inbred lines from eastern and southern Africa using single nucleotide polymorphic markers. BMC genomics 13, 113–211. doi:10.1186/1471-2164-13-113
Shitta, N. S., Abtew, W. G., Ndlovu, N., Oselebe, H. O., Edemodu, A. C., and Abebe, A. T. (2021). Morphological characterization and genotypic identity of African yam bean (Sphenostylis stenocarpa Hochst ex. A. Rich. Harms) germplasm from diverse ecological zones. Plant Genet. Resour. 19, 58–66. doi:10.1017/s1479262121000095
Tesfaye, K., Gbegbelegbe, S., Cairns, J. E., Shiferaw, B., Prasanna, B. M., Sonder, K., et al. (2015). Maize systems under climate change in sub-Saharan Africa: potential impacts on production and food security. Int. J. Clim. Change Strategies Manag. 7, 247–271. doi:10.1108/ijccsm-01-2014-0005
Vivek, B. S., Krishna, G. K., Vengadessan, V., Babu, R., Zaidi, P. H., Kha, L. Q., et al. (2017). Use of genomic estimated breeding values results in rapid genetic gains for drought tolerance in maize. Plant Genome 10. doi:10.3835/plantgenome2016.07.0070
Wang, N., Wang, H., Zhang, A., Liu, Y., Yu, D., Hao, Z., et al. (2020). Genomic prediction across years in a maize doubled haploid breeding program to accelerate early-stage testcross testing. Theor. Appl. Genet. 133, 2869–2879. doi:10.1007/s00122-020-03638-5
Worku, M., Banziger, M., Erley, G., Friesen, D., Diallo, A. O., and Horst, W. J. (2012). Nitrogen efficiency as related to dry matter partitioning and root system size in tropical mid-altitude maize hybrids under different levels of nitrogen stress. Field Crops Res. 130, 57–67. doi:10.1016/j.fcr.2012.02.015
Worku, M., Bänziger, M., Erley, G. S. A., Friesen, D., Diallo, A. O., and Horst, W. J. (2007). Nitrogen uptake and utilization in contrasting nitrogen efficient tropical maize hybrids. Crop Sci. 47, 519–528. doi:10.2135/cropsci2005.05.0070
Worku, M., Banziger, M., Friesen, D., Schulte, G., Horst, W. J., and Vivek, B. S. (2008). Relative importance of general combining ability and specific combining ability among tropical maize (Zea mays L.) inbreds under contrasting nitrogen environments. Maydica 53, 279–288.
Würschum, T. (2012). Mapping QTL for agronomic traits in breeding populations. Theor. Appl. Genet. 125, 201–210. doi:10.1007/s00122-012-1887-6
Yacoubou, A. M., Zoumarou Wallis, N., Menkir, A., Zinsou, V. A., Onzo, A., Garcia-Oliveira, A. L., et al. (2021). Breeding maize (Zea mays) for Striga resistance: past, current and prospects in sub-saharan africa. Plant Breed. 140, 195–210. doi:10.1111/pbr.12896
Yuan, Y., Cairns, J. E., Babu, R., Gowda, M., Makumbi, D., Magorokosho, C., et al. (2019). Genome-wide association mapping and genomic prediction analyses reveal the genetic architecture of grain yield and flowering time under drought and heat stress conditions in maize. Front. plant Sci. 9, 1919. doi:10.3389/fpls.2018.01919
Zaman-Allah, M., Das, B., Cairns, J. E., Vinayan, M. T., Tarekegne, A., Magorokosho, C., et al. (2018). Phenotyping for abiotic stress tolerance in maize—low nitrogen stress. A field manual; CIMMYT: harare, Zimbabwe. Available online: https://repository.cimmyt.org/bitstream/handle/10883/19935/60069.pdf?sequence=1 (accessed on June 10, 2023).
Zhang, A., Wang, H., Beyene, Y., Semagn, K., Liu, Y., Cao, S., et al. (2017a). Effect of trait heritability, training population size and marker density on genomic prediction accuracy estimation in 22 bi-parental tropical maize populations. Front. Plant Sci. 8, 1916. doi:10.3389/fpls.2017.01916
Zhang, X., Pérez-Rodríguez, P., Burgueño, J., Olsen, M., Buckler, E., Atlin, G., et al. (2017b). Rapid cycling genomic selection in a multiparental tropical maize population. G3 Genes, Genomes, Genet. 7, 2315–2326. doi:10.1534/g3.117.043141
Zhang, X., Pérez-Rodríguez, P., Semagn, K., Beyene, Y., Babu, R., López-Cruz, M., et al. (2015). Genomic prediction in biparental tropical maize populations in water-stressed and well-watered environments using low-density and GBS SNPs. Heredity 114, 291–299. doi:10.1038/hdy.2014.99
Zhao, X., Nie, G., Yao, Y., Ji, Z., Gao, J., Wang, X., et al. (2020). Natural variation and genomic prediction of growth, physiological traits, and nitrogen-use efficiency in perennial ryegrass under low-nitrogen stress. J. Exp. Bot. 71, 6670–6683. doi:10.1093/jxb/eraa388
Keywords: grain yield, low soil nitrogen, maize, sub-Saharan Africa, quantitative trait loci (QTL)
Citation: Kimutai C, Ndlovu N, Chaikam V, Ertiro BT, Das B, Beyene Y, Kiplagat O, Spillane C, Prasanna BM and Gowda M (2023) Discovery of genomic regions associated with grain yield and agronomic traits in Bi-parental populations of maize (Zea mays. L) Under optimum and low nitrogen conditions. Front. Genet. 14:1266402. doi: 10.3389/fgene.2023.1266402
Received: 24 July 2023; Accepted: 12 October 2023;
Published: 26 October 2023.
Edited by:
Krishnanand P. Kulkarni, Delaware State University, United StatesReviewed by:
Vignesh Muthusamy, Indian Agricultural Research Institute (ICAR), IndiaCopyright © 2023 Kimutai, Ndlovu, Chaikam, Ertiro, Das, Beyene, Kiplagat, Spillane, Prasanna and Gowda. This is an open-access article distributed under the terms of the Creative Commons Attribution License (CC BY). The use, distribution or reproduction in other forums is permitted, provided the original author(s) and the copyright owner(s) are credited and that the original publication in this journal is cited, in accordance with accepted academic practice. No use, distribution or reproduction is permitted which does not comply with these terms.
*Correspondence: Manje Gowda, bS5nb3dkYUBjZ2lhci5vcmc=
†ORCID: Noel Ndlovu, orcid.org/0000-0002-1832-0251; Vijay Chaikam, orcid.org/0000-0002-5046-1097; Charles Spillane, orcid.org/0000-0003-3318-323X; Boddupalli M. Prasanna, orcid.org/0000-0002-5761-2273; Manje Gowda, orcid.org/0000-0003-4434-6364
‡These authors have contributed equally to this work
Disclaimer: All claims expressed in this article are solely those of the authors and do not necessarily represent those of their affiliated organizations, or those of the publisher, the editors and the reviewers. Any product that may be evaluated in this article or claim that may be made by its manufacturer is not guaranteed or endorsed by the publisher.
Research integrity at Frontiers
Learn more about the work of our research integrity team to safeguard the quality of each article we publish.