 Hangchuan Shi
 Si Chen
 Fanju W. Meng
 Deborah J. Ossip
 Chen Yan
 Dongmei Li
- 1Department of Clinical and Translational Research, University of Rochester Medical Center, Rochester, NY, United States
- 2Department of Public Health Sciences, University of Rochester Medical Center, Rochester, NY, United States
- 3Aab Cardiovascular Research Institute, University of Rochester, School of Medicine and Dentistry, Rochester, NY, United States
- 4Department of Biomedical Genetics, University of Rochester Medical Center, Rochester, NY, United States
Background: Physiological and pathological stimuli result in distinct forms of cardiac hypertrophy, but the molecular regulation comparing the two, especially at the DNA methylation level, is not well understood.
Methods: We conducted an in vitro study using human cardiomyocytes exposed to angiotensin II (AngII) and insulin-like growth factor 1 (IGF-1) to mimic pathologically and physiologically hypertrophic heart models, respectively. Whole genome DNA methylation patterns were profiled by the Infinium human MethylationEPIC platform with >850 K DNA methylation loci. Two external datasets were used for comparisons and qRT-PCR was performed for examining expression of associated genes of those identified DNA methylation loci.
Results: We detected 194 loci that are significantly differentially methylated after AngII treatment, and 206 significant loci after IGF-1 treatment. Mapping the significant loci to genes, we identified 158 genes corresponding to AngII treatment and 175 genes to IGF-1 treatment. Using the gene-set enrichment analysis, the PI3K-Akt signaling pathway was identified to be significantly enriched for both AngII and IGF-1 treatment. The Hippo signaling pathway was enriched after IGF-1 treatment, but not for AngII treatment. CDK6 and RPTOR are components of the PI3K-Akt pathway but have different DNA methylation patterns in response to AngII and IGF-1. qRT-PCR confirmed the different gene expressions of CDK6 and PRTOR.
Conclusion: Our study is pioneering in profiling epigenome DNA methylation changes in adult human cardiomyocytes under distinct stress conditions: pathological (AngII) and physiological (IGF-1). The identified DNA methylation loci, genes, and pathways might have the potential to distinguish between pathological and physiological cardiac hypertrophy.
Introduction
Physiological and pathological stimuli result in distinct anatomic forms of cardiac hypertrophy through different molecular mechanisms (Walsh, 2006). Physiological cardiac hypertrophy presents as an increase in cardiac muscle cell diameter, which is observed in the hearts of trained athletes. The physiological growth of heart is a result of the adaptation to the increased workload, leading to increased vascularization of the myocardium and generation of more forceful ejection (Hudlicka and Brown, 1996; Richey and Brown, 1998). In contrast, pathological hypertrophy occurs in cardiovascular disease (CVD) patients (e.g., hypertension, valvular heart disease) in whom the cardiac muscle cell enlargement is coupled with cell senescence, cell death, fibrotic remodeling, and cardiac dysfunction (Shimizu and Minamino, 2016). Although some molecular distinctions have been made between physiological and pathological cardiac hypertrophy, most results were derived from studies focusing on mechanisms of pathological cardiac hypertrophy (Walsh, 2006). The comparison of molecular regulation between physiological and pathological cardiac hypertrophy is less understood.
The molecular mechanisms distinctions in adaptation to pathological and physiological cardiac hypertrophy involve the regulation and interaction among DNA, RNA, and protein. Most studies focused on the level of protein-protein interaction and gene expression, whereas the role of epigenetic modification (e.g., DNA methylation and histone modification) is less known. Recent investigations, however, have begun to shed light on the potential of DNA methylation to mediate both the physiological cardiac remodeling process induced by physical activity (Shi et al., 2021) and the pathological hypertrophy that can lead to heart failure (Liu and Tang, 2019). Although previous studies profiled whole genome-wide DNA methylation patterns by using human pathologically hypertrophic heart tissue (Haas et al., 2013; Jo et al., 2016; Ortega et al., 2018; Pepin et al., 2019), some limitations are noted. First, human heart tissue consists of a mixed type of cells not limited to cardiomyocytes, endothelial cells, inflammatory cells, and fibroblasts. Thus, the profiling of heart tissue cannot provide loci exclusively related to cardiomyocytes. While there are methods available to attempt the correction or deconvolution of bulk methylation samples by considering cell type proportions in the heart (Titus et al., 2017), the precise cellular composition of the heart remains a debated and uncertain topic (Zhou and Pu, 2016). Second, although the methylation loci which are associated with heart failure can be identified, studies did not identify loci that are influenced by physical activity, which may play important roles in preventing heart failure. In addition, it is difficult to obtain physiologically hypertrophic heart tissue as a control group due to ethical issues. Lastly, most previous studies utilized old platforms such as HumanMethylation 450K, failing to capture the advancements introduced by novel platforms that have significantly expanded the coverage of CpG sites.
To overcome the above limitations, we conducted an in vitro study with only 1 cell type–cardiomyocyte. We established both pathologically and physiologically hypertrophic heart models by exposing adult human cardiomyocytes to angiotensin II (AngII) and insulin-like growth factor 1 (IGF-1), respectively. AngII is released in the human body following hemodynamic overload and stimulates a cardiac hypertrophic response. Chronic unbalanced AngII will result in an uncompensated cardiac hypertrophic response, which ultimately leads to heart failure (Watkins et al., 2012). In contrast, IGF-1 was found to play a role in the induction of physiological heart growth (Weeks and McMullen, 2011). Studies showed that higher levels of IGF-1 were found in athletes compared with healthy sedentary people and was related to left ventricle end-diastolic dimension index (Neri Serneri et al., 2001). Our study was among the first to profile the whole-genome level of DNA methylation changes in the human cardiomyocytes in response to a pure pathological stimulus (i.e., AngII) and a pure physiological stimulus (i.e., IGF-1).
Materials and methods
Biomaterial processing
AC16 human cardiomyocyte cell line, a proliferating cell line derived from adult human ventricular cardiomyocyte with SV40 transformed (Davidson et al., 2005), was purchased from Sigma and cultured in DMEM/F-12 (Thermo Fisher Scientific) + 12.5% (v/v) FBS +1% (v/v) P/S. AC16 cells were serum starved for 24 h before treatment. For treatment, AC16 were treated with Ang II 100 nM (6 samples), IGF-1 100 ng/mL (6 samples) or vehicle treatment (i.e., control group; 4 samples) for both 12h and 24 h (further details regarding the chosen time points are provided in the Supplementary Material S1).
Genomic DNA was extracted using the Quick-DNA Isolation Kit (Zymo). For each assay, 1 μg of DNA was used for whole genome-wide DNA methylation profiling performed on the Infinium Human MehtylationEPIC BeadChip (Illumina) following the manufacturer’s recommendations. Briefly, the genomic DNA was bisulfite converted using the EZ DNA Methylation Kit (Zymo Research Corp., Irvine, CA, United States) before amplification. The samples were then whole-genome-amplified, followed incubation, fragmentation, precipitation, and resuspension. The resuspended samples were hybridized onto the BeadChip, and underwent wash, extension, and staining. After imaging, “IDAT” files were generated as the methylation array raw data. The Infinium MehtylationEPIC BeadChip array contains >850K of highly informative DNA methylation loci covering 99% of RefSeq genes, and 95% of all known CpG islands, along with enhancer sits and other content categories. Compared to its predecessor (i.e., Mehtylation450K BeadChip), MehtylationEPIC platform contains over 90% of the CpGs on the Illumina Methylatio450 plus an additional 350,000 CpGs in enhancer regions.
RNA was extracted from AC16 cells using RNeasy kit (Qiagen) according to the manufacturer’s instructions. cDNA was synthesized with the iScriptDNA synthesis kit (Bio-Rad). qPCR amplification was performed by using IQ SYBR Green Supermix (Bio-Rad). Each reaction was performed in triplicate. Primers for qPCR were as follows.
GAPDH
(F) TTGACTCCGACCTTCACCTTCC (R) CGCTCTCTGCTCCTCCTGTTC
CDK6
(F) TCACGAACAGACAGAGAAACC (R) CTCCAGGCTCTGGAACTTTATC
RPTOR
(F) CTTCGTTCTGTGAGCTCCTATG (R) CACCAGATTCCTCTGTCAAACT
Primers for COL4A6, CREB3L2, FGF12, GHR, and NRAS, FN1 can be found in Supplementary Material S1.
DNA methylation profiling
The resulting raw DNA methylation data (IDAT files) were used to quantify the proportion of methylation at each DNA methylation locus on a probe-wise basis using the minfi package (1.36.0) in R3.2.2.17 (Aryee et al., 2014). The imported raw intensity data were preprocessed by background correction and internal control (Wilhelm-Benartzi et al., 2013). The subset-quantile within array normalization (SWAN) method (Maksimovic et al., 2012) was used to correct the technical bias from the Type I and Type II probe designs (Pidsley et al., 2016). The report of the sample quality control is shown in Supplementary Figure S1. The quality control of probes was performed by filtering probes with missing values or with a detection p-value of >0.05 in >25% of the samples (Bibikova et al., 2011). We further removed probes identified by Chen et al. to cross-hybridize with nontargeted DNA (Chen et al., 2013). Finally, 822,246 DNA methylation loci passed quality control. The annotation was performed utilizing the human reference genome GRCh37/hg19.
Statistical analysis
Differentially methylated DNA loci were identified by linear regression modeling with empirical Bayes approach for standard deviation estimation using the limma package (Ritchie et al., 2015). Significance levels were adjusted to control for the false discovery rate (FDR) using the Benjamini–Hochberg procedure. The temporal pattern (24 h vs. 12 h) was taken into consideration and incorporated into the final identification of differentially methylated DNA loci. Detailed information on the linear regression model and the interpretations of coefficients can be found in Supplementary Material S1 and Supplementary Figure S2.
M-values served as the chosen DNA methylation levels (the dependent variable) in the linear regression model due to their stronger alignment than beta values with the Gaussian assumption, rooted in a Bayesian Gaussian model (Zhuang et al., 2012). The calculation of the M-value involves deriving the log2 ratio between the intensities of methylated versus unmethylated probes (Du et al., 2010). A positive M-value signifies a higher count of methylated molecules compared to unmethylated ones, whereas a negative M-value indicates the opposite. However, to facilitate intuitive biological interpretation, the M-values of the identified loci were then transformed into beta values (ranging from 0% to 100%). This transformation directly presents the DNA methylation level as a percentage for a specific locus. The conversion followed this relationship: M = log2 (beta/[1–beta]).
Pathway analyses were performed with both the first generation over-representation analysis (ORA) and the second generation functional class scoring (FCS) analysis. For ORA, genes corresponding to the identified DNA methylation loci were used in the web-accessible bioinformatic tool DAVID (Huang da et al., 2009). By gene-set enrichment analysis (GSEA), the DAVID aimed at systematically extracting biological meaning and over-represented biological functions from large gene or protein lists based on the hypergeometric (Fisher’s exact) test. For FCS, all genes were ranked using p-values from the differential expression test. By using R Bioconductor package methylGSA (Ren and Kuan, 2019), the entire gene list was utilized to calculate a gene set level p-value, with a crucial adjustment made for the number of CpGs to account for the specific biases in EWAS arising from diverse CpG association p-values per gene. The gene sets were defined utilizing the KEGG (Kanehisa and Goto, 2000) and GO (Ashburner et al., 2000) database.
To replicate our findings, we tested the identified DNA methylation loci in an external global DNA methylation dataset (generated on Infinium MethylationEPIC platform) from the heart biopsy samples of 41 dilated cardiomyopathy (DCM) and 31 control individuals who underwent heart transplantation (Meder et al., 2017). In order to extend our findings to the population level, we further compared our results to an external epigenomic dataset consisting of blood samples from 1,246 individuals (Shi et al., 2021). In this dataset, physical activity serves as a physiological stimulus analogous to IGF-1 at the population level, while cardiovascular disease represents the pathological changes associated with AngII.
PCR results were tested using the one-way ANOVA followed by the Holm-Sidak post-hoc test to examine differences among groups to control for multiple testing. Statistical significance was set at p < 0.05 for two-sided tests.
Results
Epigenome-wide association study of cardiomyopathy
As summarized in the Manhattan plots (Figures 1A, B), and following correction for multiple testing, a total of 194 loci exhibited significant differential methylation in the AngII treatment group (vs. control; refer to Figure 1A), along with 206 significant loci in the IGF-1 treatment group (vs. control; refer to Figure 1B). The volcano plots (Figures 1C,D) depict the distribution of these significant loci (FDR <0.05; represented by red dots) in the sections corresponding to hypermethylation and hypomethylation. After AngII treatment, we observed 97 (50.0%) loci displaying hypermethylation and 97 showing hypomethylation (Figure 1C). Similarly, after IGF-1 treatment, 93 (45.1%) loci exhibited hypermethylation, and 113 demonstrated hypomethylation (Figure 1D). For detailed insights into these significant loci, including their locations, relations to CpG islands, functional regions, corresponding genes, and p-values, please refer to Supplementary Table S1. Notably, a majority of these significant loci were situated within gene body regions, closely followed by the promoter regions.
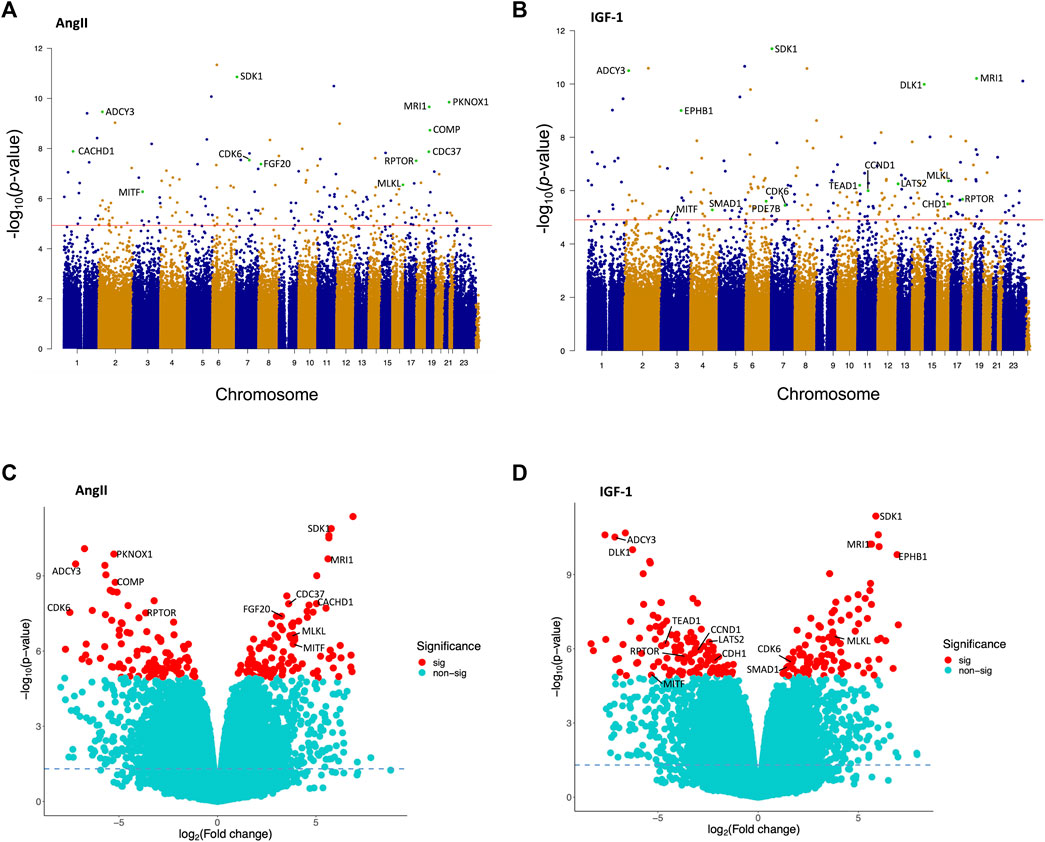
FIGURE 1. Manhattan plots and volcano plots illustrating the findings of the epigenome-wide association study conducted on human cardiomyocytes post AngII and IGF-1 treatment (vs. control). Manhattan plots are shown individually for (A) AngII and (B) IGF-1. These plots feature the minus log10p-values of DNA methylation loci that have met quality control criteria. The red line represents the significance threshold for the false discovery rate (FDR) at p = 0.05. Some of the CpG loci are highlighted as cyan dots and are accompanied by labels indicating their corresponding gene names. Volcano plots are displayed for (C) AngII and (D) IGF-1. In these plots, DNA methylation loci are denoted as red dots (significant loci) or cyan dots (non-significant loci), according to the FDR significance threshold of p = 0.05. Hypermethylated loci are positioned on the right side, while hypomethylated loci are situated on the left side. The horizontal dashed line signifies the unadjusted significance level of p = 0.05. Some of the CpG loci the significant CpG loci are annotated with their corresponding gene names. The correspondences between the gene names and the highlighted CpG loci are: CDK6 (cg03330377 in AngII, cg06576484 in IGF-1), RPTOR (cg02251850 in AngII, cg02251850 in IGF-1), MITF (cg10160567 in AngII, cg13685139 in IGF-1), MLKL (cg08357850), SDK1 (cg07926598), PKNOX1 (cg15157241), MRI1 (cg25755428), ADCY3 (cg20227471), COMP (cg25497529), CACHD1 (cg16487794), CDC37 (cg00876541), FGF20 (cg05578055), DLK1 (cg17412258), EPHB1 (cg19591512), PDE7B (cg13864354), LATS2 (cg00580291), TEAD1 (cg01482376), CCND1 (cg02723533), CDH1 (cg08616585), SMAD1 (cg14561362).
81 DNA methylation sites were shared between both treatment groups (Supplementary Table S2), while 113 loci were unique to the post-AngII treatment scenario, and 125 loci were unique to the post-IGF-1 treatment scenario. Noteworthy CpG loci were highlighted in both Manhattan and Volcano plots due to their corresponding genes being among the most significant in the AngII and IGF-1 groups (e.g., SDK1, MRI1, ADCY3, etc.), or due to their recognized roles as pivotal components within important pathways (e.g., RPTOR in the mTOR pathway, LATS2 and TEAD1 in the Hippo signaling pathway, CDK6 in the cell cycle, etc.) (Figures 1A–D).
Comparison of significant DNA methylation loci related genes in AngII vs. IGF-1 treatment
Assigning the significant loci to their respective genes and excluding the loci that are not situated near any known genes (Supplementary Table S1), we identified 158 genes corresponding to significant DNA methylation loci after AngII treatment and 175 genes after IGF-1 treatment, with 67 genes overlapped in both AngII and IGF-1 groups (see the Venn diagram Figure 2A). Of the 158 genes identified in the AngII group, 81 (51.3%) genes were related to a significantly hypermethylated loci and 77 genes to a significantly hypomethylated loci. For IGF-1, 80 (45.7%) genes were hypermethylated and 95 genes were hypomethylated. The 91 genes which are exclusively identified after AngII treatment are shown in Figure 2B and ranked by the M-values of their corresponding significant loci, while the 108 genes which are exclusive for IGF-1 treatment are shown in Figure 2C. These distinct genes in both treatments could significantly contribute to the variations in mechanisms between physiological and pathological cardiomyopathy, warranting further investigation.
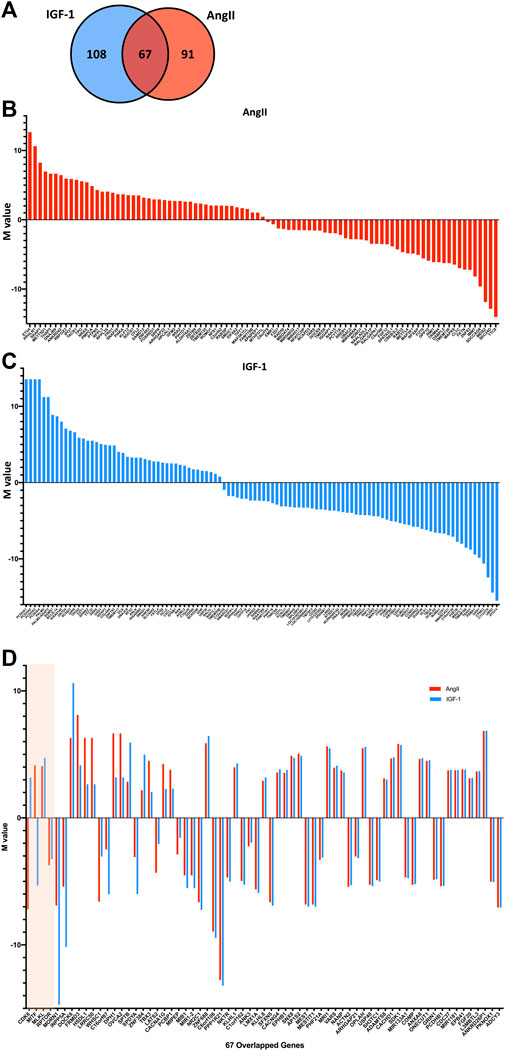
FIGURE 2. Mapping genes to the significant DNA methylation loci post AngII and IGF-1 treatment (vs. control). The significant DNA methylation loci were annotated to their corresponding genes. Illustrated by a Venn diagram (A), this visualization presents the count of genes annotated from the identified loci in the AngII group (depicted by the red circle), the count of genes annotated from the loci in the IGF-1 group (represented by the blue circle), as well as the overlap between the two. The genes, ordered according to the M-values of their respective significant loci, are presented in (B) for those exclusive to AngII and in (C) for those exclusive to IGF-1 (shown as blue bars). The solid line signifies the M-value = 0, with hypermethylated loci positioned above the line and hypomethylated loci positioned below. In (D), the 67 overlapping genes are detailed and ranked by delta-delta change. The beige-shaded portion delineates genes (i.e., CDK6, MITF, MLKL, and RPTOR) with differing significant loci for AngII and IGF-1, while the unshaded region encompasses genes sharing the same significant locus for both treatments.
However, in this study, we narrow our focus to another aspect of mechanism disparities - variations within the same gene. Our aim is to identify genes that might exhibit differential methylation in response to AngII and IGF-1 treatment. These genes hold the potential to serve as targets, as manipulating them could potentially lead to achieving specific goals by regulating one aspect to control the opposing outcomes. For each overlapped gene, we compared the differential change in methylation level between AngII and control (delta change) with the differential change between IGF-1 and control (delta change), resulting in a delta-delta change. The absolute value of the delta-delta change reflects the extent to which the same gene’s methylation status changed differently after AngII vs. IGF-1 treatment. The 67 overlapped genes are presented in Figure 2D, ordered based on the absolute values of the delta-delta change.
Among these overlapped genes, four genes (CDK6, MITF, MLKL, and RPTOR), shown in the shaded area of Figure 2D, are unique because the corresponding significant loci differ between the AngII and IGF-1 groups. For CDK6, the CpG site cg03330377 (location chr7: 31232748) showed significant hypomethylation after AngII treatment, while cg06576484 (location chr7: 92382242) exhibited significant hypermethylation after IGF-1 treatment. Similarly, for MITF, cg10160567 (location chr3: 69788520) demonstrated significant hypermethylation after AngII treatment, while cg13685139 (location chr3: 69812820) displayed significant hypomethylation after IGF-1 treatment. In the case of MLKL, cg08357850 (location chr16: 74734885) was identified as significant in the AngII group, while both cg09830308 (location chr16: 74734321) and cg08357850 (location chr16: 74734885) were significant in the IGF-1 group, all showing hypermethylation. Similarly, for RPTOR, cg02251850 (location chr17: 78851503) was significant in the AngII group, while both cg02243479 (location chr17: 78859959) and cg02251850 (location chr17: 78851503) were significant in the IGF-1 group, all displaying hypomethylation.
Pathway analysis and validations using data from human samples
Pathways were identified through gene-set enrichment analysis (GSEA) using genes corresponding to differentially methylated loci identified in the AngII and IGF-1 treatment groups via the ORA analysis (Table 1). The melanoma pathway showed the highest enrichment in both the AngII and IGF-1 groups [p = 0.003 with 8.35-fold enrichment, and p = 0.004 with 7.57-fold enrichment, respectively]. Additionally, the PI3K-Akt signaling pathway was among the top enriched pathways for both treatment groups [p = 0.023 with 2.75-fold enrichment, and p = 0.013 with 2.80-fold enrichment, respectively]. Interestingly, the PI3K-Akt signaling pathway shared all genes enriched in melanoma pathway (e.g., CDK6, FGF20, and MITF) and included three additional genes (i.e., RPTOR, COMP, and CDC37), suggesting a higher level of significance and potential relevance. It is noteworthy that the pathways identified through the FCS analysis supported the outcomes of the ORA analysis by enriching genes within melanoma, mTOR signaling, cell cycle, and MAPK signaling pathways (Supplementary Figure S3). These pathways either overlap, interact with, or form a subset of the PI3K-Akt signaling pathway.
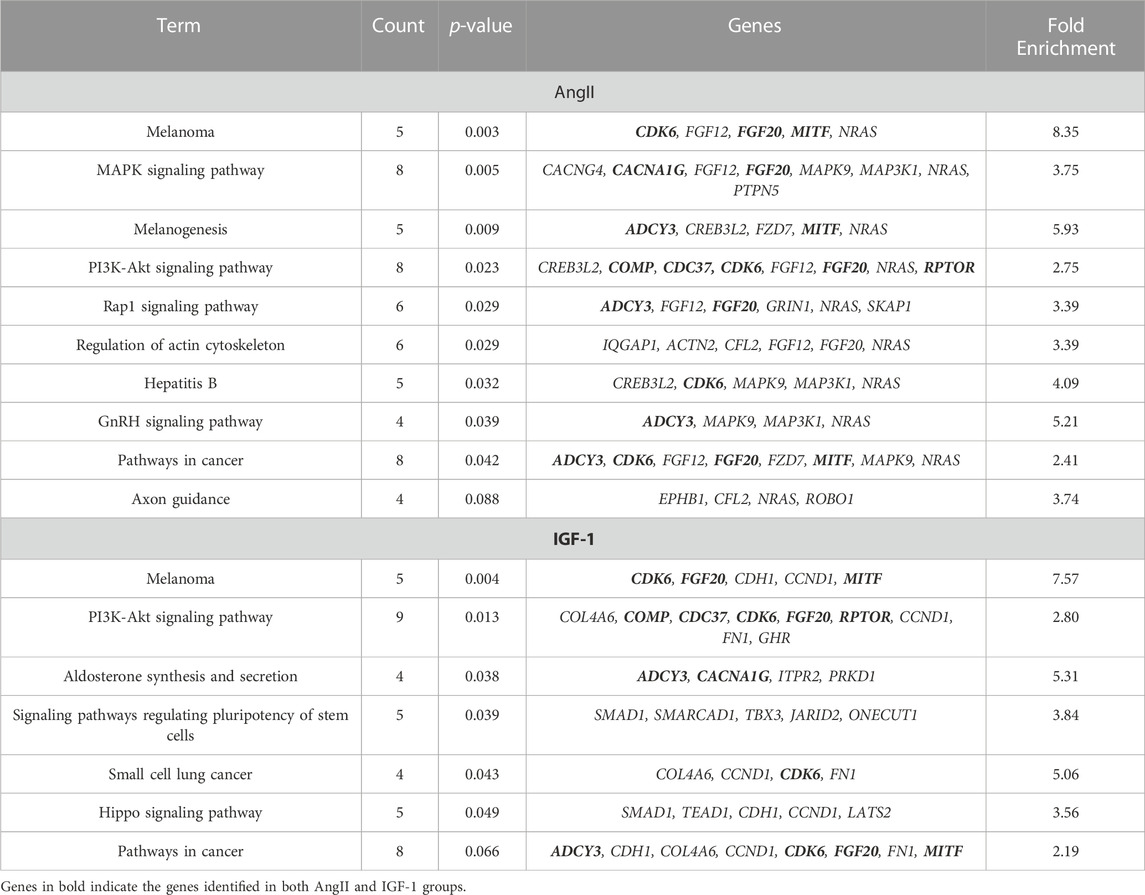
TABLE 1. Gene-set enrichment analysis of genes identified by AngII and IGF-1 related DNA methylation loci.
To replicate our findings, we tested the identified DNA methylation loci in an external global DNA methylation dataset from the heart biopsy samples of 41 DCM and 31 healthy control individuals (Meder et al., 2017). As shown in Figure 3A; Supplementary Table S3, we could successfully replicate 14 of the 319 loci (4.4%), corresponding to 12 of the 266 (4.5%) mapped genes in the independent dataset. Two of the most stringently significant hits (i.e., cg16967640, cg07202461) from our findings could also be validated (replication adjusted p = 0.021 and 0.046, respectively).
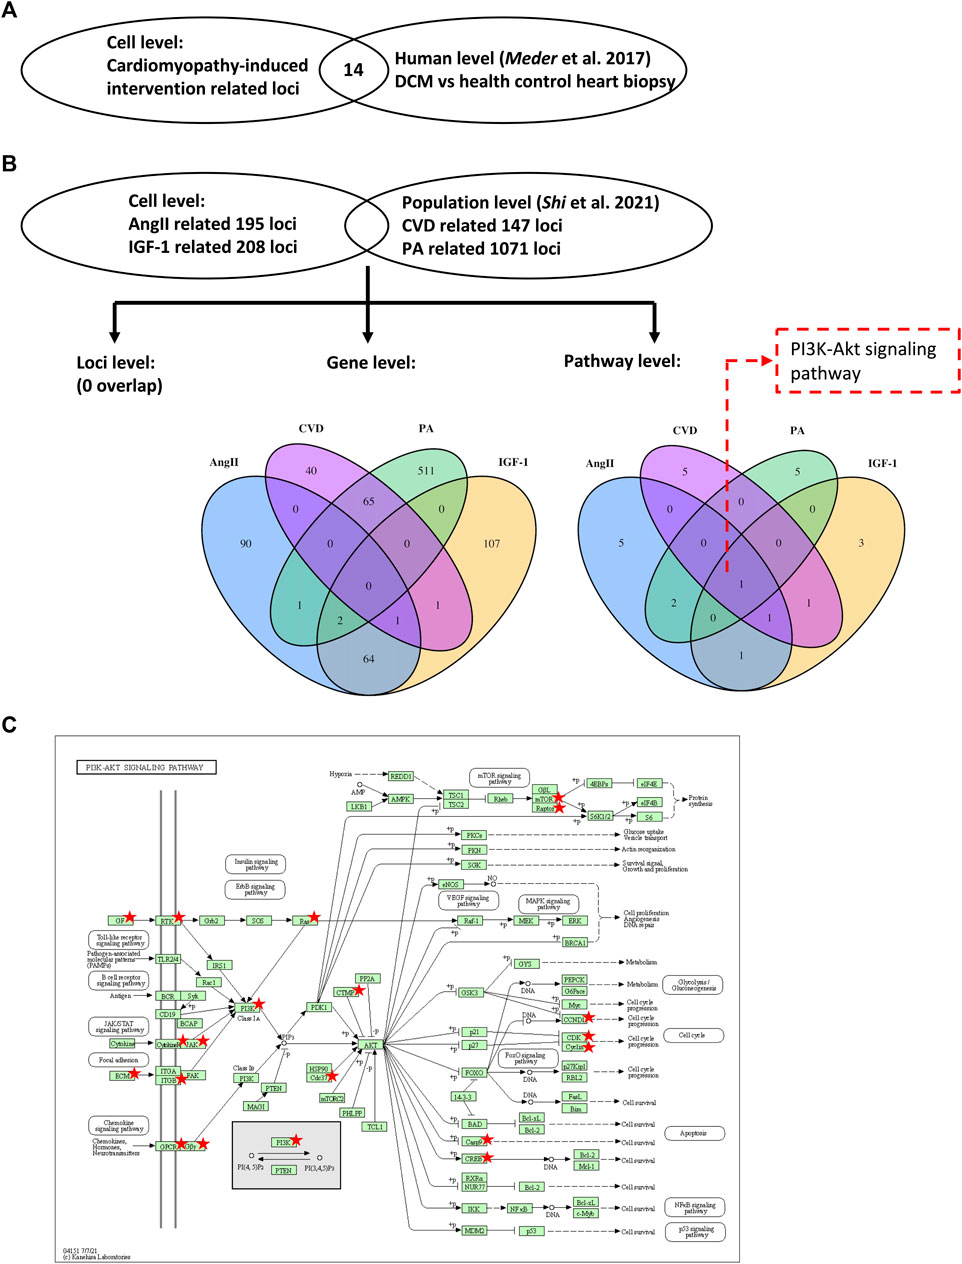
FIGURE 3. Validations using data from human samples. Two external datasets using human heart biopsy samples (Meder et al., 2017) and human blood samples (Shi et al., 2021) were selected to validate the results from the present study. Venn diagrams illustrate the overlap of identified loci (A), genes and pathways (B). The KEGG map (C) displays the PI3K-Akt pathway, with the identified genes marked by stars. DCM, dilated cardiomyopathy; CVD, cardiovascular diseases; and PA, physical activity. KEGG, Kyoto Encyclopedia of Genes and Genomes. Copyright permission was granted from Kanehisa Laboratories (https://www.kanehisa.jp/).
To extend our findings from the cell level to the population level, we compared our findings to an external epigenomic dataset from the blood samples of 1,246 individuals (Shi et al., 2021). In this cohort study, the physical activity- (PA) and CVD-associated DNA methylation loci were identified. At the CpG site level, no locus was mutually identified in our study and in the independent cohort. At the gene level, two genes (i.e., EPB41 and MORN1) were mutually identified associated with both IGF-1 treatment (in our study) and PA (in the cohort study) (Figure 3B). One gene (i.e., CACHD1) was mutually identified associated with both AngII treatment (in our study) and CVD (in the cohort study) (Figure 3B). Interestingly, these three mutual genes did not exhibit a significant change in mRNA expression during the confirmatory step (Supplementary Figure S4). Consequently, we shifted our focus to exploring overlaps at the pathway level. Pathway analysis of the cohort study is shown in Supplementary Table S4.
Notably, we observed enrichment of the PI3K-Akt signaling pathway across all investigated conditions (i.e., AngII, IGF-1, PA, and CVD) at the pathway level, further supporting our previous findings indicating its significant role. In Figure 3C, the PI3K-Akt signaling pathway is illustrated, with the genes identified in our study and the cohort study highlighted. Remarkably, among the highlighted genes, CDK6 and RPTOR emerge as key factors within this pathway, providing additional support to our previous observations where the DNA methylation levels of CDK6 and RPTOR exhibited differential changes following AngII and IGF-1 treatment.
Impact of differential DNA methylation on gene expression
To investigate whether the identified DNA methylation alterations also impact overall gene expression, we conducted qPCR on isolated RNA extracts for specific genes within the PI3K-Akt pathway. Notably, the expression of eight genes was found to correlate with changes in DNA methylation sites (Figure 4; Supplementary Figure S5). Upon analyzing the methylation status of the CDK6 gene, we observed substantial hypomethylation in the CpG island and flanking shores and shelves regions, yet notable hypermethylation within the gene body region (Figure 4A). Within this context, we identified two distinct differentially methylated sites for AngII (cg03330377, within the 3′UTR) and for IGF-1 (cg06576484, within the intron) treatments (Figure 4B). Interestingly, the CpG locus cg03330377 displayed discernible hypomethylation in IGF-1 treatment among all CDK6 CpG loci, with a p-value (1.1 × 10⁻⁴) that approached but did not reach the global FDR = 0.05 cutoff line (Figure 4C). While the average DNA methylation level of the CpG island indicated a tendency toward increased methylation in both AngII and IGF-1 groups compared to the control group, the difference was not statistically significant (Figure 4D). Remarkably, despite hypermethylation or hypomethylation of significant CpGs, the CDK6 gene exhibited reduced expression in both the AngII and IGF-1 groups, with significance observed solely in the IGF-1 group (Figure 4E). Given the absence of a significant change across the overall CpG island, it is plausible that both cg03330377 and cg06576484 are linked to a decrease in gene expression, with their combined presence contributing to the substantial decrease observed in the context of IGF-1 treatment. Although the exact function of gene body DNA methylation in gene transcription remains unclear, prior studies suggest that gene body DNA methylation might be a general feature, and contribute to transcriptional regulation (Hellman and Chess, 2007; Ball et al., 2009).
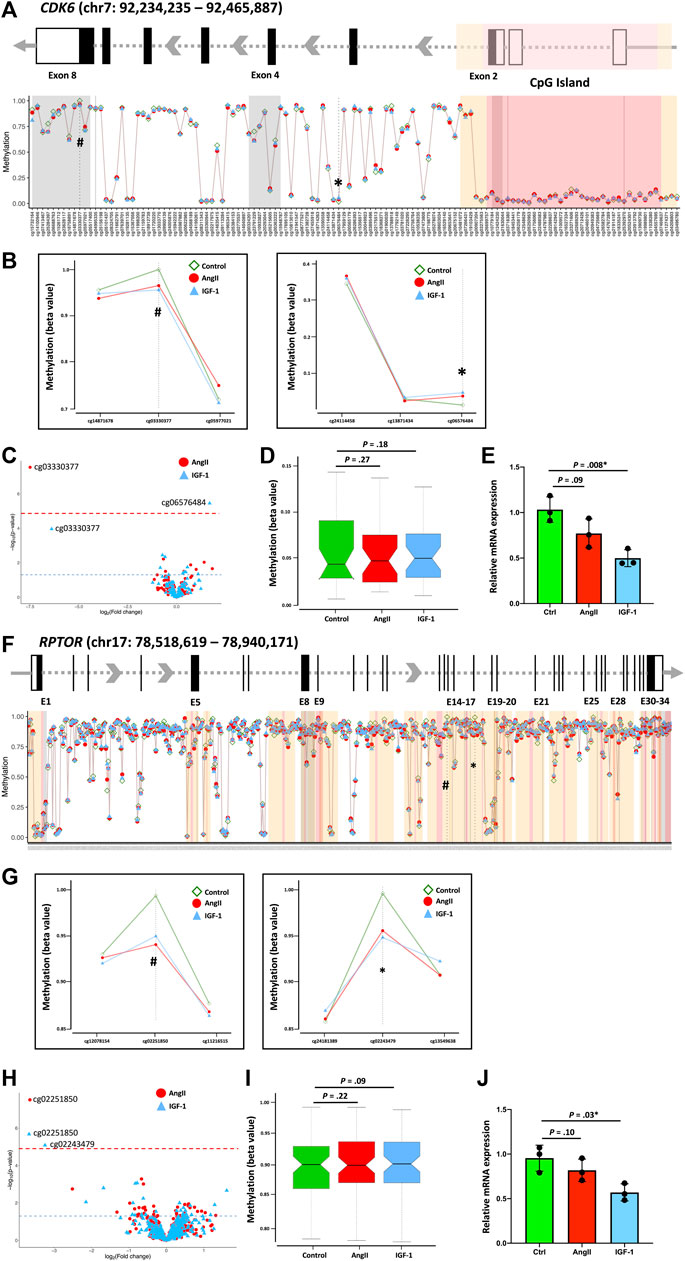
FIGURE 4. Association of DNA methylation pattern and gene expression. The association of DNA methylation pattern and gene expression were displayed using CDK6 and RPTOR as examples. Schematic gene structures (A, F) display exons (black boxes or bars) and the 3′-UTR and 5′-UTR regions (empty boxes). The distances between exons are not depicted to scale but are modified for visual representation of the DNA methylation loci-enriched region corresponding to the global methylation distribution map across the CDK6 (A) and RPTOR (F) genes. The red-shaded area indicates the CpG island, while the yellow-shaded areas on both flanks indicate CpG shelves and CpG shores. The identified significant loci’s DNA methylation levels are indicated in the global map and presented in separate Figures. For CDK6, the loci are cg03330377 and cg06576484 (B), and for RPTOR, the loci are cg02251850 and cg02243479 (G). Volcano plots present all CpGs within the CDK6 gene (C) and the RPTOR gene (H) following AngII and IGF-1 treatments. The red dashed line indicates the FDR significance threshold of p = 0.05, utilized to adjust for the complete set of 822,246 DNA methylation loci that passed quality control. Hypermethylated loci are positioned on the right, while hypomethylated loci are on the left. The blue horizontal dashed line represents the unadjusted significance level of p = 0.05. Boxplots display the average methylation level of the CpG island(s) for CDK6 (D) and RPTOR (I). Gene expression levels are shown in (E) for CDK6 and in (J) for RPTOR.
A parallel scenario emerged in the case of the RPTOR gene (Figure 4F). We identified two distinct differentially methylated sites for AngII (cg02251850, within the CpG shores) and for IGF-1 (cg02251850 and cg02243479, both within the CpG shores) treatments (Figures 4G,H). Similarly, the average DNA methylation level of the CpG island showed a trend toward increased methylation in both the AngII and IGF-1 groups in comparison to the control group, yet the difference lacked statistical significance (Figure 4I). The RPTOR gene also displayed reduced expression in both the AngII and IGF-1 groups, with significance exclusively observed in the IGF-1 group (Figure 4J). It is conceivable that cg02251850 and cg02243479 collectively contribute to a decrease in gene expression, leading to the notable decrease observed in the context of IGF-1 treatment.
However, our study did not delve into the mechanisms by which these CpG loci regulate gene expression. It remains a viable hypothesis that these highlighted CpG loci might be situated within pivotal regulatory elements, warranting further investigation in future studies.
Discussion
The present in vitro study identified a significant role of DNA methylation patterns and multiple related pathways in the pathological and physiological hypertrophic processes. The reproducible DNA methylation sites and the PI3K-Akt signaling pathway identified in this study, as well as the successful replications in external human biopsy samples and population blood samples, underscored the robustness of the findings.
The PI3K-Akt signaling pathway has been demonstrated to be involved in both physiological and pathological forms of cardiac growth. PI3K has been shown to activate in response to pressure overload in vivo and in response to hypertrophic ligands such as growth factors, angiotensin II, and cardiotrophin-1 in vitro (Oh et al., 1998). Overexpression of the activated PI3K can directly bind to the pleckstrin homology domain of Akt and promote translocation and indirectly activate Akt by activating the kinase that phosphorylates Akt (Walsh, 2006). In turn, Akt activation regulates cardiomyocyte size through downstream pathways such as activation of mTOR-dependent pro-growth pathways and cyclin/CDK cell cycle regulation, and suppression of FOXO-dependent atrophy programs. Our previous study identified an important catalytic subunit of PI3K (i.e., PIK3CD) that is significantly hypomethylated in physically active individuals and hypermethylated in CVD patients, indicating the compensation of the PI3K-Akt signaling pathway at the DNA methylation level in response to long-term physiological and pathological stresses to hearts (Shi et al., 2021). In contrast, in our present study, we did not find significant changes of either PI3K or Akt at DNA methylation levels in response to AngII or IGF-1 treatment on cardiomyocytes. This result suggests that the alteration of upstream molecules in the PI3K-Akt signaling might be regulated by other ways (e.g., direct protein-protein interaction) rather than DNA methylation in the in vitro model mimicking physiological or pathological stresses to cardiomyocytes.
However, some downstream key components of the PI3K-Akt pathway were identified to have significant changes at the DNA methylation level in response to AngII or IGF-1 treatment. CDK6, as an example of a cyclin/CDK cell cycle regulator, showed significant changes on different DNA methylation loci in response to AngII vs. IGF-1. The gene expression confirmed the opposite change of CDK6 corresponding to DNA methylation modifications. A prior study showed that CDK6 is expressed in the adult left ventricle of the heart and is activated by D-type cyclins (Busk et al., 2002). Tamamori et al. (Tamamori et al., 1998) and Busk et al. (Busk et al., 2002) showed that inhibition of CDK6 impaired hypertrophy of in vitro isolated cardiomyocytes. MicroRNA-1 was also reported to be involved in the regulation of CDK6 mediated cardiac hypertrophy (Yuan et al., 2016). Our study provided new evidence of a possible mechanism, that AngII or IGF-1 may affect CDK6 methylation to regulate the cell cycle program. Similarly, RPTOR, as an example of mTOR-dependent growth regulator, was identified to have different regulation loci in response to AngII vs. IGF-1 at the DNA methylation level. Recent in vivo studies demonstrated that RPTOR plays a critical role in hypertrophy (Shende et al., 2011; Baraldo et al., 2021). Shende et al. showed that cardiac ablation of Raptor protein encoding by RPTOR impairs adaptive hypertrophy and causes dilated cardiomyopathy and heart failure in mice (Shende et al., 2011). Our study indicates an alternative way to activate mTOR signaling by regulating the DNA methylation status of RPTOR.
In additional to the well-established PI3K-Akt signaling pathway, our study identified many DNA methylation loci and genes with different methylation levels in response to AngII vs. IGF-1 (Figure 2). Some identified genes and their related pathways have recently received significant attention in the field of cardiac biology to potentially differentiate between physiological and pathological cardiac hypertrophy. For example, CCND1, LATS2, CDH1, TEAD1, and SMAD1 are all important components of the Hippo signaling pathway, which is shown to be a critical regulator of heart growth (Windmueller and Morrisey, 2015). One recent study suggested that the Hippo pathway is involved in both physiological cardiac hypertrophy (Gholipour and Tabrizi, 2020) and can improve the heart’s response to CVD (Yang et al., 2015). Interestingly, Lin et al. reported that PI3KCB, which encodes another important component of PI3K kinase, links Hippo and PI3K-Akt signaling pathways to promote heart growth (Lin et al., 2015). In the present study, CCND1, LATS2, CDH1, TEAD1, and SMAD1 were all significantly hypomethylated in response to IGF-1, but not to AngII. Confirmed by RT-PCR, gene expression of CCND1, LATS2, CDH1, and TEAD1 were all significantly decreased in IGF-1 but remained unchanged in AngII (Supplementary Figure S6). In agreement with previous reports, our findings indicated the Hippo signaling pathway may be more active in response to IGF-1 but not to AngII. Further study is promising for discovering the possible role of the Hippo signaling pathway in differentiating between pathological and physiological cardiac hypertrophy.
We noticed some limitations in the present study. First, the biomaterials of the study were extracted from the cell line AC16. While AC16 cells were derived from normal adult human ventricular cardiomyocytes, they were fused with SV40 transformed fibroblasts to gain immortality. Nevertheless, AC16 remains a crucial in vitro model for uncovering key aspects of cardiomyopathy mechanisms (Chen et al., 2020). Secondly, it is important to note that the samples used in our present cell line study differ from those in our previous population study. The population study utilized monocytes derived from blood samples, whereas the current study focused on cardiomyocytes. This distinction could explain the lack of overlapping loci identified when comparing the cell study to the population study. However, obtaining biopsy samples for a large population is not feasible, and considering that cardiomyopathy involves both cardiomyocytes and inflammatory cells, it is known that inflammatory signaling in cardiomyocytes responds to stress (Xu and Brink, 2016). Therefore, we believe that this comparison can still provide valuable insights into the inflammatory signaling response to pathological and physiological stimuli. Lastly, we examined the impact of DNA methylation on gene expression through confirmatory PCR analysis. Conventionally, it is believed that DNA methylation suppresses gene expression. However, emerging evidence suggests that DNA methylation can also enhance gene expression in certain cases (Moore et al., 2013). Additionally, several regulatory steps occur between DNA methylation and gene transcription. For instance, a complex interplay (i.e., cooperation or antagonism) exists between DNA methylation and histone modifications, directly influencing the final gene expression outcome (Rose and Klose, 2014). However, these intricacies are not addressed within the scope of this study. Therefore, to gain a comprehensive understanding of the identified genes, further investigations into their biological roles through mechanistic research are warranted.
Conclusion
Our study was among the first to profile the whole-genome level of DNA methylation changes in adult human cardiomyocytes in response to pure pathological stress (i.e., AngII) and pure physiological stress (i.e., IGF-1). Validated by external human heart biopsy data, compared with a cohort study, and confirmed by RT-PCR experiments, the identified DNA methylation loci, genes, and pathways might have the potential to differentiate between the pathological vs. physiological cardiac hypertrophy.
Data availability statement
The data presented in this study are deposited in the Gene Expression Omnibus (GEO) under the accession number GSE241551.
Author contributions
HS: Conceptualization, Data curation, Formal Analysis, Investigation, Methodology, Validation, Visualization, Writing–original draft, Writing–review and editing. SC: Data curation, Formal Analysis, Investigation, Methodology, Validation, Visualization, Writing–review and editing. FM: Formal Analysis, Methodology, Writing–review and editing. DO: Conceptualization, Methodology, Supervision, Writing–review and editing. CY: Conceptualization, Funding acquisition, Methodology, Supervision, Writing–review and editing. DL: Conceptualization, Investigation, Methodology, Supervision, Writing–review and editing.
Funding
The authors declare financial support was received for the research, authorship, and/or publication of this article. This study was supported by 1R01HL154318 from the National Institutes of Health (CY), by the University of Rochester CTSA award number UL1 TR002001 from the National Center for Advancing Translational Sciences of the National Institutes of Health (DL), and by the University of Rochester Infection and Immunity: From Molecules to Populations (IIMP) award number BWF-1014095 from the Burroughs Welcome Fund of Institutional Program Unifying Population and Laboratory Based Sciences (HS).
Conflict of interest
The authors declare that the research was conducted in the absence of any commercial or financial relationships that could be construed as a potential conflict of interest.
Publisher’s note
All claims expressed in this article are solely those of the authors and do not necessarily represent those of their affiliated organizations, or those of the publisher, the editors and the reviewers. Any product that may be evaluated in this article, or claim that may be made by its manufacturer, is not guaranteed or endorsed by the publisher.
Supplementary material
The Supplementary Material for this article can be found online at: https://www.frontiersin.org/articles/10.3389/fgene.2023.1264382/full#supplementary-material
Abbreviations
AngII, Angiotensin II; IGF-1, Insulin-like growth factor 1; PA, Physical activity; CVD, Cardiovascular diseases; DCM, Dilated cardiomyopathy; GSEA, Gene-set enrichment analysis.
References
Aryee, M. J., Jaffe, A. E., Corrada-Bravo, H., Ladd-Acosta, C., Feinberg, A. P., Hansen, K. D., et al. (2014). Minfi: A flexible and comprehensive bioconductor package for the analysis of infinium DNA methylation microarrays. Bioinformatics 30, 1363–1369. doi:10.1093/bioinformatics/btu049
Ashburner, M., Ball, C. A., Blake, J. A., Botstein, D., Butler, H., Cherry, J. M., et al. (2000). Gene ontology: tool for the unification of biology. The gene ontology consortium. Nat. Genet. 25, 25–29. doi:10.1038/75556
Ball, M. P., Li, J. B., Gao, Y., Lee, J. H., Leproust, E. M., Park, I. H., et al. (2009). Targeted and genome-scale strategies reveal gene-body methylation signatures in human cells. Nat. Biotechnol. 27, 361–368. doi:10.1038/nbt.1533
Baraldo, M., Nogara, L., Dumitras, G. A., Tchampda Dondjang, A. H., Geremia, A., Scalabrin, M., et al. (2021). Raptor is critical for increasing the mitochondrial proteome and skeletal muscle force during hypertrophy. FASEB J. 35, e22031. doi:10.1096/fj.202101054RR
Bibikova, M., Barnes, B., Tsan, C., Ho, V., Klotzle, B., Le, J. M., et al. (2011). High density DNA methylation array with single CpG site resolution. Genomics 98, 288–295. doi:10.1016/j.ygeno.2011.07.007
Busk, P. K., Bartkova, J., Strom, C. C., Wulf-Andersen, L., Hinrichsen, R., Christoffersen, T. E., et al. (2002). Involvement of cyclin D activity in left ventricle hypertrophy in vivo and in vitro. Cardiovasc Res. 56, 64–75. doi:10.1016/s0008-6363(02)00510-2
Chen, S., Zhang, Y., Lighthouse, J. K., Mickelsen, D. M., Wu, J., Yao, P., et al. (2020). A novel role of cyclic nucleotide phosphodiesterase 10A in pathological cardiac remodeling and dysfunction. Circulation 141, 217–233. doi:10.1161/CIRCULATIONAHA.119.042178
Chen, Y. A., Lemire, M., Choufani, S., Butcher, D. T., Grafodatskaya, D., Zanke, B. W., et al. (2013). Discovery of cross-reactive probes and polymorphic CpGs in the illumina infinium HumanMethylation450 microarray. Epigenetics 8, 203–209. doi:10.4161/epi.23470
Davidson, M. M., Nesti, C., Palenzuela, L., Walker, W. F., Hernandez, E., Protas, L., et al. (2005). Novel cell lines derived from adult human ventricular cardiomyocytes. J. Mol. Cell Cardiol. 39, 133–147. doi:10.1016/j.yjmcc.2005.03.003
Du, P., Zhang, X., Huang, C. C., Jafari, N., Kibbe, W. A., Hou, L., et al. (2010). Comparison of Beta-value and M-value methods for quantifying methylation levels by microarray analysis. BMC Bioinforma. 11, 587. doi:10.1186/1471-2105-11-587
Gholipour, M., and Tabrizi, A. (2020). The role of Hippo signaling pathway in physiological cardiac hypertrophy. Bioimpacts 10, 251–257. doi:10.34172/bi.2020.32
Haas, J., Frese, K. S., Park, Y. J., Keller, A., Vogel, B., Lindroth, A. M., et al. (2013). Alterations in cardiac DNA methylation in human dilated cardiomyopathy. EMBO Mol. Med. 5, 413–429. doi:10.1002/emmm.201201553
Hellman, A., and Chess, A. (2007). Gene body-specific methylation on the active X chromosome. Science 315, 1141–1143. doi:10.1126/science.1136352
Huang Da, W., Sherman, B. T., and Lempicki, R. A. (2009). Systematic and integrative analysis of large gene lists using DAVID bioinformatics resources. Nat. Protoc. 4, 44–57. doi:10.1038/nprot.2008.211
Hudlicka, O., and Brown, M. D. (1996). Postnatal growth of the heart and its blood vessels. J. Vasc. Res. 33, 266–287. doi:10.1159/000159155
Jo, B. S., Koh, I. U., Bae, J. B., Yu, H. Y., Jeon, E. S., Lee, H. Y., et al. (2016). Methylome analysis reveals alterations in DNA methylation in the regulatory regions of left ventricle development genes in human dilated cardiomyopathy. Genomics 108, 84–92. doi:10.1016/j.ygeno.2016.07.001
Kanehisa, M., and Goto, S. (2000). Kegg: kyoto encyclopedia of genes and genomes. Nucleic Acids Res. 28, 27–30. doi:10.1093/nar/28.1.27
Lin, Z., Zhou, P., Von Gise, A., Gu, F., Ma, Q., Chen, J., et al. (2015). Pi3kcb links Hippo-YAP and PI3K-AKT signaling pathways to promote cardiomyocyte proliferation and survival. Circ. Res. 116, 35–45. doi:10.1161/CIRCRESAHA.115.304457
Liu, C. F., and Tang, W. H. W. (2019). Epigenetics in cardiac hypertrophy and heart failure. JACC Basic Transl. Sci. 4, 976–993. doi:10.1016/j.jacbts.2019.05.011
Maksimovic, J., Gordon, L., and Oshlack, A. (2012). Swan: subset-quantile within array normalization for illumina infinium HumanMethylation450 BeadChips. Genome Biol. 13, R44. doi:10.1186/gb-2012-13-6-r44
Meder, B., Haas, J., Sedaghat-Hamedani, F., Kayvanpour, E., Frese, K., Lai, A., et al. (2017). Epigenome-wide association study identifies cardiac gene patterning and a novel class of biomarkers for heart failure. Circulation 136, 1528–1544. doi:10.1161/CIRCULATIONAHA.117.027355
Moore, L. D., Le, T., and Fan, G. (2013). DNA methylation and its basic function. Neuropsychopharmacology 38, 23–38. doi:10.1038/npp.2012.112
Neri Serneri, G. G., Boddi, M., Modesti, P. A., Cecioni, I., Coppo, M., Padeletti, L., et al. (2001). Increased cardiac sympathetic activity and insulin-like growth factor-I formation are associated with physiological hypertrophy in athletes. Circ. Res. 89, 977–982. doi:10.1161/hh2301.100982
Oh, H., Fujio, Y., Kunisada, K., Hirota, H., Matsui, H., Kishimoto, T., et al. (1998). Activation of phosphatidylinositol 3-kinase through glycoprotein 130 induces protein kinase B and p70 S6 kinase phosphorylation in cardiac myocytes. J. Biol. Chem. 273, 9703–9710. doi:10.1074/jbc.273.16.9703
Ortega, A., Tarazon, E., Gil-Cayuela, C., Martinez-Dolz, L., Lago, F., Gonzalez-Juanatey, J. R., et al. (2018). ASB1 differential methylation in ischaemic cardiomyopathy: relationship with left ventricular performance in end-stage heart failure patients. Esc. Heart Fail 5, 732–737. doi:10.1002/ehf2.12289
Pepin, M. E., Ha, C. M., Crossman, D. K., Litovsky, S. H., Varambally, S., Barchue, J. P., et al. (2019). Genome-wide DNA methylation encodes cardiac transcriptional reprogramming in human ischemic heart failure. Lab. Invest. 99, 371–386. doi:10.1038/s41374-018-0104-x
Pidsley, R., Zotenko, E., Peters, T. J., Lawrence, M. G., Risbridger, G. P., Molloy, P., et al. (2016). Critical evaluation of the Illumina MethylationEPIC BeadChip microarray for whole-genome DNA methylation profiling. Genome Biol. 17, 208. doi:10.1186/s13059-016-1066-1
Richey, P. A., and Brown, S. P. (1998). Pathological versus physiological left ventricular hypertrophy: A review. J. Sports Sci. 16, 129–141. doi:10.1080/026404198366849
Ren, X., and Kuan, P. F. (2019). methylGSA: a Bioconductor package and Shiny app for DNA methylation data length bias adjustment in gene set testing. Bioinformatics 35, 1958–1959. doi:10.1093/bioinformatics/bty892
Ritchie, M. E., Phipson, B., Wu, D., Hu, Y., Law, C. W., Shi, W., et al. (2015). Limma powers differential expression analyses for RNA-sequencing and microarray studies. Nucleic Acids Res. 43, e47. doi:10.1093/nar/gkv007
Rose, N. R., and Klose, R. J. (2014). Understanding the relationship between DNA methylation and histone lysine methylation. Biochim. Biophys. Acta 1839, 1362–1372. doi:10.1016/j.bbagrm.2014.02.007
Shende, P., Plaisance, I., Morandi, C., Pellieux, C., Berthonneche, C., Zorzato, F., et al. (2011). Cardiac raptor ablation impairs adaptive hypertrophy, alters metabolic gene expression, and causes heart failure in mice. Circulation 123, 1073–1082. doi:10.1161/CIRCULATIONAHA.110.977066
Shi, H., Ossip, D. J., Mayo, N. L., Lopez, D. A., Block, R. C., Post, W. S., et al. (2021). Role of DNA methylation on the association between physical activity and cardiovascular diseases: results from the longitudinal multi-ethnic study of atherosclerosis (MESA) cohort. BMC Genomics 22, 790. doi:10.1186/s12864-021-08108-w
Shimizu, I., and Minamino, T. (2016). Physiological and pathological cardiac hypertrophy. J. Mol. Cell Cardiol. 97, 245–262. doi:10.1016/j.yjmcc.2016.06.001
Tamamori, M., Ito, H., Hiroe, M., Terada, Y., Marumo, F., and Ikeda, M. A. (1998). Essential roles for G1 cyclin-dependent kinase activity in development of cardiomyocyte hypertrophy. Am. J. Physiol. 275, H2036–H2040. doi:10.1152/ajpheart.1998.275.6.H2036
Titus, A. J., Gallimore, R. M., Salas, L. A., and Christensen, B. C. (2017). Cell-type deconvolution from DNA methylation: A review of recent applications. Hum. Mol. Genet. 26, R216–R224. doi:10.1093/hmg/ddx275
Walsh, K. (2006). Akt signaling and growth of the heart. Circulation 113, 2032–2034. doi:10.1161/CIRCULATIONAHA.106.615138
Watkins, S. J., Borthwick, G. M., Oakenfull, R., Robson, A., and Arthur, H. M. (2012). Angiotensin II-induced cardiomyocyte hypertrophy in vitro is TAK1-dependent and Smad2/3-independent. Hypertens. Res. 35, 393–398. doi:10.1038/hr.2011.196
Weeks, K. L., and Mcmullen, J. R. (2011). The athlete's heart vs. the failing heart: can signaling explain the two distinct outcomes? Physiol. (Bethesda) 26, 97–105. doi:10.1152/physiol.00043.2010
Wilhelm-Benartzi, C. S., Koestler, D. C., Karagas, M. R., Flanagan, J. M., Christensen, B. C., Kelsey, K. T., et al. (2013). Review of processing and analysis methods for DNA methylation array data. Br. J. Cancer 109, 1394–1402. doi:10.1038/bjc.2013.496
Windmueller, R., and Morrisey, E. E. (2015). Hippo and cardiac hypertrophy: A complex interaction. Circ. Res. 117, 832–834. doi:10.1161/CIRCRESAHA.115.307546
Xu, L., and Brink, M. (2016). mTOR, cardiomyocytes and inflammation in cardiac hypertrophy. Biochim. Biophys. Acta 1863, 1894–1903. doi:10.1016/j.bbamcr.2016.01.003
Yang, Y., Del Re, D. P., Nakano, N., Sciarretta, S., Zhai, P., Park, J., et al. (2015). miR-206 mediates YAP-induced cardiac hypertrophy and survival. Circ. Res. 117, 891–904. doi:10.1161/CIRCRESAHA.115.306624
Yuan, W., Tang, C., Zhu, W., Zhu, J., Lin, Q., Fu, Y., et al. (2016). CDK6 mediates the effect of attenuation of miR-1 on provoking cardiomyocyte hypertrophy. Mol. Cell Biochem. 412, 289–296. doi:10.1007/s11010-015-2635-4
Zhou, P., and Pu, W. T. (2016). Recounting cardiac cellular composition. Circ. Res. 118, 368–370. doi:10.1161/CIRCRESAHA.116.308139
Keywords: cardiac hypertrophy, DNA methylation, PI3K-Akt, Hippo, signaling, CDK6, RPTOR
Citation: Shi H, Chen S, Meng FW, Ossip DJ, Yan C and Li D (2023) Epigenome-wide DNA methylation profiling in comparison between pathological and physiological hypertrophy of human cardiomyocytes. Front. Genet. 14:1264382. doi: 10.3389/fgene.2023.1264382
Received: 20 July 2023; Accepted: 11 September 2023;
Published: 27 September 2023.
Edited by:
Liming Yu, The University of Texas Health Science Center at San Antonio, United StatesReviewed by:
Christoph D. Rau, University of North Carolina at Chapel Hill, United StatesYiran Guo, Duke University, United States
Copyright © 2023 Shi, Chen, Meng, Ossip, Yan and Li. This is an open-access article distributed under the terms of the Creative Commons Attribution License (CC BY). The use, distribution or reproduction in other forums is permitted, provided the original author(s) and the copyright owner(s) are credited and that the original publication in this journal is cited, in accordance with accepted academic practice. No use, distribution or reproduction is permitted which does not comply with these terms.
*Correspondence: Dongmei Li, ZG9uZ21laV9saUB1cm1jLnJvY2hlc3Rlci5lZHU=; Chen Yan, Y2hlbl95YW5AdXJtYy5yb2NoZXN0ZXIuZWR1