 Mitsuhiro Odaka
 Morgan Magnin2,3
 Katsumi Inoue
- 1 The Graduate University for Advanced Studies, SOKENDAI, Tokyo, Japan
- 2 Principles of Informatics Research Division, National Institute of Informatics, Tokyo, Japan
- 3 Laboratoire des Sciences du Numérique de Nantes, École Centrale de Nantes, Nantes Université, UMR 6004, Nantes, France
- 4 Japan Society for the Promotion of Science, Tokyo, Japan
Introduction: Intercellular adhesion molecule 1 (ICAM-1) is a critical molecule responsible for interactions between cells. Previous studies have suggested that ICAM-1 triggers cell-to-cell transmission of HIV-1 or HTLV-1, that SARS-CoV-2 shares several features with these viruses via interactions between cells, and that SARS-CoV-2 cell-to-cell transmission is associated with COVID-19 severity. From these previous arguments, it is assumed that ICAM-1 can be related to SARS-CoV-2 cell-to-cell transmission in COVID-19 patients. Indeed, the time-dependent change of the ICAM-1 expression level has been detected in COVID-19 patients. However, signaling pathways that consist of ICAM-1 and other molecules interacting with ICAM-1 are not identified in COVID-19. For example, the current COVID-19 Disease Map has no entry for those pathways. Therefore, discovering unknown ICAM1-associated pathways will be indispensable for clarifying the mechanism of COVID-19.
Materials and methods: This study builds ICAM1-associated pathways by gene network inference from single-cell omics data and multiple knowledge bases. First, single-cell omics data analysis extracts coexpressed genes with significant differences in expression levels with spurious correlations removed. Second, knowledge bases validate the models. Finally, mapping the models onto existing pathways identifies new ICAM1-associated pathways.
Results: Comparison of the obtained pathways between different cell types and time points reproduces the known pathways and indicates the following two unknown pathways: (1) upstream pathway that includes proteins in the non-canonical NF-κB pathway and (2) downstream pathway that contains integrins and cytoskeleton or motor proteins for cell transformation.
Discussion: In this way, data-driven and knowledge-based approaches are integrated into gene network inference for ICAM1-associated pathway construction. The results can contribute to repairing and completing the COVID-19 Disease Map, thereby improving our understanding of the mechanism of COVID-19.
1 Introduction
Elucidating the underlying mechanisms of coronavirus disease 2019 (COVID-19) still remains a global issue. Uncovering the mechanism requires fully understanding the COVID-19-specific interactome, a complex network of interactions among different components. In previous studies on COVID-19, attempts to provide insights into interactions within cells have been made. In contrast, interactions between cells have not been closely examined.
One noteworthy molecule responsible for the interactions between cells is intercellular adhesion molecule 1 (ICAM-1; also known as CD54), encoded by ICAM1. ICAM-1 is a transmembrane glycoprotein expressed on leukocytes, vascular endothelial cells, and respiratory epithelial cells. Its differential expression is critical for proinflammatory immune responses and viral infection. Additionally, ICAM-1 enables interactions between cells by controlling leukocyte migration, homing, and adhesion from outside to inside the cell (outside-in) and regulation from inside to outside the cell (inside-out) (Luo et al., 2007). These functionalities make ICAM-1 an attractive drug target and a clinically essential molecule (Wilson et al., 1993). Another premise regarding ICAM-1 as an essential molecule in this study is grounded by a hypothesis on the interaction between cells, called cell-to-cell transmission. Cell-to-cell transmission is a direct viral transfer from one cell to another cell (Igakura et al., 2003). The previous model-driven study suggested that compared to the other viral transfer manner called cell-free transmission, cell-to-cell transmission would be more associated with COVID-19 severity (Odaka and Inoue, 2021). In fact, cell-to-cell transmission is observed in in vitro experiments involving COVID-19’s pathogen, severe acute respiratory syndrome coronavirus 2 (SARS-CoV-2) (Zeng et al., 2021). Moreover, cell-to-cell transmission is observed in other retroviruses, such as human immunodeficiency virus type 1 (HIV-1) and human T-cell leukemia virus type 1 (HTLV-1), whose functionalization is similar to that of SARS-CoV-2 (Walls et al., 2020). Specifically, both these retroviruses and SARS-CoV-2 have a structurally homologous spike glycoprotein on the surface of the viral envelope that binds to a surface protein on the recipient cell during cell adhesion (Weissenhorn et al., 1999). In HIV-1 or HTLV-1, the cell-to-cell transmission occurs after ICAM-1 triggers the peculiar pathways for cell adhesion (Bracq et al., 2018) and induces the formation of the microtubule-organizing center (MTOC) and virological synapse (VS) (Nejmeddine et al., 2009). The aforementioned arguments provide a rationale for focusing on ICAM-1 in this study and for hypothesizing the in vivo existence of ICAM-1 and the interactions between cells featured with ICAM-1 involved in cell-to-cell transmission in COVID-19.
Indeed, there have been different in vitro experimental results on the expression level of ICAM-1 in SARS-CoV-2-infected cells. One study shows the time-dependent ICAM-1 expression level changes in COVID-19 patients (Smith-Norowitz et al., 2021). Another study also shows that the ICAM-1 level increases in the severe phase and decreases in the convalescent phase of COVID-19 (Tong et al., 2020). Another study shows the opposite result on the decrease of ICAM-1 after immune cell infiltration in COVID-19 while leaving room for controversy regarding the reasons for downregulation (Won et al., 2022).
Nevertheless, the interactions arising from ICAM-1 are not explicitly recognized as indispensable in the case of COVID-19. In particular, there is little insight into the signaling pathways surrounding ICAM-1, that is, the upstream and downstream signaling cascades that occur upon the functional activation of ICAM-1 and its specific signaling molecules interacting with ICAM-1 (i.e., ICAM1-associated pathways for short). Consequently, it is significant to uncover the ICAM1-associated pathways to better understand the interactions between cells in the context of COVID-19.
Another substantial consequence of revealing ICAM1-associated pathways contributes to completing the COVID-19 Disease Map. The COVID-19 Disease Map is a graphical knowledge repository based on pathway enrichment analysis or manual curation from external knowledge bases, such as the Kyoto Encyclopedia of Genes and Genomes (KEGG) pathways (Ostaszewski et al., 2019). The COVID-19 Disease Map increases the pathway volume; however, it is indicated that the map lacks genes without pathway annotations (Reimand et al., 2019). Moreover, the initial version of the COVID-19 Disease Map was built on the fly (Ostaszewski et al., 2020), so it has inherently been incomplete and in progress. As for ICAM-1, the pathways and even ICAM-1 are absent in the current COVID-19 Disease Map (Ostaszewski et al., 2021). Thus, this study regards it challenging to find unknown ICAM1-associated pathways, expecting these pathways to include the molecules driving cell-to-cell transmission.
Given the aforementioned observations, this study constructs the ICAM1-associated pathways based on gene networks. For inferring gene networks, we harness data and domain knowledge by extracting relationships between gene pairs from data while rectifying them with multiple knowledge bases. Such integration of data-driven and knowledge-based approaches allows us to avoid biologically meaningless interpretations based only on data characteristics. Identifying the unknown pathways with biologically meaningful interpretation will lead to a deeper understanding of the mechanisms of COVID-19.
2 Materials and methods
2.1 Overview
Figure 1 illustrates the framework of this study. This framework constructs the disease-specific pathways from single-cell omics data and domain knowledge via gene network inference. The framework consists of the following five steps:
1. Single-cell omics data analysis
2. Undirected graphical model construction
3. Model corroboration and validation
4. Gene-to-protein conversion
5. Pathway mapping and unification
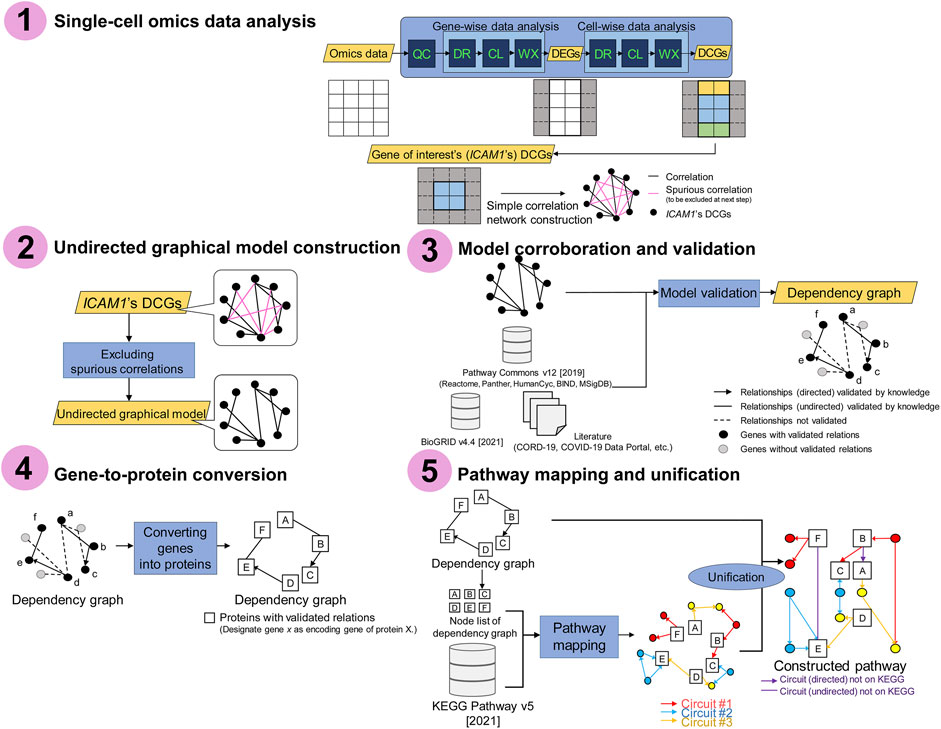
FIGURE 1. Schematic representation of the framework. Step 1: single-cell omics data analysis. Step 2: undirected graphical model construction. Step 3: model corroboration and validation. Step 4: gene-to-protein conversion. Step 5: pathway mapping and unification. The circuits are subpathways transmitting a signal from input receptor nodes to output effector nodes, where the nodes mostly represent proteins such as metabolic enzymes. QC: quality control; DR: dimensionality reduction; CL: clustering; WX: Wilcoxon rank-sum test; DEGs: differentially expressed genes; DCGs: differentially coexpressed genes. See also DOI: 10.6084/m9.figshare.18095717.
Steps 1 and 2 are dedicated to gene network inference purely from data, and Step 3 validates the data-driven gene network with domain knowledge. In this study, we call the rectification of data-driven objects with knowledge a data-driven and knowledge-based (DD-KB) approach. Step 1 involves obtaining the COVID-19-specific differentially expressed genes (DEGs) and a network of differentially coexpressed genes (DCGs) via single-cell omics data analysis. Here, DEGs are the genes whose expression levels differ significantly in COVID-19-positive patients and -negative controls, and DCGs are coexpressed DEGs. Step 2 removes spurious edges from the correlation networks, thereby building de novo undirected graphical models. In corroboration (Step 3), undirected graphical models are edited as dependency graphs with validated relationships.
Steps 4 and 5 are pathway construction steps. In Step 4, a functional annotation tool is used to convert genes into encoded proteins. Pathway mapping and unification (Step 5) refine the results as the final outputs, the ICAM1-associated pathways. Through the framework, single-cell omics data and multiple knowledge bases are integrated, which allows the inference of gene networks containing the components absent from the current COVID-19 Disease Map.
2.2 Gene network inference and pathway construction
In this subsection, explanations for each step of the framework are provided.
2.2.1 Step 1: Single-cell omics data analysis
Single-cell omics data analysis adopts a combination of the standard methods defined as three subroutines, i.e., dimensionality reduction, clustering, and Wilcoxon rank-sum test, for each gene pair and each cell pair (Li et al., 2017). This step can extract COVID-19-specific DEGs and ICAM1-associated DCGs from the omics data.
2.2.1.1 Dimensionality reduction
Dimensionality reduction is executed after the imputation of zeros representing either technically missing data or biologically absent genes within a matrix of single-cell omics data (Hicks et al., 2018). To reduce dimensionality, we employ two methods: principal component analysis (PCA) and uniform manifold approximation and projection (UMAP). These methods detect possible batch effects and embed the matrix in the latent space. By computing 50 PCA coordinates on the sparse matrix for mean centering (Pedregosa et al., 2011), eigenvalues, and eigenvectors with the singular value decomposition solver ARPACK (ARnoldi PACKage) (Lehoucq et al., 1998), PCA reduces the dimension to 100 by a Gaussian kernel. Given the 50 decomposed coordinates, the connectivities (weighted adjacency matrix) of the k-nearest neighborhood graph are computed and thresholded at the closest neighbors defined for data points of the manifold in Euclidean space. Following PCA, UMAP (McInnes and Healy, 2018) projects the data points onto the two-dimensional latent space.
2.2.1.2 Clustering
Afterward, clustering is enforced to classify data points in the latent space into subgroups by similarity measurements and filtering out the genes unassociated with the gene of interest. The Louvain algorithm, a greedy optimization of local modularity to detect the groups (Blondel et al., 2008), is applied for clustering. Clustering allows obtaining the data points of subgroups with similar gene expression profiles.
2.2.1.3 Wilcoxon rank-sum test
The Wilcoxon rank-sum test is conducted to sort the data points and select the top 200 data points within a cluster. This test compares the signal values between each subgroup and the combination of the other subgroups using the Benjamini–Hochberg method for adjusting the false discovery rate and correcting the p-value (Benjamini and Hochberg, 1995). The comparison allows us to detect significant differences in expression levels between COVID-19-positive and COVID-19-negative patients and rank the genes characteristic of each subgroup.
The aforementioned analysis, including dimensionality reduction, clustering, and Wilcoxon rank-sum test, is conducted for each gene pair and each cell pair. Genewise analysis filters the DEGs to distinguish those whose gene expression levels are correlated. Here, given that functionally related genes are coexpressed in the same clusters, the identified gene clusters can be considered to include the genes with significant differences in expression levels from the negative control, and the genes within the same cluster share a common differential expression pattern (Eisen et al., 1999). Likewise, cellwise analysis filters the DCGs to classify all the cells into cell clusters based on the correlation coefficients as similarity measurements for embedding, which means that the genes within the same cell cluster are more strongly correlated with each other than with the genes in other clusters. Constraining the DCGs with the gene of interest, ICAM1, provides a subset of DCGs correlated with ICAM1.
2.2.2 Step 2: Undirected graphical model construction
Next, we infer gene networks from ICAM1’s DCGs obtained by the single-cell omics data analysis. The gene networks are inferred as undirected graphical models with a partial correlation method, displaying de novo-produced direct linear associations (de la Fuente et al., 2004). Considering that correlated gene pairs are coexpressed with similar functions, designating any gene pair as nodes and the correlation coefficient of gene expression levels as edges forms the simple correlation networks of ICAM1’s DCGs. Calculating the second-order partial correlation coefficients between all gene pairs and removing the edges of the gene pairs with zero partial correlation coefficients for any combination yield undirected graphical models without spurious correlations (Zuo et al., 2014).
The equations for the zero-order, first-order, and second-order partial correlations are shown in Eqs 1, 2, 3, respectively.
The random variables denoted by x, y, z, and q represent the gene names. r
xy
is Pearson’s correlation coefficient between the gene expression-level vector running over all the cells of any gene x and that of any gene y. The simple correlation network starts by connecting x and y if and only if r
xy
≠ 0. Undirected graphical modeling removes the linear effect of all the second-order partial correlation coefficients r
xy,zq
between two variables (x, y) conditional on all other variables. The edge is weighted as
2.2.3 Step 3: Model corroboration and validation
Until the previous data analysis, gene networks consisting of the ICAM1 gene of interest are inferred without guaranteeing the validity of each edge. Namely, possible errors within data, such as noise, could result in nodes or edges with no biological meaning. Hence, the models require corroboration and validation with heuristics based on domain knowledge. To corroborate and validate each relationship of gene networks, we query multiple knowledge bases, including Pathway Commons Web Service 12 (Rodchenkov et al., 2020), BioGRID REST Web Service (Stark et al., 2006), and STRING version 11.5 (Szklarczyk et al., 2019). Pathway Commons’ application programming interface (API) provides access to the significant pathway databases Reactome, PANTHER, HumanCyc, BIND, and MSigDB. BioGRID is used as a complementary source of the latest knowledge since Pathway Commons is not up-to-date (Wadi et al., 2016). HumanCyc is used because it has richer information on biochemical reactions and regulatory relationships than the KEGG pathways alone (Altman et al., 2013) and enables the obtained model to include more information than a subset of the KEGG pathways. STRING is used for annotations of functional or physical interactions between the queried proteins. Fetching relations between gene pairs in the simple interaction format (SIF) through these knowledge bases enables us to convert a subset of undirected edges to directed edges, thereby editing undirected graphical models as dependency graphs.
The subsequent two steps are dedicated to the pathway construction by overlaying the inferred DD-KB gene networks onto the KEGG pathways.
2.2.4 Step 4: Gene-to-protein conversion
There exists a gap between the gene network and the KEGG pathways because the nodes of the DD-KB gene networks are DCGs (genes), while the nodes of the KEGG pathways are primarily proteins. Therefore, this gap needs to be filled before overlaying the DD-KB gene networks onto the KEGG pathways. The DAVID functional annotation tool 6.8 (Huang et al., 2009b; Huang et al., 2009a) allows us to fill the gap by converting gene symbols into Entrez IDs. We apply the DAVID tools to the node lists of the DD-KB gene networks to give the corresponding protein attributes for each DCG.
2.2.5 Step 5: Pathway mapping and unification
In order to examine what types of pathways are activated, we conduct pathway enrichment analysis by mapping the protein node lists and edge lists of the DD-KB gene networks onto the KEGG pathways. In particular, the DD-KB gene networks and the KEGG pathways in the KEGG Markup Language (KGML) format are unified using Cytoscape 3.9.0 (Shannon et al., 2003), resulting in the final COVID-19-specific ICAM1-associated pathways, visualized in yFiles Hierarchical Layout.
2.3 Application
We applied the aforementioned framework to the two COVID-19 datasets for comparing the ICAM1-associated pathways between different locations where ICAM1 is expressed (case study 1) and between different time points starting from hospitalization (case study 2).
2.3.1 Case study 1: Comparison of ICAM1-associated pathways between different cell types
Inputting the search term [(COVID-19 OR SARS-CoV-2) AND gse(entry type)] AND “Homo sapiens” AND h5ad to the National Center for Biotechnology Information (NCBI) Gene Expression Omnibus (GEO) dataset (Barrett et al., 2013) provided the data. In case study 1, the data included the gene expression profiles of bronchoalveolar lavage fluid samples isolated from 10 patients with severe COVID-19 and two negative controls via high-throughput single-cell RNA sequencing (Grant et al., 2021). Especially, we used the data of messenger ribonucleic acid (mRNA) expression levels from four antigen-presenting cell types in which virus particles were detectable. The single-cell omics data analysis in the original paper had already annotated the cell types, cell subpopulation partitioning the cell heterogeneity into non-overlapping classes, for clusters according to the reference biomarkers present in the cluster (Duò et al., 2018). The cell types included infected alveolar type 1 and 2 cells (infected AT1 and AT2), migratory dendritic cells (migratory DCs), tissue-resident alveolar macrophage type 2 (TRAM2), and monocyte-derived alveolar macrophage type 2 (MoAM2), as well as the summation of these four cell types at the level of full single-cell resolution (Figure 2).
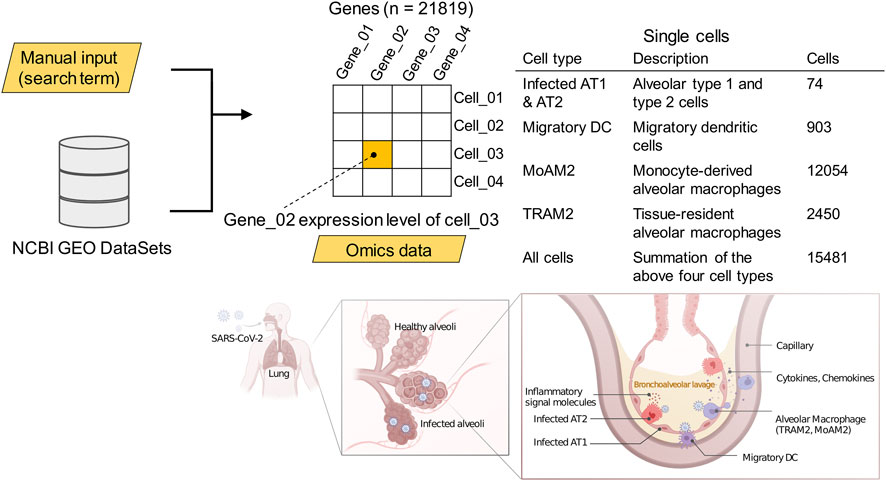
FIGURE 2. The cell types for which data were collected. Pulmonary tissue illustrations: created with BioRender.com. See also DOI: 10.6084/m9.figshare.18095714.
2.3.2 Case study 2: Comparison of ICAM1-associated pathways between different time points
Likewise, GSE180578, another transcriptome omics dataset, was (Cillo et al., 2021) fetched from the NCBI GEO dataset. The omics data contained 86 samples obtained by single-cell RNA sequencing, including peripheral blood from COVID-19 patients or negative control at the intensive care unit (ICU) of the University of Pittsburgh Medical Center. These samples included three time points (days 1, 5, and 10 post-enrollment in the ICU). The cell counts and gene counts were (34970, 2000), (23616, 2000), and (32105, 2000).
2.3.3 Additional case studies
Not limited to ICAM1, our framework would be reusable in another context for mixing quantitative data and domain knowledge into building models capturing pathways. To allege the generality of the framework, in case study 2, we also applied the framework to other genes related to the interaction between cells, including ACTB and C15orf48. Here, in this main manuscript, we focus only on providing the results of ICAM1-associated pathways considering the purpose of this study. The results of other genes can be referred to in the Supplementary Material.
2.4 Quality control
Before proceeding to the further steps, the single-cell omics data underwent quality control. Quality control included filtering, scaling, and normalization by Scanpy version 1.8.2 (Wolf et al., 2018). Given the cell quality, we regarded the cells with overexpressed mitochondrial RNA per data count tagged by a unique molecular identifier (UMI) (Kivioja et al., 2012) as dead or broken cells. Similarly, cells with many genes per data count tagged by UMI were identified as doublets. Subsequently, the genes detected in fewer than three cells were filtered out to ensure gene quality. The count data were scaled with regression on total UMI counts and normalization per feature based on standard deviation. Normalization of the gene expression data was adjusted for the RNA composition bias and allowed a comparison of the values among the cells. Finally, log-transformation prepared the data for calculating the log-fold changes reflecting the gene expression difference.
The framework was applied concerning the two datasets. The machine configuration was as follows: Python 3.7, GPU Tesla V100-SXM2-16GB, and 51.01 GB of RAM.
3 Results
3.1 Case study 1: ICAM1-associated pathways at different locations (cell types)
3.1.1 Quality control
The data initially contained 77,650 cells × 24,714 genes. Removing the cells with a high proportion of mitochondrial RNA resulted in 15,220 cells. After filtering, the whole dataset contained 68,734 cells × 24,001 genes. Among this dataset, we used the data of four cell types, 21,819 genes in the SARS-CoV-2-infected 15,481 cells (cells with SARS-CoV-2 transcripts detected). The doublet discrimination provided 14,723 cells. The filtering processes excluded 8,916 cells with more than 5,000 expressed genes, 700 genes detected in fewer than three cells, mitochondrially encoded genes, and cells with a low percentage
3.1.2 Single-cell omics data analysis
The genewise analysis extracted the 18 gene clusters with differential expression patterns specific to COVID-19. Excluding the duplicated genes extracted 1,434 DEGs in 9,050 single cells. The results of genewise clustering, heatmap of DEGs, and rank-sum test are shown in Supplementary Figures S1–S3, respectively. The cellwise analysis yielded 11 clusters based on the correlations between gene pairs in the embedded space and distinguished the DEGs whose gene expression levels were correlated. One of the 11 clusters included ICAM1, and this cluster was made of 178 ICAM1’s DCGs. The results of cellwise clustering, heatmap of DCGs, and rank-sum test are shown in Supplementary Figures S4–S6, respectively. The entire list of DEGs and DCGs can be found in Supplementary Tables S1, S2, respectively. Supplementary Table S1 is a hash table of DEGs, including the cluster number, gene name string, log fold change, and p-values, while Supplementary Table S2 is a hash table of DCGs, including gene expression levels for each single cell. The p-values of ICAM1 expression variation and the computation times (sec.) for each cell type are as follows: p = 0.250, time = 51.6 (infected AT1 and AT2); p = 2.50E-4, time = 26.1 (migratory DC); p = 2.57E-12, time = 46.6 (TRAM2); p = 7.55E-2, time = 109.0 (MoAM2); and p = 0.241, time = 178.9 (summation).
3.1.3 Undirected graphical model construction
Removal of spurious correlations yielded undirected graphical models (Table 1). The finally obtained undirected graphical models are shown in Supplementary Figure S7.
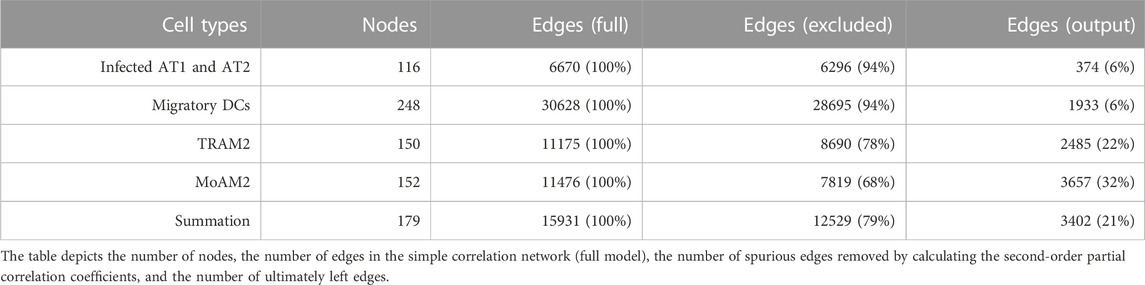
TABLE 1. Spurious correlation removal in case study 1.
3.1.4 Model corroboration and validation
Dependency graphs are shown in Supplementary Figure S8. The entire list of relationships of dependency graphs with knowledge bases used for model validation can be found in Supplementary Table S3.
3.1.5 Gene-to-protein conversion
The nodes in the dependency graphs were annotated with protein names, which helped us map the nodes onto the KEGG pathways in the next step.
3.1.6 Pathway mapping and unification
Pathway mapping discovered which subpathways within existing signaling pathways reflect the activity of a group of varying genes and coexpressed in a disease-specific manner in the observed gene expression data. Table 2 shows the typical pathways selected from the mapping results. A complete list of mapping results is shown in Supplementary Figure S9.
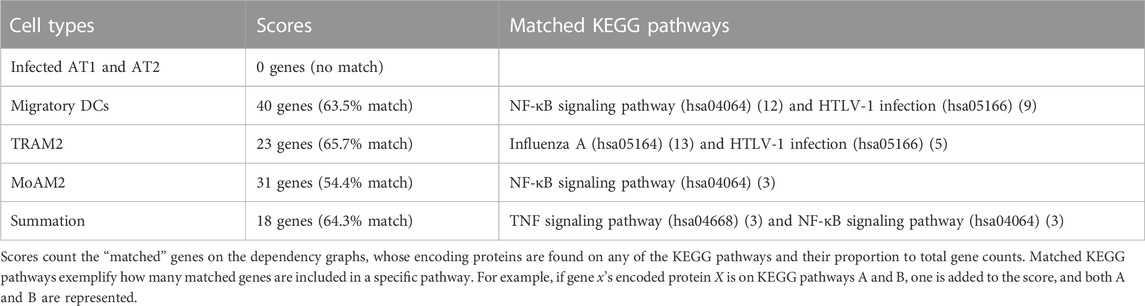
TABLE 2. Mapping results of the dependency graphs for each cell type onto the KEGG pathways.
The final COVID-19-specific ICAM1-associated pathways for each cell type are shown in Figure 3. Although pathway mapping was performed by converting gene symbols to protein IDs before mapping, the nodes of pathways in the figure are assigned only gene symbol names for space limitation. For the ICAM1-associated pathway for infected AT1 and AT2 (Figure 3A), there are no hits among the KEGG pathways, which is attributed to only one pair of validated ICAM1-associated DCGs that remained.
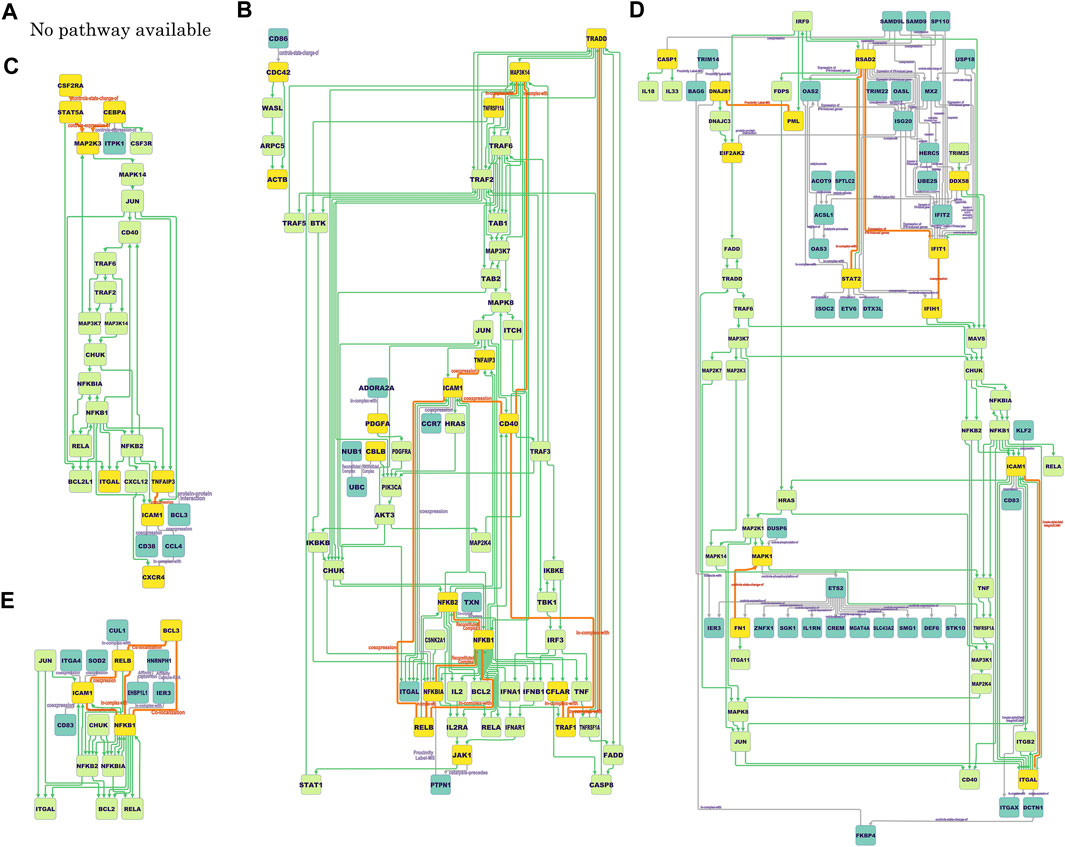
FIGURE 3. ICAM1-associated pathways at different locations (cell types). (A): No pathway available (infected alveolar type 1 and 2 cells); (B): NF-κB/non-canonical NF-κB/integrin pathway putative (migratory dendritic cells); (C): NF-κB/integrin pathway putative (tissue-resident alveolar macrophages); (D): NF-κB/integrin pathway putative (monocyte-derived alveolar macrophages); (E): TNF/NF-κB/non-canonical NF-κB/integrin pathway putative (summation). The rectangular nodes colored blue, yellow, and lime green reflect the proteins only on the dependency graphs, the proteins common to both the dependency graphs and the KEGG pathways, and the proteins only on the KEGG pathways, respectively. Gray lines are the directed or undirected edges only on the dependency graphs. Orange lines represent the directed or undirected edges between yellow nodes on the dependency graphs. Green lines are the directed edges only on the KEGG pathways. Orange edges do not have direction if the KEGG pathways indirectly connect its yellow node pair. See also DOI: 10.6084/m9.figshare.17261540.
The characteristics common to the obtained pathways and the characteristics of those pathways for each cell type are as follows: one common feature of the pathways for all other cell types except Figure 3A is the presence of some integrins, such as ITGAL (gene encoding CD11a; also known as LFA1A) (Figures 3B–E), ITGAX (gene encoding CD11c) (Figure 3D), ITGB2 (gene encoding CD18) (Figure 3D), and ITGA4 (gene encoding CD49d) (Figure 3E). Some integrins are downstream, such as ACTB (gene encoding β-actin) in the pathway for migratory DCs (Figure 3B) and DCTN1 (gene encoding dynactin subunit 1) in the pathway for MoAM2 (Figure 3D). Integrins are molecules interacting with ICAM-1 to stabilize cell adhesion. Especially, dynactin recruits and tethers dynein to microtubules.
Another common feature of the pathways for all other cell types except Figure 3A is the presence of the molecules responsible for NF-κB pathways, such as NFKB1 (gene encoding NF-κB p105 subunit 1), NFKB2 (gene encoding NF-κB p105 subunit 2), RELA (gene encoding NF-κB p65 subunit), JUN (Jun proto-oncogene; also known as AP-1 transcription factor subunit), and CHUK (gene encoding inhibitor of nuclear factor κ-B kinase subunit α; also known as IKK-α) (Figures 3B–E). These molecules are not DCGs but nodes in the KEGG pathway, but they are located upstream of ICAM1 and flanked by DCGs.
As the specific features of some pathways, the pathway for migratory DCs (Figure 3B) and summation (Figure 3E) includes RELB (gene encoding transcription factor RelB). In general, NFKB2 and RELB lie in the non-canonical NF-κB pathway, which is an upstream pathway of ICAM1 (Liu et al., 2019). The pathway for migratory DCs (Figure 3B) also includes TNFRSF11A (gene encoding receptor activator of NF-κB; also known as RANK) and MAP3K14 (gene encoding NF-κB-inducing kinase; also known as NIK). These molecules are known as triggers of the non-canonical NF-κB pathway (Malinin et al., 1997).
The pathway for summation (Figure 3E) has some commonalities with other pathways, such as integrins and molecules related to the NF-κB pathway, but it also has some differences. SOD2 (gene encoding superoxide dismutase 2), for example, is a gene that is not found in the other pathways and could not be found without taking summation. SOD2 is known as a gene whose expression variation has been confirmed accompanied with ICAM1 in COVID-19 (Zheng et al., 2021).
3.2 Case study 2: ICAM1-associated pathways at different time points
Like case study 1, the original dataset underwent single-cell omics data analysis, and ICAM1 and its DCGs were extracted. The p-values of ICAM1 expression variation and the computation times (sec.) for each time point were as follows: p = 1.50E-05, time = 77.9 (day 1); p = 3.09E-2, time = 55.4 (day 5); and p = 3.04E-06, time = 56.3 (day 10). This manuscript does not explain the other detailed results of the single-cell omics data analysis because the procedures were the same as that in case study 1. These other results can be found at 10.6084/m9.figshare.23590755. As for the remaining steps, we explain the results of spurious correlation removal and pathway construction.
3.2.1 Undirected graphical model construction
Table 3 depicts how spurious correlated edges were removed for each of the three time points. Of the number of edges in the simple correlation network (full model), more than 84% of the edges were deleted by calculating the second-order partial correlation coefficients.
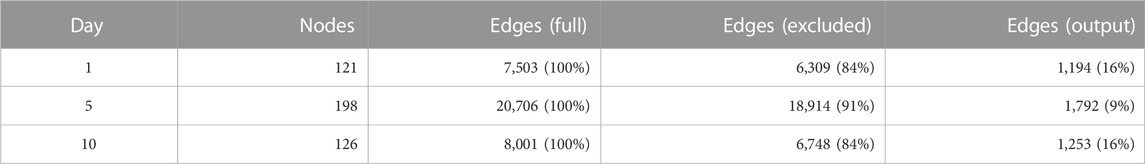
TABLE 3. Spurious correlation removal in case study 2.
3.2.2 Pathway mapping and unification
The pathways resulting from combining the KEGG pathways with the partial correlation networks of ICAM1-associated DCGs extracted from the omics data are shown in Figure 4.
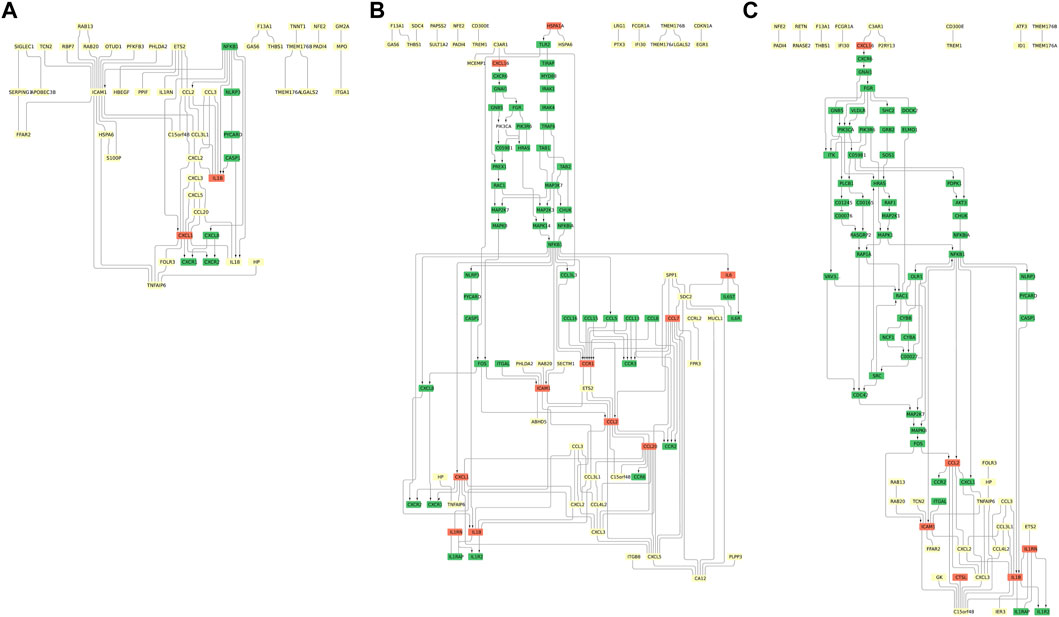
FIGURE 4. ICAM1-associated pathways at different time points. (A) NF-κB/MAPK pathway putative (day 1). (B) NF-κB/MAPK pathway putative (day 5). (C) NF-κB/MAPK pathway putative (day 10). The light yellow, green, and orange nodes represent data-driven DCGs, the genes listed only in the KEGG pathways, and the genes derived from both data and the KEGG pathways, respectively. The directed edges are the edges whose directions are given in the KEGG pathways. See this figure for a larger view in figshare: 10.6084/m9.figshare.23576226.
The common characteristics and the unique attributes of the found pathways for each time point are as follows: one common feature is the presence of molecules responsible for the immune response included across the three time points. The immunoreactive molecules include the chemokine ligand (CXCL1, 2, 3) induced by interleukin-1 (IL1B) or TNF-α-induced protein 6 (TNFAIP6). These molecules are along the green-colored molecules, such as the NF-κB p105 subunit (NFKB1) and NLRP3 inflammasome (NLRP3, PYCARD, and CASP1), which are related to proinflammatory effects and activation of the NF-κB pathway or the MAPK pathway (Bouwmeester et al., 2004). Other common molecules include the modulator of cytochrome C oxidase during inflammation (C15orf48), chemokine ligands acting as macrophage inflammatory protein (CCL3 and CCL3L1), transmembrane protein (TMEM176A/B), nuclear factor erythroid (NFE2), peptidyl arginine deiminase 4 (PADI4), RAS oncogene (RAB20), and proto-oncogene (ETS2). These are also related to inflammation, immune response, or membrane fusion (Pylayeva-Gupta et al., 2011; Gold et al., 2012; Tanikawa et al., 2012; Lee et al., 2021).
As the specific features of two pathways, the pathways at days 1 and 5 include pleckstrin homology-like domain family A member 2 (PHLDA2) and chemokine ligand (CXCL5) (Figures 4A, B). The pathways at days 5 and 10 include chemokine ligands acting as macrophage inflammatory protein (CCL4L2) (Figures 4B, C). The pathways at days 1 and 10 include folate receptor (FOLR3), haptoglobin (HP), and chemokine ligand (CXCL16) (Figures 4A–C). These are related to acute inflammatory response, immunity, or membrane attachment (Palomino and Marti, 2015; Cohen et al., 2020; Duan et al., 2022).
The obtained pathways do not contain the molecules in the NF-κB pathway (NFKB1, NFKBIA, and CHUK) or the MAPK pathway (HRAS, RAF1, and MAP2K7). The absence of these molecules may be due to insufficient gene coverage in the original omics data.
4 Discussion
4.1 ICAM1-associated pathways from case studies
The comparison between the obtained ICAM1-associated pathways in case study 1 with the COVID-19 Disease Map reveals existing and unknown nodes. For example, MAP2K3, MAPK14, JUN, FOS, ITGA2, ITGB1, RSAD2, OAS, and STAT2 have already been mapped onto the COVID-19 Disease Map, while RELB, ITGAL, CDC42, ACTB, CD40, DCTN1, BCL3, and CD83 in the obtained pathways are still absent in the current COVID-19 Disease Map.
Likewise, we can identify the difference between the obtained ICAM1-associated pathways and the current COVID-19 Disease Map from the results of case study 2. For instance, IL1B, NFKB1, NLRP3, PYCARD, and CASP1 are listed in the COVID-19 Disease Map, while there are molecules absent from it, including CCL3, 3L1, 4L2, CXCL1, 2, 3, 5, 16, TNFAIP6, C15orf48, TMEM176A/B, NFE2, PADI4, RAB20, ETS2, PHLDA2, FOLR3, and HP.
The results from both case studies indicated that the NF-κB pathway would likely be activated, which reflects that our framework can reproduce the already-known fact that the NF-κB pathway is activated in COVID-19, as seen in the KEGG’s COVID-19 pathway (hsa05171). As a new insight into the unknown pathways is missing from the current COVID-19 Disease Map, the results imply that COVID-19 involves the following two up/downstream pathways:
• Upstream pathway with proteins on the non-canonical NF-κB pathway
• Downstream pathway with integrins and cytoskeletal elements associated with actin and the motor protein dynein for cell transformation The non-canonical NF-κB pathway is reasonable because it is relevant to the proinflammatory response in viral infections such as COVID-19. It is also creditable that TNFRSF11A is found only in the pathway of DCs (Figure 3B) since TNFRSF11A is known to be expressed on DCs and T cells to facilitate their interaction with each other (Anderson et al., 1997). The involvement of downstream pathways leading to the cytoskeleton (the internal filaments of eukaryotic cells), including actin filaments and microtubules, in COVID-19 is also plausible. After the interaction between ICAM-1 and integrin regulates cell adhesion, the motor protein myosin would move on actin filaments, inducing cell transformation and movement. The motor protein dynein would move on microtubules transporting molecules in the cytoplasm to the MTOC. Given the argument mentioned in the Introduction that MTOC or VS spawned by ICAM-1 causes cell-to-cell transmission in HIV-1 or HTLV-1, the existence of these downstream molecules of ICAM1-associated pathways raises the possibility of pathways involved in the formation of MTOC or VS in SARS-CoV-2. In this study, the Ras-Raf-MEK-ERK pathway for MTOC or VS in HTLV-1 was inactive. Meanwhile, RAC1 and CDC42 were conserved. Ras-related C3 botulinus toxin substrate 1 (Rac1, encoded by RAC1) and cell division control protein 42 homolog (Cdc42, encoded by CDC42) are essential for VS formation in HTLV-1 cells (Gross and Thoma-Kress, 2016). Although it is unclear whether SARS-CoV-2 has a VS formation mechanism analogous to that of HIV-1 or HTLV-1, we cannot rule out the possibility that MTOC formation and VS formation never occur. To verify these inferred phenomena, observing MTOC and VS formation through infection experiments or molecular dynamics tracking using high-end live-cell imaging techniques (Real et al., 2018) would be desirable.
4.2 Related work
The need to identify unknown pathways has accelerated the work related to gene network inference in COVID-19. For example, Hasankhani et al. (2021) obtained signaling pathways associated with the main hallmarks of COVID-19 by differential coexpression network analysis. Tanaka et al. (2021) revealed host cellular gene networks by using the Bayesian network. Generally, several methods for gene network inference from single-cell omics data exist, which can be classified into data-driven and knowledge-based methods. Data-driven gene network inference methods include statistical approaches such as regression, mutual information, correlation, and a combination of different techniques (Marbach et al., 2012; Mochida et al., 2018). Alternatively, knowledge-based gene network inference uses prior knowledge for information retrieval or logic programming. Fabris et al. quantified the influence by creating interpretable KEGG feature types for the hierarchical classification of aging-related protein functions (Fabris and Freitas, 2016). Chen et al. provided the biological relevance by analyzing the Gene Ontology terms and KEGG pathways of each drug category enriched in the literature and clinical trials for predicting the drug–target interaction (Chen et al., 2015). There also exist hybrid methods incorporating data-driven and knowledge-based methods. Soh et al. enumerated the minimal network components by adopting a Boolean satisfiability problem (SAT) solver for KEGG pathways (Soh et al., 2012). Zuo et al. integrated information at gene expression and network topology levels by differentially weighted graphical LASSO (Zuo et al., 2017). However, full-scale integration of data-driven and knowledge-based methods is still under development for gene network inference. Our method favors this development by extending the correlation network by integrating data and knowledge. Especially, two-step extraction of DCGs in Step 1, narrowing down DCGs after filtering DEGs, is a mixture of detecting the significant differences in the gene expression levels and checking the pairwise correlation between gene pairs. This extraction is substitutive to other methods for extracting DCGs, such as WGCNA or gene set net correlation analysis (GSNCA) (Rahmatallah et al., 2014).
4.3 Concluding remarks
As a summary of contributions, this study discovered novel ICAM1-associated pathways currently absent from the COVID-19 Disease Map. While previous analysis or curation work found the canonical NF-κB pathway (Fujisawa et al., 2021), the non-canonical pathways were not known to be involved in the COVID-19 Disease Map. The discovered pathways suggested the existence of unknown pathways in the map, an upstream non-canonical NF-κB pathway, and a downstream pathway that may lead to MTOC formation subject to observation.
In addition to the scientific findings, our framework, which integrates single-cell omics data analysis and model validation using multiple knowledge bases, is also original and versatile. Especially single-cell omics data analysis in Step 1 and model validation by multiple knowledge bases in Step 3 are realized to construct pathways in different cases (See also Supplementary Material). For these reasons, our work would contribute to a remarkable development in the DD-KB gene network inference methods.
The existence of undirected edges within the final pathways would be a limitation of our framework. These edges without direction arise from correlation networks that find direct and indirect relationships but do not distinguish between causality and correlation (Opgen-Rhein and Strimmer, 2007). Our methodology requires its extension to infer causal directions of the edges.
Consequently, future work will include the following two tasks: one is to infer causal networks based on data and knowledge via Bayesian networks or other observational causal discovery techniques (Pearl, 2000). The other is to analyze the obtained pathways for verifying or modifying them in terms of dynamics. For example, modeling and simulation of differential equations based on state transitions would help us comprehend the dynamics (Odaka and Inoue, 2020). Otherwise, the perturbation experiments can simulate the intervention effects on dynamics by explicitly using direct transcription factor knockout or overexpression (Loucera et al., 2020). Indeed, such a study has significantly improved prediction accuracy for downstream targets (Noh et al., 2018).
Overall, the ICAM1-associated pathways constructed from the data and knowledge in this study will expedite the repair and completion of the COVID-19 Disease Map for a deeper understanding of SARS-CoV-2 pathogenesis.
Data availability statement
The original contributions presented in the study are included in the article/Supplementary Material; further inquiries can be directed to the corresponding author.
Author contributions
MO, MM, and KI conceived and designed the research; MO performed the experiments and analyzed the data; MO, MM, and KI wrote the manuscript. All authors contributed to the article and approved the submitted version.
Funding
This work was supported by JSPS KAKENHI Grant Numbers JP22KJ1417 and JP21H04905, JST CREST Grant Number JPMJCR22D3, and ROIS Strategic Research Project Grant Number 2022-SRP-09.
Conflict of interest
The authors declare that the research was conducted in the absence of any commercial or financial relationships that could be construed as a potential conflict of interest.
Publisher’s note
All claims expressed in this article are solely those of the authors and do not necessarily represent those of their affiliated organizations, or those of the publisher, the editors, and the reviewers. Any product that may be evaluated in this article, or claim that may be made by its manufacturer, is not guaranteed or endorsed by the publisher.
Supplementary material
The Supplementary Material for this article can be found online at: https://www.frontiersin.org/articles/10.3389/fgene.2023.1250545/full#supplementary-material
References
Altman, T., Travers, M., Kothari, A., Caspi, R., and Karp, P. D. (2013). A systematic comparison of the MetaCyc and KEGG pathway databases. BMC Bioinform 14, 112. doi:10.1186/1471-2105-14-112
Anderson, D. M., Maraskovsky, E., Billingsley, W. L., Dougall, W. C., Tometsko, M. E., Roux, E. R., et al. (1997). a homologue of the TNF receptor and its ligand enhance T-cell growth and dendritic-cell function. Nature 390, 175–179. doi:10.1038/36593
Barrett, T., Wilhite, S. E., Ledoux, P., Evangelista, C., Kim, I. F., Tomashevsky, M., et al. (2013). NCBI GEO: archive for functional genomics data sets–update. Nucleic Acids Res. 41, D991–D995. doi:10.1093/nar/gks1193
Benjamini, Y., and Hochberg, Y. (1995). Controlling the false discovery rate: a practical and powerful approach to multiple testing. J. R. Stat. Soc. Ser. B 57, 289–300. doi:10.1111/j.2517-6161.1995.tb02031.x
Blondel, V. D., Guillaume, J.-L., Lambiotte, R., and Lefebvre, E. (2008). Fast unfolding of communities in large networks. J. Stat. Mech. 2008, P10008. doi:10.1088/1742-5468/2008/10/p10008
Bouwmeester, T., Bauch, A., Ruffner, H., Angrand, P. O., Bergamini, G., Croughton, K., et al. (2004). A physical and functional map of the human TNF-α/NF-κB signal transduction pathway. Nat. Cell Biol. 6, 97–105. doi:10.1038/ncb1086
Bracq, L., Xie, M., Benichou, S., and Bouchet, J. (2018). Mechanisms for cell-to-cell transmission of HIV-1. Front. Immunol. 9, 260. doi:10.3389/fimmu.2018.00260
Chen, L., Chu, C., Lu, J., Kong, X., Huang, T., and Cai, Y. (2015). Gene ontology and KEGG pathway enrichment analysis of a drug target-based classification system. PLoS ONE 10, e0126492. doi:10.1371/journal.pone.0126492
Cillo, A. R., Somasundaram, A., Shan, F., Cardello, C., Workman, C. J., Kitsios, G. D., et al. (2021). People critically ill with COVID-19 exhibit peripheral immune profiles predictive of mortality and reflective of SARS-CoV-2 lung viral burden. Cell. Rep. Med. 2, 100476. doi:10.1016/j.xcrm.2021.100476
Cohen, D., Pilozzi, A., and Huang, X. (2020). Network medicine approach for analysis of alzheimer’s disease gene expression data. Int. J. Mol. Sci. 21, 332. doi:10.3390/ijms21010332
de la Fuente, A., Bing, N., Hoeschele, I., and Mendes, P. (2004). Discovery of meaningful associations in genomic data using partial correlation coefficients. Bioinform 20, 3565–3574. doi:10.1093/bioinformatics/bth445
Duan, Y., Du, Y., Gu, Z., Zheng, X., and Wang, C. (2022). Prognostic value, immune signature, and molecular mechanisms of the PHLDA family in pancreatic adenocarcinoma. Int. J. Mol. Sci. 23, 10316. doi:10.3390/ijms231810316
Duò, A., Robinson, M. D., and Soneson, C. (2018). A systematic performance evaluation of clustering methods for single-cell RNA-seq data. F1000Res 7, 1141. doi:10.12688/f1000research.15666.3
Eisen, M. B., Spellman, R. T., Brown, P. O., and Botstein, D. (1999). Cluster analysis and display of genome-wide expression patterns. PNAS 96, 10943. doi:10.1073/pnas.96.19.10943-c
Fabris, F., and Freitas, A. A. (2016). New KEGG pathway-based interpretable features for classifying ageing-related mouse proteins. Bioinform 32, 2988–2995. doi:10.1093/bioinformatics/btw363
Fujisawa, K., Shimo, M., Taguchi, Y. H., Ikematsu, S., and Miyata, R. (2021). PCA-based unsupervised feature extraction for gene expression analysis of COVID-19 patients. Sci. Rep. 11, 17351. doi:10.1038/s41598-021-95698-w
Gold, R., Kappos, L., Arnold, D. L., Bar-Or, A., Giovannoni, G., Selmaj, K., et al. (2012). Placebo-controlled phase 3 study of oral BG-12 for relapsing multiple sclerosis. N. Engl. J. Med. 367, 1098–1107. doi:10.1056/NEJMoa1114287
Grant, R. A., Morales-Nebreda, L., Markov, N. S., Swaminathan, S., Querrey, M., Guzman, E. R., et al. (2021). Circuits between infected macrophages and T cells in SARS-CoV-2 pneumonia. Nature 590, 635–641. doi:10.1038/s41586-020-03148-w
Gross, C., and Thoma-Kress, A. K. (2016). Molecular mechanisms of HTLV-1 cell-to-cell transmission. Viruses 8, 74. doi:10.3390/v8030074
Hasankhani, A., Bahrami, A., Sheybani, N., Aria, B., Hemati, B., Fatehi, F., et al. (2021). Differential Co-expression network analysis reveals key hub-high traffic genes as potential therapeutic targets for COVID-19 pandemic. Front. Immunol. 12, 789317. doi:10.3389/fimmu.2021.789317
Hicks, S. C., Townes, F. W., Teng, M., and Irizarry, R. A. (2018). Missing data and technical variability in single-cell RNA-sequencing experiments. Biostatistics 19, 562–578. doi:10.1093/biostatistics/kxx053
Huang, D. W., Sherman, B. T., and Lempicki, R. A. (2009a). Bioinformatics enrichment tools: paths toward the comprehensive functional analysis of large gene lists. Nucleic Acids Res. 37, 1–13. doi:10.1093/nar/gkn923
Huang, D. W., Sherman, B. T., and Lempicki, R. A. (2009b). Systematic and integrative analysis of large gene lists using DAVID bioinformatics resources. Nat. Protoc. 4, 44–57. doi:10.1038/nprot.2008.211
Igakura, T., Stinchcombe, J. C., Goon, P. K. C., Taylor, G. P., Weber, J. N., Griffiths, G. M., et al. (2003). Spread of HTLV-I between lymphocytes by virus-induced polarization of the cytoskeleton. Science 299, 1713–1716. doi:10.1126/science.1080115
Kivioja, T., Vähärautio, A., Karlsson, K., Bonke, M., Enge, M., Linnarsson, S., et al. (2012). Counting absolute numbers of molecules using unique molecular identifiers. Nat. Methods 9, 72–74. doi:10.1038/nmeth.1778
Langfelder, P., and Horvath, S. (2008). WGCNA: an R package for weighted correlation network analysis. BMC Bioinform 9, 559. doi:10.1186/1471-2105-9-559
Lee, C. Q. E., Kerouanton, B., Chothani, S., Zhang, S., Chen, Y., Mantri, C. K., et al. (2021). Coding and non-coding roles of MOCCI (C15ORF48) coordinate to regulate host inflammation and immunity. Nat. Commun. 12, 2130. doi:10.1038/s41467-021-22397-5
Lehoucq, R. B., Sorensen, D. C., and Yang, C. (1998). “ARPACK users’guide – Solution of large-scale eigenvalue problems with implicitly restarted arnoldi methods,” in Software, environments, tools (SIAM), 6. doi:10.1137/1.9780898719628
Li, X., Chen, W., Chen, Y., Zhang, X., Gu, J., and Zhang, M. Q. (2017). Network embedding-based representation learning for single cell RNA-seq data. Nucleic Acids Res. 45, e166. doi:10.1093/nar/gkx750
Liu, Z., Mar, K. B., Hanners, N. W., Perelman, S. S., Kanchwala, M., Xing, C., et al. (2019). A NIK–SIX signalling axis controls inflammation by targeted silencing of non-canonical NF-κB. Nature 568, 249–253. doi:10.1038/s41586-019-1041-6
Loucera, C., Esteban-Medina, M., Rian, K., Falco, M. M., Dopazo, J., and Pe˜na-Chilet, M. (2020). Drug repurposing for COVID-19 using machine learning and mechanistic models of signal transduction circuits related to SARS-CoV-2 infection. Sig. Transduct. Target Ther. 5, 290. doi:10.1038/s41392-020-00417-y
Luo, B. H., Carman, C. V., and Springer, T. A. (2007). Structural basis of integrin regulation and signaling. Annu. Rev. Immunol. 25, 619–647. doi:10.1146/ANNUREV.IMMUNOL.25.022106.141618
Malinin, N. L., Boldin, M. P., Kovalenko, A. V., and Wallach, D. (1997). MAP3K-related kinase involved in NF-kappaB induction by TNF, CD95 and IL-1. Nature 385, 540–544. doi:10.1038/385540a0
Marbach, D., Costello, J. C., Küffner, R., Vega, N., Prill, R. J., Camacho, D. M., et al. (2012). Wisdom of crowds for robust gene network inference. Nat. Methods. 9, 796–804. doi:10.1038/nmeth.2016
McInnes, L., and Healy, J. (2018). Umap: uniform manifold approximation and projection for dimension reduction. ArXiv e-prints , abs/1802.03426. doi:10.48550/ARXIV.1802.03426
Mochida, K., Koda, S., Inoue, K., and Nishii, R. (2018). Statistical and machine learning approaches to predict gene regulatory networks from transcriptome datasets. Front. Plant Sci. 9, 1770. doi:10.3389/fpls.2018.01770
Nejmeddine, M., Negi, V. S., Mukherjee, S., Tanaka, Y., Orth, K., Taylor, G. P., et al. (2009). HTLV-1-Tax and ICAM-1 act on T-cell signal pathways to polarize the microtubule-organizing center at the virological synapse. Blood 114, 1016–1025. doi:10.1182/blood-2008-03-136770
Noh, H., Shoemaker, J. E., and Gunawan, R. (2018). Network perturbation analysis of gene transcriptional profiles reveals protein targets and mechanism of action of drugs and influenza A viral infection. Nucleic Acids Res. 46, e34. doi:10.1093/nar/gkx1314
Odaka, M., and Inoue, K. (2020). “Computational modeling and simulation of viral load kinetics in SARS-CoV-2 replication,” in CSBio’20: Proceedings of the Eleventh International Conference on Computational Systems-Biology and Bioinformatics, 75–82. doi:10.1145/3429210.3429214
Odaka, M., and Inoue, K. (2021). Modeling viral dynamics in SARS-CoV-2 infection based on differential equations and numerical analysis. Heliyon 7, e08207. doi:10.1016/j.heliyon.2021.e08207
Opgen-Rhein, R., and Strimmer, K. (2007). From correlation to causation networks: a simple approximate learning algorithm and its application to high-dimensional plant gene expression data. BMC Syst. Biol. 1, 37. doi:10.1186/1752-0509-1-37
Ostaszewski, M., Gebel, S., Kuperstein, I., Mazein, A., Zinovyev, A., Dogrusoz, U., et al. (2019). Community-driven roadmap for integrated disease maps. Brief. Bioinform. 20, 659–670. doi:10.1093/bib/bby024
Ostaszewski, M., Mazein, A., Gillespie, M. E., Kuperstein, I., Niarakis, A., Hermjakob, H., et al. (2020). Author correction: COVID-19 disease map, building a computational repository of SARS-CoV-2 virus-host interaction mechanisms. Sci. Data 7, 247. doi:10.1038/s41597-020-00589-w
Ostaszewski, M., Niarakis, A., Mazein, A., Kuperstein, I., Phair, R., Orta-Resendiz, A., et al. (2021). COVID19 Disease Map, a computational knowledge repository of virus–host interaction mechanisms. Mol. Syst. Biol. 17, e10851. doi:10.15252/msb.202110851
Palomino, D., and Marti, L. (2015). Chemokines and immunity. Einstein (Sao Paulo) 13, 469–473. doi:10.1590/S1679-45082015RB3438
Pearl, J. (2000). Causality: Models, reasoning and inference. Cambridge, United Kingdom: Cambridge University Press. doi:10.5860/choice.47-3771
Pedregosa, F., Varoquaux, G., Gramfort, A., Michel, V., Thirion, B., Grisel, O., et al. (2011). Scikit-learn: machine learning in Python. J. Mach. Learn. Res. 12, 2825–2830. doi:10.5555/1953048.2078195
Pylayeva-Gupta, Y., Grabocka, E., and Bar-Sagi, D. (2011). RAS oncogenes: weaving a tumorigenic web. Nat. Rev. Cancer 11, 761–774. doi:10.1038/nrc3106
Rahmatallah, Y., Emmert-Streib, F., and Glazko, G. V. (2014). Gene sets net correlations analysis (GSNCA): a multivariate differential coexpression test for gene sets. Bioinform 30, 360–368. doi:10.1093/bioinformatics/btt687
Real, F., Sennepin, A., Ganor, Y., Schmitt, A., and Bomsel, M. (2018). Live imaging of HIV-1 transfer across T cell virological synapse to epithelial cells that promotes stromal macrophage infection. Cell Rep. 23, 1794–1805. doi:10.1016/j.celrep.2018.04.028
Reimand, J., Isserlin, R., Voisin, V., Kucera, M., Tannus-Lopes, C., Rostamianfar, A., et al. (2019). Pathway enrichment analysis and visualization of omics data using g:profiler, GSEA, Cytoscape and EnrichmentMap. Nat. Protoc. 14, 482–517. doi:10.1038/s41596-018-0103-9
Rodchenkov, I., Babur, O., Luna, A., Aksoy, B. A., Wong, J. V., Fong, D., et al. (2020). Pathway commons 2019 update: integration, analysis and exploration of pathway data. Nucleic Acids Res. 48, D489–D497. doi:10.1093/nar/gkz946
Shannon, P., Markiel, A., Ozier, O., Baliga, N. S., Wang, J. T., Ramage, D., et al. (2003). Cytoscape: a software environment for integrated models of biomolecular interaction networks. Genome Res. 13, 2498–2504. doi:10.1101/gr.1239303
Smith-Norowitz, T. A., Loeffler, J., Norowitz, Y. M., and Kohlhoff, S. (2021). Intracellular adhesion molecule-1 (ICAM-1) levels in convalescent COVID-19 serum: a case report. Ann. Clin. Lab. Sci. 51, 730–734.
Soh, T., Inoue, K., Baba, T., Takada, T., and Shiroishi, T. (2012). Evaluation of the prediction of gene knockout effects by minimal pathway enumeration. Adv. Life Sci. 4, 154–165.
Stark, C., Breitkreutz, B.-J., Reguly, T., Boucher, L., Breitkreutz, A., and Tyers, M. (2006). BioGRID: a general repository for interaction datasets. Nucleic Acids Res. 34, D535–D539. doi:10.1093/nar/gkj109
Szklarczyk, D., Gable, A. L., Lyon, D., Junge, A., Wyder, S., Huerta-Cepas, J., et al. (2019). STRING v11: protein–protein association networks with increased coverage, supporting functional discovery in genome-wide experimental datasets. Nucleic Acids Res. 47, D607–D613. doi:10.1093/nar/gky1131
Tanaka, Y., Higashihara, K., Adachi, M., Yamashita, F., Tamada, Y., and Okuno, Y. (2021). Dynamic changes in gene-to-gene regulatory networks in response to SARS-CoV-2 infection. Sci. Rep. 11, 11241. doi:10.1038/s41598-021-90556-1
Tanikawa, C., Espinosa, M., Suzuki, A., Masuda, K., Yamamoto, K., Tsuchiya, E., et al. (2012). Regulation of histone modification and chromatin structure by the p53-PADI4 pathway. Nat. Commun. 3, 676. doi:10.1038/ncomms1676
Tong, M., Jiang, Y., Xia, D., Xiong, Y., Zheng, Q., Chen, F., et al. (2020). Elevated expression of serum endothelial cell adhesion molecules in COVID-19 patients. J. Infect. Dis. 222, 894–898. doi:10.1093/infdis/jiaa349
Wadi, L., Meyer, M., Weiser, J., Stein, L. D., and Reimand, J. (2016). Impact of outdated gene annotations on pathway enrichment analysis. Nat. Methods 13, 705–706. doi:10.1038/nmeth.3963
Walls, A. C., Park, Y.-J., Tortorici, M. A., Wall, A., McGuire, A. T., and Veesler, D. (2020). Structure, function, and antigenicity of the SARS-CoV-2 spike glycoprotein. Cell 183, 1735. doi:10.1016/j.cell.2020.11.032
Weissenhorn, W., A Dessen, L. J. C., Harrison, S. C., Skehel, J. J., and Wiley, D. C. (1999). Structural basis for membrane fusion by enveloped viruses. Mol. Membr. Biol. 16, 3–9. doi:10.1080/096876899294706
Wilson, R. W., Ballantyne, C. M., Smith, C. W., Montgomery, C., Bradley, A., O’Brien, W. E., et al. (1993). Gene targeting yields a CD18-mutant mouse for study of inflammation. J. Immunol. 151, 1571–1578. doi:10.4049/jimmunol.151.3.1571
Wolf, F. A., Angerer, P., and Theis, F. J. (2018). Scanpy: large-scale single-cell gene expression data analysis. Genome Biol. 19, 15. doi:10.1186/s13059-017-1382-0
Won, T., Wood, M. K., Hughes, D. M., Talor, M. V., Ma, Z., Schneider, J., et al. (2022). Endothelial thrombomodulin downregulation caused by hypoxia contributes to severe infiltration and coagulopathy in COVID-19 patient lungs. eBioMedicine 75, 103812. doi:10.1016/j.ebiom.2022.103812
Zeng, C., Evans, J. P., King, T., Zheng, Y. M., Oltz, E. M., Whelan, S. P. J., et al. (2021). SARS-CoV-2 spreads through cell-to-cell transmission. PNAS 119, e2111400119. doi:10.1073/pnas.2111400119
Zheng, W., Huang, X., Lai, Y., Liu, X., Jiang, Y., and Zhan, S. (2021). Glycyrrhizic acid for COVID-19: findings of targeting pivotal inflammatory pathways triggered by SARS-CoV-2. Front. Pharmacol. 12, 631206. doi:10.3389/fphar.2021.631206
Zuo, Y., Cui, Y., Yu, G., Li, R., and Ressom, H. W. (2017). Incorporating prior biological knowledge for network-based differential gene expression analysis using differentially weighted graphical LASSO. BMC Bioinform 18, 99. doi:10.1186/s12859-017-1515-1
Keywords: ICAM-1, cell-to-cell transmission, COVID-19, single-cell omics data analysis, model validation, pathway enrichment analysis, data-driven and knowledge-based approach
Citation: Odaka M, Magnin M and Inoue K (2023) Gene network inference from single-cell omics data and domain knowledge for constructing COVID-19-specific ICAM1-associated pathways. Front. Genet. 14:1250545. doi: 10.3389/fgene.2023.1250545
Received: 30 June 2023; Accepted: 16 August 2023;
Published: 31 August 2023.
Edited by:
Wenzhong Xiao, Massachusetts General Hospital and Harvard Medical School, United StatesReviewed by:
Jung Hun Oh, Memorial Sloan Kettering Cancer Center, United StatesTakeyuki Tamura, Kyoto University, Japan
Tomoya Baba, Research Organization of Information and Systems, Japan
Copyright © 2023 Odaka, Magnin and Inoue. This is an open-access article distributed under the terms of the Creative Commons Attribution License (CC BY). The use, distribution or reproduction in other forums is permitted, provided the original author(s) and the copyright owner(s) are credited and that the original publication in this journal is cited, in accordance with accepted academic practice. No use, distribution or reproduction is permitted which does not comply with these terms.
*Correspondence: Mitsuhiro Odaka, b2Rha2FAbmlpLmFjLmpw