 Gagandeep Kaur Walia1,2*†
 Jeemon Panniyammakal2,3†
 Tripti Agarwal4
 Ruchita Jalal4Ruby Gupta2
 Lakshmy Ramakrishnan5Nikhil Tandon4Ambuj Roy4
 Anand Krishnan4Dorairaj Prabhakaran1,2
- 1Public Health Foundation of India, New Delhi, India
- 2Centre for Chronic Disease Control, New Delhi, India
- 3Sree Chitra Tirunal Institute for Medical Sciences and Technology, Trivandrum, India
- 4Indian Institute of Public Health-Delhi, New Delhi, India
- 5All India Institute of Medical Science, New Delhi, India
Background: A heavy burden of cardiometabolic conditions on low- and middle-income countries like India that are rapidly undergoing urbanization remains unaddressed. Indians are known to have high levels of triglycerides and low levels of HDL-C along with moderately higher levels of LDL-C. The genome-wide findings from Western populations need to be validated in an Indian context for a better understanding of the underlying etiology of dyslipidemia in India.
Objective: We aim to validate 12 genetic variants associated with lipid levels among rural and urban Indian populations and derive unweighted and weighted genetic risk scores (uGRS and wGRS) for lipid levels among the Indian population.
Methods: Assuming an additive model of inheritance, linear regression models adjusted for all the possible covariates were run to examine the association between 12 genetic variants and total cholesterol, triglycerides, HDL-C, LDL-C, and VLDL-C among 2,117 rural and urban Indian participants. The combined effect of validated loci was estimated by allelic risk scores, unweighted and weighted by their effect sizes.
Results: The wGRS for triglycerides and VLDL-C was derived based on five associated variants (rs174546 at FADS1, rs17482753 at LPL, rs2293889 at TRPS1, rs4148005 at ABCA8, and rs4420638 at APOC1), which was associated with 36.31 mg/dL of elevated triglyceride and VLDL-C levels (β = 0.95, SE = 0.16, p < 0.001). Similarly, every unit of combined risk score (rs2293889 at TRPS1 and rs4147536 at ADH1B) was associated with 40.62 mg/dL of higher total cholesterol (β = 1.01, SE = 0.23, p < 0.001) and 33.97 mg/dL of higher LDL-C (β = 1.03, SE = 0.19, p < 0.001) based on its wGRS (rs2293889 at TRPS1, rs4147536 at ADH1B, rs4420638 at APOC1, and rs660240 at CELSR2). The wGRS derived from five associated variants (rs174546 at FADS1, rs17482753 at LPL, rs4148005 at ABCA8, rs4420638 at APOC1, and rs7832643 at PLEC) was associated with 10.64 mg/dL of lower HDL-C (β = −0.87, SE = 0.14, p < 0.001).
Conclusion: We confirm the role of eight genome-wide association study (GWAS) loci related to different lipid levels in the Indian population and demonstrate the combined effect of variants for lipid traits among Indians by deriving the polygenic risk scores. Similar studies among different populations are required to validate the GWAS loci and effect modification of these loci by lifestyle and environmental factors related to urbanization.
Introduction
Lipid levels are established risk factors for cardiovascular disorders (Castelli et al., 1992; Benjamin et al., 2018) and are among the leading causes of morbidity and mortality (Mohebi et al., 2022). Globally, high cholesterol is estimated to cause 2.6 million deaths (4.5% of total deaths) and 29.7 million disability-adjusted life years (2.0% of total DALYs) (Noubiap et al., 2015). Dyslipidemia in the form of increased low-density lipoprotein cholesterol (LDL-C) levels, elevated triglyceride (TG) levels, and lower high-density lipoprotein cholesterol (HDL-C) levels is widely prevalent in India, with estimates ranging from 39% to 63% (Gupta et al., 2017).
Family and twin studies suggest familial aggregation of lipid disorders and relatively high heritability of various lipid traits. The heritability varies from ∼35% to 48% for TG, ∼40%–50% for LDL-C, and ∼40%–60% for HDL-C (Weiss et al., 2006). Furthermore, a family history of hyperlipidemia/dyslipidemia is associated with a 2.5–7-fold increase in the risk of death due to premature coronary artery disease compared to individuals without such family history (Sanghera et al., 2019). Genome-wide scans and their meta-analysis on different populations identified several loci associated with the serum lipid levels. Although more than 400 loci (Teslovich et al., 2010; Klarin et al., 2018; de Vries et al., 2019; Graff et al., 2021) have been identified cumulatively, these loci explain a small proportion of variances in blood lipid levels (Pilia et al., 2006). The therapeutic potential of some of the identified genome-wide association study (GWAS) signals in the management of dyslipidemia is widely explored (Klarin et al., 2018).
Most of the GWAS loci were replicated in the LOLIPOP cohort of Indian-origin people residing in the United Kingdom (Teslovich et al., 2010). However, considerable Asian/European differences in lipid profiles have been reported (Zhang et al., 2010). Few attempts have been made to validate the genome-wide findings in Indian populations previously (Braun et al., 2012; Rafiq et al., 2012; Arv et al., 2014; Walia et al., 2014; Pranavchand and Reddy, 2017). A new genome-wide scan among Indians living in India identified some novel loci that need further investigations for wider utility (Bandesh et al., 2019). In the present study, we aimed to validate some selected loci related to lipid levels based on their biological relevance in Indian rural and urban populations and derive polygenic risk scores for lipid levels among Indians.
Methods
Study population
The details about the original study that aimed to examine the 20-year trend of cardiometabolic risk factors in rural and urban areas around the National Capital Region are available in Prabhakaran et al. (2017). Urban participants were recruited from the Municipal Corporation of Delhi, and rural participants were recruited from Ballabgarh Block of the adjoining state of Haryana. For the present analyses, the follow-up blood samples were utilized for genotyping the selected variants related to lipid levels. Written informed consent was obtained from all the study participants to use their de-identified stored biological samples for future genetic research related to cardiometabolic risk factors. The present study was approved by the Institute Ethics Committee of the All India Institute of Medical Sciences, New Delhi and Centre for Chronic Disease Control, New Delhi.
Phenotype data
Pre-informed written consent was obtained from each participant before beginning data collection. The details of the data collection have been described previously (Prabhakaran et al., 2017). Detailed questionnaires were administered to collect data on socio-demographic factors, medical history, and lifestyle factors, including diet, physical activity, tobacco smoking, and alcohol consumption. Daily fat consumption (g/day) was estimated from the detailed food frequency questionnaire, and the physical activity scores were categorized. The physical measures included anthropometry for height, weight, and waist and hip girths, along with blood pressure measurements. Fasting blood samples were collected from the participants, and the time of the last meal was recorded. Serum and plasma samples were used for generating data on glycemic and lipid levels. Plasma glucose was measured using the hexokinase method, total cholesterol was estimated using the enzymatic cholesterol oxidase method, and HDL-C was assayed by a direct method using PEG-modified enzymes and dextran sulfate using kits from Roche Diagnostics, Switzerland, on the c311 autoanalyzer (Roche). LDL-C was estimated using the Friedewald equation (Friedewald et al., 1972).
Genotyping and quality control
The buffy coat samples were processed for the phenol–chloroform method for DNA isolation. The isolated DNA was then processed for genotyping of established GWAS variants using the multiplex Sequenom MassARRAY technology. These variants were selected based on their biological importance and high GWAS significance levels related to lipid traits. A detailed description of 12 genetic variants that were found in the Hardy–Weinberg equilibrium (HWE) is listed in Table 2. The HWE was estimated separately in rural and urban samples and also in the combined samples at a Sidak-corrected significance value (p < 0.0018). Power estimates were derived using Quanto software. The present study with high-quality genotype data (≥95% call rates) of 2,117 individuals had >80% power to estimate a 1% variation in lipid measures with a minimum risk allele frequency of 10% and α = 0.05. We did not apply for multiple testing corrections as the presently studied variants are established GWAS loci, and we aim to validate these loci in our Indian population.
Statistical analysis
All analyses were performed using Stata v13.1. Depending on the skewness of the distribution, the continuous variables were suitably transformed and reported as mean (SD), whereas the categorical variables were summarized as number (%). The continuous variables were standardized (z-transformed) prior to any association analyses to facilitate comparability between coefficients.
Linear regression models were run for examining the association of each genetic variant with each of the lipid traits while assuming an additive model of inheritance. The regression model was fully adjusted for the related lifestyle factors, including fat intake, physical activity, BMI, alcohol consumption, smoking, hypertension, and diabetes. To estimate the combined effect of validated loci on each lipid level, allelic risk scores were calculated using loci significantly associated in both the regression models with respective lipid traits examined in the present study. We generated both weighted and unweighted allelic risk scores and compared the effect sizes of the two scores for each of the lipid traits. Weighted genetic risk scores (wGRS) weighing upon the internally derived effect sizes were calculated for each of the lipid traits using the following equation:
where w is the weight (effect size), a is the number of risk alleles, i is the total number of genetic variants, and N is the total number of risk alleles.
Since lipid levels are strongly associated with gender and urbanization due to underlying lifestyle factors, stratified analyses were also undertaken for gender and rural/urban sites while adjusting for all the confounders, as mentioned previously. We also examined the effect modification by gender, rural/urban sites, BMI, diet (fat intake), and physical activity by performing interaction analyses.
Results
The characteristics of 2,117 participants are described in Table 1. All the variables except triglycerides and VLDL-C were normally distributed. Hence, the two variables were log-transformed for all subsequent analyses. The mean age of the participants was 47.1 (12.99) years. Less than half of the study participants (42.3%) were males. Male participants had significantly higher levels of triglycerides, VLDL-C, fasting plasma glucose, and blood pressure. On the other hand, female participants had higher HDL-C levels, BMI, and self-reported hypertension. Male participants also reported higher levels of physical activity, alcohol consumption, and smoking than female participants (Table 1). The rural participants had significantly higher levels of total cholesterol, HDL-C, LDL-C, average fat consumption, and smoking, whereas urban participants had higher BMI, fasting plasma glucose, systolic blood pressure, physical activity, alcohol consumption, and self-reported diabetes and hypertension (Table 1). The details of 12 genetic variants examined to be associated with lipid levels in the present study are listed in Table 2 along with their chromosomal location, nature of variation, and the functional implications of these variations. There were only three variants located in intergenic regions, namely, rs17482753 at LPL, rs2814944 at C6orf106, and rs4420638 at APOC1. Furthermore, only four of them were located in intronic regions, namely, rs2293889 at TRPS1, rs4148005 at ABCA8, rs4147536 at ADH1B, and rs7832643 at PLEC, and there were three 3′-UTR variants, namely, rs10773003 at SBNO1, rs174546 at FADS1, and rs660240 at CELSR2 (Table 2). There were only two coding sequence variants, rs1800961 at HNF4A (a missense variant) and rs737337 at DOCK6 (a synonymous variant) (Table 2). Of 12 examined variants, eight were observed to be significantly associated with one or more lipid traits in our study population (Table 3), and the absolute standardized effect sizes (β-coefficients from linear regression) ranged from 0.08 to 0.14.
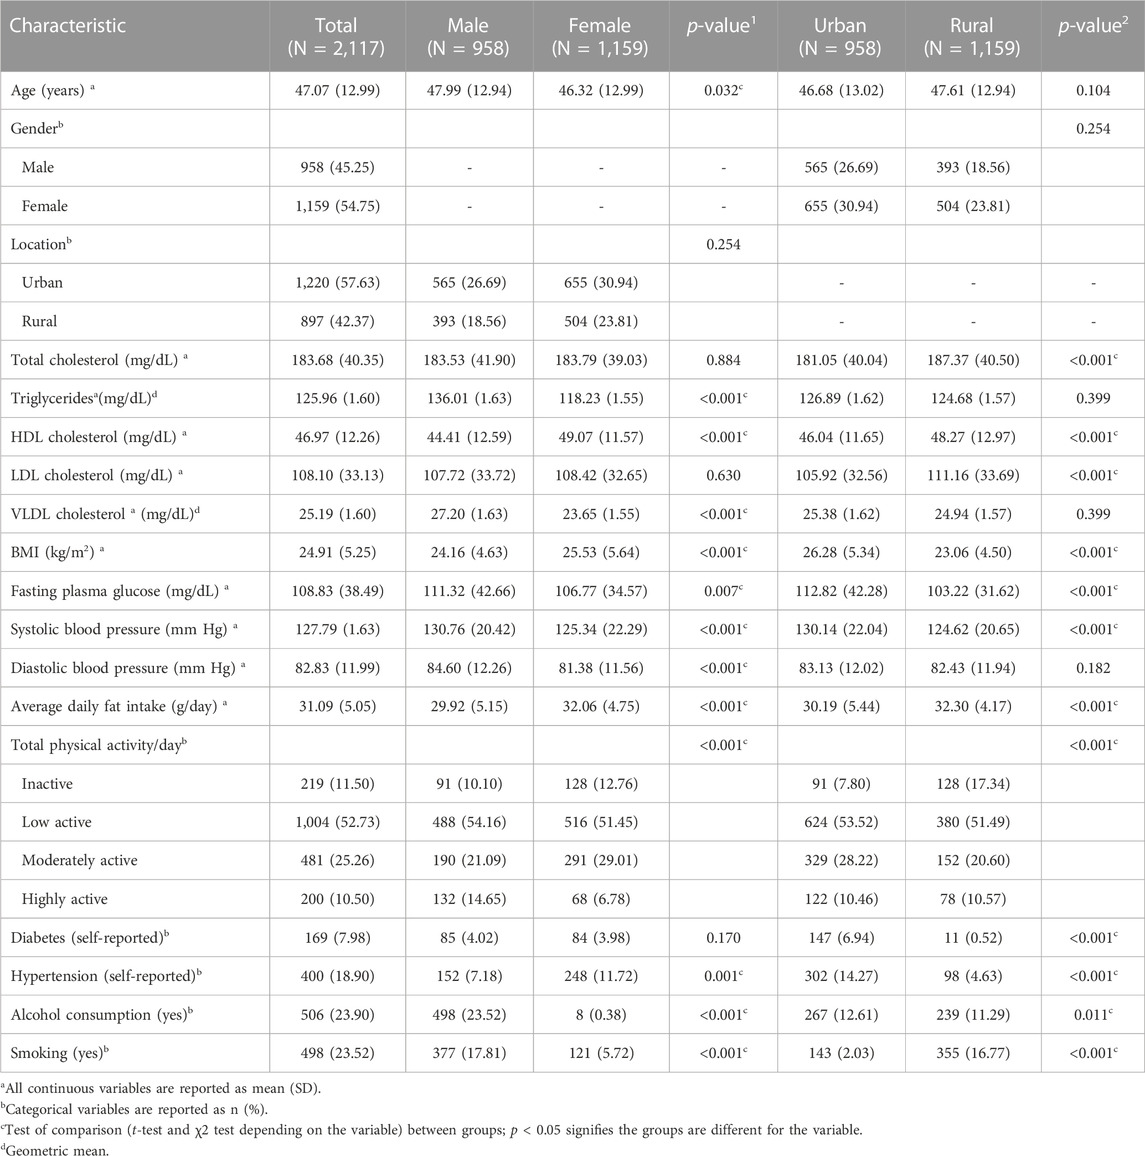
TABLE 1. Characteristics of the study participants.
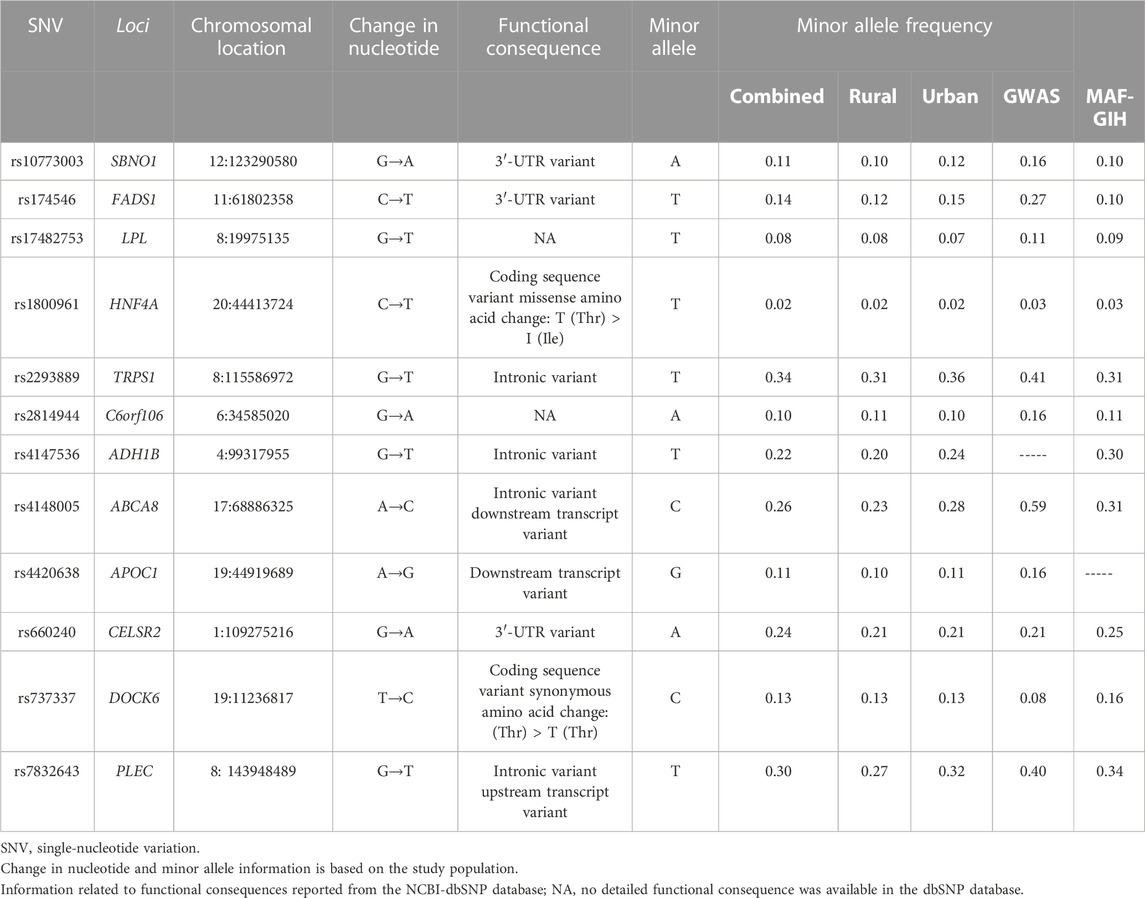
TABLE 2. Description of the studied genetic variants related to lipid levels.

TABLE 3. Association of genetic variants with lipid levels in the present study.
Each copy of the minor allele of rs174546 at FADS1 was associated with a 1.05 mg/dL increase in triglyceride and VLDL-C levels (β = 0.11, SE = 0.04, p = 0.014), 1.21 mg/dL decrease in HDL-C levels (β = −0.10, SE = 0.04, p = 0.025), and 3.11 mg/dL decrease in LDL-C levels (β = −0.09, SE = 0.04, p = 0.036). The minor allele of rs17482753 at LPL was associated with an increase of 1.10 mg/dL in triglyceride and VLDL-C levels (β = 0.21, SE = 0.06, p < 0.001) and a reduction of 1.68 mg/dL in HDL-C levels (β = −0.14, SE = 0.06, p = 0.018). The rs2293889 at TRPS1 was associated with a 1.04 mg/dL increase in triglyceride and VLDL-C levels (β = 0.08, SE = 0.03, p = 0.015), 4.06 mg/dL increase in total cholesterol (β = 0.10, SE = 0.03, p = 0.004), and 3.76 mg/dL increase in LDL-C levels (β = 0.11, SE = 0.01, p = 0.001). The rs4148005 at ABCA8 was associated with a 1.06 mg/dL increase in triglycerides and VLDL-C levels (β = 0.11, SE = 0.04, p = 0.001) and 1.64 mg/dL decrease in HDL-C levels (β = −0.13, SE = 0.03, p < 0.001). The minor allele of rs4420638 at APOC1 was associated with 1.05 mg/dL of elevated triglyceride and VLDL-C levels (β = 0.10, SE = 0.05, p = 0.044), 3.71 mg/dL of elevated LDL-C levels (β = 0.11, SE = 0.05, p = 0.028), and 1.85 mg/dL of reduced HDL-C levels (β = −0.15, SE = 0.05, p = 0.003). The rs4147536 at ADH1B variant was associated with a 4.88 mg/dL increase in total cholesterol (β = 0.12, SE = 0.04, p = 0.001), 3.44 mg/dL increase in LDL-C levels (β = 0.10, SE = 0.04, p = 0.006), and 1.11 mg/dL increase in HDL-C levels (β = 0.09, SE = 0.04, p = 0.014). In addition, rs660240 at CELSR2 was associated with a 2.78 mg/dL increase in LDL-C levels (β = 0.08, SE = 0.04, p = 0.020). Furthermore, rs7832643 at PLEC (β = −0.09, SE = 0.03, p = 0.004) was associated with a 1.16 mg/dL decrease in HDL-C levels (Table 2).
The combined effect of all the variants validated for lipid levels was than the individual effect of the variants (Table 3). Every unit increase in the wGRS was associated with 36.31 mg/dL of elevated triglyceride and VLDL-C levels (β = 0.95, SE = 0.16, p < 0.001); 40.62 mg/dL of higher total cholesterol (β = 1.01, SE = 0.23, p < 0.001); 33.97 mg/dL of higher LDL-C levels (β = 1.03, SE = 0.19, p < 0.001); and 10.64 mg/dL of lower HDL-C levels (β = −0.87, SE = 0.14, p < 0.001). The effect sizes of the unweighted allelic risk scores were comparatively much lower than the weighted scores (Table 3).
For sensitivity analyses, we examined the effect of the genetic variants stratified by gender and rural/urban location, where some of the variants showed a significant association only in specific groups (Supplementary Tables S1, S2). Among the eight variants validated for various lipid traits in the present study, none showed interaction with the examined lifestyle factors for the respective lipid traits (Supplementary Table S3). However, some of these validated variants showed significant interaction associations for other lipid traits. For instance, rs174546 showed a significant interaction effect with gender for total cholesterol (β = 0.18, SE = 0.09, p = 0.046) and rs7832643 with obesity for total cholesterol (β = 0.10, SE = 0.03, p = 0.002) and LDL-C (β = 0.07, SE = 0.03, p = 0.030). On the other hand, rs4148005 showed a significant interaction effect with physical activity for total cholesterol (β = 0.10, SE = 0.04, p = 0.022) and LDL-C (β = 0.10, SE = 0.04, p = 0.026) and rs660240 for HDL-C (β = −0.09, SE = 0.04, p = 0.033) levels. In addition, rs10773003 at SBNO1 showed a significant interaction with gender (β = −0.29, SE = 0.10, p = 0.003), site (β = −0.24, SE = 0.10, p = 0.018), and obesity (β = −0.14, SE = 0.05, p = 0.002) for HDL-C and with fat intake for total cholesterol (β = 0.24, SE = 0.10, p = 0.018), triglyceride, and VLDL-C levels (β = 0.23, SE = 0.10, p = 0.027). Similarly, rs2814944 at C6orf106 showed a significant interaction with gender for LDL-C (β = 0.23, SE = 0.11, p = 0.032) and with physical activity for total cholesterol (β = 0.15, SE = 0.07, p = 0.029). Finally, rs1800961 at HNF4A (β = 0.51, SE = 0.23, p = 0.029) and rs737337 at DOCK6 (β = −0.24, SE = 0.09, p = 0.009) were found to be interacting with gender for triglycerides and VLDL-C levels.
Discussion
The overall goal of the present study was to validate the previously reported GWAS loci in rural and urban populations in Delhi, India. It is important to validate GWAS loci in different populations to determine their clinical relevance for drug therapies and preventing dyslipidemia and coronary artery disease. In this study, we validated eight variants in Indian populations that are involved in pathways of lipid transportation and metabolism, fat accumulation, alcohol metabolism, and transcription suppression. We could validate all four intronic variants and two of the three examined variants in the 3′-UTR region. The weighted allelic scores derived from these validated variants were associated with 36.31 mg/dL of elevated triglyceride and VLDL-C levels; 40.62 mg/dL of higher total cholesterol; 33.97 mg/dL of higher LDL-C levels; and 10.64 mg/dL of lower HDL-C levels. We observed that although the regression models of both unweighted and weighted allelic risk scores had comparable r2 and p-values, the effect sizes of the weighted scores were larger than those of the unweighted scores.
ABCA8 encodes for a membrane-associated protein which is a member of the superfamily of ATP-binding cassette (ABC) transporters. ABC proteins transport various molecules across extra- and intracellular membranes. The encoded protein also regulates lipid metabolism as it is involved in the cholesterol efflux pathway. rs4148005 at ABCA8 is an intronic downstream transcript variant that was found to be associated with triglyceride, VLDL-C, and HDL-C levels in the present study. ADH1B encodes for alcohol dehydrogenase 1B enzyme that metabolizes a wide variety of substrates, including ethanol, retinol, other aliphatic alcohols, hydroxysteroids, and lipid peroxidation products. It plays a major role in ethanol catabolism and is thus known to be strongly associated with lipid levels. rs4147536 at ADH1B is also an intronic variant and was found to be associated with total cholesterol and LDL-C levels in the present analysis. TRPS1 (transcriptional repressor GATA binding 1) gene provides instructions for the synthesis of a protein that regulates the activity of many other genes. It encodes for a transcription factor protein and is known to be associated with dyslipidemia. An intronic variant rs2293889 at TRPS1 was found to be associated with all the atherogenic lipid levels (total cholesterol, triglycerides, LDL-C, and VLDL-C) in the present study. PLEC encodes for plectin protein that is produced in different tissues like skin and muscles and is capable of interlinking different elements of the cytoskeleton. Recently, its role in the regulation of lipid levels has been shown. An intronic upstream transcript, rs7832643 at PLEC, was found to be associated with only HDL-C levels in the present study.
CELSR2 encodes for cadherin EGF LAG seven-pass G-type receptor 2 protein, which is a part of the cadherin superfamily. These proteins are receptors involved in contact-mediated communication. The deficiency of CELSR2 is known to suppress lipid accumulation in hepatocytes and thus affect lipid levels. rs660240 at CELSR2 is a 3′-UTR variant that was found to be associated with only LDL-C levels in the present study. FADS1 encodes for fatty acid desaturase enzyme which regulates the unsaturation of fatty acids. It is known to play a role in hepatic lipid composition and fat accumulation and is thus associated with lipid levels in blood. rs174546 at FADS1 is another 3′-UTR variant in the present study that was found to be associated with triglyceride, VLDL-C, and HDL-C levels.
APOC1 resides within the apolipoprotein gene cluster and encodes for protein, which is a member of the apolipoprotein C1 family. It plays a major role in HDL-C and VLDL-C metabolisms and is also known to inhibit cholesteryl ester transfer protein (CETP). A downstream transcript variant, rs4420638 at APOC1, was found to be associated with all the lipid levels in the present study, except total cholesterol. LPL encodes for lipoprotein lipase enzyme that plays a critical role in breaking down fat into triglycerides, which are carried by lipoproteins from various organs to blood. It hydrolyzes triglyceride-rich particles and affects HDL-C levels in the blood. In accordance with this biological function, rs17482753 at LPL was found to be associated with triglyceride, VLDL-C, and HDL-C levels, although the specific functional consequence of this genetic variation is not well documented.
Some of these variants (CELSR2, CETP, and LPL) emerged as lead signals in a genome-wide study based on the Indian population for serum lipid levels (Bandesh et al., 2019), thus suggesting the universality of GWAS findings. They also reported few novel loci (QKI, REEP3, TMCC2, FAM129C, FAM241B, and LOC100506207) at a suggestive genome-wide significance level (Bandesh et al., 2019) that need to be examined in a larger set of samples in different populations of India. Previous validation studies in Indian populations have also confirmed the role of these genetic variants related to lipid levels. A large rural–urban sibling-pair study from India examined the role of few GWAS loci related to lipid levels and reported the role of APOA1, APOA5, APOB, CETP, GCKR, LPL, LIPC, TRIB1, and CELSR2–PSRC1–SORT1 loci (Rafiq et al., 2012; Walia et al., 2014). They also reported effect modification of lipid variants with urban location and gender in the Indian population (Walia et al., 2014). The variants in the CELSR2-PSRC1-SORT1 gene cluster were also observed to be associated with cholesterol and LDL-C levels among an Asian Indian cohort in Arv et al. (2014). Similarly, variants in the 11223.3 chromosomal region involving APOA1, APOA4, APOA5, and APOC loci were reported to be strongly influencing the lipid levels and dyslipidemia in studies from northern (Braun et al., 2012) and southern India (Pranavchand and Reddy, 2017).
It is well established that gender is strongly associated with lipid levels due to differences in associated lifestyle factors and metabolism, and thus, gender-specific thresholds have been advised for clinical implications across the globe. In addition, regional differences in dyslipidemia have been reported by large multi-centric studies with considerable differences among northern and southern Indian populations (Ebrahim et al., 2010; Joshi et al., 2014). The presently examined population belongs to the northern part of India, where people are known to consume a high-fat diet that affects the circulating lipid levels. Moreover, northern India experiences extreme winter seasons that are not present in other parts of India, which is again associated with the consumption of a high-fat diet in winter and festive seasons. Furthermore, India is currently undergoing urbanization, which in turn is associated with cardiometabolic disease burden, including dyslipidemia (Ebrahim et al., 2010; Gupta et al., 2017), and previous studies have demonstrated the effect modification of genetic variants of lipid traits with the urban location (Walia et al., 2014). Therefore, we also explored the interaction of the studied variants with gender, urban location, and related lifestyle factors to examine the effect modification of the validation loci. However, we did not have enough sample size to capture moderate effect modification effects. Nevertheless, we noticed few significant associations with adverse lifestyle factors that need to be replicated in studies with a larger sample size.
In conclusion, we confirm the role of eight previously reported GWAS loci in the Indian population, as well as loci that are involved in different lipid regulation pathways. The weighted allelic risk scores were found to be associated with high levels of lipids. The validated variants and allelic risk scores are useful in further analyses where these risk scores can be used as instruments for examining causal relationships. The effect modification noticed for urban location and related lifestyle factors needs to be investigated further in a larger set of samples for a more meaningful interpretation.
Data availability statement
The original contributions presented in the study are publicly available. This data can be found here: https://ftp.ncbi.nlm.nih.gov/dbgap/studies/phs003469/phs003469.v1.p1, https://www.ncbi.nlm.nih.gov/projects/gap/cgi-bin/study.cgi?study_id=phs003469.v1.p1, https://www.ncbi.nlm.nih.gov/gap/sstr/report/phs003469.v1.p1.
Ethics statement
The studies involving humans were approved by the Institute Ethics Committee of the All India Institute of Medical Sciences and Center for Chronic Disease Control. The studies were conducted in accordance with the local legislation and institutional requirements. The participants provided their written informed consent to participate in this study.
Author contributions
GW supervised the data analyses and wrote the first draft of the manuscript. JP conceived and implemented the study and supervised the genetic data generation. TA performed the data analyses and contributed to manuscript writing. RJ provided assistance in reviewing the literature. RG and LR performed the lipid biochemical data generation. NT, AR, and AK supervised the original study and phenotype data collection. DP conceived and supervised the entire study. All authors contributed to the article and approved the submitted version.
Funding
The present work was supported by the extra mural grant received by DP from the Council of Scientific and Industrial Research (CSIR) under Grant No. 60(0097)/11/EMR-II. The data analyses and the publication of the manuscript was supported by DBT/Wellcome India Alliance grant (Ref. No. IA/CPHE/16/1/502649) awarded to GW, Public Health Foundation of India.
Acknowledgments
The authors would like to acknowledge the genotyping service provided by AceProbe Technologies (India) Pvt. Ltd.
Conflict of interest
The authors declare that the research was conducted in the absence of any commercial or financial relationships that could be construed as a potential conflict of interest.
Publisher’s note
All claims expressed in this article are solely those of the authors and do not necessarily represent those of their affiliated organizations, or those of the publisher, the editors, and the reviewers. Any product that may be evaluated in this article, or claim that may be made by its manufacturer, is not guaranteed or endorsed by the publisher.
Supplementary material
The Supplementary Material for this article can be found online at: https://www.frontiersin.org/articles/10.3389/fgene.2023.1234693/full#supplementary-material
SUPPLEMENTARY TABLE S1 | Association analysis of the genetic variants stratified for gender.
SUPPLEMENTARY TABLE S2 | Association analysis of the genetic variants stratified for site (rural/urban).
SUPPLEMENTARY TABLE S3 | Results of Gene*Environment interaction analysis.
References
Arvind, P., Nair, J., Jambunathan, S., Kakkar, V. V., and Shanker, J. (2014). CELSR2-PSRC1-SORT1 gene expression and association with coronary artery disease and plasma lipid levels in an Asian Indian cohort. J. Cardiol. 64 (5), 339–346. doi:10.1016/j.jjcc.2014.02.012
Bandesh, K., Prasad, G., Giri, A. K., Kauser, Y., Upadhyay, M., Basu, A., et al. (2019). Genome-wide association study of blood lipids in Indians confirms universality of established variants. J. Hum. Genet. 64 (6), 573–587. doi:10.1038/s10038-019-0591-7
Benjamin, E. J., Virani, S. S., Callaway, C. W., Chamberlain, A. M., Chang, A. R., Cheng, S., et al. (2018). Heart disease and stroke statistics-2018 update: A report from the American heart association. Circulation 137 (12), e67–e492. doi:10.1161/CIR.0000000000000558
Braun, T. R., Been, L. F., Singhal, A., Worsham, J., Ralhan, S., Wander, G. S., et al. (2012). A replication study of GWAS-derived lipid genes in asian Indians: the chromosomal region 11q23.3 harbors loci contributing to triglycerides. PLoS One 7 (5), e37056. doi:10.1371/journal.pone.0037056
Castelli, W. P., Anderson, K., Wilson, P. W., and Levy, D. (1992). Lipids and risk of coronary heart disease. The Framingham Study. Ann. Epidemiol. 2 (1–2), 23–28. doi:10.1016/1047-2797(92)90033-m
de Vries, P. S., Brown, M. R., Bentley, A. R., Sung, Y. J., Winkler, T. W., Ntalla, I., et al. (2019). Multiancestry genome-wide association study of lipid levels incorporating gene-alcohol interactions. Am. J. Epidemiol. 188 (6), 1033–1054. doi:10.1093/aje/kwz005
Ebrahim, S., Kinra, S., Bowen, L., Anderson, E., Ben-Shlomo, Y., Lyngdoh, T., et al. (2010). The effect of rural-to-urban migration on obesity and diabetes in India: A cross-sectional study. PLoS Med. 7, e1000268. doi:10.1371/journal.pmed.1000268
Friedewald, W. T., Levy, R. I., and Fredrickson, D. S. (1972). Estimation of the concentration of low-density lipoprotein cholesterol in plasma, without use of the preparative ultracentrifuge. Clin. Chem. 18 (6), 499–502. doi:10.1093/clinchem/18.6.499
Graff, M., Justice, A. E., Young, K. L., Marouli, E., Zhang, X., Fine, R. S., et al. (2021). Discovery and fine-mapping of height loci via high-density imputation of GWASs in individuals of African ancestry. Am. J. Hum. Genet. 108 (4), 564–582. Available from: https://linkinghub.elsevier.com/retrieve/pii/S0002929721000537. doi:10.1016/j.ajhg.2021.02.011
Gupta, R., Rao, R. S., Misra, A., and Sharma, S. K. (2017). Recent trends in epidemiology of dyslipidemias in India. Indian Heart J. 69 (3), 382–392. doi:10.1016/j.ihj.2017.02.020
Joshi, S. R., Anjana, R. M., Deepa, M., Pradeep, R., Bhansali, A., Dhandania, V. K., et al. (2014). Prevalence of dyslipidemia in urban and rural India: the ICMR-INDIAB study. PLoS One 9, e96808. doi:10.1371/journal.pone.0096808
Klarin, D., Damrauer, S. M., Cho, K., Sun, Y. V., Teslovich, T. M., Honerlaw, J., et al. (2018). Genetics of blood lipids among ∼300,000 multi-ethnic participants of the Million Veteran Program. Nat. Genet. 50 (11), 1514–1523. doi:10.1038/s41588-018-0222-9
Mohebi, R., Chen, C., Ibrahim, N. E., McCarthy, C. P., Gaggin, H. K., Singer, D. E., et al. (2022). Cardiovascular disease projections in the United States based on the 2020 census estimates. J. Am. Coll. Cardiol. 80 (6), 565–578. doi:10.1016/j.jacc.2022.05.033
Noubiap, J. J. N., Nansseu, J. R. N., Bigna, J. J. R., Jingi, A. M., and Kengne, A. P. (2015). Prevalence and incidence of dyslipidaemia among adults in africa: A systematic review and meta-analysis protocol. BMJ Open 5 (3), e007404. doi:10.1136/bmjopen-2014-007404
Pilia, G., Chen, W. M., Scuteri, A., Orrú, M., Albai, G., Dei, M., et al. (2006). Heritability of cardiovascular and personality traits in 6,148 Sardinians. PLoS Genet. 2 (8), e132. doi:10.1371/journal.pgen.0020132
Prabhakaran, D., Roy, A., Praveen, P. A., Ramakrishnan, L., Gupta, R., Amarchand, R., et al. (2017). 20-Year trend of CVD risk factors: urban and rural national capital region of India. Glob. Heart 12 (3), 209–217. doi:10.1016/j.gheart.2016.11.004
Pranavchand, R., and Reddy, B. M. (2017). Quantitative trait loci at the 11q23.3 chromosomal region related to dyslipidemia in the population of Andhra Pradesh, India. Lipids Health Dis. 16 (1), 116. doi:10.1186/s12944-017-0507-5
Rafiq, S., Venkata, K. K. M., Gupta, V., Vinay, D. G., Spurgeon, C. J., Parameshwaran, S., et al. (2012). Evaluation of seven common lipid associated loci in a large Indian sib pair study. Lipids Health Dis. 11, 155. doi:10.1186/1476-511x-11-155
Sanghera, D. K., Hopkins, R., Malone-Perez, M. W., Bejar, C., Tan, C., Mussa, H., et al. (2019). Targeted sequencing of candidate genes of dyslipidemia in punjabi sikhs: population-specific rare variants in GCKR promote ectopic fat deposition. PLoS One 14 (8), e0211661. doi:10.1371/journal.pone.0211661
Teslovich, T. M., Musunuru, K., Smith, A. V., Edmondson, A. C., Stylianou, I. M., Koseki, M., et al. (2010). Biological, clinical and population relevance of 95 loci for blood lipids. Nature 466 (7307), 707–713. doi:10.1038/nature09270
Walia, G. K., Gupta, V., Aggarwal, A., Asghar, M., Dudbridge, F., Timpson, N., et al. (2014). Association of common genetic variants with lipid traits in the Indian population. PLoS One 9 (7), e101688. doi:10.1371/journal.pone.0101688
Weiss, L. A., Pan, L., Abney, M., and Ober, C. (2006). The sex-specific genetic architecture of quantitative traits in humans. Nat. Genet. 38 (2), 218–222. doi:10.1038/ng1726
Keywords: lipids, India, genetic variants, polygenic risk scores, weighted genetic risk scores
Citation: Walia GK, Panniyammakal J, Agarwal T, Jalal R, Gupta R, Ramakrishnan L, Tandon N, Roy A, Krishnan A and Prabhakaran D (2024) Evaluation of genetic variants related to lipid levels among the North Indian population. Front. Genet. 14:1234693. doi: 10.3389/fgene.2023.1234693
Received: 05 June 2023; Accepted: 31 August 2023;
Published: 29 January 2024.
Edited by:
Giovanni Malerba, University of Verona, ItalyReviewed by:
Szilvia Fiatal, University of Debrecen, HungaryCecilia Contreras-Cubas, National Institute of Genomic Medicine (INMEGEN), Mexico
Copyright © 2024 Walia, Panniyammakal, Agarwal, Jalal, Gupta, Ramakrishnan, Tandon, Roy, Krishnan and Prabhakaran. This is an open-access article distributed under the terms of the Creative Commons Attribution License (CC BY). The use, distribution or reproduction in other forums is permitted, provided the original author(s) and the copyright owner(s) are credited and that the original publication in this journal is cited, in accordance with accepted academic practice. No use, distribution or reproduction is permitted which does not comply with these terms.
*Correspondence: Gagandeep Kaur Walia, Z2thdXJ3QGdtYWlsLmNvbQ==, Z2FnYW5kZWVwLmsud2FsaWFAcGhmaS5vcmc=
†These authors have contributed equally to this work