 Huimin Jiang1
 Jihui Zhang
94% of researchers rate our articles as excellent or good
Learn more about the work of our research integrity team to safeguard the quality of each article we publish.
Find out more
ORIGINAL RESEARCH article
Front. Genet., 26 July 2023
Sec. Computational Genomics
Volume 14 - 2023 | https://doi.org/10.3389/fgene.2023.1223243
This article is part of the Research TopicGenetic and non-genetic Determinants of InflammationView all 5 articles
Background: Lactate, as an essential clinical evaluation index of septic shock, is crucial in the incidence and progression of septic shock. This study aims to investigate the differential expression, regulatory relationship, clinical diagnostic efficacy, and immune infiltration of lactate metabolism-related genes (LMGs) in septic shock.
Methods: Two sepsis shock datasets (GSE26440 and GSE131761) were screened from the GEO database, and the common differentially expressed genes (DEGs) of the two datasets were screened out. LMGs were selected from the GeneCards database, and lactate metabolism-related DEGs (LMDEGs) were determined by integrating DEGs and LMGs. Protein-protein interaction networks, mRNA-miRNA, mRNA-RBP, and mRNA-TF interaction networks were constructed using STRING, miRDB, ENCORI, and CHIPBase databases, respectively. Receiver operating characteristic (ROC) curves were constructed for each of the LMDEGs to evaluate the diagnostic efficacy of the expression changes in relation to septic shock. Finally, immune infiltration analysis was performed using ssGSEA and CIBERSORT.
Results: This study identified 10 LMDEGs, including LDHB, STAT3, LDHA, GSR, FOXM1, PDP1, GCDH, GCKR, ABCC1, and CDKN3. Enrichment analysis revealed that DEGs were significantly enriched in pathways such as pyruvate metabolism, hypoxia pathway, and immune-inflammatory pathways. PPI networks based on LMDEGs, as well as 148 pairs of mRNA-miRNA interactions, 243 pairs of mRNA-RBP interactions, and 119 pairs of mRNA-TF interactions were established. ROC curves of eight LMDEGs (LDHA, GSR, STAT3, CDKN3, FOXM1, GCKR, PDP1, and LDHB) with consistent expression patterns in two datasets had an area under the curve (AUC) ranging from 0.662 to 0.889. The results of ssGSEA and CIBERSORT both showed significant differences in the infiltration of various immune cells, including CD8 T cells, T regulatory cells, and natural killer cells, and LMDEGs such as STAT3, LDHB, LDHA, PDP1, GSR, FOXM1, and CDKN3 were significantly associated with various immune cells.
Conclusion: The LMDEGs are significantly associated with the immune-inflammatory response in septic shock and have a certain diagnostic accuracy for septic shock.
Sepsis is life-threatening and caused 19.7% of all deaths across the world in 2017 (Rudd et al., 2020). When sepsis causes systemic vasodilation and subsequent tissue hypoperfusion, septic shock occurs, which is characterized by hypotension and tissue hypoperfusion (Singer et al., 2016; Kanjee et al., 2023). Septic shock is the direct cause of death in sepsis, and once it occurs, the short-term mortality rate can be as high as 52% (Pavon et al., 2013). The new definition of sepsis emphasizes that instead of the infection itself, dysregulated host response to the infection is what drives the development of disease (Singer et al., 2016). However, many drugs aimed at blocking inflammation and regulating immunity that have been proposed based on this definition have not been observed to have the expected therapeutic benefits in clinical studies (van der Poll et al., 2017). Therefore, exploring the mechanisms of sepsis progression to shock from other perspectives and identifying potential therapeutic targets may be of great significance in reducing its mortality rate.
As is widely known, in patients suffering from sepsis, especially septic shock, lactate levels are often significantly elevated and closely related to the severity of the condition and the prognosis (Casserly et al., 2015). In fact, in the progression of sepsis, blood lactate serves not only as a marker of organ perfusion and tissue hypoxia, but also participates in the progression of sepsis to shock and death through multiple signaling pathways, such as regulating energy metabolism and immune inflammatory responses (Brooks et al., 2022). An animal experiment demonstrated that intraperitoneal injection of lactate to mice with lactate clearance impairment directly resulted in their death, whereas intraperitoneal injection of the maximum tolerated dose of lactate to normal mice did not (Vandewalle et al., 2021). It is evident that the accumulation of lactate in the body can directly cause organ dysfunction and even death. On the one hand, lactate can decrease effective circulating blood volume and aggravate organ dysfunction by dilating blood vessels and altering vascular permeability, such as by increasing vascular permeability through lactate receptors GPR81 or targeting VE-cadherin (Yang et al., 2022a; Yang et al., 2022b). On the other hand, lactate participates in essential steps of immune cell energy metabolism, differentiation, migration, and the release of inflammatory factors in the uncontrolled inflammation response of sepsis. During the excessive immune response period of sepsis, in order to solve the problem of enormous energy demand, the vast majority of immune cells switch from oxidative phosphorylation to glycolysis and produce lactate through metabolic reprogramming, despite the low efficiency of glycolysis compared to oxidative phosphorylation (Ye et al., 2022). However, the accumulation of lactate can in turn inhibit the glycolysis of monocytes (Dietl et al., 2010). Lactate can induce the differentiation direction of naive CD4+ T cells and increase the percentage of Treg cells (Comito et al., 2019), regulate the polarization of macrophage M2 (Colegio et al., 2014), and also limit antigen presentation and migration of dendritic cells (Puig-Kroger et al., 2003; Gottfried et al., 2006). Through GPR81-mediated YAP inactivation, lactate can prevent the synthesis of cytokines that promote inflammation in macrophages (Brand et al., 2016), and high levels of lactate additionally reduce the synthesis of cytokines in NK and T cells and cause immune cell death (Husain et al., 2013; Brand et al., 2016; Long et al., 2018).
Given the significant function of lactate in the onset and progression of septic shock, this research aims to use bioinformatics methods to identify lactate metabolism-related differentially expressed genes (LMDEGs) from datasets related to septic shock. The study will analyze the functional signaling pathways and regulatory networks enriched by these genes, their diagnostic efficacy, and the relationship with immune infiltration.
The R package GEOquery (Davis and Meltzer, 2007) was utilized to download two Homo sapiens data sets, GSE26440 (Wong, 2012) and GSE131761 (Martinez-Paz et al., 2021), from the GEO database (Barrett et al., 2007). The GSE26440 data set (platform: GPL570 [HG-U133_Plus_2] Affymetrix Human Genome U133 Plus 2.0 Array) comprised 130 whole blood samples, of which 98 were from septic shock patients and 32 from healthy people. The GSE131761 data set (platform: GPL13497 Agilent-026652 Whole Human Genome Microarray 4x44K v2) was composed of 129 whole blood samples, including 81 septic shock patients, 33 patients in shock caused by other factors, and 15 healthy people.
The GPL files were used to annotate all the probe sets. In the subsequent analysis, all expression profile data samples in GSE26440, consisting of 98 whole blood samples from patients with septic shock (septic shock group) and 32 whole blood samples from matched normal controls (control group), were included. Additionally, in GSE131761, the whole blood expression profile data samples of patients, who were experiencing septic shock or other types of shock were also included in the following analysis. This set comprised 81 whole blood samples from patients with septic shock (septic shock group) and 33 matched whole blood samples from non-septic shock patients (control group). In septic shock, lactate may not solely be a consequence of circulatory dysfunction but could potentially serve as a causative factor, actively participating in the dysregulated immune-inflammatory response during some early stage of sepsis, thus promoting the onset of shock. Conversely, in other types of shock present in this dataset, such as cardiogenic shock, lactate is more likely to be a consequence of inadequate effective circulating volume. Therefore, utilizing this dataset to compare the differential gene regulation of lactate production and clearance between septic shock and non-septic shock patients would be more advantageous in eliminating the overlapped lactate-regulating genes due to circulation dysfunction during the shock phase. With the exception of the 15 healthy individual samples that were excluded from the dataset GSE131761, all gene expression levels encompassing both datasets were incorporated in the present investigation, thereby precluding any instances of data omission. More thorough specifics about the data sets are offered in Table 1.
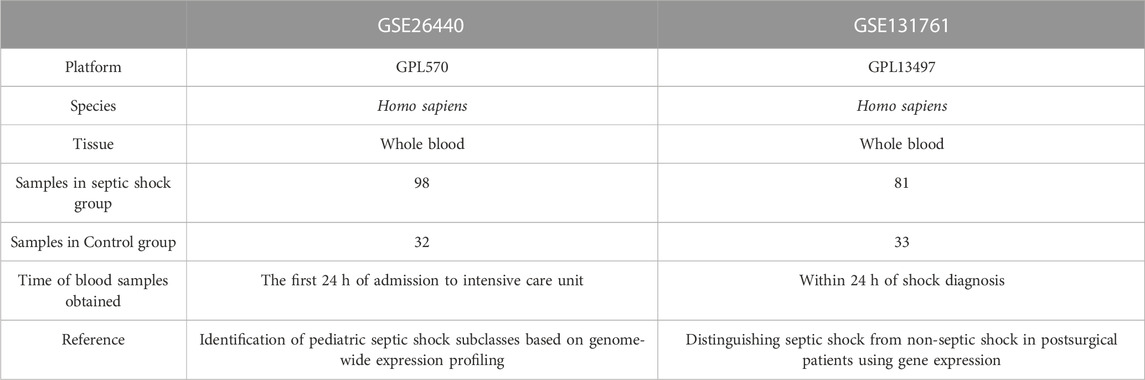
TABLE 1. Septic shock data set information list.
Additionally, we gathered lactate metabolism-related genes (LMGs) connected to lactate metabolism via GeneCards. Moreover, we obtained LMGs from the GeneCards (https://www.genecards.org/), which provides detailed information on human genes (https://www.genecards.org/) (Stelzer et al., 2016). We searched for “Lactate Metabolism” as the keyword and filtered for “Protein Coding” LMGs to obtain 50 LMGs, as presented in Table 2.
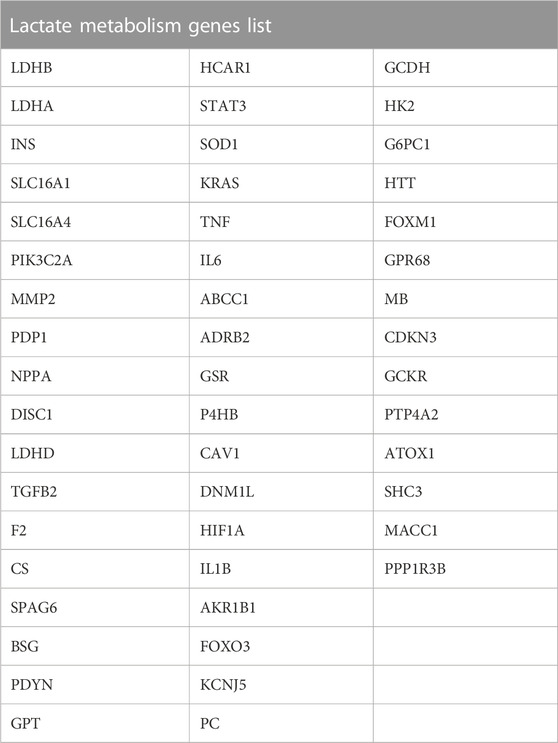
TABLE 2. Lactate Metabolism genes list.
To identify differentially expressed genes (DEGs) associated with septic shock, we employed the limma package to normalize the data sets GSE26440 and GSE131761. Subsequently, limma package was utilized to perform differential analysis on the datasets GSE26440 and GSE131761 to determine DEGs between various groups. We set |LogFC| >0 and P.adj < 0.05 as the threshold for selecting DEGs for further investigation. Genes exhibiting logFC > 0 and P.adj < 0.05 were classified as upregulated, whereas those with logFC < 0 and P.adj < 0.05 were designated as downregulated.
To identify lactate metabolism-related differentially expressed genes (LMDEGs) in septic shock, we performed several steps. Firstly, we obtained DEGs with |logFC| > 0 and P.adj < 0.05 from the GSE26440 and GSE131761 datasets. Then, to find the common DEGs, we created a Venn diagram using the intersection of these DEGs from both datasets. Next, we intersected the common DEGs with the LMGs obtained from the GeneCards database to obtain the LMDEGs, which were also represented in a Venn diagram. The R package ggplot2 for the volcanic map and pheatmap for the heat map were chose to present the outcomes of various analyses.
R package clusterProfiler was utilized to perform KEGG and GO (Yu et al., 2012), We considered P.adj < 0.05 and FDR values (q.value) < 0.05 to be statistically significant entry screening criteria. The Benjamin Hochberg method was used for p-value correction.
In this study, we employed GSEA to investigate the contribution of predefined gene sets to the phenotype by assessing the distribution trend of genes (Subramanian et al., 2005). The following GSEA parameters were chosen: Benjamini–Hochberg p-value correction, a seed of 2020, a calculation number of 1000, a minimum of 10 genes per gene set, a maximum of 500 genes, and a minimum of 10 genes per gene set. From the MSigDB (Liberzon et al., 2015), we obtained the c2.cp.all.v2022.1.Hs.symbols.gmt [All Canonical Pathways] (3050) gene set. We used P.adj < 0.05 and FDR value < 0.05 as screening criteria for significant enrichment.
Numerous biological functions, including signal transmission, gene control, metabolism, and cell cycle regulation, rely on PPI networks. The STRING database is a comprehensive resource for investigating known and predicted PPIs (Szklarczyk et al., 2019). In this study, we employed the STRING database to construct a PPI network with a minimum required interaction score of low confidence (0.150) and visualised the PPI network model using Cytoscape version 3.9.1.
The miRDB database is a tool for predicting miRNA target genes and providing functional annotations (Chen and Wang, 2020). In this study, we utilized the miRDB database to predict miRNAs that interact with LMDEGs. We then identified mRNA-miRNA interaction pairs with a Target Score ≥80 from the miRDB database interaction network.
The ENCORI database (version 3.0) is a comprehensive platform that provides diverse visual interfaces for exploring miRNA targets, based on data mining of CLIP-seq and degradome sequencing (for plants) (Li et al., 2014). In this study, the mRNA-RBP interaction network was built using the ENCORI database to predict the RNA-RBP interactions with LMDEGs.
Millions of transcription factors and genes can be predicted to have transcriptional regulatory interactions using the CHIPBase database, version 3.0 (https://rna.sysu.edu.cn/chipbase/) (Zhou et al., 2017). Additionally, the hTFtarget database (http://bioinfo.life.hust.edu.cn/hTFtarget) is a comprehensive database with information on human TFs and their associated regulating targets (Zhang et al., 2020). In this study, we utilized the above-mentioned two databases to identify TFs that bind to LMDEGs. The resulting data were visualized using Cytoscape software.
ROC is a coordinate graph analysis tool that can be used to select the best model, discard suboptimal models, or set optimal thresholds within the same model (Mandrekar, 2010). By using the construction method, ROC curves reflect the relationship between sensitivity and specificity of continuous variables. The area under the curve (AUC) ranges between 0.5 and 1, where a higher AUC signifies better diagnostic performance. To evaluate the diagnostic effectiveness of LMDEGs on septic shock, we drew the ROC using the R package “proc” and calculated the AUC for the GSE26440 and GSE131761 datasets.
The single-sample gene-set enrichment analysis (ssGSEA), employing 28 gene sets from published literature to identify various human immune cell subtypes is a well-established method for identifying and quantifying tumour-infiltrating immune cell subtypes in the tumour microenvironment (Bindea et al., 2013). In this study, we utilized the ssGSEA algorithm, available in the R package GSVA, to compute the enrichment scores, which represent the infiltration levels of different immune cell types in each sample. We displayed the differences in immune infiltration by box plots and computed the correlation between immune cells and LMDEGs using gene expression matrices from GSE26440 and GSE131761. Furthermore, we generated a correlation heatmap plot using the R package pheatmap to visualize the relationship between immune cells and LMDEGs.
CIBERSORT is an algorithm for immune infiltration analysis that uses linear support vector regression to deconvolve transcriptional expression matrices, enabling estimate of immune cell population composition and abundance in mixed cell populations (Newman et al., 2015). We uploaded the whole blood sample matrix data from the septic shock and control groups in the GSE26440 and GSE131761 datasets to CIBERSORT. The differences in immune cell infiltration abundance in GSE26440 and GSE131761 were presented through stacked plots. We calculated Spearman correlation coefficients using the immune cell infiltration levels within different groups and visualized the results using the R package ggplot2. Then, we calculated the correlation between immune cells and LMDEGs using the gene expression matrices from GSE26440 and GSE131761 and displayed the results using a heatmap plot generated by the R package pheatmap.
All data processing and analysis in this study were performed using R (Version 4.1.2). Continuous variables were reported as mean ± standard deviation. For comparing two groups, Wilcoxon rank sum tests were used, and Kruskal–Wallis tests were used for comparing three or more groups. The chi-square or Fisher’s exact test was employed to examine the statistical significance between two categorical variables. Unless otherwise indicated, Spearman correlation analysis was performed to calculate the correlation coefficient between different molecules, and all results were considered statistically significant when the p-value was less than 0.05.
The entire research process is depicted in Figure 1.
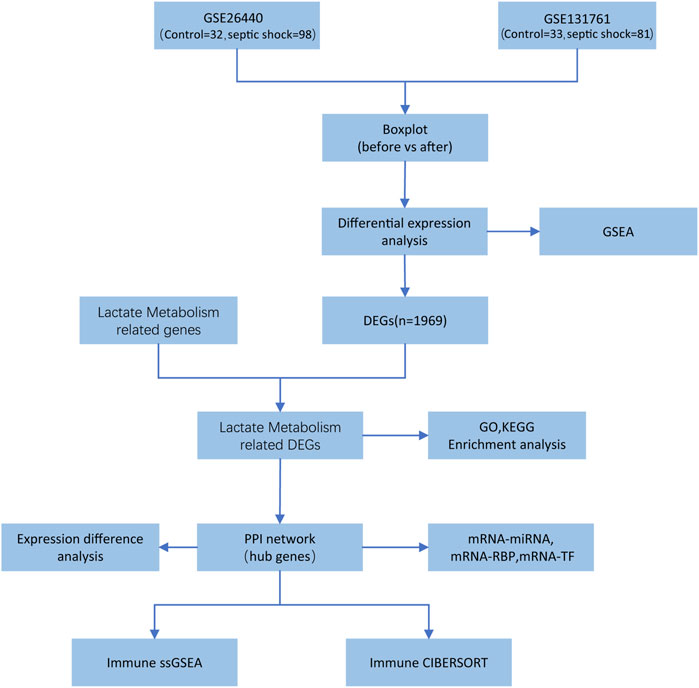
FIGURE 1. Flowchart of data analysis.
We initially normalised two septic shock datasets, GSE26440 and GSE131761, using the R package limma. The GSE26440 dataset comprised of 130 samples, including 98 septic shock samples (labelled as “Septic shock”) and 32 normal samples (labelled as “Control”) (Figures 2A, B). Likewise, the GSE131761 dataset comprised of 114 samples, with 81 septic shock samples (labelled as “Septic shock”) and 33 other types of shock samples (labelled as “Control”) (Figures 2C, D). As illustrated in Figures 2A–D, after normalisation, the batch effects between samples in both septic shock datasets were substantially mitigated, and the expression profiles of the samples became more consistent.
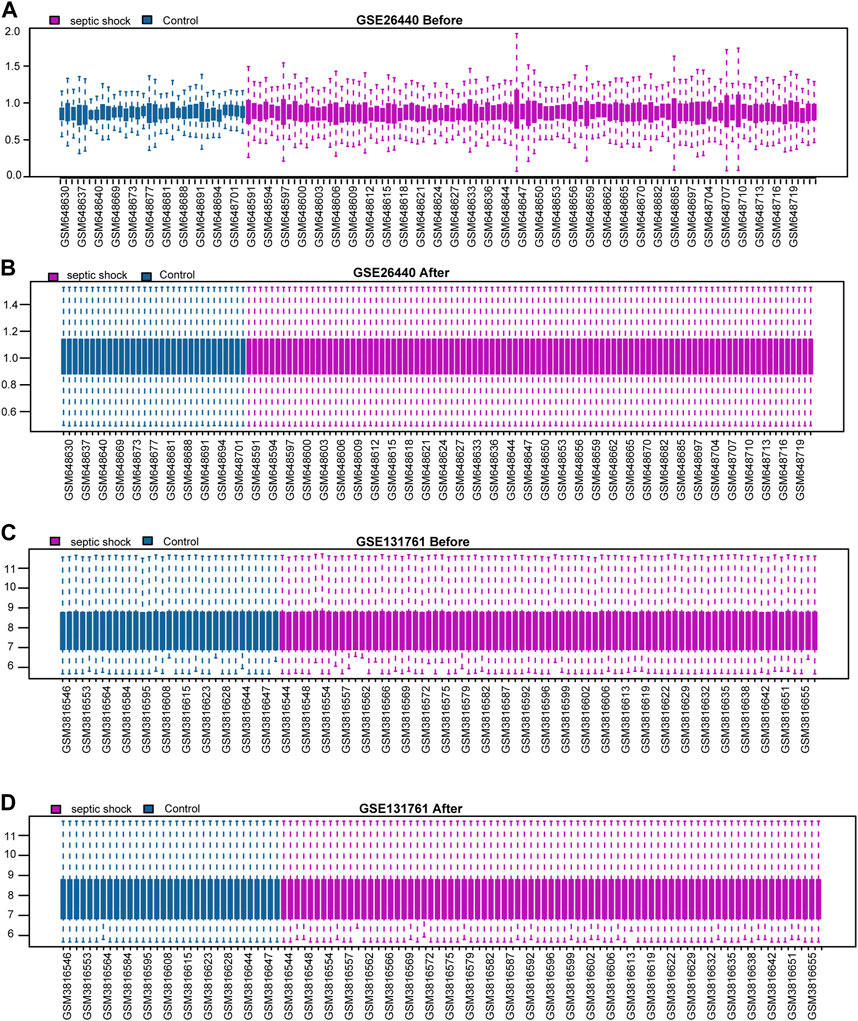
FIGURE 2. Standardization processing of septic shock datasets. (A,B) Boxplots of the GSE26440 dataset before (A) and after (B) normalization. (C,D) Boxplots of the GSE131761 dataset before (C) and after (D) normalization.
In this study, limma package in R was utilized to conduct differential gene expression analysis on the GSE26440 and GSE131761 datasets, aiming to identify DEGs between the septic shock group and the control group. In the GSE26440 dataset, consisting of 130 samples, 21,652 DEGs were identified, with 8,639 genes meeting the criteria of |logFC| > 0 and P.adj < 0.05. Among these genes, 4,799 were upregulated (logFC > 0), and 3,840 were downregulated (logFC < 0) (Figure 3A). We generated a volcano plot to visualize the DEGs. Similarly, in the GSE131761 dataset, consisting of 114 samples, 21,752 DEGs were identified, with 3,783 genes meeting the criteria of |logFC| > 0 and P.adj < 0.05. Among these genes, 1,678 were upregulated (logFC > 0), and 2,105 were downregulated (logFC < 0), and a volcano plot was plotted to visualize the DEGs (Figure 3B). By taking the intersection of all the DEGs with |logFC| > 0 and P.adj < 0.05 from both datasets, we obtained a list of 1,969 common DEGs (Figure 3C). We further intersected these common DEGs with LMGs, resulting in the identification of 10 LMDEGs (Figure 3D), including lactate dehydrogenase B (LDHB), signal transducer and activator of transcription 3 (STAT3), lactate dehydrogenase A (LDHA), glutathione-disulfide reductase (GSR), forkhead box protein M1 (FOXM1), pyruvate dehyrogenase phosphatase catalytic subunit 1 (PDP1), glutaryl-CoA dehydrogenase (GCDH), glucokinase regulatory protein (GCKR), ATP-binding cassette subfamily C member 1 (ABCC1), and cyclin-dependent kinase inhibitor 3 (CDKN3). Heatmaps were generated to visualize the expression differences of these genes in the septic shock group and control group in both datasets (Figures 3E, F). Among the 10 LMDEGs, LDHA, GSR, STAT3, CDKN3, FOXM1, and GCKR were upregulated (logFC > 0) in septic shock groups of both datasets, while PDP1 and LDHB were downregulated (logFC < 0) in septic shock groups of both datasets. ABCC1 and GCDH were downregulated (logFC < 0) in septic shock group of the GSE26440 dataset, but upregulated (logFC > 0) in septic shock group of the GSE131761 dataset.
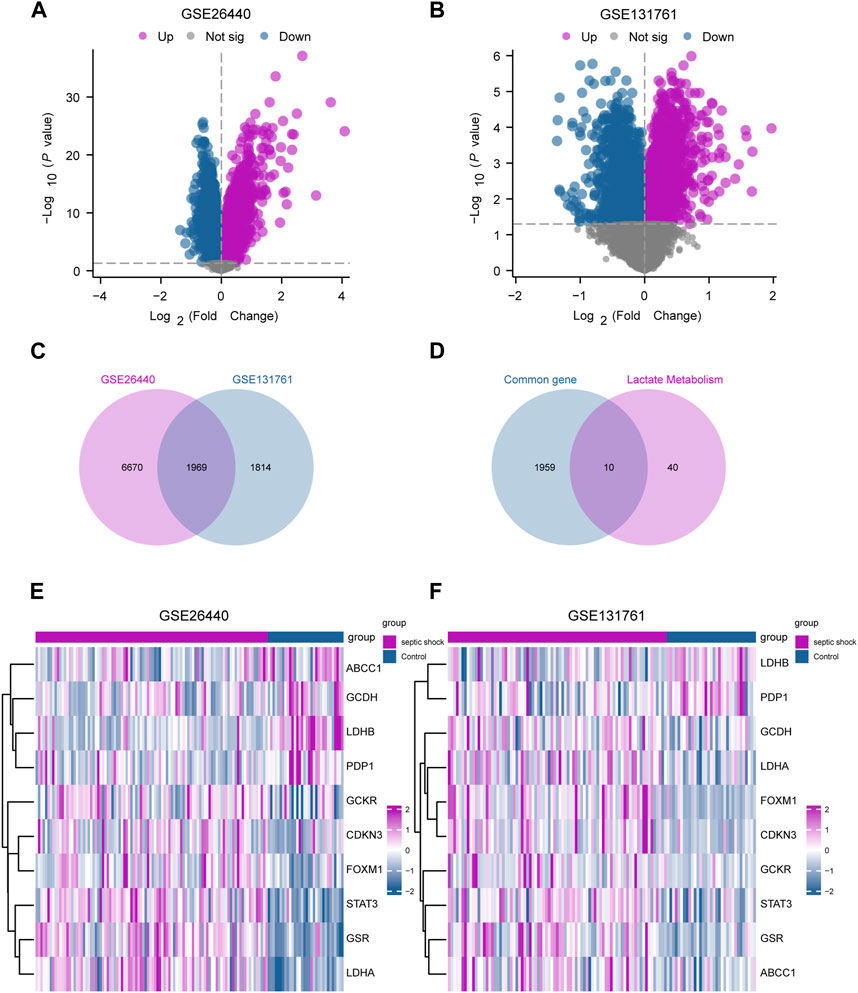
FIGURE 3. Identification of LMDEGs from septic-shock datasets. (A) Volcano plot for DEGs in GSE26440. (B) Volcano plot for DEGs in GSE131761. (C) Venn diagram of DEGs from GSE26440 and GSE131761. (D) Venn diagram of common DEGs and LMGs in the datasets. (E,F) Heatmap of LMDEGs in GSE26440 (E) and GSE131761 (F) LMDEGs: lactate metabolism-related differentially expressed genes; DEGs: differentially expressed genes; LMGs: lactate metabolism-related genes.
Functional enrichment analysis by GO was performed on 10 LMDEGs (Table 3) to understand their biological significance. GO analysis revealed that the LMDEGs were enriched in various biological process (BP), molecular function (MF), and cellular component (CC) during septic shock. The BP analysis showed that the LMDEGs were enriched in metabolic processes, i.e., pyruvate, lactate, nucleotide, and glycolytic metabolism, as well as protein import into the nucleus. The MF enrichment analysis included oxidoreductase activity, acting on the CH-OH group of donors, NAD or NADP as acceptor, flavin adenine dinucleotide binding, acyl-CoA dehydrogenase activity, oxidoreductase activity, acting on a sulfur group of donors, NAD(P) as acceptor, and fatty acid derivative binding. The CC enrichment analysis showed that the oxidoreductase complex and the mitochondrial matrix were the LMDEGs’ principal sites of association. The results of the GO functional enrichment analysis were represented in Figures 4A–C, where the y-axis indicates GO terms, and the x-axis represents -log(P.adj). We also depicted the results of GO functional enrichment analysis in a network diagram (Figures 4D–F).
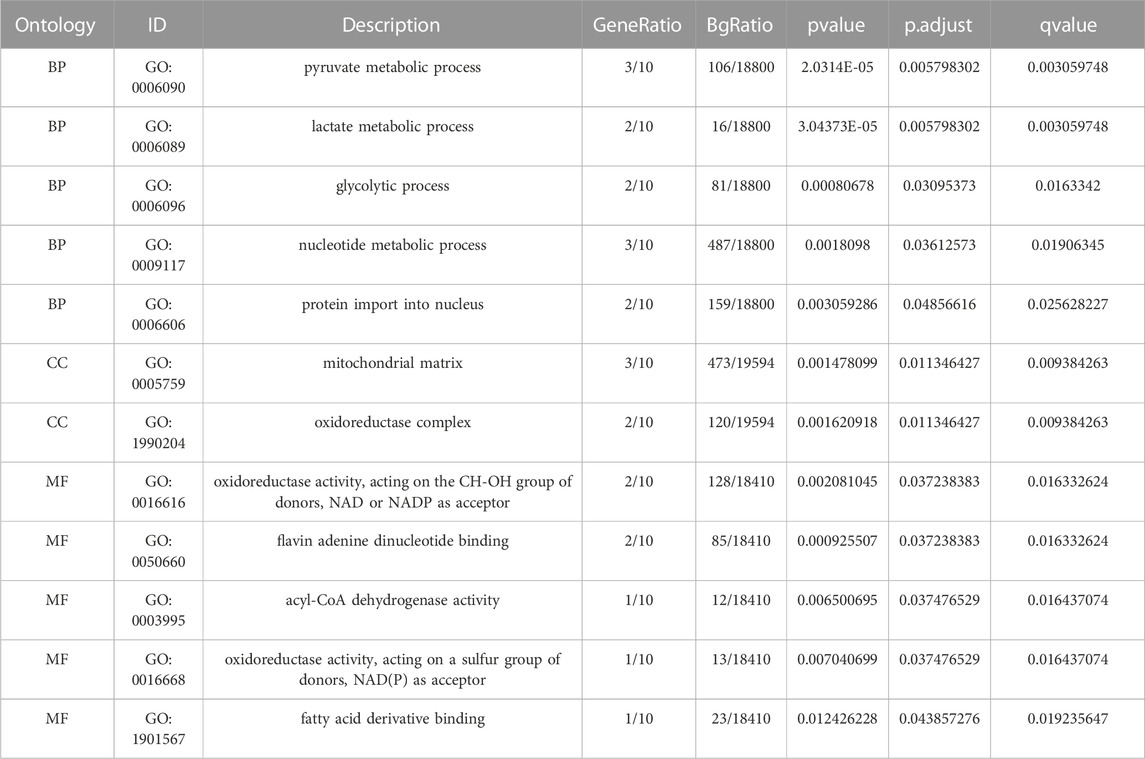
TABLE 3. GO enrichment analysis results.
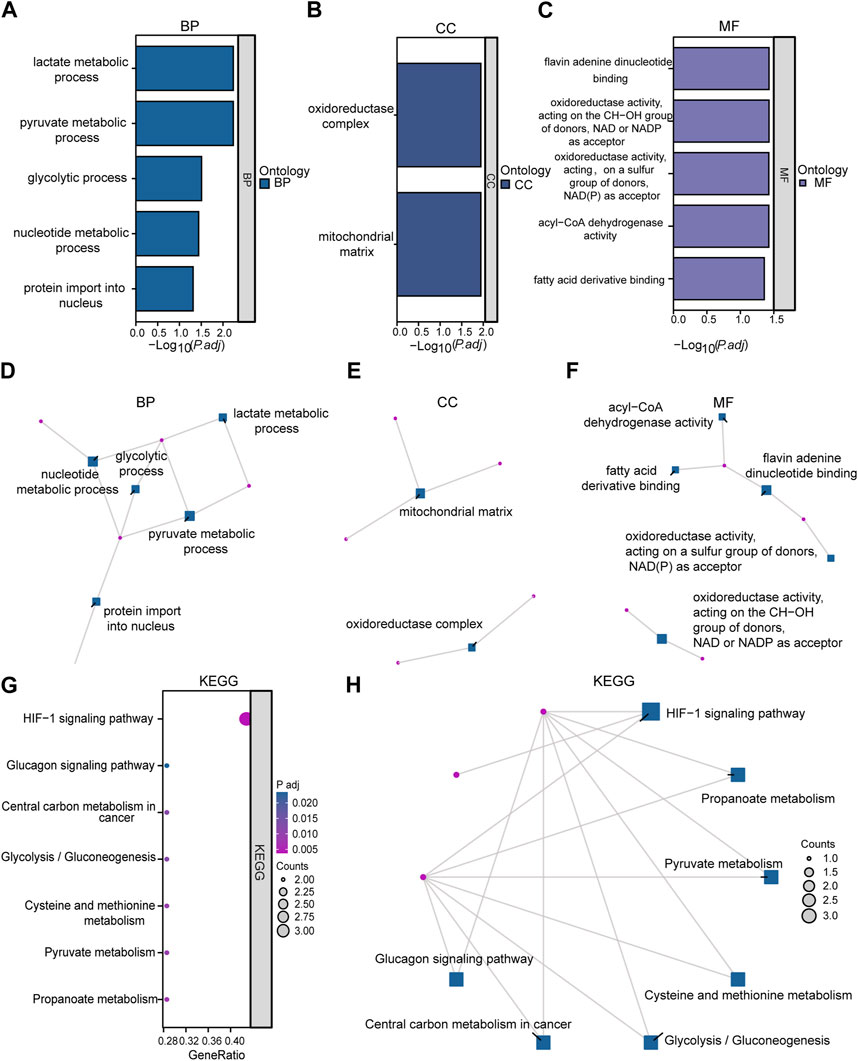
FIGURE 4. Enrichment analysis was performed on LMDEGs using GO and KEGG. (A–C) Column chart showing the results of GO functional enrichment analysis of LMDEGs, including BP (A), CC (B), and MF (C). (D–F) Network diagrams displaying the results of GO functional enrichment analysis of LMDEGs in terms of BP (D), CC (E), and MF (F). G-H. Bubble chart (G) and circular network diagram (H) showing the results of KEGG pathway enrichment analysis of LMDEGs. In the bubble chart (G), the y-axis represents GO terms, bubble color represents adjusted p-values, and bubble size represents the number of molecules included in the GO terms. In the network diagrams (D–F,H) red dots represent specific genes, and blue squares represent specific pathways. The filtering criteria for GO/KEGG enrichment items were P.adj < 0.05 and FDR value (q-value) < 0.05. GO, Gene Ontology; BP, biological process; CC, cellular component; MF, molecular function; KEGG, Kyoto Encyclopedia of Genes and Genomes; LMDEGs, lactate metabolism-related differentially expressed genes.
A pathway enrichment analysis by KEGG database was performed on the 10 LMDEGs identified in the previous section (Table 4), and found that these genes were significantly enriched in 7 KEGG pathways, including the hypoxia-inducible factor-1 (HIF-1) signaling pathway, propanoate metabolism, pyruvate metabolism, and cysteine and methionine metabolism (Figure 4G). To better visualize the results, a circular network diagram was generated (Figure 4H).
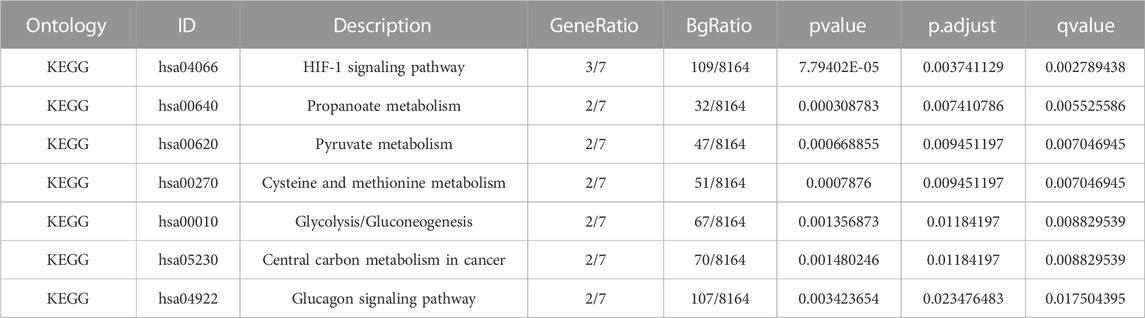
TABLE 4. KEGG enrichment analysis results.
To assess the role of DEGs in the pathogenesis of septic shock, we conducted GSEA on two datasets, GSE26440 and GSE131761 and found that the DEGs in GSE26440 were significantly enriched in multiple pathways, including WP GLYCOLYSIS AND GLUCONEOGENESIS, WP MIRNAS INVOLVEMENT IN THE IMMUNE RESPONSE IN SEPSIS, WP GLYCOGEN SYNTHESIS AND DEGRADATION, and REACTOME INTERLEUKIN 1 FAMILY SIGNALING. The results were presented in Figures 5A–E and Table 5. Likewise, the DEGs in GSE131761 were significantly enriched in various pathways, i.e., REACTOME INTERLEUKIN 1 FAMILY SIGNALING, WP GLYCOGEN SYNTHESIS AND DEGRADATION, WP MIRNAS INVOLVEMENT IN THE IMMUNE RESPONSE IN SEPSIS, and KEGG GLYCOSPHINGOLIPID BIOSYNTHESIS LACTO AND NEOLACTO SERIES, as depicted in Figures 5F–J and Table 6.
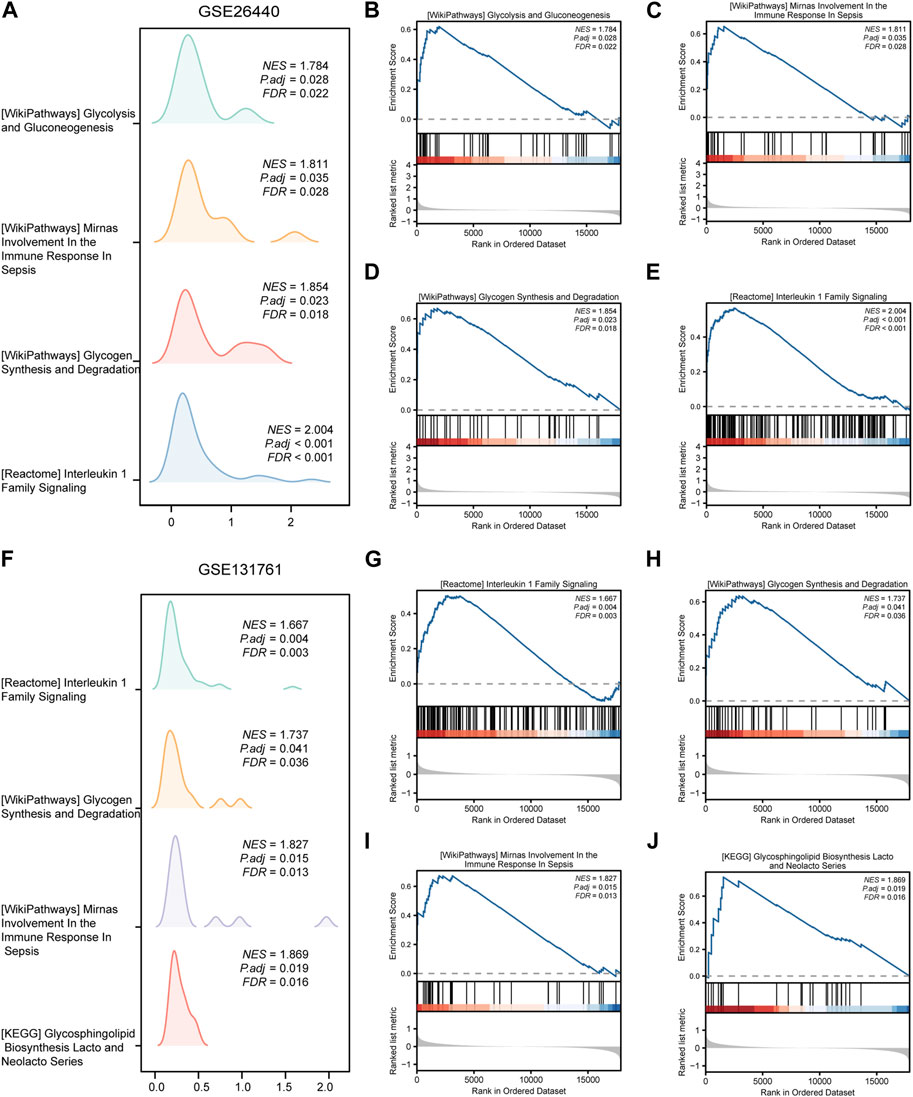
FIGURE 5. Results of gene set enrichment analysis (GSEA) on the septic shock datasets. (A) Four main biological features of GSEA in GSE26440. (B–E) Significant enrichment of DEGs in pathways such as glycolysis and gluconeogenesis (B), miRNAs involvement in the immune response in sepsis (C), glycogen synthesis and degradation (D), reactome interleukin 1 family signaling (E) in the GSE26440 dataset. (F) Four main biological features of GSEA in GSE131761. (G–J) Significant enrichment of DEGs in pathways such as reactome interleukin 1 family signaling (G), glycogen synthesis and degradation (H), mirnas involvement in the immune response in sepsis (I), glycosphingolipid biosynthesis lacto and neolacto series (J) in the GSE131761 dataset. The significant enrichment selection criterion for GSEA is P.adj < 0.05 and FDR value (q-value) < 0.05. GSEA, Gene Set Enrichment Analysis.
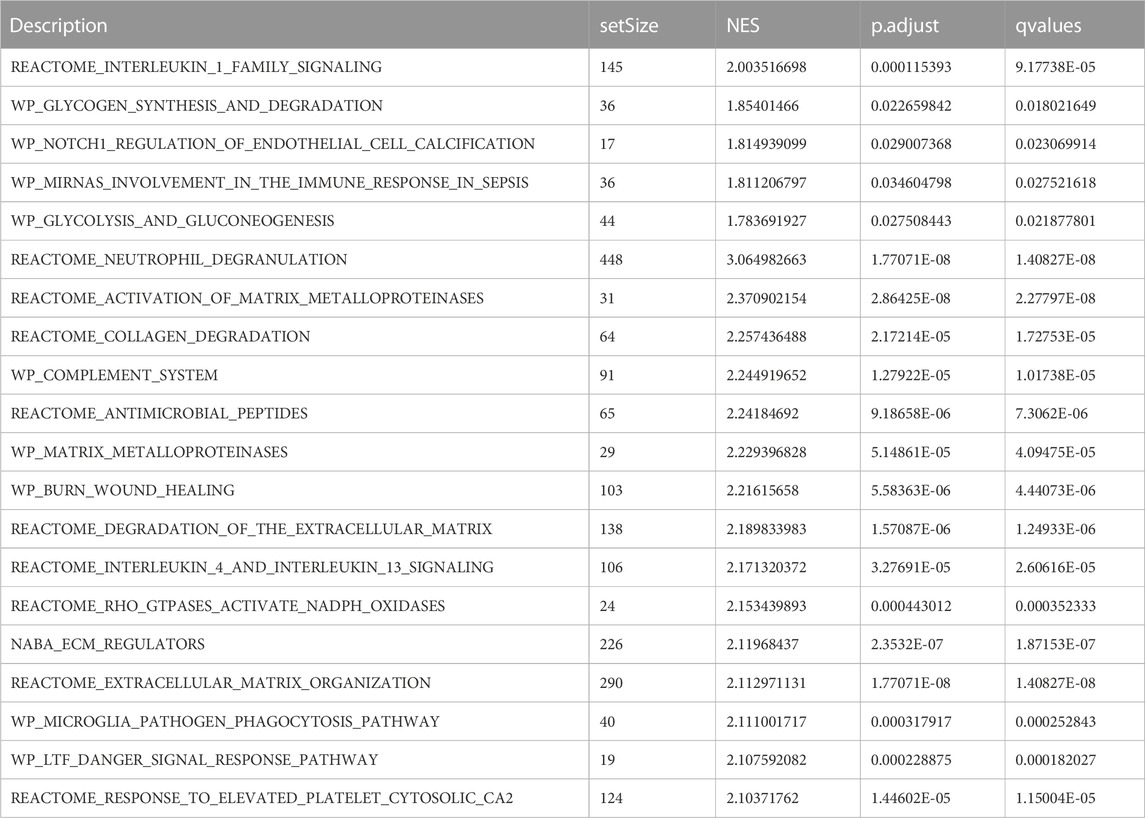
TABLE 5. GSEA enrichment analysis results of GEO- GSE26440 dataset.

TABLE 6. GSEA enrichment analysis results of GEO- GSE131761 dataset.
PPI analysis was conducted on 10 LMDEGs obtained from the GSE26440 and GSE131761 datasets via the STRING database. Cytoscape was used to construct PPI networks for these genes, providing a visual representation of their interaction relationships (Figure 6A). Additionally, To determine the semantic similarity of GO terms, sets of GO terms, gene products, and gene clusters among the LMDEGs, we used the R package GOSemSim, and a boxplot was then used to show the commonalities that resulted from this (Figure 6B).
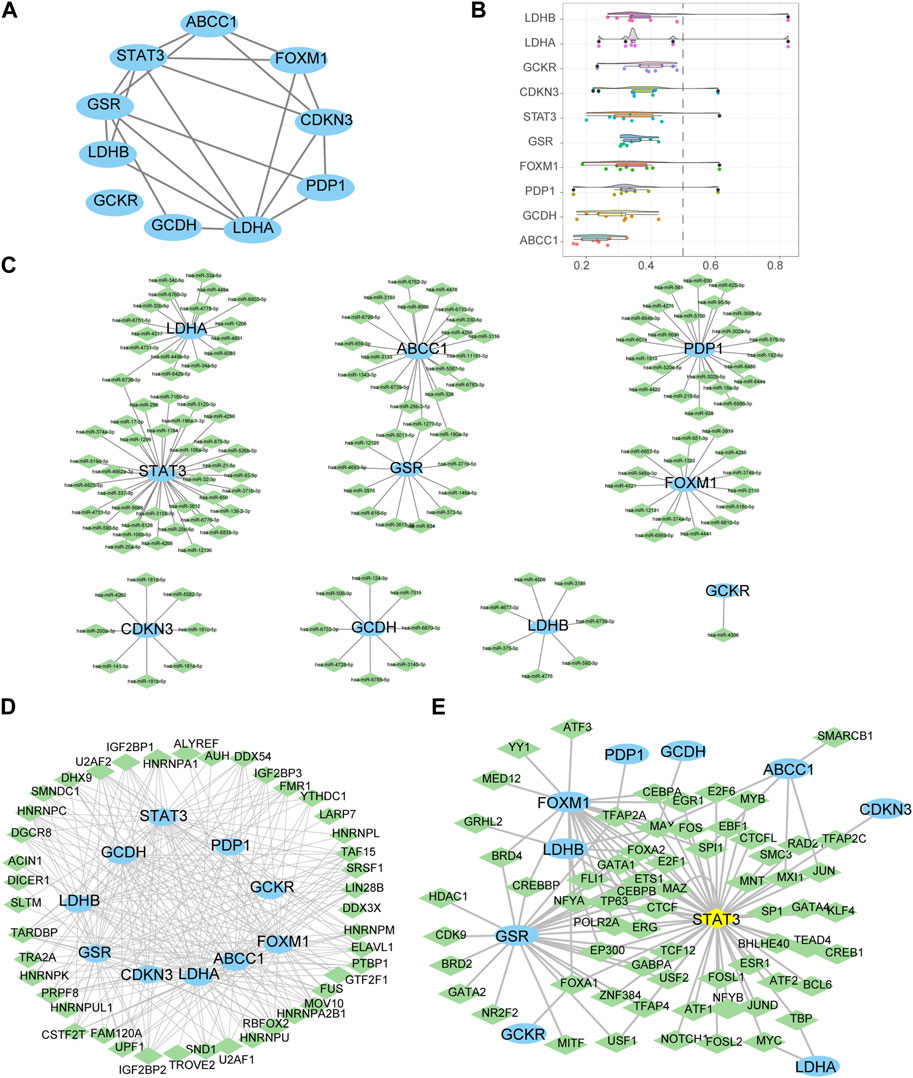
FIGURE 6. Construction of protein-protein, mRNA-miRNA, mRNA-RBP, and mRNA-TF interaction networks for the LMDEGs, as well as their correlation analysis. (A) PPI network of LMDEGs. (B) Friends analysis results of LMDEGs. C-E. mRNA-miRNA (C), mRNA-RBP (D), and mRNA-TF (E) interaction networks of LMDEGs. In the mRNA-miRNA interaction network (C), mRNA is represented by light blue ellipse and miRNA by light green diamond. In the mRNA-RBP interaction network (D), mRNA is represented by light blue circle and RBP by light green diamond. In the mRNA-TF interaction network (E), mRNA is represented by light blue circle, transcription factors (TFs) by light green diamond, and yellow diamond represents mRNA that is also a TF. PPI, Protein-protein interaction; RBP, RNA binding protein; TF, Transcription factors.
In order to investigate the regulatory mechanisms of LMDEGs, we utilized various bioinformatic tools and databases. Firstly, we employed the miRDB database to predict potential miRNAs that could interact with the LMDEGs. Subsequently, we visualized the mRNA-miRNA interaction network using Cytoscape software, which consisted of 10 LMDEGs and 144 miRNA molecules, resulting in 148 pairs of mRNA-miRNA interaction relationships (Figure 6C). The specific details of these interactions are provided in Table 7.
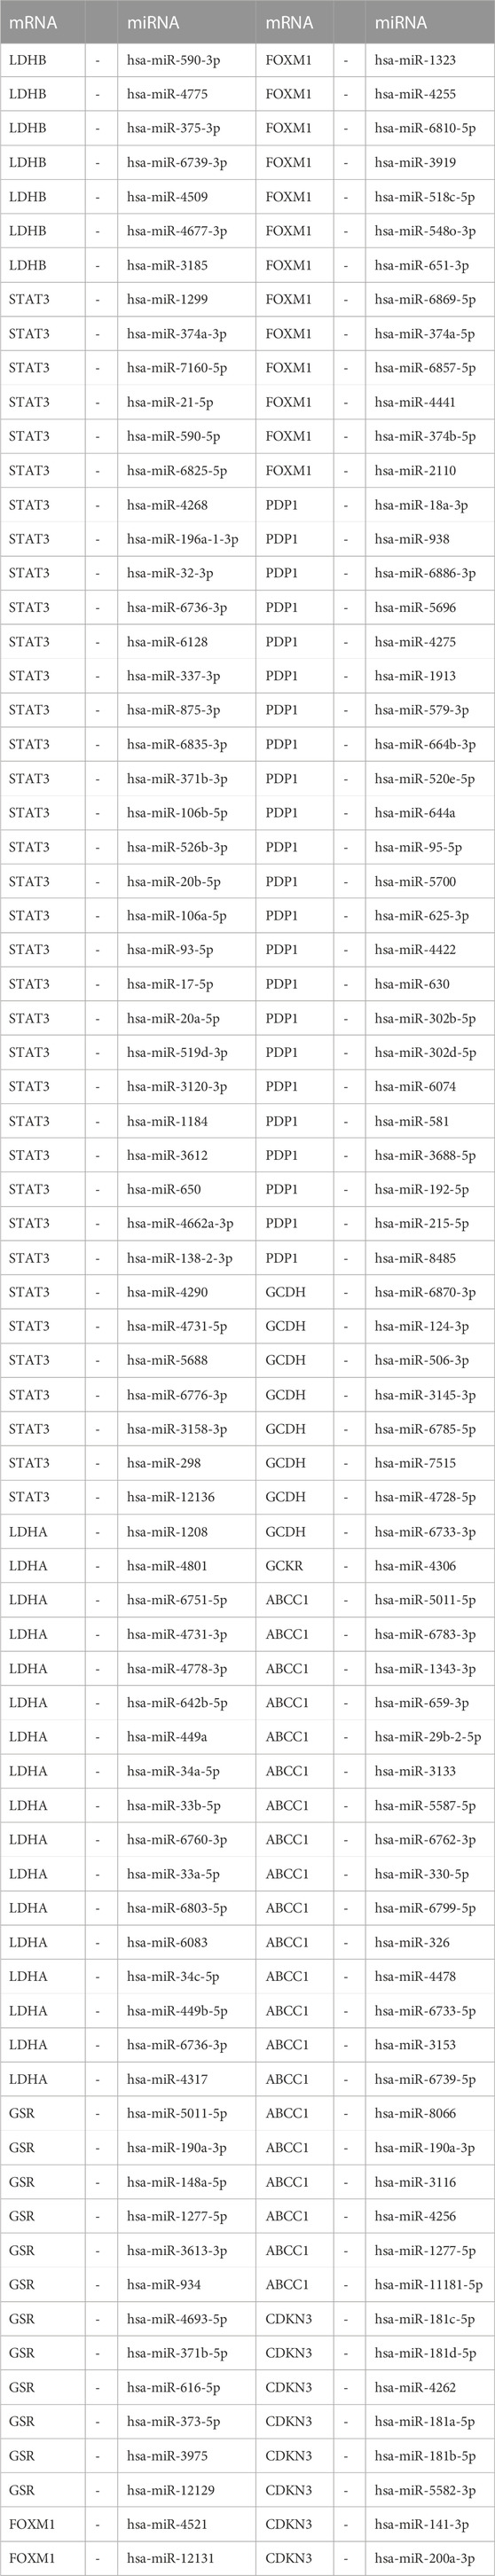
TABLE 7. mRNA-miRNA interaction network nodes.
Next, we utilized the ENCORI database to predict RBPs that may interact with the LMDEGs, and we constructed the mRNA-RBP interaction network by Cytoscape software. This network was comprised of 10 LMDEGs and 43 RBP molecules, which formed a total of 243 pairs of mRNA-RBP interaction relationships (Figure 6D). The detailed information regarding these interactions is listed in Table 8.
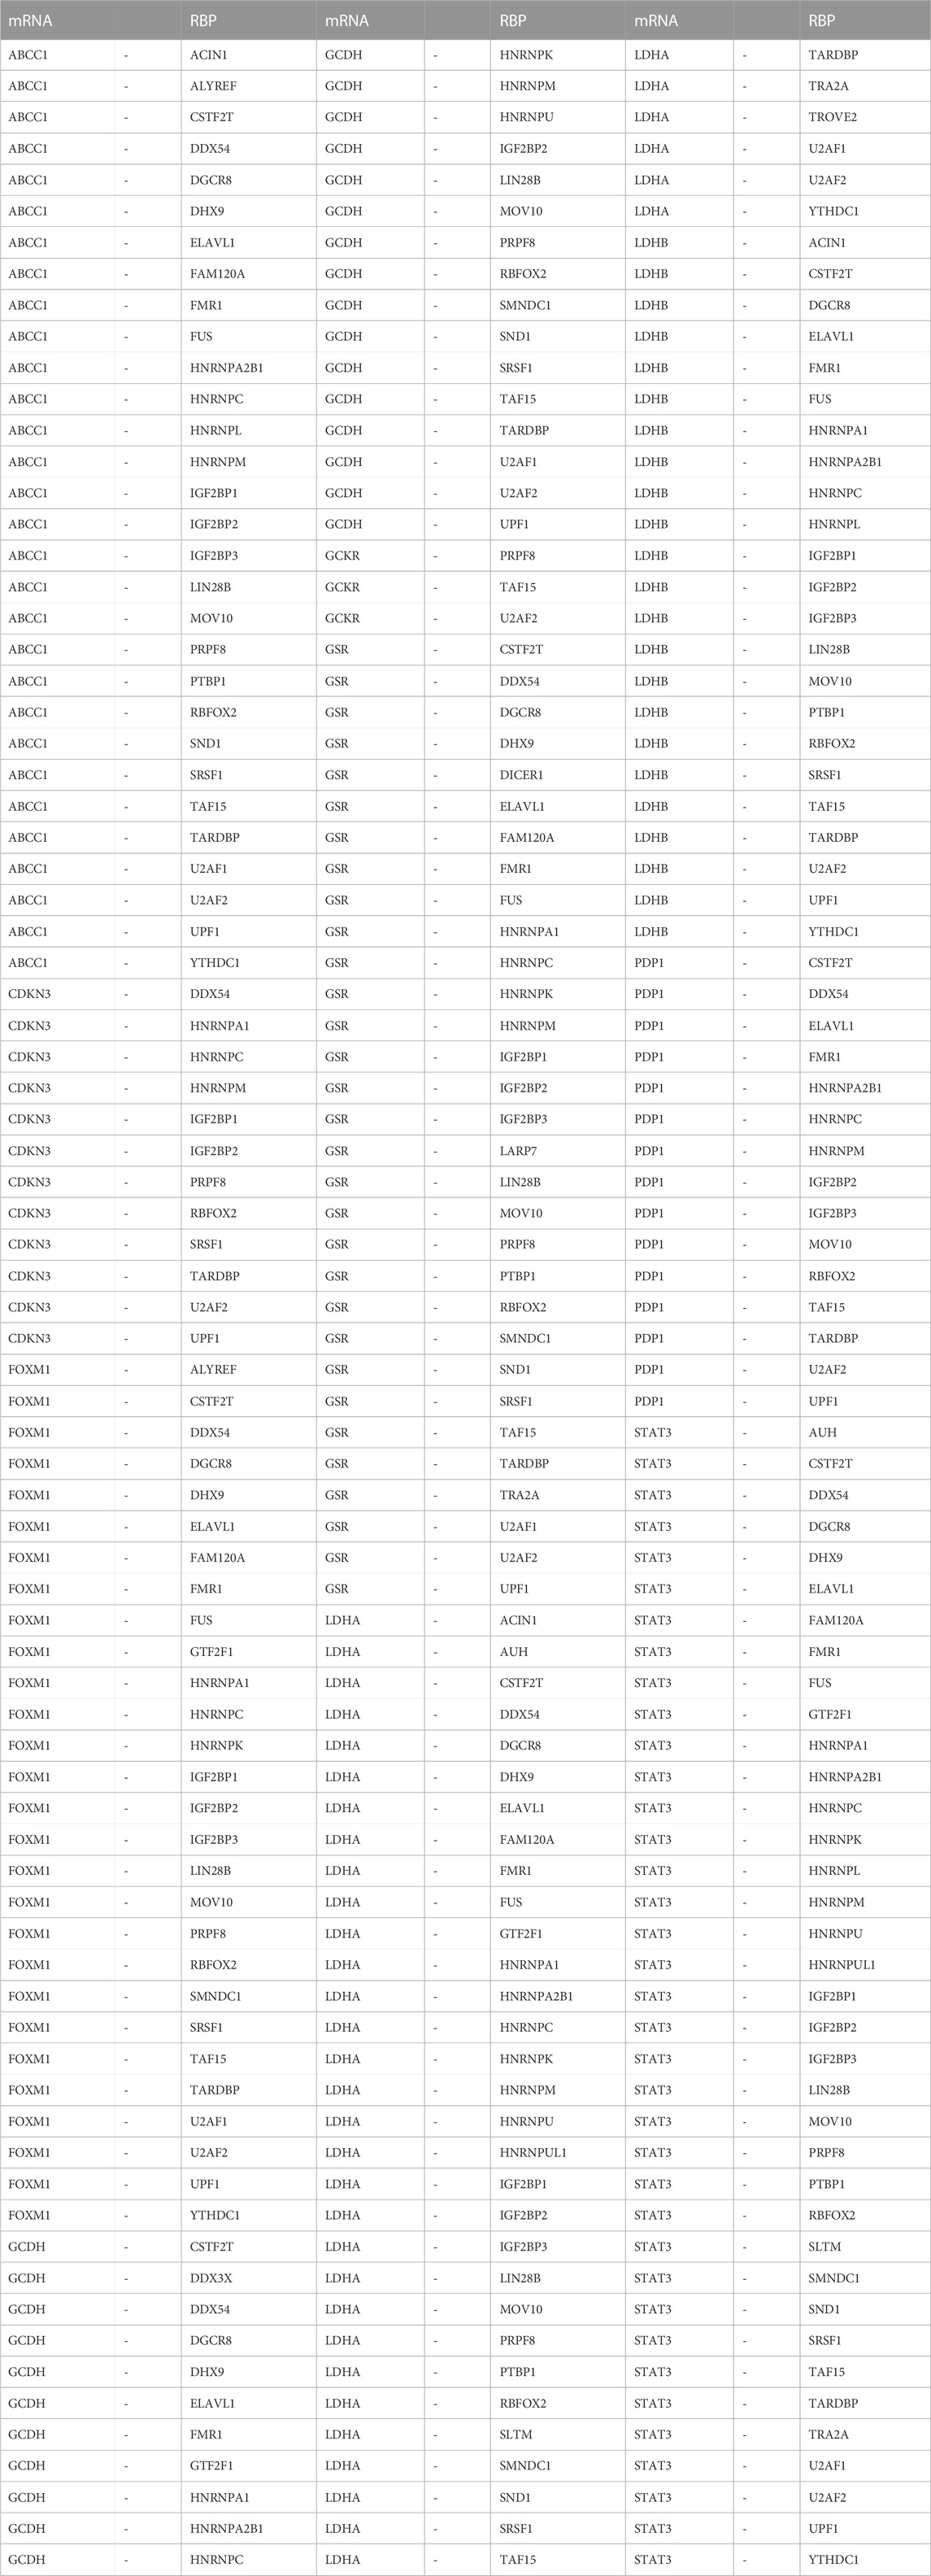
TABLE 8. mRNA-RBP interaction network nodes.
Additionally, we searched the CHIPBase and hTFtarget databases to identify TFs that could potentially interact with the LMDEGs. A total of 67 TFs were identified to have interaction relationships with the LMDEGs, and the mRNA-TF interaction network was constructed by Cytoscape software, consisting of 10 LMDEGs and 67 TFs. In total, 441 pairs of mRNA-TF interaction relationships were observed, with STAT3 showing the most interactions with TFs, comprising 54 pairs of mRNA-TF interaction relationships, since STAT3 was both a gene and a TF (Figure 6E). The detailed mRNA-TF interaction relationships are presented in Table 9.
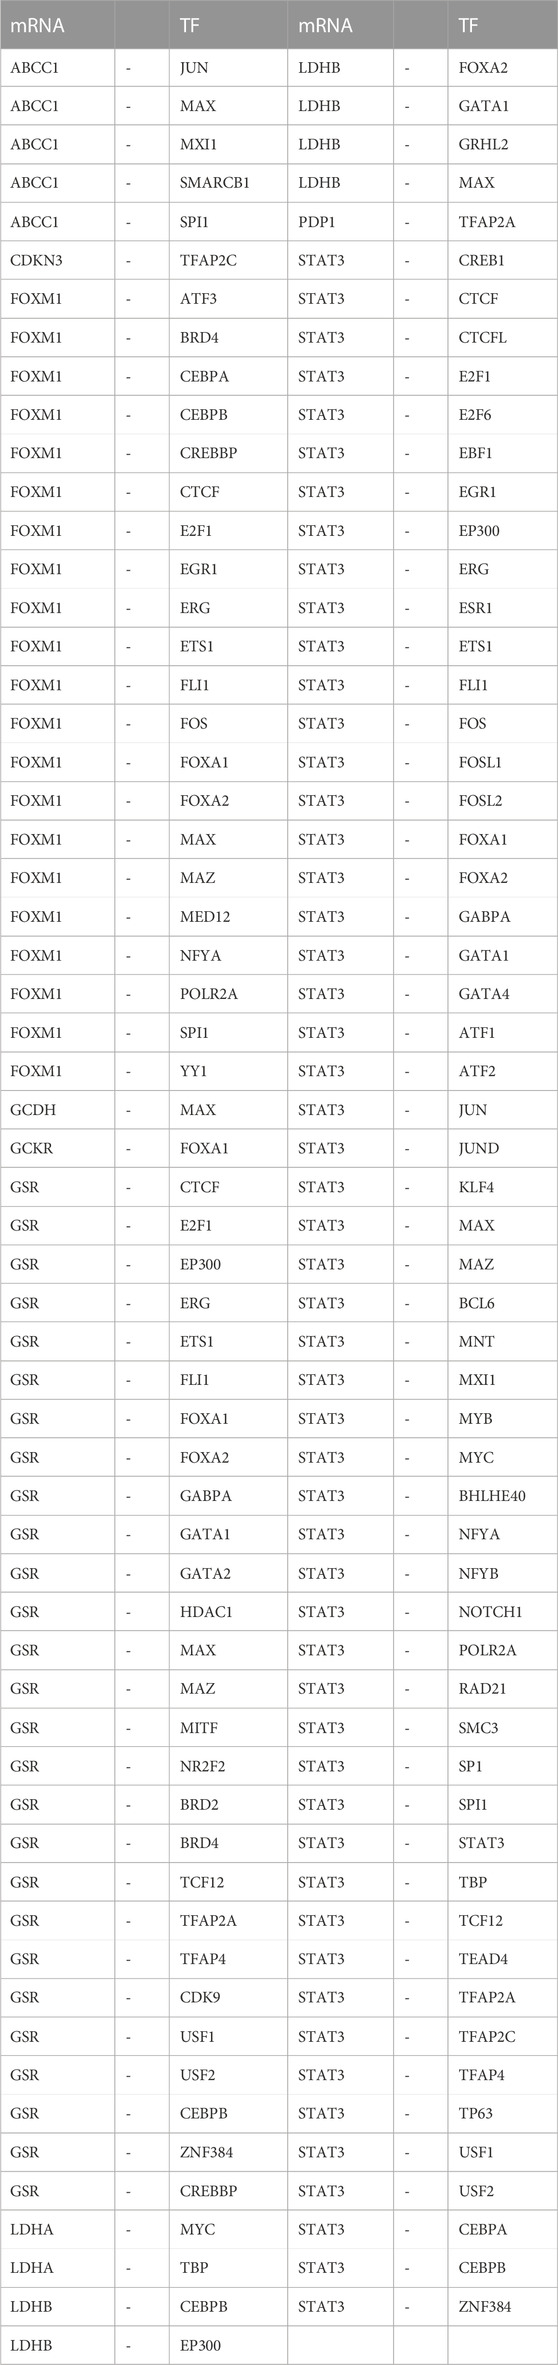
TABLE 9. mRNA-TF interaction network nodes.
In this study, we conducted differential expression analysis on 10 LMDEGs in two datasets (GSE26440 and GSE131761) to identify significant expression differences between septic shock patients and normal controls or non-septic shock patients. Specifically, we performed the Wilcoxon signed rank test to evaluate the expression levels of the 10 LMDEGs in septic shock group and control group in the GSE26440 dataset. Our analysis found significant expression differences (p < 0.001 for LDHB, STAT3, LDHA, GSR, FOXM1, and CDKN3; p < 0.01 for GCKR; Figure 7A) among all 10 LMDEGs between the two groups. We also examined the expression levels of the 10 LMDEGs in the GSE131761 dataset, comparing septic shock group and non-septic shock patients group, and identified significant expression differences (p < 0.001 for LDHB, STAT3, LDHA, GSR, FOXM1, and CDKN3; p < 0.01 for PDP1, GCDH, GCKR, and ABCC1) between the two groups for all 10 LMDEGs (Figure 7B).
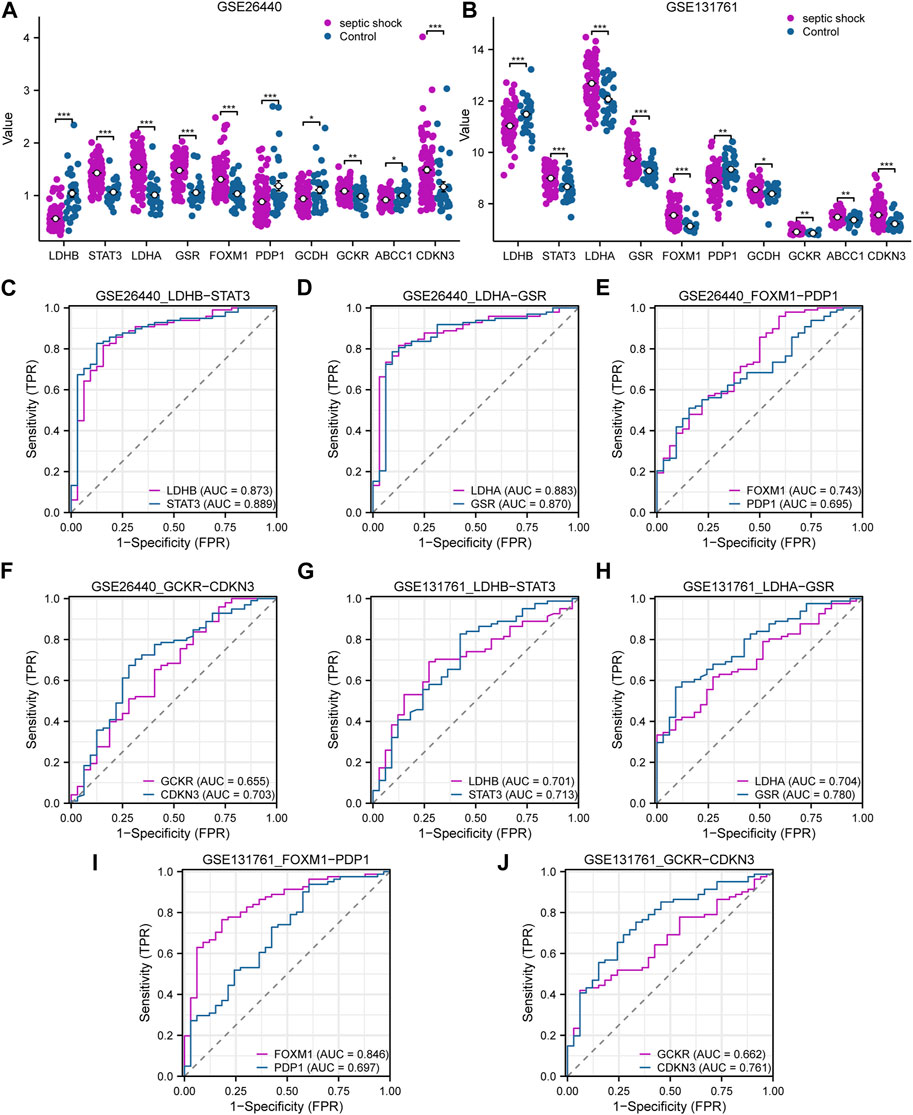
FIGURE 7. Expression differences and diagnostic performance of LMDEGs in the GSE26440 and GSE131761 datasets. (A) Differential expression analysis of LMDEGs in the GSE26440 dataset. (B) Differential expression analysis of LMDEGs in the GSE131761 dataset. C-F. ROC curve results for LMDEGs: LDHB, STAT3 (C), LDHA, GSR (D), FOXM1, PDP1 (E), and GCKR, CDKN3 (F) in the GSE26440 dataset. G-J. ROC curve results for LMDEGs: LDHB, STAT3 (G), LDHA, GSR (H), FOXM1, PDP1 (I), and GCKR, CDKN3 (J) in the GSE131761 dataset. ns indicates no statistical significance; *p < 0.05; **p < 0.01; ***p < 0.001. An AUC (range from 0.5 to 1) closer to 1 in the ROC curve indicates better diagnostic performance. ROC, receiver operating characteristic curve; AUC, Area Under Curve.
Based on the comparison of group distributions, we generated ROC curves for eight DEGs associated with lactate metabolism exhibiting similar expression trends in both the GSE26440 and GSE131761 datasets. The ROC curves were presented in Figures 7C–F. Notably, the following genes were observed to show a certain correlation with the occurrence of septic shock in the GSE26440 dataset: LDHB (AUC = 0.873, red line in Figure 7C), STAT3 (AUC = 0.889, blue line in Figure 7C), LDHA (AUC = 0.883, red line in Figure 7D), GSR (AUC = 0.870, blue line in Figure 7D), FOXM1 (AUC = 0.743, red line in Figure 7E), and CDKN3 (AUC = 0.703, blue line in Figure 7F). Conversely, the expression of PDP1 (AUC = 0.695, blue line in Figure 7E) and GCKR (AUC = 0.655, red line in Figure 7F) genes in the GSE26440 dataset exhibited a low correlation with septic shock occurrence. ROC curve analysis in the GSE131761 dataset revealed a similar correlation pattern. Specifically, the following genes exhibited a certain correlation with septic shock occurrence: LDHB (AUC = 0.701, red line in Figure 7G), STAT3 (AUC = 0.713, blue line in Figure 7G), LDHA (AUC = 0.704, red line in Figure 7H), GSR (AUC = 0.780, blue line in Figure 7H), FOXM1 (AUC = 0.846, red line in Figure 7I), and CDKN3 (AUC = 0.761, blue line in Figure 7J). Meanwhile, PDP1 (AUC = 0.697, blue line in Figure 7I) and GCKR (AUC = 0.662, red line in Figure 7J) genes in the GSE131761 dataset exhibited a low correlation with septic shock occurrence.
In order to explore the immunological characteristics of LMDEGs in septic shock, we employed ssGSEA to estimate the infiltration abundance of 28 distinct immune cells in septic shock and control groups. The differential gene expression analysis in the GSE26440 dataset was used for this purpose. We compared the infiltration differences of the 28 immune cells between septic shock and control groups using the Mann-Whitney U test and illustrated the results in a grouping comparison chart (Figure 8A). Our findings indicated that 21 immune cell types demonstrated statistically significant differences in infiltration abundance between septic shock and control groups (p < 0.05). Additionally, we analyzed the correlations between the infiltration abundance of these 21 immune cells and presented the results in Figure 8B, which showed generally positive correlations between the infiltration abundance of these immune cells.
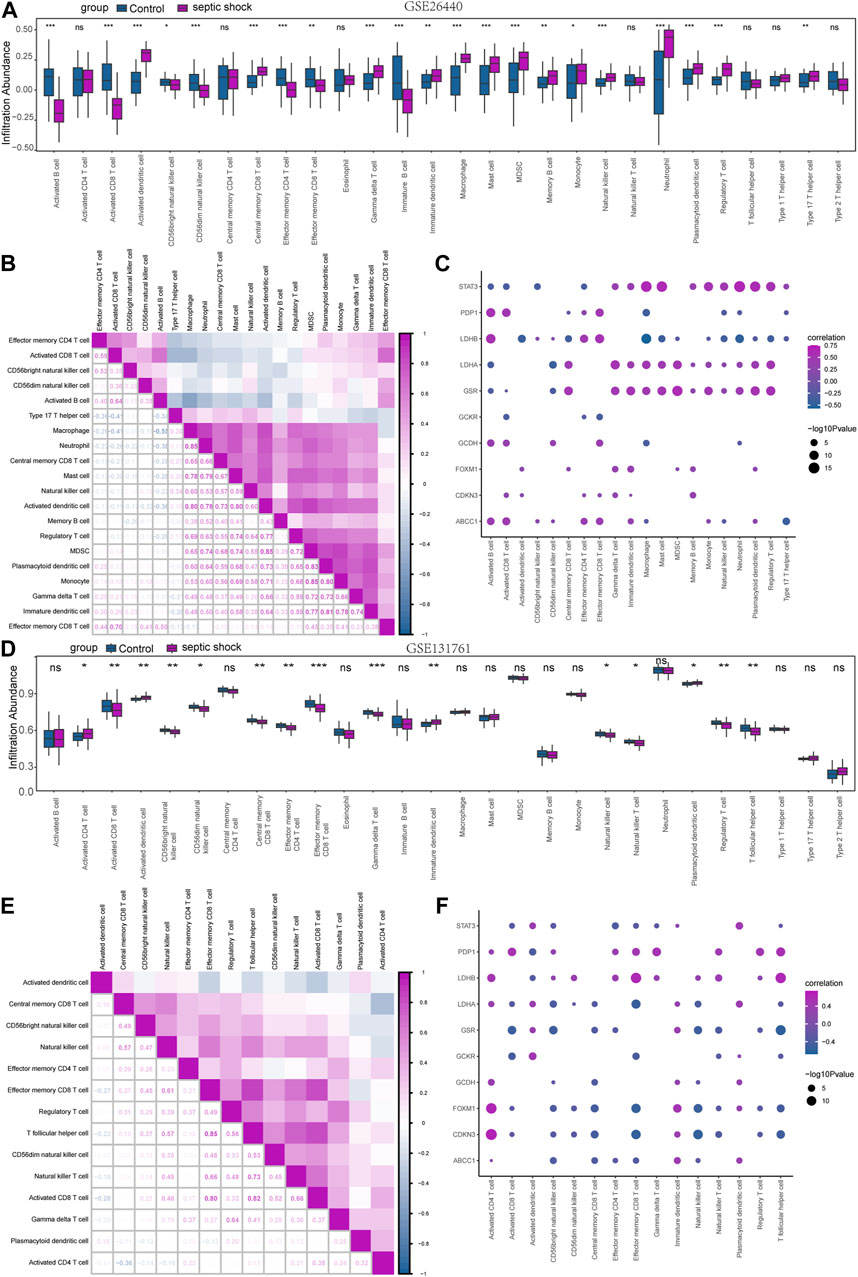
FIGURE 8. Immune infiltration analysis of the GSE26440 and GSE131761 datasets by ssGSEA. (A) ssGSEA immune infiltration analysis results in GSE26440. (B) Correlation analysis results of immune cell infiltration abundance in GSE26440. (C) Correlation heatmap of immune cells and LMDEGs in GSE26440 dataset. (D) ssGSEA immune infiltration analysis results for DEGs in GSE131761. (E) Correlation analysis results of immune cell infiltration abundance in GSE131761. (F) Correlation heatmap of immune cells and LMDEGs in GSE131761 dataset. ns indicates no statistical significance. *p < 0.05; **p < 0.01; ***p < 0.001. ssGSEA: single-sample gene-set enrichment analysis.
Furthermore, we examined the relationship between the infiltration abundance of the previously mentioned 21 immune cells and the expression of 10 LMDEGs in GSE26440 dataset. We applied a significance threshold of p < 0.05 for the correlation analysis results (Figure 8C). Our findings indicated noteworthy associations between the infiltration abundance of 20 immune cells and the 10 LMDEGs (p < 0.05), with most of these associations being positively correlated. Importantly, we observed that STAT3, LDHB, LDHA and GSR displayed the most substantial correlations with the infiltration abundance of the 20 immune cells.
Similarly, we employed the ssGSEA algorithm to determine the infiltration abundance of 28 immune cells in septic shock and non-septic shock group samples obtained from the GSE131761 dataset. We performed a Mann-Whitney U test to analyze the infiltration differences of the 28 immune cells between the two groups and presented the results through a grouping comparison chart (Figure 8D). Our analysis revealed statistically significant differences in the infiltration abundance of 15 immune cell types (p < 0.05) between the septic shock group and non-septic shock patients group.
We subsequently conducted correlation analyses to investigate the relationship between the infiltration abundance of 15 immune cells in the GSE131761 dataset, and the results are presented in Figure 8E. Our findings indicated a positive correlation between the infiltration abundance of these 15 immune cells and that of other immune cells in the dataset.
Correlation analyses were conducted to investigate the associations between the infiltration abundance of 15 immune cells and the expression levels of 10 LMDEGs in the GSE131761 dataset. The results were presented in Figure 8F, with a cutoff of p < 0.05. Our findings demonstrated significant negative correlations (p < 0.05) between the infiltration abundance of the 15 immune cells and the expression of the 10 LMDEGs in the GSE131761 dataset, with LDHA, FOXM1, and CDKN3 exhibiting particularly strong correlations with the infiltration abundance of the 15 immune cells.
To investigate the differences in immune cell infiltration in the GSE26440 dataset, we utilized the CIBERSORT algorithm to calculate the correlations between the expression profiles of 22 immune cells and different groups. Using the immune infiltration analysis results, we generated a stacked bar chart to display the immune cell infiltration levels of each sample in the GSE26440 dataset for the 22 immune cell types (Figure 9A). The findings revealed that 14 immune cell types exhibited statistically significant differences (p < 0.05) in infiltration levels between the septic shock and control groups in GSE26440.
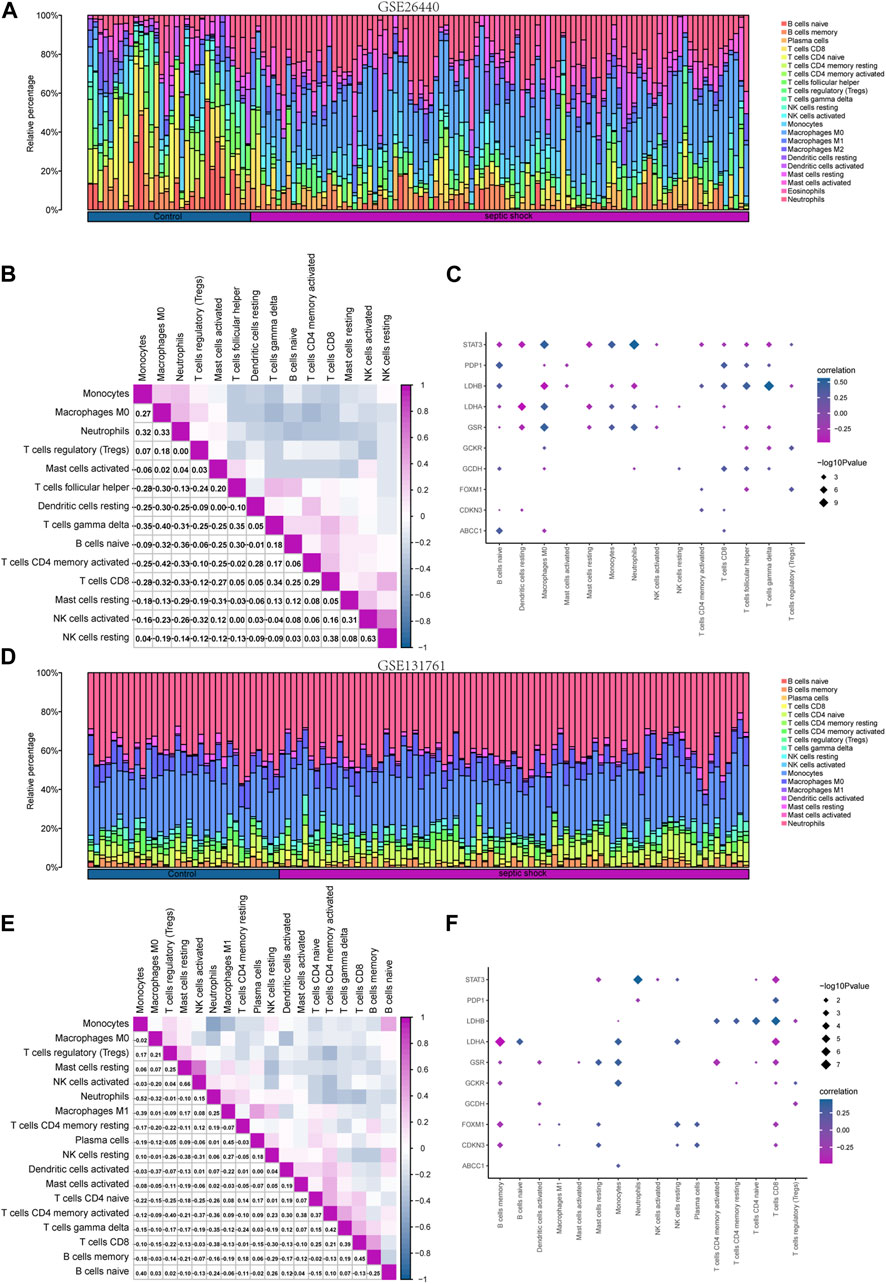
FIGURE 9. Immune infiltration analysis of the GSE26440 and GSE131761 datasets by CIBERSORT. (A) The comparative results of CIBERSORT immune infiltration analysis in GSE26440. (B) The correlation analysis results of immune cell infiltration abundance in GSE26440. (C) The correlation heat map of immune cells and LMDEGs in GSE26440 dataset. (D) The comparative results of CIBERSORT immune infiltration analysis in GSE131761. (E) The correlation analysis results of immune cell infiltration abundance in GSE131761. (F) The correlation heat map of immune cells and LMDEGs in GSE131761.
Next, we computed the correlation between the infiltration levels of the 14 immune cell types identified in the GSE26440 dataset, and the outcomes were illustrated in Figure 9B. Our findings revealed a negative correlation between the infiltration abundance of most of the 14 immune cell types in the GSE26440 dataset.
Furthermore, we conducted a correlation analysis to investigate the association between the infiltration abundance of the 14 immune cell types in the GSE26440 dataset and the expression levels of 10 LMDEGs. The results were presented in Figure 9C, where a p-value threshold of less than 0.05 was used to screen for significant correlations. Our findings revealed significant correlations between the infiltration abundance of the 14 immune cell types and the expression of the 10 LMDEGs in the GSE26440 dataset. As demonstrated, LMDEGs (including STAT3, LDHA, and GSR) showed a negative correlation with NK activated cells.
Using the CIBERSORT algorithm, we conducted an immune infiltration analysis on the GSE131761 dataset. A stacked bar chart displaying the immune cell infiltration levels of 22 immune cells in each sample of the GSE131761 dataset was generated based on the results (Figure 9D). The analysis revealed significant differences in the infiltration levels of 18 immune cells between the septic shock and control groups in the GSE131761 dataset.
Subsequently, the correlations between the infiltration abundance of the 18 immune cells that exhibited infiltration levels greater than zero in the GSE131761 dataset were computed. These results were presented in Figure 9E, indicating that most of the 18 immune cells in the GSE131761 dataset had a negative correlation with immune cell infiltration.
In addition, we assessed the relationship between the infiltration abundance of 18 immune cell types, whose abundance was greater than zero, and the expression levels of 10 LMDEGs in the GSE131761 dataset (Figure 9F). Our analysis revealed significant associations (p < 0.05) between the infiltration abundance of 16 immune cell types and the expression levels of the 10 LMDEGs. Notably, T cells CD8 exhibited a noteworthy positive correlation with 6 LMDEGs associated with lactate metabolism. Furthermore, NK resting cells exhibit a positive correlation with several LMDEGs, including STAT3, LDHA, FOXXM1, and CDKN3. Conversely, NK activated cells demonstrate a negative correlation specifically with STAT3. Additionally, LDHB displays a negative correlation with Treg cells in both datasets when analyzed using the CIBERSORT algorithm.
Septic shock has attracted extensive attention and research due to its high mortality rate, and effective therapeutic targets focusing on the inflammatory pathway have yet to be found (van der Poll et al., 2017). Lactate, as a product of glycolysis, not only causes vasodilation and increased permeability, exacerbating microcirculatory ischemia in septic shock, but also affects immune-inflammatory responses, leading to dysregulation. To our knowledge, no bioinformatics studies exploring the relationship between LMDEGs and septic shock can be retrieved. Therefore, to understand the role of lactate in septic shock, this study identified 10 LMDEGs in septic shock patients through two datasets, and performed enrichment analyses of LMDEGs through KEGG and GO. Meanwhile, we also performed GSEA on the two datasets. Next, we constructed PPI, mRNA-miRNA, mRNA-RBP, and mRNA-TF interaction networks of LMDEGs. In addition, we conducted a comparative analysis of the LMDEGs between the septic shock group and the control group, and predicted the diagnostic efficacy of LMDEGs for septic shock. Finally, we analyzed the characteristics of immune infiltration in septic shock and its correlation with LMDEGs using ssGSEA and CIBERSORT algorithms.
The LMDEGs identified in this study, which are related to septic shock, are not only involved in regulating lactate metabolism, but also multiple studies have shown that they are involved in regulating inflammatory immune responses. LDHA and LDHB are classic genes involved in lactate metabolism, where LDHA primarily catalyzes the conversion of pyruvate and NADH into lactate and NAD to enhance ATP supply, while LDHB prevents lactate accumulation by catalyzing the reverse reaction (Certo et al., 2021). In terms of immune regulation, LDH can play a modifying role in gene expression in the nucleus of cells, such as by binding to AU-rich elements in RNA encoding GM-CSF to regulate its expression (Chang et al., 2013). LDHA can regulate pro-inflammatory cytokines in macrophages (Song et al., 2019), as well as prevent the upregulation of activated T cell nuclear factor in T cells and NK cells, leading to a decrease in IFN-γ production (Brand et al., 2016). Upregulation of LDHB expression can partially reverse the inhibitory state of T cells (Decking et al., 2022). Similarly, STAT3 is also involved in regulating many immune and inflammatory responses, such as promoting the conversion of pro-inflammatory signals to anti-inflammatory signals (Hillmer et al., 2016), regulating the development and function of effector CD8+ T cells during acute infection (Sun et al., 2023), regulating the function of ILC2 effectors (Fu et al., 2022), and participating in regulating dendritic cell maturation to modulate self-immunity (Wang et al., 2021). In addition, GSR can reduce lung epithelial cell damage (Hong et al., 2022); FoxM1 can regulate the development and migration of immune cells (Zheng et al., 2023); and PDP1 can regulate the activity of the hypoxia-inducible factor 1 (HIF-1) pathway (Karagiota et al., 2023).
According to the KEGG analysis, HIF-1 was found to be the most significantly enriched pathway in LMDEGs. As an important metabolic sensor, HIF-1 participates in the regulation of numerous immune signaling pathways, such as coordinating differentiation between Treg and TH17 cells (Dang et al., 2011), driving transcriptional changes in immune cells in bone marrow and other lymphoid organs (Taylor and Colgan, 2017), and promoting the activation of macrophages and dendritic cells during inflammation (Ivashkiv, 2020). Cytokines are an essential component of the cytokine storm that occurs in septic shock. We performed GSEA analysis on the DEGs of two datasets and found that DEGs were significantly enriched in the REACTOME INTERLEUKIN 1 FAMILY SIGNALING/IL-1 pathway in both datasets. In septic patients, extensive vasodilation and glycocalyx degradation often occur as a consequence of inflammatory responses involving vascular endothelial cells (Joffre et al., 2020). NF-kB, as a widely expressed transcription factor, plays a crucial role in the inflammatory response of sepsis, with its activity in endothelial cells being mediated by IL-1 (Ye et al., 2008; Raia and Zafrani, 2022). Vascular relaxation primarily relies on three vasodilatory factors produced by endothelial cells: nitric oxide, prostacyclin, and endothelium-derived hyperpolarizing factors (Zhang et al., 2023). However, the regulatory effects of LMDEGs on these vasodilatory factors await further experimental exploration. The extensive family of interleukins is involved in various immune and acute and chronic inflammatory responses. For example, IL-1α and IL-1β can promote inflammatory responses, while IL-37, IL-38, and IL-1Ra have inhibitory effects on inflammatory responses. IL-18 can have both effects depending on the context (Chan and Schroder, 2020). MiRNAs also have a crucial regulatory role in the immune response during the progression of sepsis and the related pathway WP MIRNAS INVOLVEMENT IN THE IMMUNE RESPONSE IN SEPSIS was also significantly enriched in the DEGs of both datasets according to GSEA result. In septic patients, upregulation of miR-221 and miR-222 often indicates immune paralysis and worsening organ damage (Seeley et al., 2018). The elevation of miR-210 levels in monocyte-derived cells is significantly associated with the incidence and mortality rate of sepsis (Virga et al., 2021). miR-142, as the core of metabolic reprogramming, directly regulates the glycolysis and immunogenic response of dendritic cells (Sun et al., 2019). miR-127-3p and miR-25-3p can regulate macrophage phenotype and migration and participate in the activation of antioxidant enzymes (Gusar et al., 2022). MiR-21 expression in bone marrow cells can efficiently balance the metabolic reprogramming that causes the cytokine storm in sepsis with the anti-inflammatory mediators that are responsible for inflammation. MiR-21 in bone marrow cells can effectively balance the anti-inflammatory mediators and metabolic reprogramming to drive the cytokine storm (De Melo et al., 2021). In this study, we used the miRDB database to predict and construct 148 pairs of mRNA-miRNA interaction relationships for LMDEGs and searched for TFs that bind to LMDEGs through the CHIPBase and hTFtarget databases. Among them, STAT3 is both an LMDEG and a transcription factor, and has the most interaction relationships with transcription factors. STAT3 is involved in immune regulation, and its mutation is the basis for the development of hyper-IgE syndrome, an immunodeficiency syndrome (Holland et al., 2007). In addition, STAT3 is crucial for controlling the expression of autophagy molecules, regulating immune factors, and recruiting immune cells (Zhang et al., 2022).
Sepsis and septic shock, due to their high mortality rates, have received widespread attention regarding their diagnostic and prognostic markers. In this study, ROC curves were plotted for 8 LMDEGs with identical change trends in two datasets, where the AUC of 6 LMDEGs, including CDKN3, GSR, FOXM1, STAT3, LDHA and LDHB, were greater than 0.7, indicating that LMDEGs have a certain degree of accuracy in predicting the occurrence of septic shock. Previous studies have demonstrated the diagnostic value of STAT3 in sepsis-induced myocardial disease and sepsis-related respiratory distress syndrome (Zhang et al., 2019; Song et al., 2023). Metabolism-related genes (She et al., 2022), necrosis-related genes (She et al., 2023), immune-related genes (Zheng et al., 2022) common DEGs related to sepsis and metabolic syndrome (Tao et al., 2023), apoptosis-related genes (Wang et al., 2022), inflammation response signature genes (Jiang et al., 2022), and signature genes for septic shock in children (Fan et al., 2022) have all shown some efficacy in the diagnosis and prognostic assessment of sepsis. In addition, metabolites based on metabolomics analysis (Li Y. et al., 2023), m6A regulatory factors (Li F. et al., 2023), and non-coding RNAs such as miR-147b (Trung et al., 2021), lncRNA THAP9-AS1, and TSPOAP1-AS1 (Wu et al., 2020) have all been reported as potential diagnostic or prognostic indicators for sepsis or septic shock.
Immune cells play a central role in the dysregulated response of sepsis. Studies have shown that immune cells in the early stages of sepsis often exhibit an overreactive state, which gradually develops into immune tolerance or immune suppression as the disease progresses (Hotchkiss and Karl, 2003; Arts et al., 2017). The overactive immune response in the beginning of sepsis can activate multiple immune cells to produce large amounts of proinflammatory cytokines and chemokine (Galli, 1993). However, as sepsis progresses to the immune suppression phase, various lymphocyte dysfunctions and increased apoptosis can occur (Le Tulzo et al., 2002; Gustave et al., 2018). Previous research has indicated that increased apoptosis of CD4+, CD8+, and Th17 lymphocytes (Wu et al., 2013), decreased NK cells (Jensen et al., 2018), and decreased B cells (Gustave et al., 2018) are associated with poor prognosis of sepsis, including shock and death. Tregs have been reported to increase in the circulating blood of septic shock patients (Monneret et al., 2003; Gaborit et al., 2021), which is consistent with our findings (Figure 8A). Another study has verified that Tregs can induce immune suppression in septic shock patients (Liu et al., 2022). Immune suppression is an important factor in the progression of sepsis to shock or death, and lactate is further known to regulate the occurrence of immune suppression and inflammatory response in its local environment (Nolt et al., 2018; Luo et al., 2022). Cheng et al. found that blocking metabolic pathways with metformin reduced cytokine production and increased mortality in a mouse model, and their transcriptomic and metabolic profiling analysis of sepsis patients found that the body actively shifts from oxidative phosphorylation to aerobic glycolysis in the immune defense response (Cheng et al., 2016). As mentioned earlier, genes regulating lactate metabolism affect the immune inflammatory response in septic shock through multiple signaling pathways. In this study, the ssGSEA and CIBERSORT algorithm were used to analyze and compare the immune cell infiltration abundance in septic shock and control groups. Significant differences were found in the immune cell infiltration of various immune cells, including CD8 T cells, Tregs, and natural killer cells, in datasets GSE26440 and GSE131761. Moreover, several LMDEGs, such as STAT3, LDHB, LDHA, PDP1, GSR, FOXM1 and CDKN3, were significantly correlated with various immune cells. Therefore, by analyzing the correlation between LMDEGs and immune infiltration in patients with septic shock, it may be possible to provide new targets and directions to block the dysregulated response of sepsis, thereby effectively reducing the incidence and mortality of septic shock.
This study has several limitations that should be acknowledged. Firstly, the lack of animal models and clinical samples hinders the validation of the identified LMDEGs and their correlation with immune infiltration. To address this limitation and enhance the robustness of our findings, future research will focus on incorporating animal models and collecting clinical samples for validation purposes. Additionally, the rapid progression of septic shock and the heterogeneity introduced by differences in specimen collection times may introduce biases in the screening of differentially expressed genes. It is important to consider these factors when interpreting the results and their implications. Moreover, patient metadata, including demographics, genetic background, comorbidities (CCI score), infection type (bacterial, viral, or fungal), and other measures of patient severity (e.g., APACHE II, SOFA scores), hold valuable information. Differential gene analysis based on these diverse metadata can provide a more comprehensive understanding of the mechanisms underlying the occurrence and progression of septic shock. However, due to the study’s design and limitations in the available dataset, it is not possible to conduct analyses incorporating these metadata at the present stage. Future research endeavors should aim to incorporate and analyze these additional patient metadata to gain deeper insights into septic shock.
Using bioinformatics methods to analyze two datasets of septic shock, we identified 10 lactate metabolism-related genes (LDHB, STAT3, LDHA, GSR, FOXM1, PDP1, GCDH, GCKR, ABCC1, CDKN3), and clarified their associated cellular signaling pathways and their relationship with immune cell infiltration, laying the foundation for diagnosis and treatment of septic shock from the perspective of lactate metabolism.
Publicly available datasets were analyzed in this study. This data can be found here: https://www.ncbi.nlm.nih.gov/geo/query/acc.cgi?acc=GSE26440 https://www.ncbi.nlm.nih.gov/geo/query/acc.cgi?acc=GSE131761.
JZ and SH designed and organized the whole study. YR acquired the original data. HJ, YR, and JY deployed the bioinformatics analysis. HJ wrote the manuscript. All authors contributed to the article and approved the submitted version.
This research was supported by the Nature Science Foundation of Changsha City (kq2202499).
The authors declare that the research was conducted in the absence of any commercial or financial relationships that could be construed as a potential conflict of interest.
All claims expressed in this article are solely those of the authors and do not necessarily represent those of their affiliated organizations, or those of the publisher, the editors and the reviewers. Any product that may be evaluated in this article, or claim that may be made by its manufacturer, is not guaranteed or endorsed by the publisher.
ABCC1, ATP-binding cassette subfamily C member 1; AUC, area under the curve; BP, biological process; CC, cellular component; CDKN3, cyclin-dependent kinase inhibitor 3; DEGs, differentially expressed genes; FOXM1, forkhead box protein M1; GCDH, glutaryl-CoA dehydrogenase; GCKR, glucokinase regulatory protein; GO, Gene ontology; GSEA, gene set enrichment analysis; GSR, glutathione-disulfide reductase; KEGG, Kyoto Encyclopedia of Genes and Genomes; LDHA, lactate dehydrogenase A; LDHB, lactate dehydrogenase B; LMGs, lactate metabolism-related genes; LMDEGs, lactate metabolism-related differentially expressed genes; MF, molecular function; PPI, Protein-protein interaction; RBP, RNA binding protein; PDP1, pyruvate dehyrogenase phosphatase catalytic subunit 1; ROC, Receiver operating characteristic; ssGSEA, single-sample gene-set enrichment analysis; STAT3, signal transducer and activator of transcription 3; TF, transcription factors.
Arts, R. J., Gresnigt, M. S., Joosten, L. A., and Netea, M. G. (2017). Cellular metabolism of myeloid cells in sepsis. J. Leukoc. Biol. 101, 151–164. doi:10.1189/jlb.4MR0216-066R
Barrett, T., Troup, D. B., Wilhite, S. E., Ledoux, P., Rudnev, D., Evangelista, C., et al. (2007). NCBI GEO: Mining tens of millions of expression profiles--database and tools update. Nucleic Acids Res. 35, D760–D765. doi:10.1093/nar/gkl887
Bindea, G., Mlecnik, B., Tosolini, M., Kirilovsky, A., Waldner, M., Obenauf, A. C., et al. (2013). Spatiotemporal dynamics of intratumoral immune cells reveal the immune landscape in human cancer. Immunity 39, 782–795. doi:10.1016/j.immuni.2013.10.003
Brand, A., Singer, K., Koehl, G. E., Kolitzus, M., Schoenhammer, G., Thiel, A., et al. (2016). LDHA-associated lactic acid production blunts tumor immunosurveillance by T and NK cells. Cell. Metab. 24, 657–671. doi:10.1016/j.cmet.2016.08.011
Brooks, G. A., Arevalo, J. A., Osmond, A. D., Leija, R. G., Curl, C. C., and Tovar, A. P. (2022). Lactate in contemporary biology: A phoenix risen. J. Physiol. 600, 1229–1251. doi:10.1113/JP280955
Casserly, B., Phillips, G. S., Schorr, C., Dellinger, R. P., Townsend, S. R., Osborn, T. M., et al. (2015). Lactate measurements in sepsis-induced tissue hypoperfusion: Results from the surviving sepsis campaign database. Crit. Care Med. 43, 567–573. doi:10.1097/CCM.0000000000000742
Certo, M., Tsai, C. H., Pucino, V., Ho, P. C., and Mauro, C. (2021). Lactate modulation of immune responses in inflammatory versus tumour microenvironments. Nat. Rev. Immunol. 21, 151–161. doi:10.1038/s41577-020-0406-2
Chan, A. H., and Schroder, K. (2020). Inflammasome signaling and regulation of interleukin-1 family cytokines. J. Exp. Med. 217, e20190314. doi:10.1084/jem.20190314
Chang, C. H., Curtis, J. D., Maggi, L. B., Faubert, B., Villarino, A. V., O'Sullivan, D., et al. (2013). Posttranscriptional control of T cell effector function by aerobic glycolysis. Cell. 153, 1239–1251. doi:10.1016/j.cell.2013.05.016
Chen, Y., and Wang, X. (2020). miRDB: an online database for prediction of functional microRNA targets. Nucleic Acids Res. 48, D127-D131–D131. doi:10.1093/nar/gkz757
Cheng, S. C., Scicluna, B. P., Arts, R. J., Gresnigt, M. S., Lachmandas, E., Giamarellos-Bourboulis, E. J., et al. (2016). Broad defects in the energy metabolism of leukocytes underlie immunoparalysis in sepsis. Nat. Immunol. 17, 406–413. doi:10.1038/ni.3398
Colegio, O. R., Chu, N. Q., Szabo, A. L., Chu, T., Rhebergen, A. M., Jairam, V., et al. (2014). Functional polarization of tumour-associated macrophages by tumour-derived lactic acid. Nature 513, 559–563. doi:10.1038/nature13490
Comito, G., Iscaro, A., Bacci, M., Morandi, A., Ippolito, L., Parri, M., et al. (2019). Lactate modulates CD4(+) T-cell polarization and induces an immunosuppressive environment, which sustains prostate carcinoma progression via TLR8/miR21 axis. Oncogene 38, 3681–3695. doi:10.1038/s41388-019-0688-7
Dang, E. V., Barbi, J., Yang, H. Y., Jinasena, D., Yu, H., Zheng, Y., et al. (2011). Control of T(H)17/T(reg) balance by hypoxia-inducible factor 1. Cell. 146, 772–784. doi:10.1016/j.cell.2011.07.033
Davis, S., and Meltzer, P. S. (2007). GEOquery: A bridge between the gene expression omnibus (GEO) and BioConductor. Bioinformatics 23, 1846–1847. doi:10.1093/bioinformatics/btm254
De Melo, P., Pineros Alvarez, A. R., Ye, X., Blackman, A., Alves-Filho, J. C., Medeiros, A. I., et al. (2021). Macrophage-derived MicroRNA-21 drives overwhelming glycolytic and inflammatory response during sepsis via repression of the PGE(2)/IL-10 Axis. J. Immunol. 207, 902–912. doi:10.4049/jimmunol.2001251
Decking, S. M., Bruss, C., Babl, N., Bittner, S., Klobuch, S., Thomas, S., et al. (2022). LDHB overexpression can partially overcome T cell inhibition by lactic acid. Int. J. Mol. Sci. 23, 5970. doi:10.3390/ijms23115970
Dietl, K., Renner, K., Dettmer, K., Timischl, B., Eberhart, K., Dorn, C., et al. (2010). Lactic acid and acidification inhibit TNF secretion and glycolysis of human monocytes. J. Immunol. 184, 1200–1209. doi:10.4049/jimmunol.0902584
Fan, J., Shi, S., Qiu, Y., Liu, M., and Shu, Q. (2022). Analysis of signature genes and association with immune cells infiltration in pediatric septic shock. Front. Immunol. 13, 1056750. doi:10.3389/fimmu.2022.1056750
Fu, L., Zhao, J., Huang, J., Li, N., Dong, X., He, Y., et al. (2022). A mitochondrial STAT3-methionine metabolism axis promotes ILC2-driven allergic lung inflammation. J. Allergy Clin. Immunol. 149, 2091–2104. doi:10.1016/j.jaci.2021.12.783
Gaborit, B. J., Chaumette, T., Chauveau, M., Asquier-Khati, A., Roquilly, A., Boutoille, D., et al. (2021). Circulating regulatory T cells expressing tumor necrosis factor receptor type 2 contribute to sepsis-induced immunosuppression in patients during septic shock. J. Infect. Dis. 224, 2160–2169. doi:10.1093/infdis/jiab276
Galli, S. J. (1993). New concepts about the mast cell. N. Engl. J. Med. 328, 257–265. doi:10.1056/NEJM199301283280408
Gottfried, E., Kunz-Schughart, L. A., Ebner, S., Mueller-Klieser, W., Hoves, S., Andreesen, R., et al. (2006). Tumor-derived lactic acid modulates dendritic cell activation and antigen expression. Blood 107, 2013–2021. doi:10.1182/blood-2005-05-1795
Gusar, V. A., Timofeeva, A. V., Chagovets, V. V., Vysokikh, M. Y., Kan, N. E., Manukhova, L. A., et al. (2022). Interrelation between miRNAs expression associated with redox state fluctuations, immune and inflammatory response activation, and neonatal outcomes in complicated pregnancy, accompanied by placental insufficiency. Antioxidants (Basel) 12, 6. doi:10.3390/antiox12010006
Gustave, C. A., Gossez, M., Demaret, J., Rimmele, T., Lepape, A., Malcus, C., et al. (2018). Septic shock shapes B cell response toward an exhausted-like/immunoregulatory profile in patients. J. Immunol. 200, 2418–2425. doi:10.4049/jimmunol.1700929
Hillmer, E. J., Zhang, H., Li, H. S., and Watowich, S. S. (2016). STAT3 signaling in immunity. Cytokine Growth Factor Rev. 31, 1–15. doi:10.1016/j.cytogfr.2016.05.001
Holland, S. M., DeLeo, F. R., Elloumi, H. Z., Hsu, A. P., Uzel, G., Brodsky, N., et al. (2007). STAT3 mutations in the hyper-IgE syndrome. N. Engl. J. Med. 357, 1608–1619. doi:10.1056/NEJMoa073687
Hong, K. S., Pagan, K., Whalen, W., Harris, R., Yang, J., Stout-Delgado, H., et al. (2022). The role of glutathione reductase in influenza infection. Am. J. Respir. Cell. Mol. Biol. 67, 438–445. doi:10.1165/rcmb.2021-0372OC
Hotchkiss, R. S., and Karl, I. E. (2003). The pathophysiology and treatment of sepsis. N. Engl. J. Med. 348, 138–150. doi:10.1056/NEJMra021333
Husain, Z., Huang, Y., Seth, P., and Sukhatme, V. P. (2013). Tumor-derived lactate modifies antitumor immune response: Effect on myeloid-derived suppressor cells and NK cells. J. Immunol. 191, 1486–1495. doi:10.4049/jimmunol.1202702
Ivashkiv, L. B. (2020). The hypoxia-lactate axis tempers inflammation. Nat. Rev. Immunol. 20, 85–86. doi:10.1038/s41577-019-0259-8
Jensen, I. J., Winborn, C. S., Fosdick, M. G., Shao, P., Tremblay, M. M., Shan, Q., et al. (2018). Polymicrobial sepsis influences NK-cell-mediated immunity by diminishing NK-cell-intrinsic receptor-mediated effector responses to viral ligands or infections. PLoS Pathog. 14, e1007405. doi:10.1371/journal.ppat.1007405
Jiang, S., Zhang, W., and Lu, Y. (2022). Development and validation of novel inflammatory response-related gene signature for sepsis prognosis. J. Zhejiang Univ. Sci. B 23, 1028–1041. doi:10.1631/jzus.B2200285
Joffre, J., Hellman, J., Ince, C., and Ait-Oufella, H. (2020). Endothelial responses in sepsis. Am. J. Respir. Crit. Care Med. 202, 361–370. doi:10.1164/rccm.201910-1911TR
Kanjee, Z., Berg, K., Bell, T. D., and Reynolds, E. E. (2023). How would you resuscitate this patient with septic shock?: Grand rounds discussion from beth Israel deaconess medical center. Ann. Intern Med. 176, 253–259. doi:10.7326/M22-3385
Karagiota, A., Kanoura, A., Paraskeva, E., Simos, G., and Chachami, G. (2023). Pyruvate dehydrogenase phosphatase 1 (PDP1) stimulates HIF activity by supporting histone acetylation under hypoxia. FEBS J. 290, 2165–2179. doi:10.1111/febs.16694
Le Tulzo, Y., Pangault, C., Gacouin, A., Guilloux, V., Tribut, O., Amiot, L., et al. (2002). Early circulating lymphocyte apoptosis in human septic shock is associated with poor outcome. Shock 18, 487–494. doi:10.1097/00024382-200212000-00001
Li, J. H., Liu, S., Zhou, H., Qu, L. H., and Yang, J. H. (2014). starBase v2.0: decoding miRNA-ceRNA, miRNA-ncRNA and protein-RNA interaction networks from large-scale CLIP-Seq data. Nucleic Acids Res. 42, D92–D97. doi:10.1093/nar/gkt1248
Li, Y., Wang, C., and Chen, M. (2023a). Metabolomics-based study of potential biomarkers of sepsis. Sci. Rep. 13, 585. doi:10.1038/s41598-022-24878-z
Li, F., Zhang, Y., Peng, Z., Wang, Y., Zeng, Z., and Tang, Z. (2023b). Diagnostic, clustering, and immune cell infiltration analysis of m6A regulators in patients with sepsis. Sci. Rep. 13, 2532. doi:10.1038/s41598-022-27039-4
Liberzon, A., Birger, C., Thorvaldsdottir, H., Ghandi, M., Mesirov, J. P., and Tamayo, P. (2015). The Molecular Signatures Database (MSigDB) hallmark gene set collection. Cell. Syst. 1, 417–425. doi:10.1016/j.cels.2015.12.004
Liu, D., Huang, S. Y., Sun, J. H., Zhang, H. C., Cai, Q. L., Gao, C., et al. (2022). Sepsis-induced immunosuppression: Mechanisms, diagnosis and current treatment options. Mil. Med. Res. 9, 56. doi:10.1186/s40779-022-00422-y
Long, Y., Gao, Z., Hu, X., Xiang, F., Wu, Z., Zhang, J., et al. (2018). Downregulation of MCT4 for lactate exchange promotes the cytotoxicity of NK cells in breast carcinoma. Cancer Med. 7, 4690–4700. doi:10.1002/cam4.1713
Luo, Y., Li, L., Chen, X., Gou, H., Yan, K., and Xu, Y. (2022). Effects of lactate in immunosuppression and inflammation: Progress and prospects. Int. Rev. Immunol. 41, 19–29. doi:10.1080/08830185.2021.1974856
Mandrekar, J. N. (2010). Receiver operating characteristic curve in diagnostic test assessment. J. Thorac. Oncol. 5, 1315–1316. doi:10.1097/JTO.0b013e3181ec173d
Martinez-Paz, P., Aragon-Camino, M., Gomez-Sanchez, E., Lorenzo-Lopez, M., Gomez-Pesquera, E., Fadrique-Fuentes, A., et al. (2021). Distinguishing septic shock from non-septic shock in postsurgical patients using gene expression. J. Infect. 83, 147–155. doi:10.1016/j.jinf.2021.05.039
Monneret, G., Debard, A. L., Venet, F., Bohe, J., Hequet, O., Bienvenu, J., et al. (2003). Marked elevation of human circulating CD4+CD25+ regulatory T cells in sepsis-induced immunoparalysis. Crit. Care Med. 31, 2068–2071. doi:10.1097/01.CCM.0000069345.78884.0F
Newman, A. M., Liu, C. L., Green, M. R., Gentles, A. J., Feng, W., Xu, Y., et al. (2015). Robust enumeration of cell subsets from tissue expression profiles. Nat. Methods 12, 453–457. doi:10.1038/nmeth.3337
Nolt, B., Tu, F., Wang, X., Ha, T., Winter, R., Williams, D. L., et al. (2018). Lactate and immunosuppression in sepsis. Shock 49, 120–125. doi:10.1097/SHK.0000000000000958
Pavon, A., Binquet, C., Kara, F., Martinet, O., Ganster, F., Navellou, J. C., et al. E.P.o.S.S.S. Group (2013). Profile of the risk of death after septic shock in the present era: An epidemiologic study. Crit. Care Med. 41, 2600–2609. doi:10.1097/CCM.0b013e31829a6e89
Puig-Kroger, A., Pello, O. M., Muniz-Pello, O., Selgas, R., Criado, G., Bajo, M. A., et al. (2003). Peritoneal dialysis solutions inhibit the differentiation and maturation of human monocyte-derived dendritic cells: Effect of lactate and glucose-degradation products. J. Leukoc. Biol. 73, 482–492. doi:10.1189/jlb.0902451
Raia, L., and Zafrani, L. (2022). Endothelial activation and microcirculatory disorders in sepsis. Front. Med. (Lausanne) 9, 907992. doi:10.3389/fmed.2022.907992
Rudd, K. E., Johnson, S. C., Agesa, K. M., Shackelford, K. A., Tsoi, D., Kievlan, D. R., et al. (2020). Global, regional, and national sepsis incidence and mortality, 1990-2017: Analysis for the global burden of disease study. Lancet 395, 200–211. doi:10.1016/S0140-6736(19)32989-7
Seeley, J. J., Baker, R. G., Mohamed, G., Bruns, T., Hayden, M. S., Deshmukh, S. D., et al. (2018). Induction of innate immune memory via microRNA targeting of chromatin remodelling factors. Nature 559, 114–119. doi:10.1038/s41586-018-0253-5
She, H., Tan, L., Zhou, Y., Zhu, Y., Ma, C., Wu, Y., et al. (2022). The landscape of featured metabolism-related genes and imbalanced immune cell subsets in sepsis. Front. Genet. 13, 821275. doi:10.3389/fgene.2022.821275
She, H., Tan, L., Yang, R., Zheng, J., Wang, Y., Du, Y., et al. (2023). Identification of featured necroptosis-related genes and imbalanced immune infiltration in sepsis via machine learning. Front. Genet. 14, 1158029. doi:10.3389/fgene.2023.1158029
Singer, M., Deutschman, C. S., Seymour, C. W., Shankar-Hari, M., Annane, D., Bauer, M., et al. (2016). The third international consensus definitions for sepsis and septic shock (Sepsis-3). JAMA 315, 801–810. doi:10.1001/jama.2016.0287
Song, Y. J., Kim, A., Kim, G. T., Yu, H. Y., Lee, E. S., Park, M. J., et al. (2019). Inhibition of lactate dehydrogenase A suppresses inflammatory response in RAW 264.7 macrophages. Mol. Med. Rep. 19, 629–637. doi:10.3892/mmr.2018.9678
Song, J., Ren, K., Zhang, D., Lv, X., Sun, L., Deng, Y., et al. (2023). A novel signature combing cuproptosis- and ferroptosis-related genes in sepsis-induced cardiomyopathy. Front. Genet. 14, 1170737. doi:10.3389/fgene.2023.1170737
Stelzer, G., Rosen, N., Plaschkes, I., Zimmerman, S., Twik, M., Fishilevich, S., et al. (2016). The GeneCards suite: From gene data mining to disease genome sequence analyses. Curr. Protoc. Bioinforma. 54 (1 30 1), 1–1 30 33. doi:10.1002/cpbi.5
Subramanian, A., Tamayo, P., Mootha, V. K., Mukherjee, S., Ebert, B. L., Gillette, M. A., et al. (2005). Gene set enrichment analysis: A knowledge-based approach for interpreting genome-wide expression profiles. Proc. Natl. Acad. Sci. U. S. A. 102, 15545–15550. doi:10.1073/pnas.0506580102
Sun, Y., Oravecz-Wilson, K., Bridges, S., McEachin, R., Wu, J., Kim, S. H., et al. (2019). miR-142 controls metabolic reprogramming that regulates dendritic cell activation. J. Clin. Invest. 129, 2029–2042. doi:10.1172/JCI123839
Sun, Q., Zhao, X., Li, R., Liu, D., Pan, B., Xie, B., et al. (2023). STAT3 regulates CD8+ T cell differentiation and functions in cancer and acute infection. J. Exp. Med. 220, e20220686. doi:10.1084/jem.20220686
Szklarczyk, D., Gable, A. L., Lyon, D., Junge, A., Wyder, S., Huerta-Cepas, J., et al. (2019). STRING v11: Protein-protein association networks with increased coverage, supporting functional discovery in genome-wide experimental datasets. Nucleic Acids Res. 47, D607-D613–D613. doi:10.1093/nar/gky1131
Tao, L., Zhu, Y., and Liu, J. (2023). Identification of new co-diagnostic genes for sepsis and metabolic syndrome using single-cell data analysis and machine learning algorithms. Front. Genet. 14, 1129476. doi:10.3389/fgene.2023.1129476
Taylor, C. T., and Colgan, S. P. (2017). Regulation of immunity and inflammation by hypoxia in immunological niches. Nat. Rev. Immunol. 17, 774–785. doi:10.1038/nri.2017.103
Trung, N. T., Lien, T. T., Sang, V. V., Hoan, N. X., Manh, N. D., Thau, N. S., et al. (2021). Circulating miR-147b as a diagnostic marker for patients with bacterial sepsis and septic shock. PLoS One 16, e0261228. doi:10.1371/journal.pone.0261228
van der Poll, T., van de Veerdonk, F. L., Scicluna, B. P., and Netea, M. G. (2017). The immunopathology of sepsis and potential therapeutic targets. Nat. Rev. Immunol. 17, 407–420. doi:10.1038/nri.2017.36
Vandewalle, J., Timmermans, S., Paakinaho, V., Vancraeynest, L., Dewyse, L., Vanderhaeghen, T., et al. (2021). Combined glucocorticoid resistance and hyperlactatemia contributes to lethal shock in sepsis. Cell. Metab. 33, 1763–1776 e5. doi:10.1016/j.cmet.2021.07.002
Virga, F., Cappellesso, F., Stijlemans, B., Henze, A. T., Trotta, R., Van Audenaerde, J., et al. (2021). Macrophage miR-210 induction and metabolic reprogramming in response to pathogen interaction boost life-threatening inflammation. Sci. Adv. 7, eabf0466. doi:10.1126/sciadv.abf0466
Wang, J., Wang, J., Hong, W., Zhang, L., Song, L., Shi, Q., et al. (2021). Optineurin modulates the maturation of dendritic cells to regulate autoimmunity through JAK2-STAT3 signaling. Nat. Commun. 12, 6198. doi:10.1038/s41467-021-26477-4
Wang, L., Zhang, J., Zhang, L., Hu, L., and Tian, J. (2022). Significant difference of differential expression pyroptosis-related genes and their correlations with infiltrated immune cells in sepsis. Front. Cell. Infect. Microbiol. 12, 1005392. doi:10.3389/fcimb.2022.1005392
Wong, H. R. (2012). Genetics and genomics in pediatric septic shock. Crit. Care Med. 40, 1618–1626. doi:10.1097/CCM.0b013e318246b546
Wu, H. P., Chung, K., Lin, C. Y., Jiang, B. Y., Chuang, D. Y., and Liu, Y. C. (2013). Associations of T helper 1, 2, 17 and regulatory T lymphocytes with mortality in severe sepsis. Inflamm. Res. 62, 751–763. doi:10.1007/s00011-013-0630-3
Wu, Y., Yin, Q., Zhang, X., Zhu, P., Luan, H., and Chen, Y. (2020). Long noncoding RNA THAP9-AS1 and TSPOAP1-AS1 provide potential diagnostic signatures for pediatric septic shock. Biomed. Res. Int. 2020, 7170464. doi:10.1155/2020/7170464
Yang, K., Fan, M., Wang, X., Xu, J., Wang, Y., Tu, F., et al. (2022a). Lactate promotes macrophage HMGB1 lactylation, acetylation, and exosomal release in polymicrobial sepsis. Cell. Death Differ. 29, 133–146. doi:10.1038/s41418-021-00841-9
Yang, K., Fan, M., Wang, X., Xu, J., Wang, Y., Gill, P. S., et al. (2022b). Lactate induces vascular permeability via disruption of VE-cadherin in endothelial cells during sepsis. Sci. Adv. 8, eabm8965. doi:10.1126/sciadv.abm8965
Ye, X., Ding, J., Zhou, X., Chen, G., and Liu, S. F. (2008). Divergent roles of endothelial NF-kappaB in multiple organ injury and bacterial clearance in mouse models of sepsis. J. Exp. Med. 205, 1303–1315. doi:10.1084/jem.20071393
Ye, L., Jiang, Y., and Zhang, M. (2022). Crosstalk between glucose metabolism, lactate production and immune response modulation. Cytokine Growth Factor Rev. 68, 81–92. doi:10.1016/j.cytogfr.2022.11.001
Yu, G., Wang, L. G., Han, Y., and He, Q. Y. (2012). clusterProfiler: an R package for comparing biological themes among gene clusters. OMICS 16, 284–287. doi:10.1089/omi.2011.0118
Zhang, J., Luo, Y., Wang, X., Zhu, J., Li, Q., Feng, J., et al. (2019). Global transcriptional regulation of STAT3-and MYC-mediated sepsis-induced ARDS. Ther. Adv. Respir. Dis. 13, 1753466619879840. doi:10.1177/1753466619879840
Zhang, Q., Liu, W., Zhang, H. M., Xie, G. Y., Miao, Y. R., Xia, M., et al. (2020). hTFtarget: A comprehensive database for regulations of human transcription factors and their targets. Genomics Proteomics Bioinforma. 18, 120–128. doi:10.1016/j.gpb.2019.09.006
Zhang, L., Kuca, K., You, L., Zhao, Y., Musilek, K., Nepovimova, E., et al. (2022). Signal transducer and activator of transcription 3 signaling in tumor immune evasion. Pharmacol. Ther. 230, 107969. doi:10.1016/j.pharmthera.2021.107969
Zhang, L., Wan, H., Zhang, M., Lu, W., Xu, F., and Dong, H. (2023). Estrogen receptor subtype mediated anti-inflammation and vasorelaxation via genomic and nongenomic actions in septic mice. Front. Endocrinol. (Lausanne) 14, 1152634. doi:10.3389/fendo.2023.1152634
Zheng, Y., Liu, B., Deng, X., Chen, Y., Huang, Y., Zhang, Y., et al. (2022). Construction and validation of a robust prognostic model based on immune features in sepsis. Front. Immunol. 13, 994295. doi:10.3389/fimmu.2022.994295
Zheng, J., Bu, X., Wei, X., Ma, X., and Zhao, P. (2023). The role of FoxM1 in immune cells. Clin. Exp. Med. doi:10.1007/s10238-023-01037-w
Keywords: diagnosis of septic shock, hypoxia, lactate metabolism-related genes, immune infiltration, inflammation response
Citation: Jiang H, Ren Y, Yu J, Hu S and Zhang J (2023) Analysis of lactate metabolism-related genes and their association with immune infiltration in septic shock via bioinformatics method. Front. Genet. 14:1223243. doi: 10.3389/fgene.2023.1223243
Received: 15 May 2023; Accepted: 17 July 2023;
Published: 26 July 2023.
Edited by:
Chitrangda Srivastava, National Institute of Environmental Health Sciences (NIH), United StatesReviewed by:
Georgia Damoraki, National and Kapodistrian University of Athens, GreeceCopyright © 2023 Jiang, Ren, Yu, Hu and Zhang. This is an open-access article distributed under the terms of the Creative Commons Attribution License (CC BY). The use, distribution or reproduction in other forums is permitted, provided the original author(s) and the copyright owner(s) are credited and that the original publication in this journal is cited, in accordance with accepted academic practice. No use, distribution or reproduction is permitted which does not comply with these terms.
*Correspondence: Jihui Zhang, emhhbmdqaWh1aTc3QDE2My5jb20=
Disclaimer: All claims expressed in this article are solely those of the authors and do not necessarily represent those of their affiliated organizations, or those of the publisher, the editors and the reviewers. Any product that may be evaluated in this article or claim that may be made by its manufacturer is not guaranteed or endorsed by the publisher.
Research integrity at Frontiers
Learn more about the work of our research integrity team to safeguard the quality of each article we publish.